Chart Color Schemes
This analysis uses ABS Statistical Areas Level 2 (SA2) boundaries, which can materially differ from Suburbs and Localities (SAL) even when sharing similar names.
SA2 boundaries are defined by the Australian Bureau of Statistics and are designed to represent communities for statistical reporting (e.g., census and ERP).
Suburbs and Localities (SAL) represent commonly-used suburb/locality names (postal-style areas) and may use different geographic boundaries. For comprehensive analysis, consider reviewing both boundary types if available.
est. as @ -- *
ABS ERP | -- people | --
2021 Census | -- people
Sales Activity
Curious about local property values? Filter the chart to assess the volume and appreciation (including resales) trends and regional comparisons, or scroll to the map below view this information at an individual property level.
Find a Recent Sale
Sales Detail
Population
An assessment of population growth drivers in Morwell reveals an overall ranking slightly below national averages considering recent, and medium term trends
Morwell's population, as of November 2025, stands at approximately 14,724 people. This figure represents an increase of 292 individuals since the 2021 Census, which recorded a population of 14,432. The change is inferred from ABS data showing an estimated resident population of 14,529 in June 2024 and the addition of 176 validated new addresses post-Census. This results in a population density ratio of 172 persons per square kilometer. Overseas migration was the primary driver of Morwell's population growth during recent periods.
AreaSearch bases its projections on ABS/Geoscience Australia figures released in 2024, with a base year of 2022 for each SA2 area. For areas not covered by this data, AreaSearch uses Victorian Government Regional/LGA projections from 2023, adjusted using weighted aggregation methods to SA2 levels. Age group growth rates are applied across all areas from 2032 to 2041. By 2041, Morwell's population is projected to increase by 2,334 persons, reflecting a total rise of 14.5% over the 17-year period.
Frequently Asked Questions - Population
Development
Residential development activity is lower than average in Morwell according to AreaSearch's national comparison of local real estate markets
Morwell has recorded approximately 46 residential properties granted approval annually over the past five financial years, totalling around 230 homes. As of FY-26, 20 approvals have been recorded so far. On average, about 1.5 new residents arrive per year for each new home built between FY-21 and FY-25, indicating a balance between supply and demand. The average expected construction cost value of new dwellings is $258,000, aligning with broader regional development trends.
In the current financial year, Morwell has recorded approximately $83.5 million in commercial development approvals, reflecting high levels of local commercial activity. Compared to the Rest of Vic., Morwell records around 59% of building activity per person, placing it among the 25th percentile nationally, which results in relatively constrained buyer choice and supports interest in existing homes. Recent construction comprises approximately 86.0% detached houses and 14.0% attached dwellings, preserving the area's low-density nature and attracting space-seeking buyers. The estimated population density is around 635 people per dwelling approval, indicating a quiet, low-activity development environment.
According to AreaSearch quarterly estimates, Morwell is forecasted to gain approximately 2,136 residents by 2041. If current construction levels persist, housing supply may lag behind population growth, potentially intensifying buyer competition and underpinning price growth in the area.
Frequently Asked Questions - Development
Infrastructure
Morwell has moderate levels of nearby infrastructure activity, ranking in the top 50% nationally
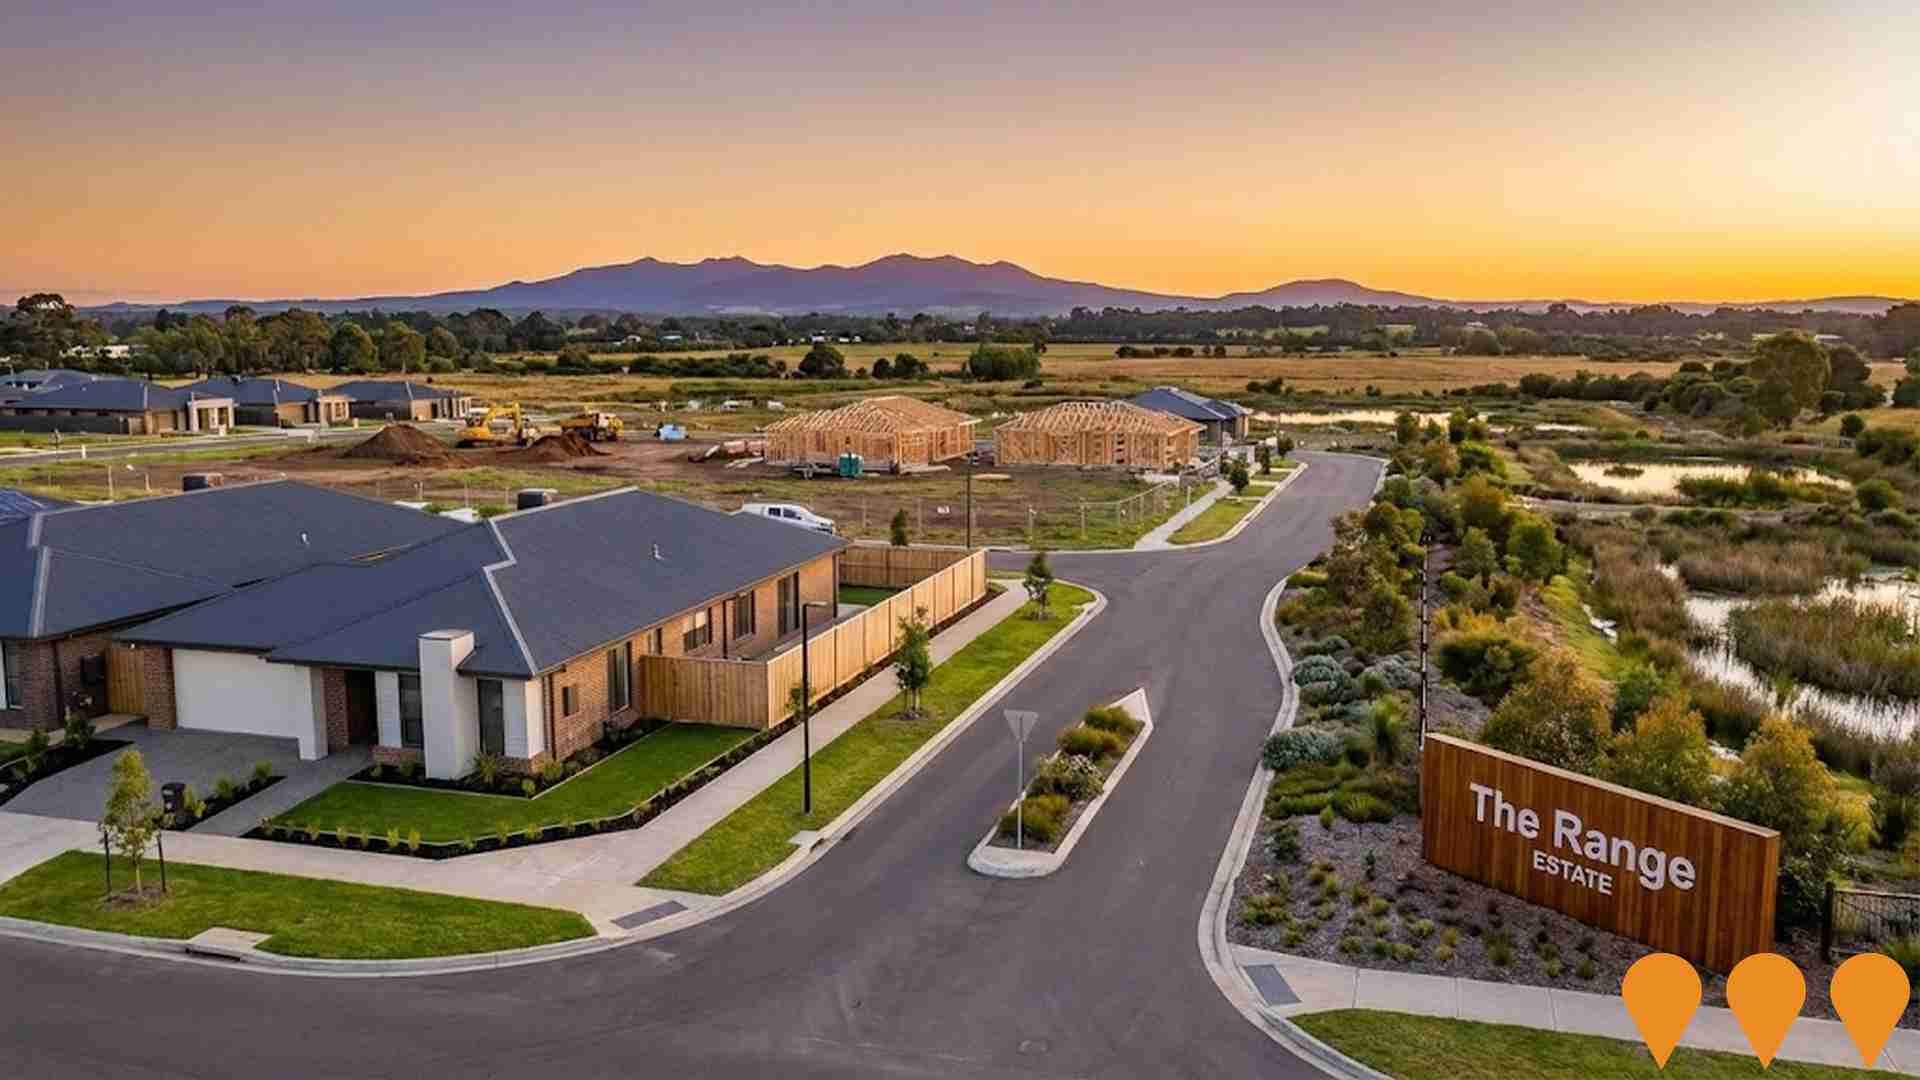
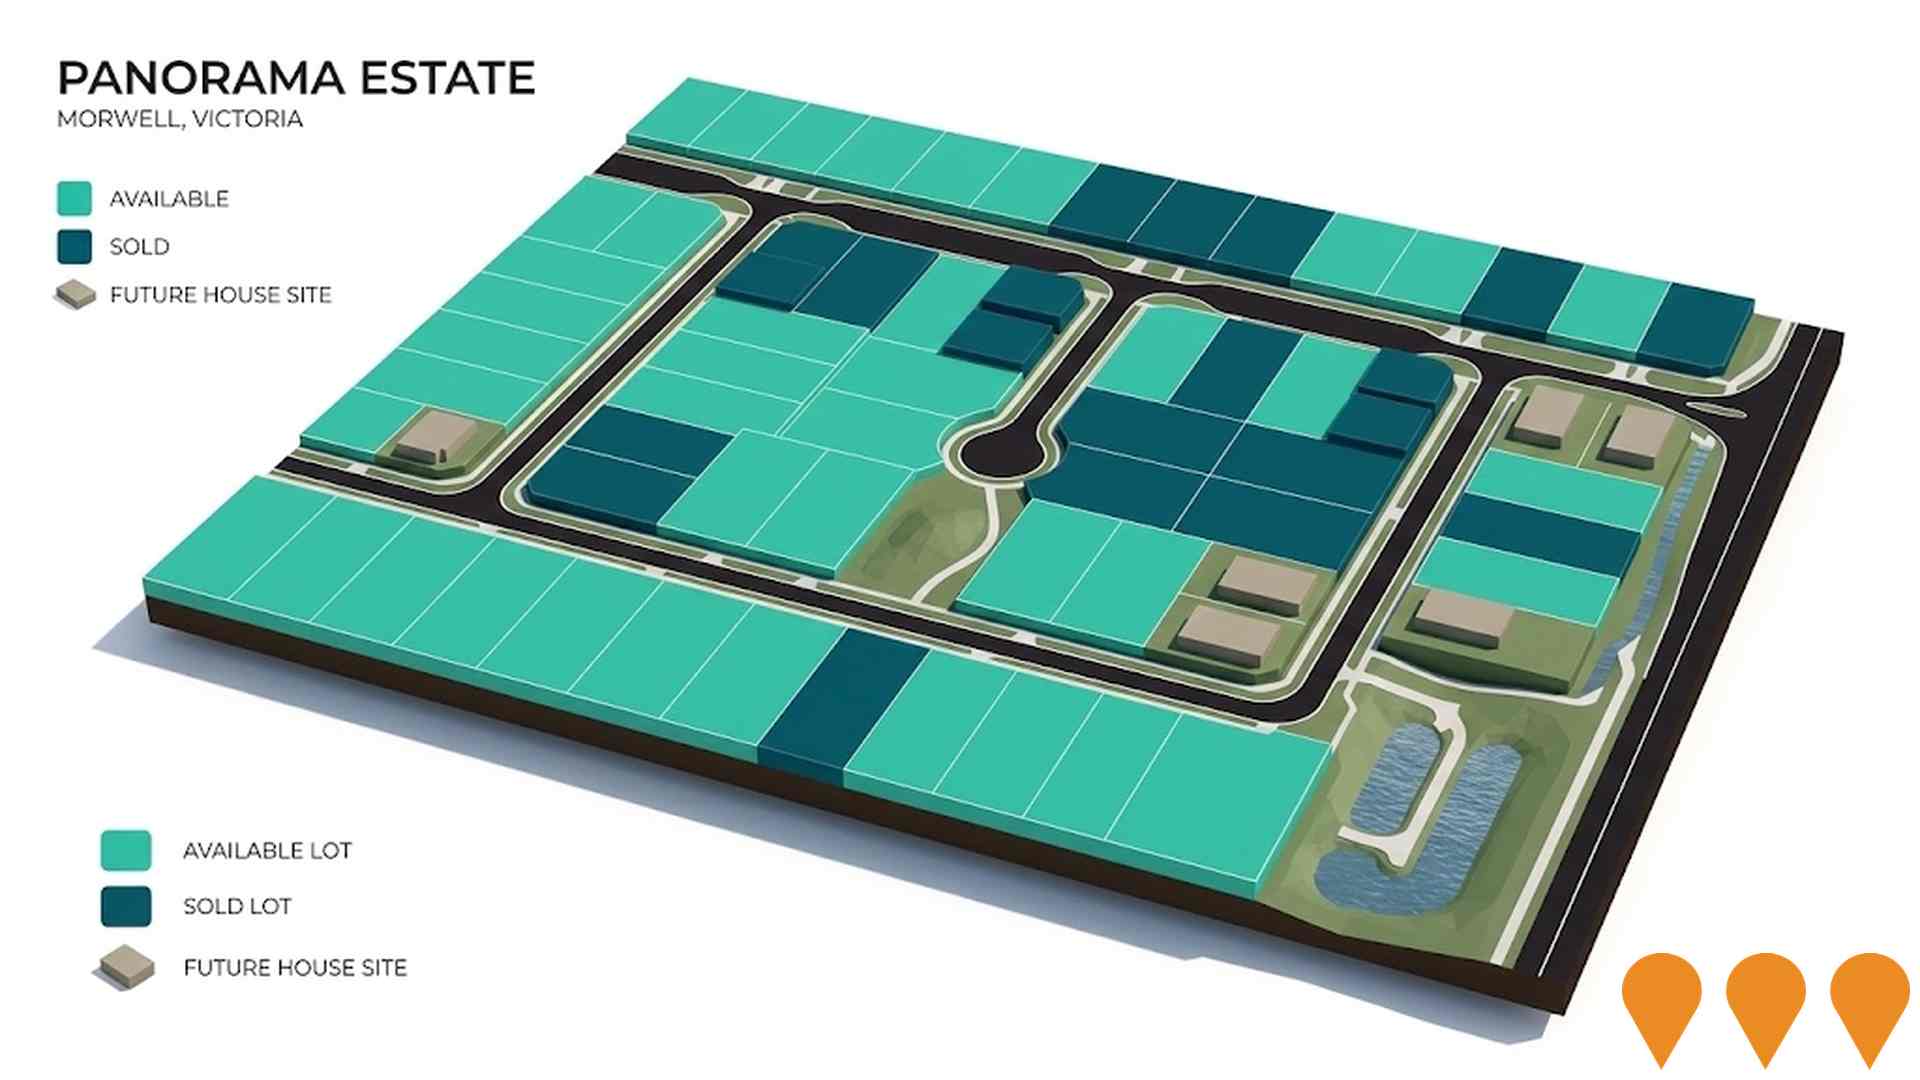
Changes to local infrastructure significantly affect an area's performance. AreaSearch has identified 26 projects that could impact this region. Notable projects include ICON Morwell Innovation Business Park, The Range Estate Morwell, Tramway Road Battery Energy Storage System, and Panorama Estate. Below is a list detailing those most relevant.
Professional plan users can use the search below to filter and access additional projects.
INFRASTRUCTURE SEARCH
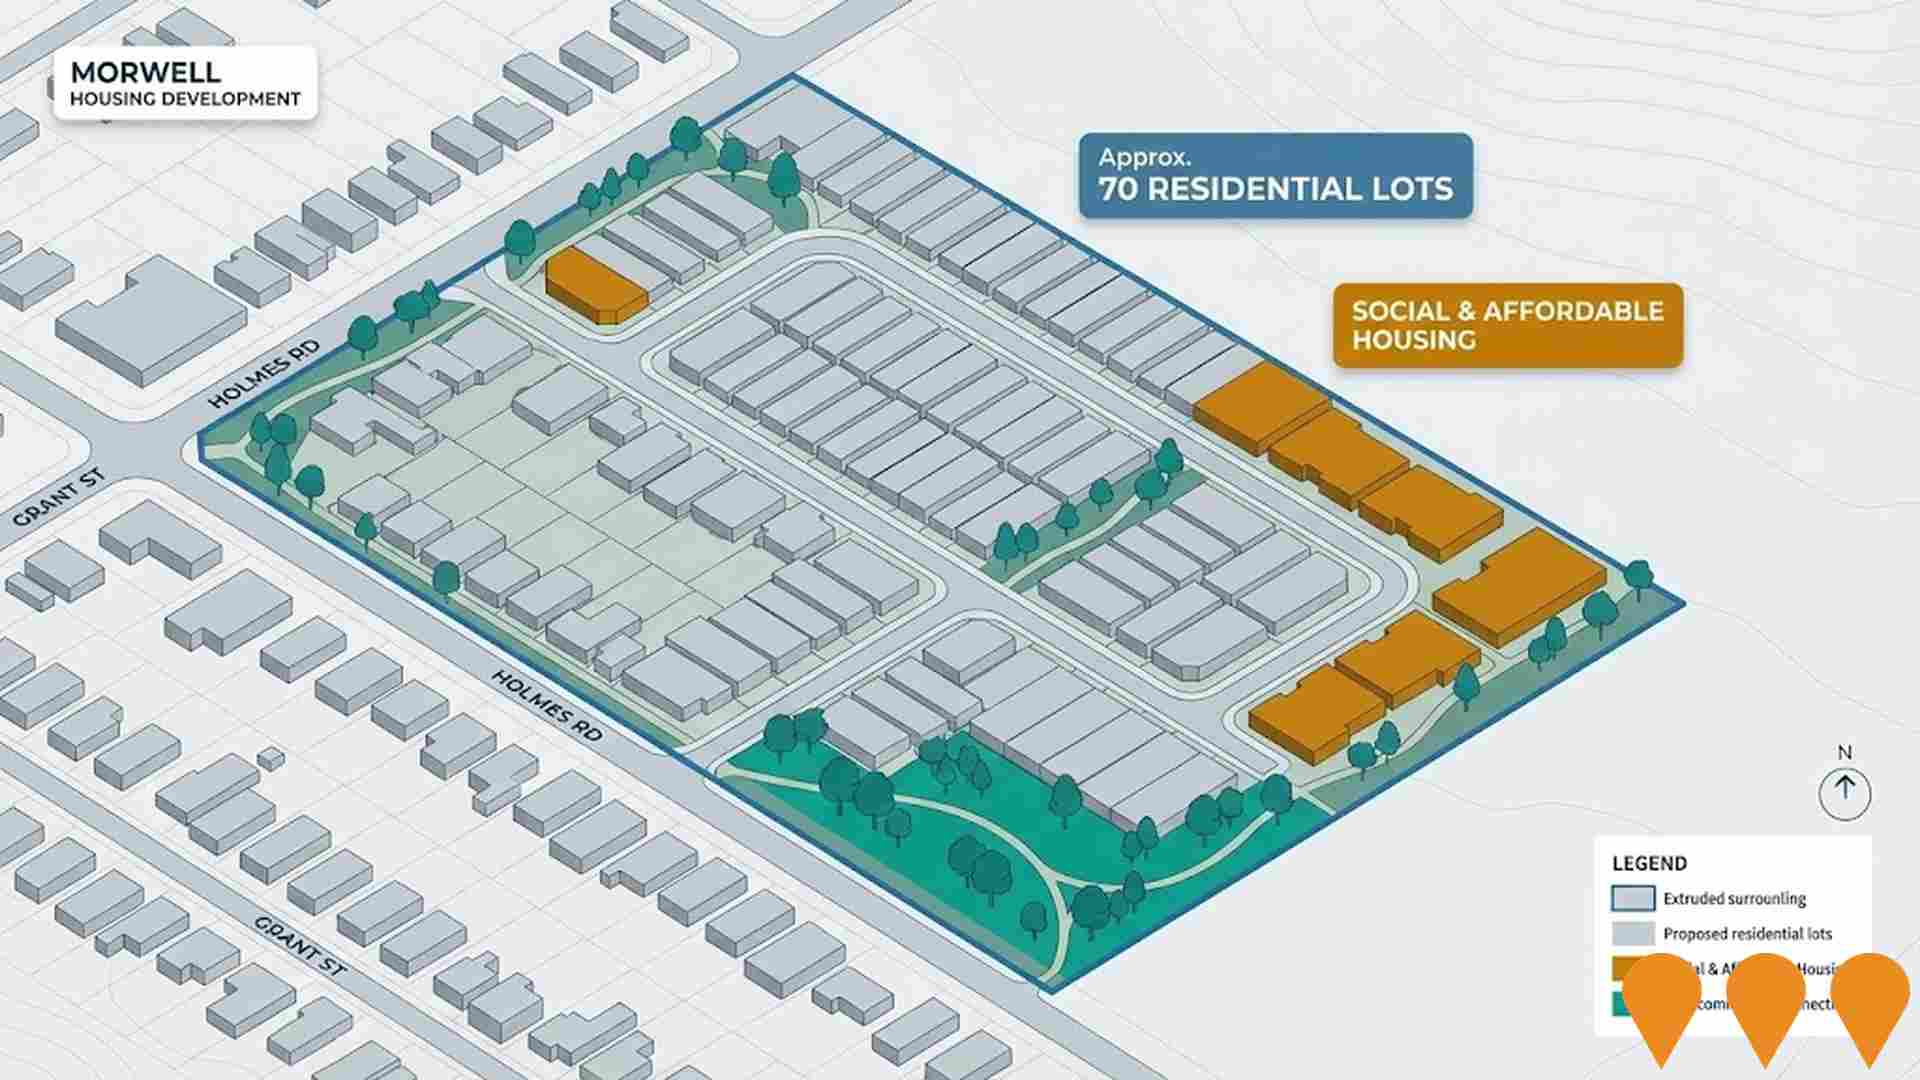
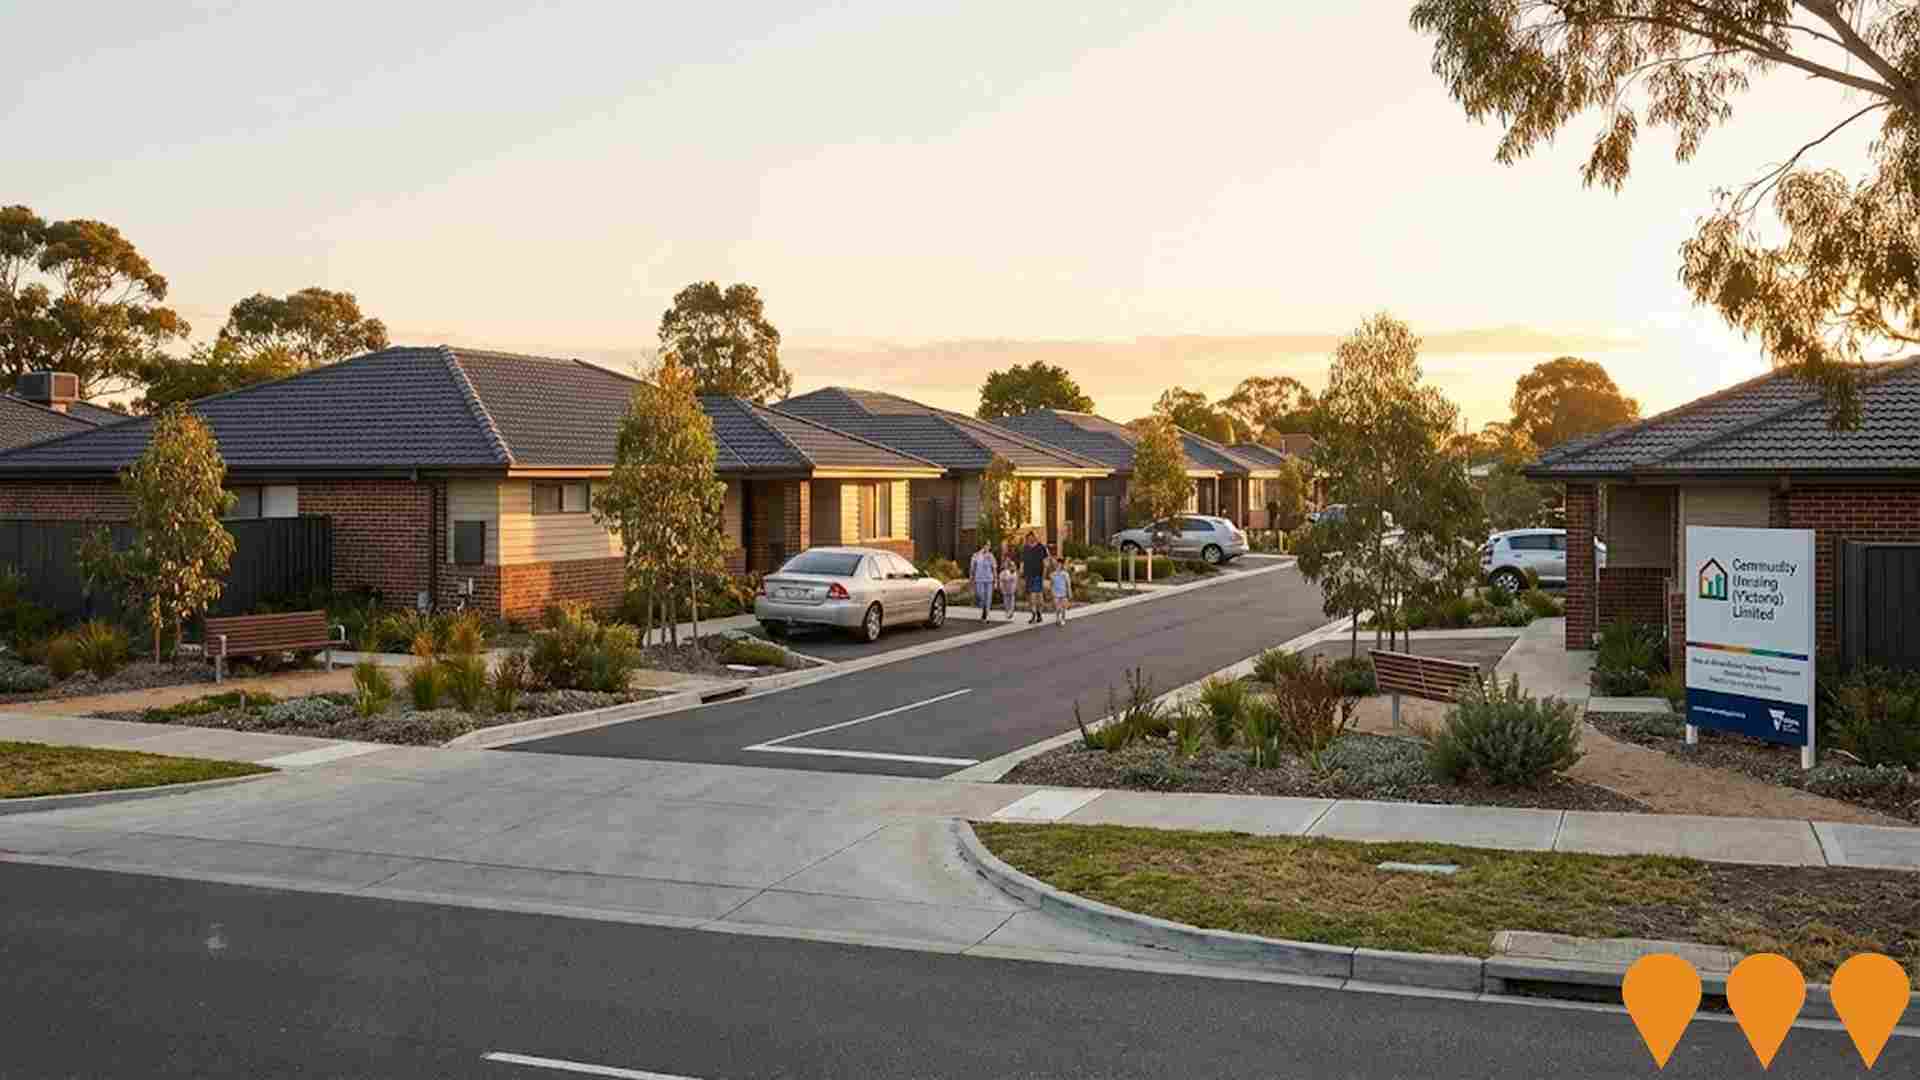
 Denotes AI-based impression for illustrative purposes only, not to be taken as definitive under any circumstances. Please follow links and conduct other investigations from the project's source for actual imagery. Developers and project owners wishing us to use original imagery please Contact Us and we will do so.
Frequently Asked Questions - Infrastructure
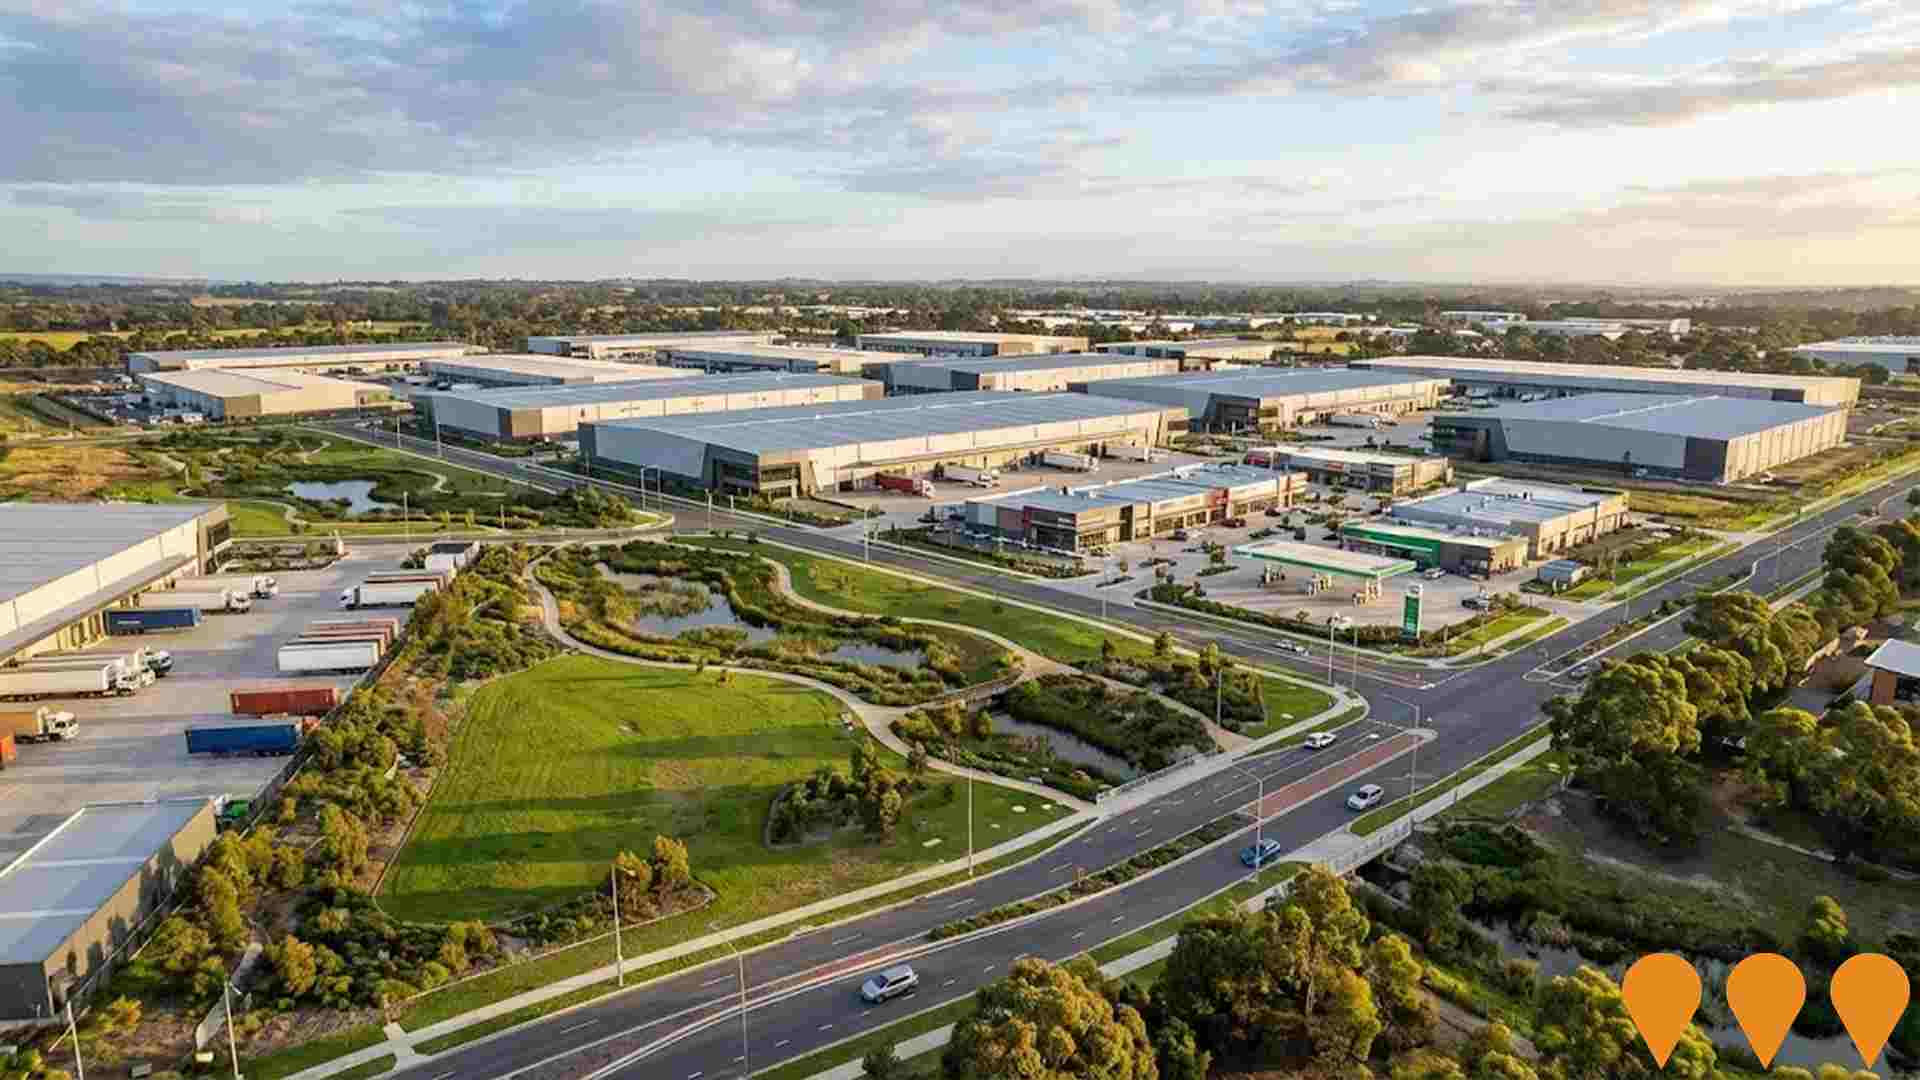
ICON Morwell Innovation Business Park
Gippsland's largest master-planned industrial and commercial estate covering approximately 100 hectares. Delivers 78 hectares of industrial land supporting warehousing, logistics, manufacturing and packaging businesses, plus a 10-hectare mixed-use commercial/retail precinct, service station with international food offering, and 12 hectares of parklands and wetlands. Developed by Homeington Building Group in stages, with multiple stages currently under civil construction and titles progressively being released.
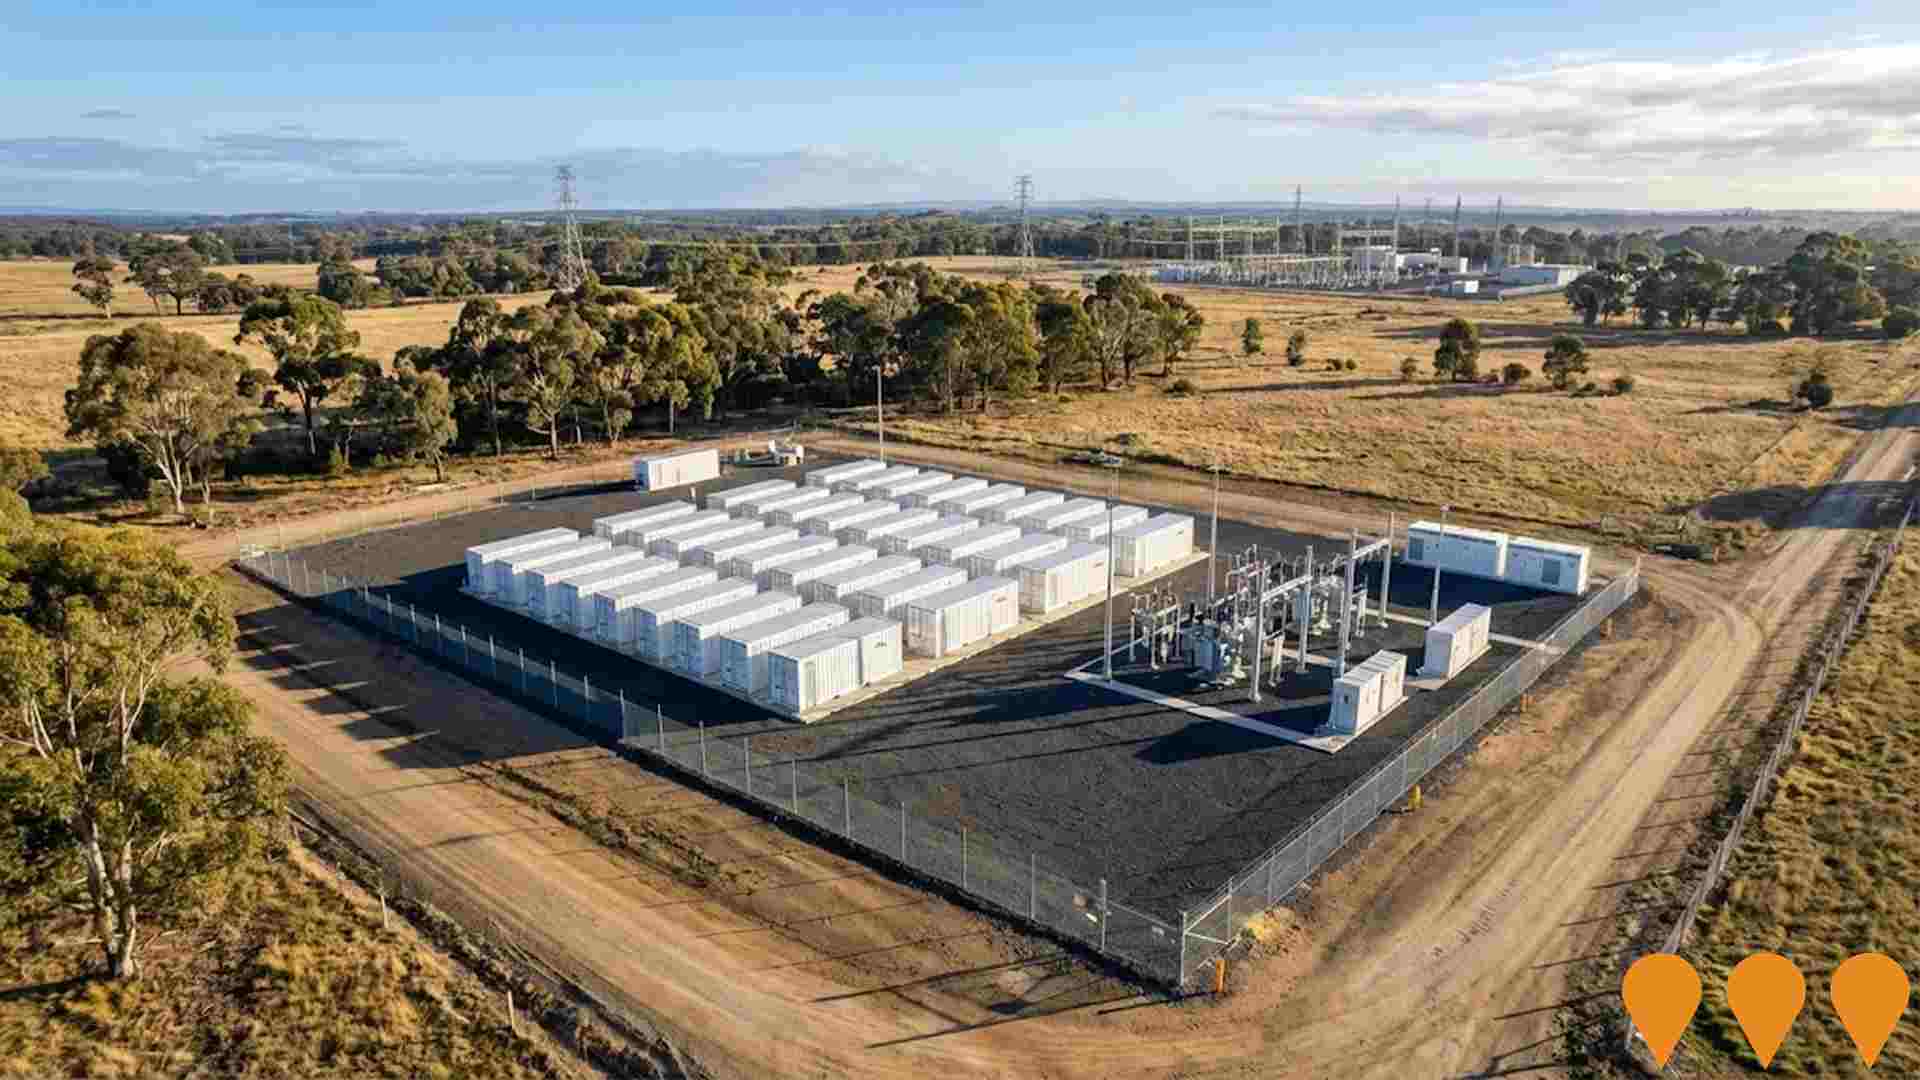
Tramway Road Battery Energy Storage System
300 MW / 1200 MWh grid-scale Battery Energy Storage System (BESS) developed by Eku Energy adjacent to the Hazelwood Terminal Station in Gippsland, Victoria. The project uses LFP battery technology and will support Victoria's renewable energy integration and grid stability. Approved in November 2025 through the Development Facilitation Program. Construction expected to create approximately 150 jobs, with 5-10 ongoing roles. Commercial operations targeted for 2028 subject to final grid connection approval.
ULAB Lead Acid Battery Recycling Facility
Australia's first advanced used lead-acid battery (ULAB) recycling facility, capable of processing 50,000 tonnes of spent batteries annually and producing 28,000 tonnes of refined lead. The project supports circular economy outcomes by recovering lead for reuse in new batteries and safely managing hazardous waste.

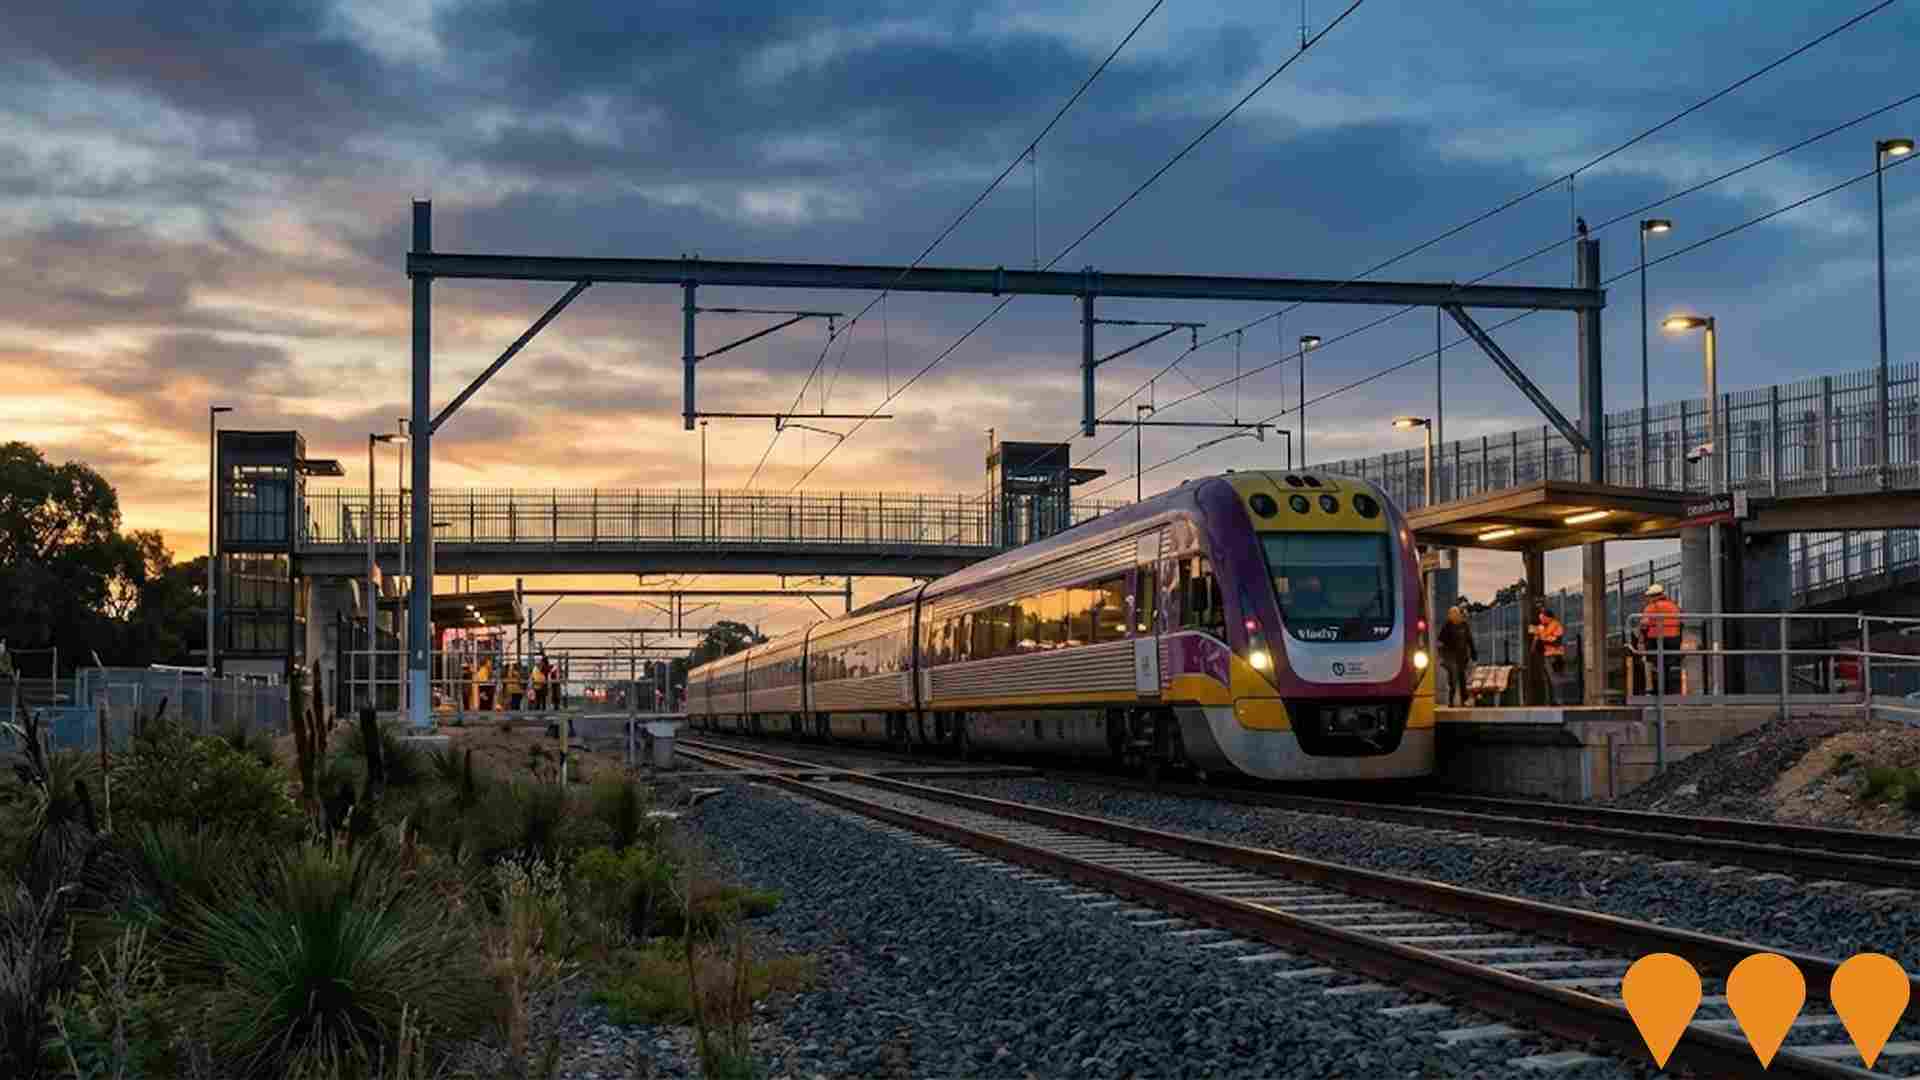
Gippsland Line Upgrade
The Gippsland Line Upgrade, now complete as of mid-2025, has delivered more frequent and reliable train services to the growing communities of Gippsland. Key features include station upgrades at Bunyip, Longwarry, Morwell, and Traralgon (including new second platforms and accessibility improvements), a new bridge over the Avon River at Stratford, new signalling and train control systems, track duplication, and the extension of VLocity trains to Bairnsdale. From September 2025, over 80 additional weekly services were introduced, enabling trains approximately every 40 minutes between Melbourne and Traralgon for much of the day, 7 days a week. The project created over 500 jobs during construction.
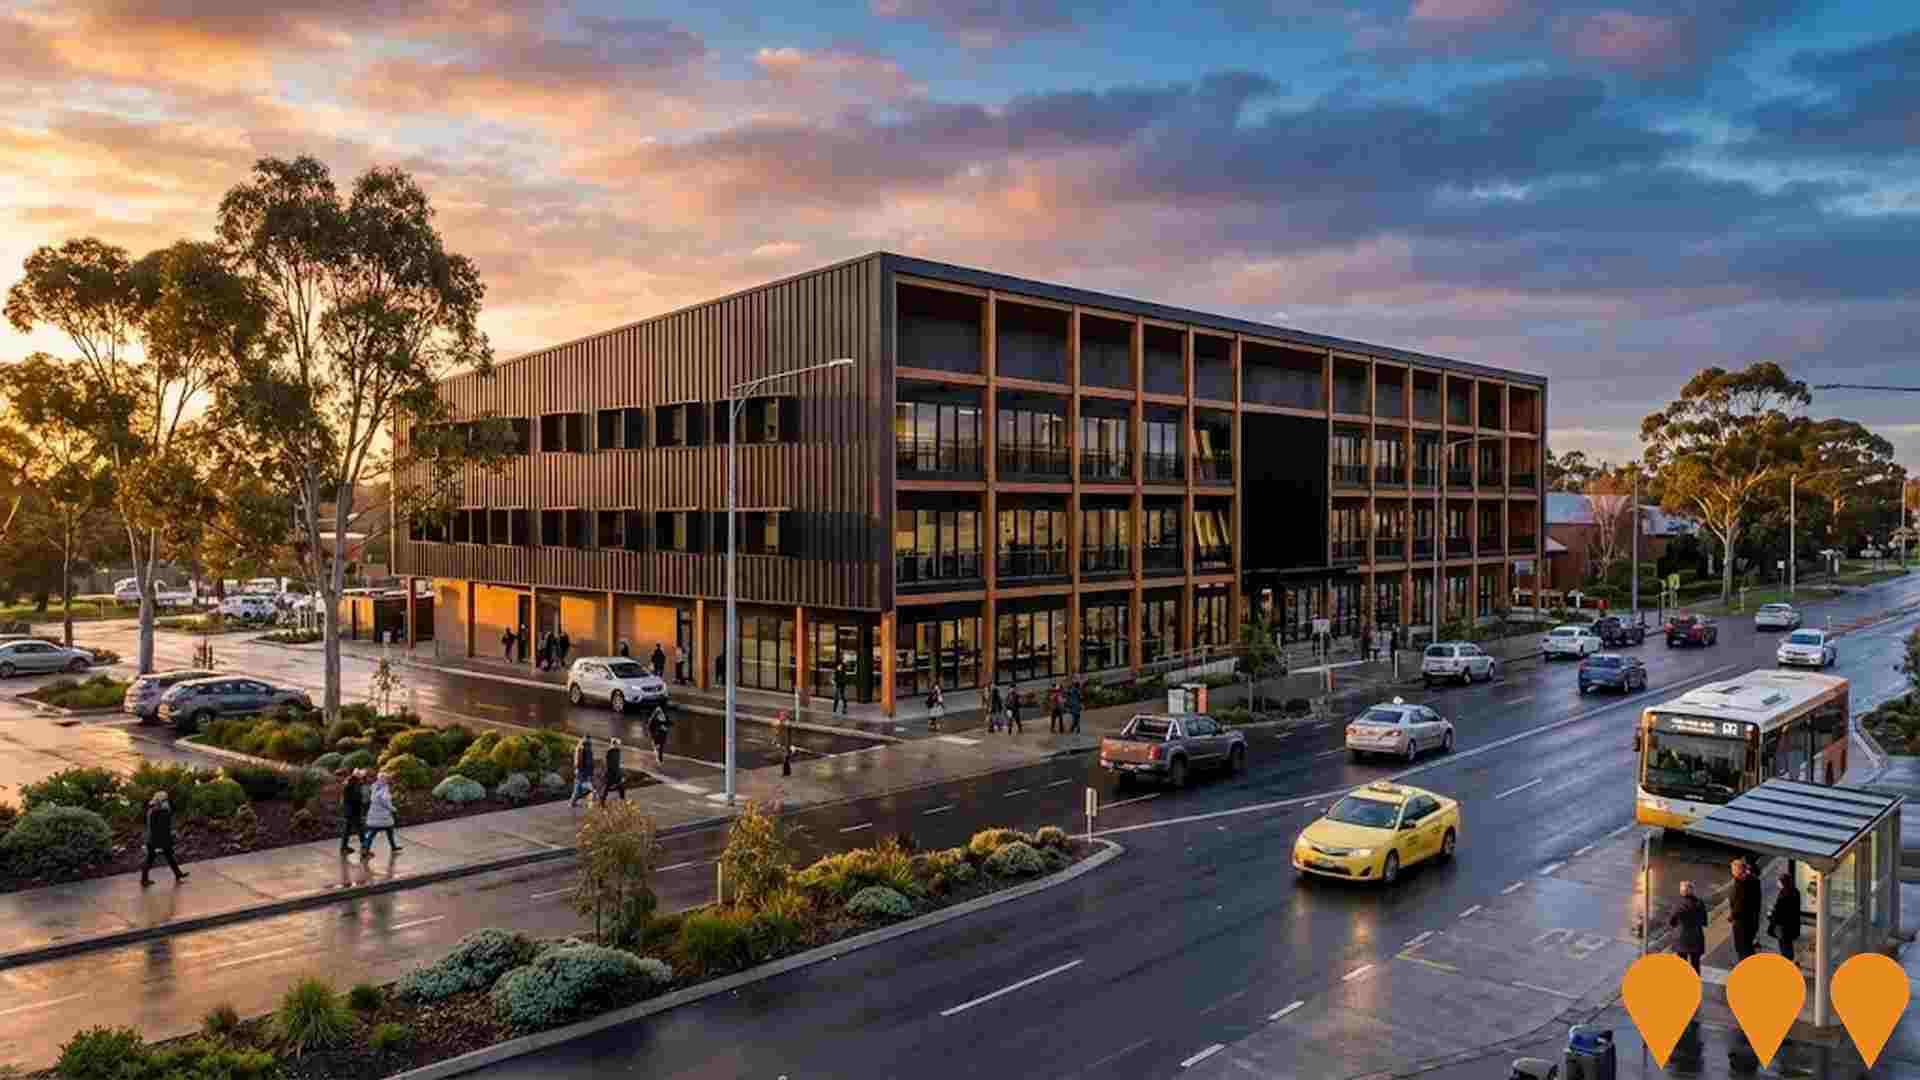
Latrobe Valley GovHub
Three-storey regional employment hub developed by Castlerock Property, accommodating up to 300 government workers including Parks Victoria, Solar Victoria and Earth Resources Regulation. Features community spaces, business incubators, exhibition areas, and locally-run cafe. $30 million investment bringing 200 new public sector jobs to the region.
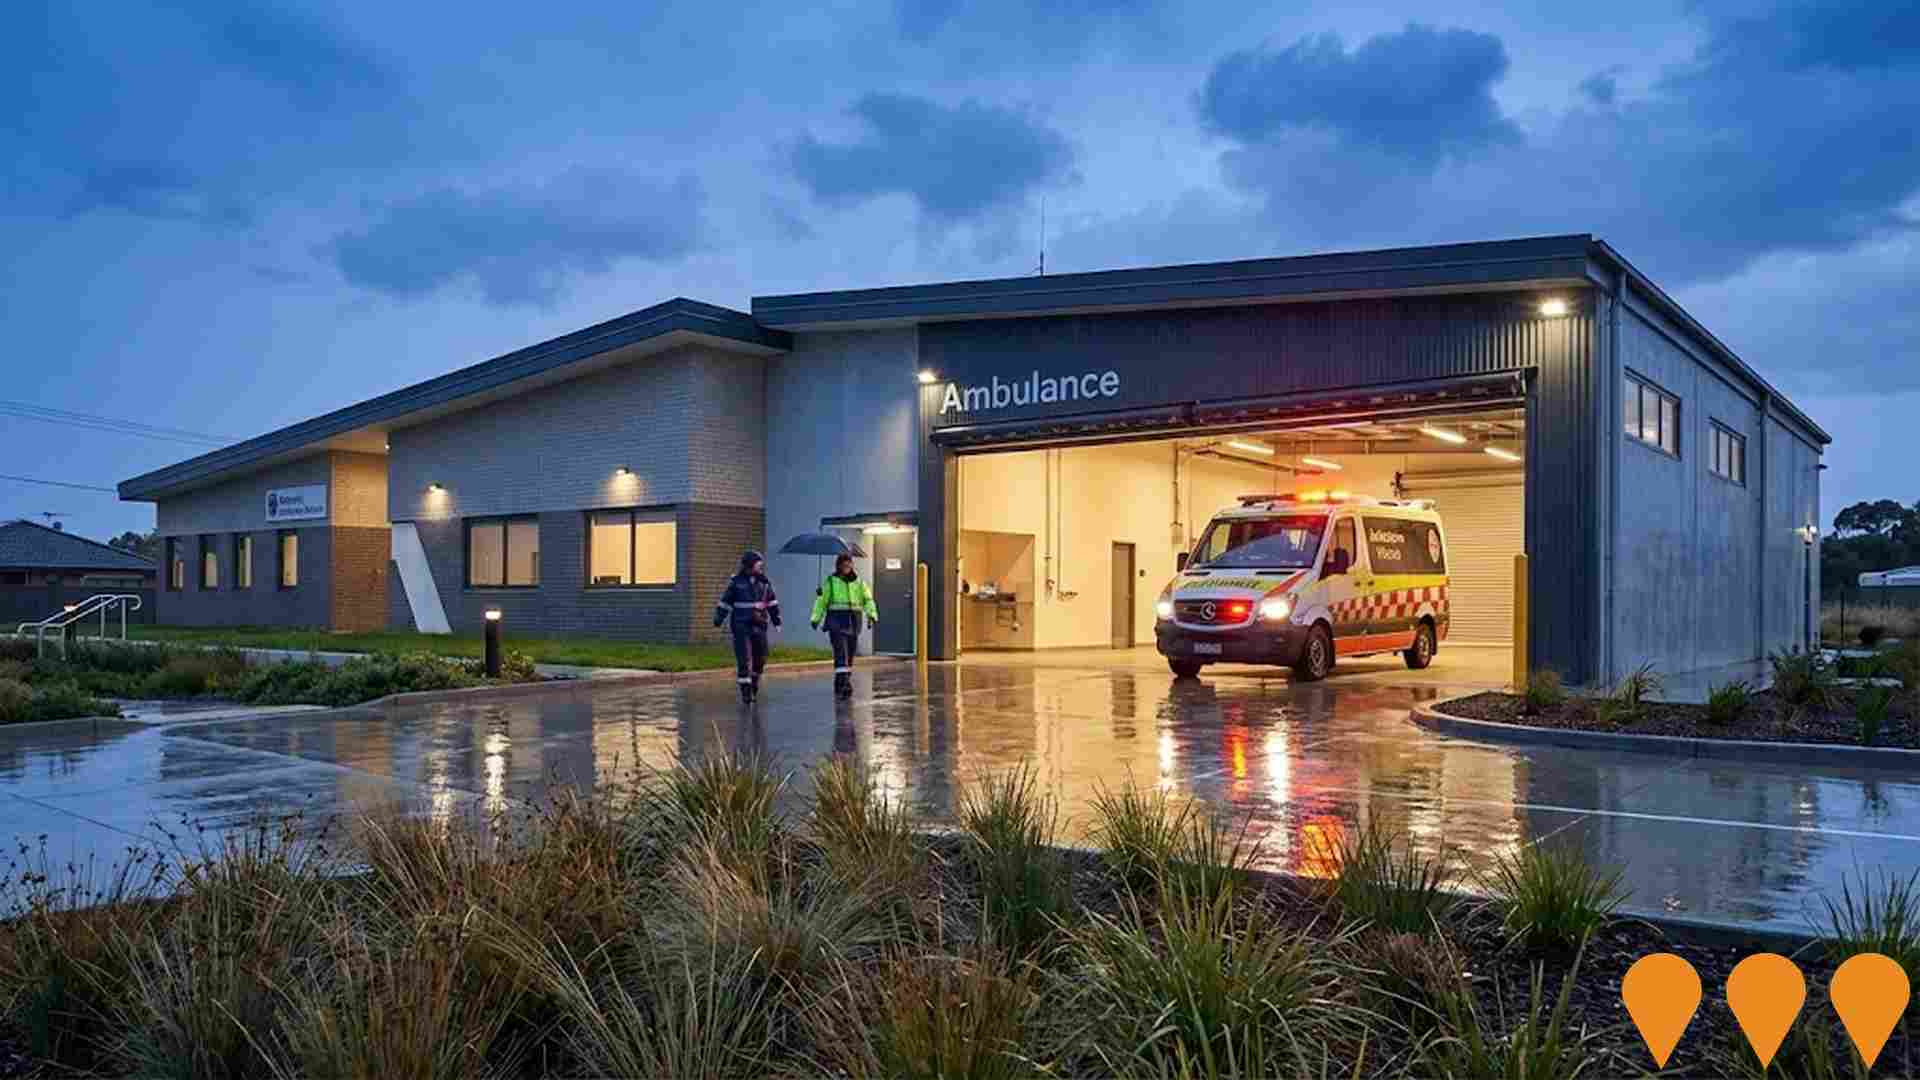
Morwell Ambulance Branch
State-of-the-art ambulance branch serving the busiest Ambulance Victoria branch in the Gippsland region. Features nine-bay garage for ambulances, eight rest and recline areas, training facilities, fully equipped kitchen, improved security and car parking. The facility spans over 1500 sqm with precast concrete panels, structural steel and brickwork construction. Built to accommodate up to 20 Ambulance Victoria staff per shift and serves the central Gippsland communities.
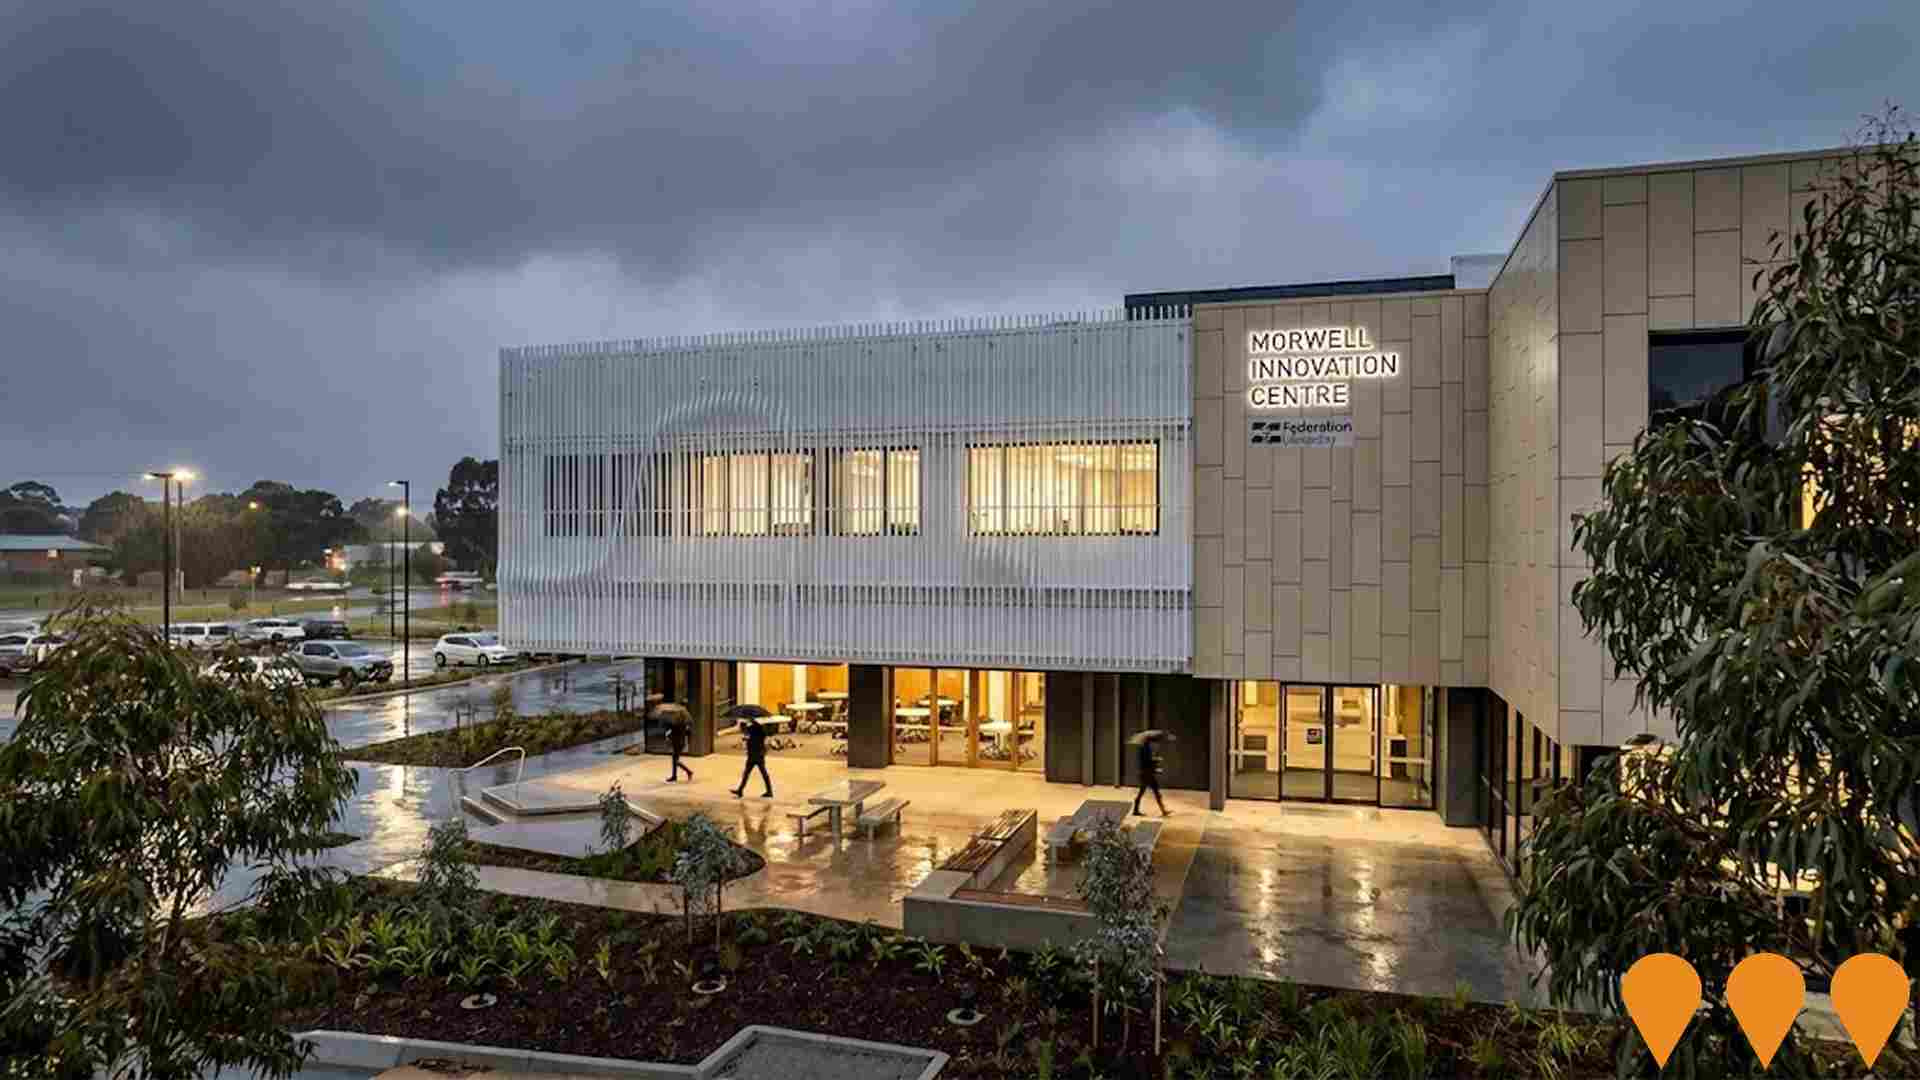
Morwell Innovation Centre - Hi-Tech Precinct
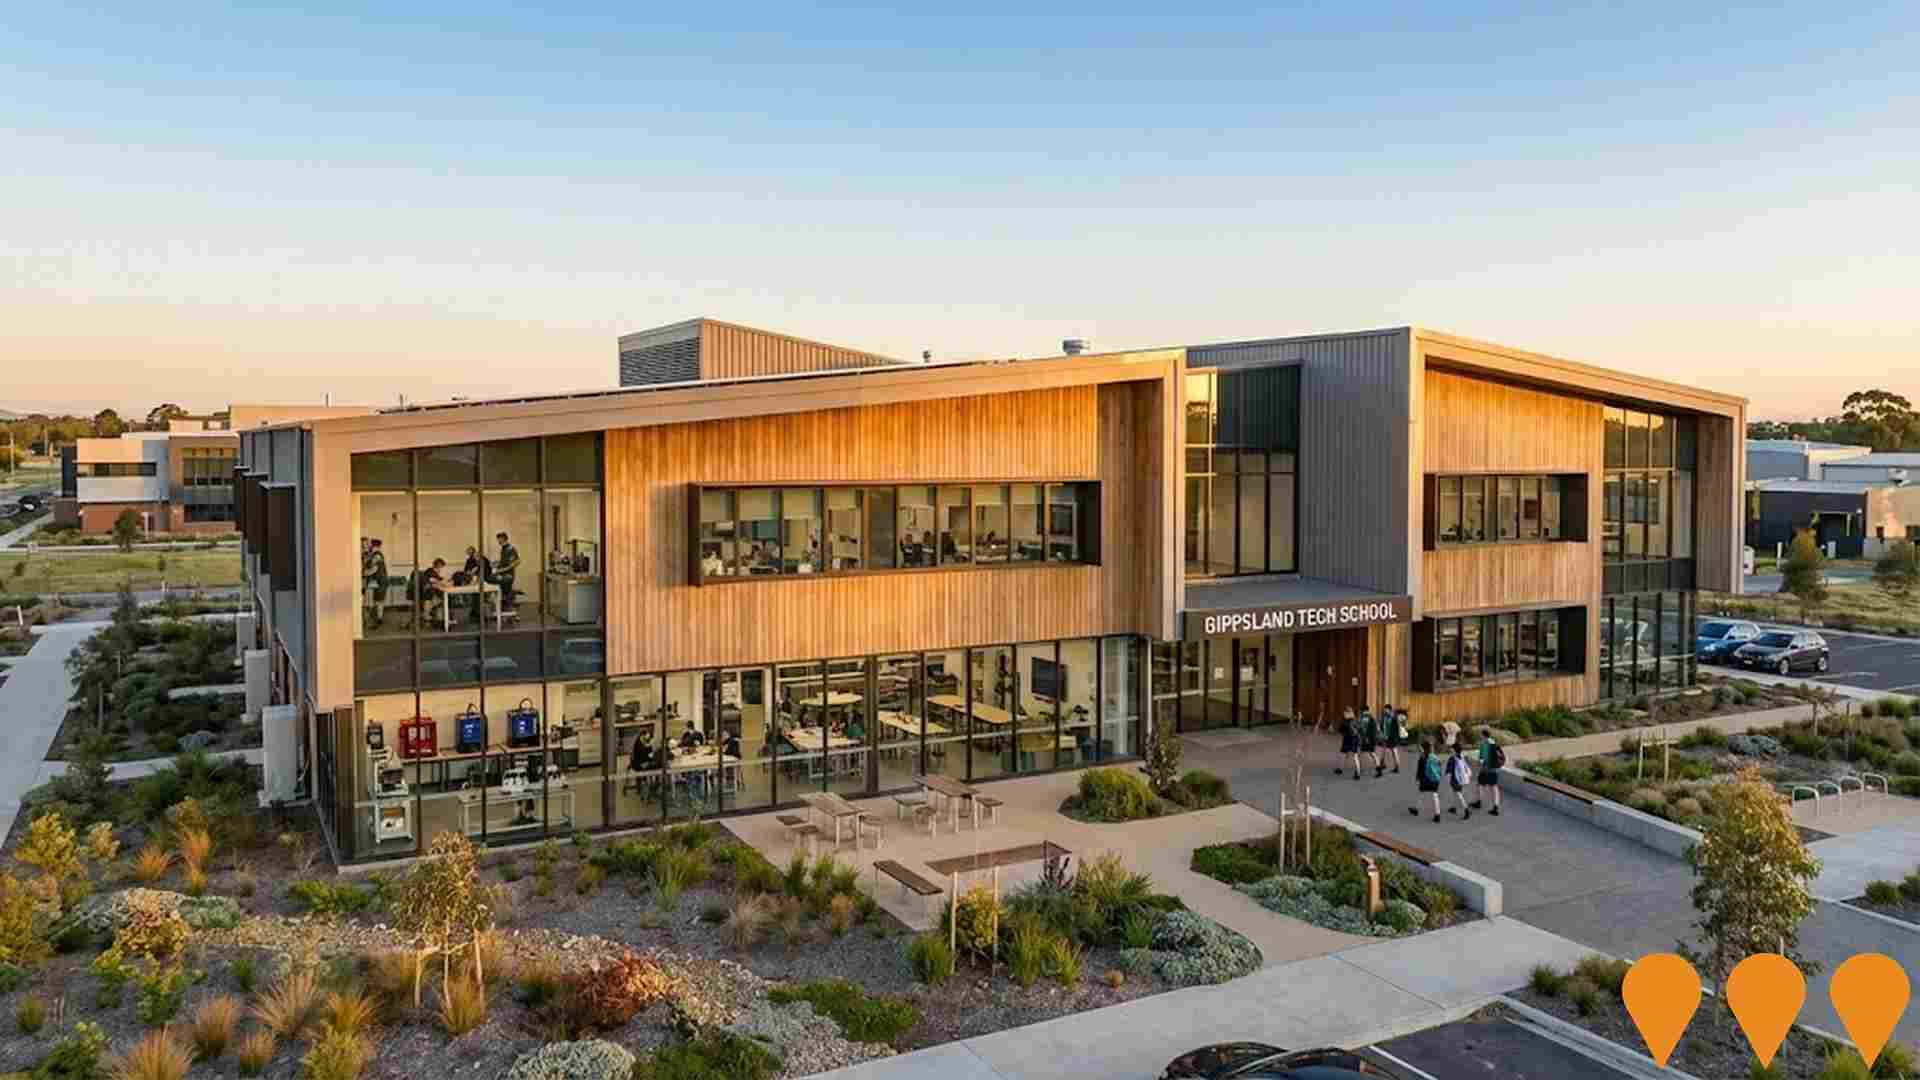
A $17 million innovation centre forming part of Hi-Tech Precinct Gippsland. Features research facilities, business incubation, product development, and startup support. Co-located with Gippsland Tech School creating educational and industry links.
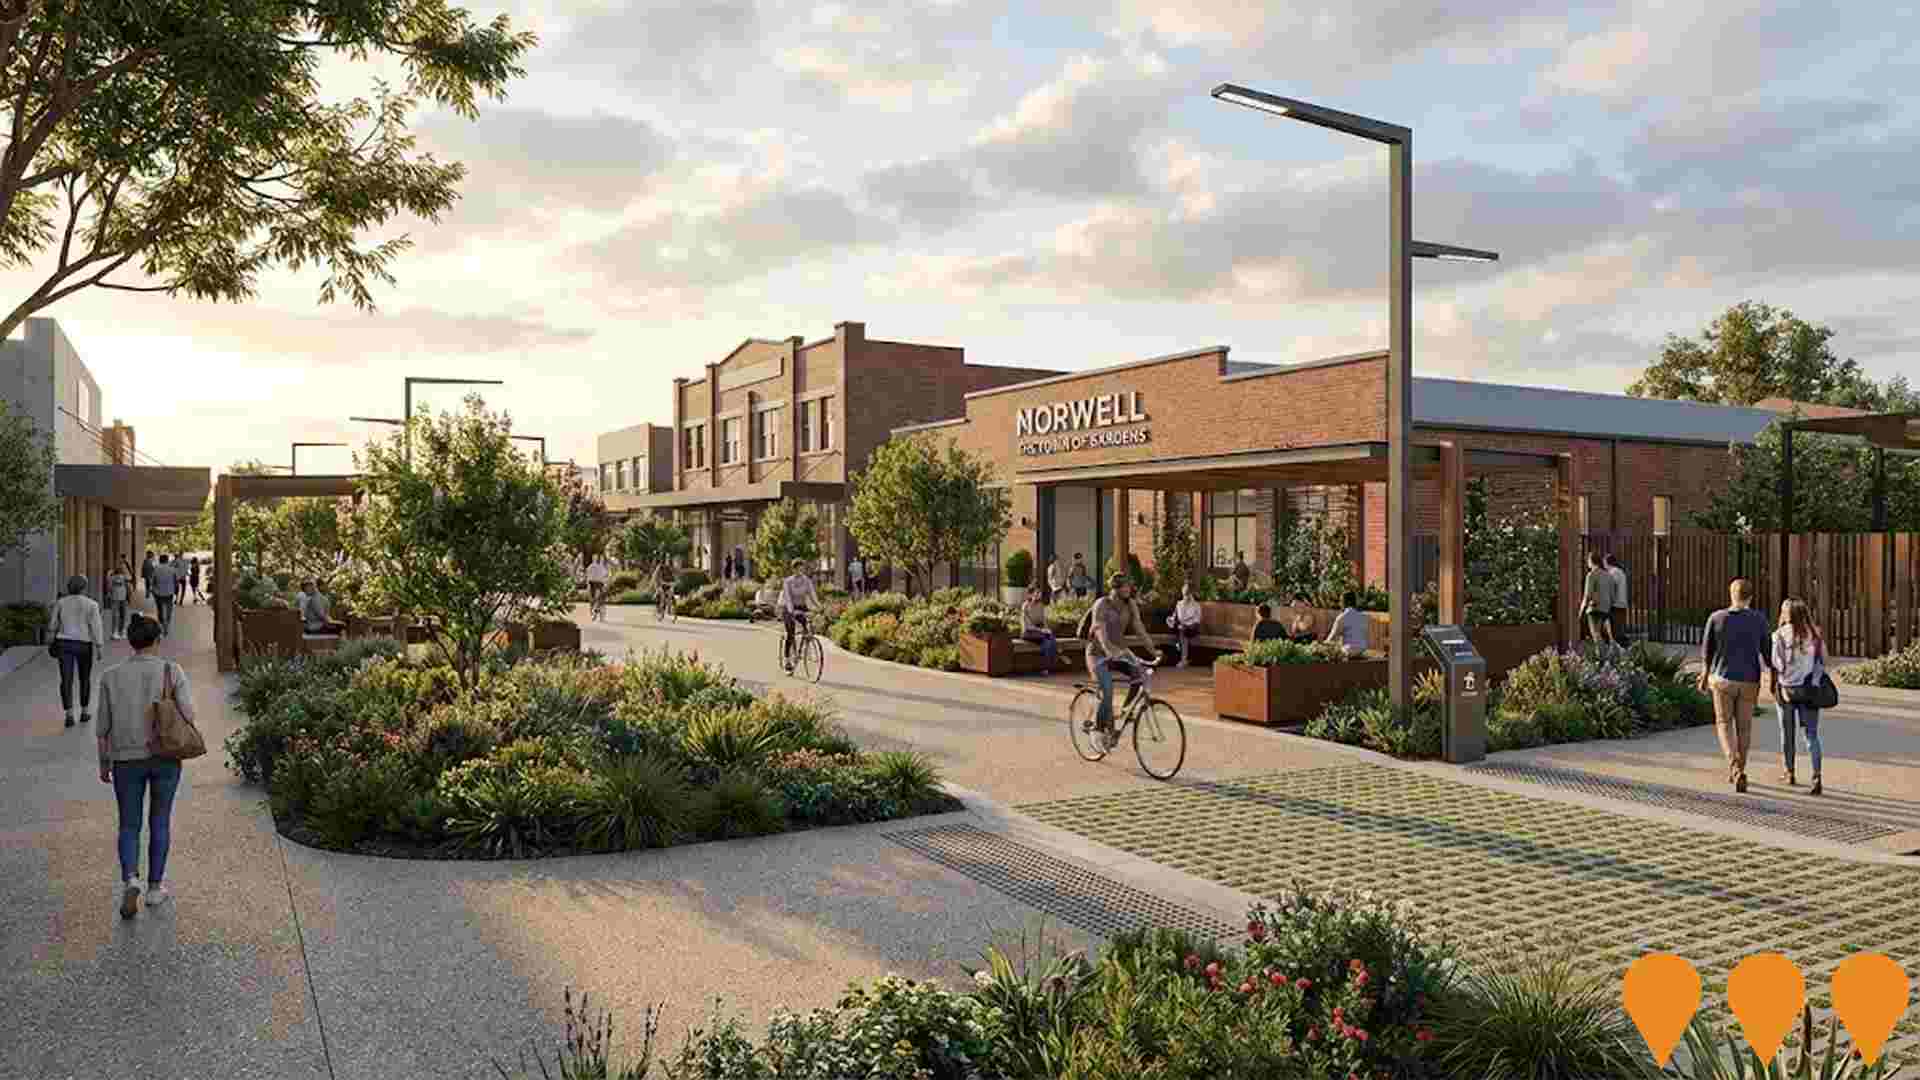
Future Morwell Revitalisation Circuit
The Future Morwell Revitalisation Circuit is part of the broader Future Morwell project aimed at revitalizing Morwell's town center. It includes the development of shared pathways, street improvements, gardens, and pedestrian-friendly spaces to enhance community connection, support commerce, and improve walkability and cycling. The project embraces Morwell's industrial legacy and promotes it as 'Morwell the Town of Gardens'. Key features include the Morwell Circuit shared pathways, parklets, community gathering spaces, feature gardens, and modern amenities like LED lighting and pedestrian counters.
Employment
AreaSearch assessment indicates Morwell faces employment challenges relative to the majority of Australian markets
Morwell's workforce comprises white and blue-collar jobs with prominent essential services sectors. The unemployment rate was 13.5% as of September 2025.
Employment growth over the past year was estimated at 6.2%. There are 5,264 residents employed currently, with an unemployment rate of 9.7%, which is higher than Rest of Vic.'s rate of 3.8%. Workforce participation in Morwell lags behind Rest of Vic., at 44.4% compared to 57.4%. Key industries employing residents are health care & social assistance, retail trade, and accommodation & food.
Retail trade is particularly specialized, with an employment share 1.3 times the regional level. Agriculture, forestry & fishing is under-represented, at 2.4% of Morwell's workforce compared to 7.5% in Rest of Vic.. The worker-to-resident ratio is 0.7, indicating above-normal local employment opportunities. Between September 2024 and 2025, employment levels increased by 6.2%, while the labour force grew by 3.8%, leading to a 2.0 percentage point reduction in unemployment rate. In contrast, Rest of Vic. saw employment decline by 0.7% and labour force decline by 0.6%, with marginal unemployment increase. State-level data from 25-Nov-25 shows VIC employment grew by 1.13% year-on-year, adding 41,950 jobs, with a state unemployment rate of 4.7% compared to the national rate of 4.3%. National employment forecasts from May-25 project growth of 6.6% over five years and 13.7% over ten years. Applying these projections to Morwell's employment mix suggests local employment should increase by 6.2% over five years and 13.2% over ten years, assuming constant population projections for illustrative purposes.
Frequently Asked Questions - Employment
Income
Income metrics place the area in the bottom 10% of locations nationally according to AreaSearch analysis
The median income among taxpayers in Morwell SA2 was $44,406 and the average income stood at $55,209 according to ATO data aggregated by AreaSearch for financial year 2022. These figures compare to Rest of Vic.'s median income of $48,741 and average income of $60,693 respectively. By September 2025, estimates suggest Morwell's median income will be approximately $49,806 and the average income will be around $61,922 based on Wage Price Index growth of 12.16% since financial year 2022. The 2021 Census revealed that household, family and personal incomes in Morwell all fell between the 2nd and 5th percentiles nationally. In terms of income distribution, 31.6% of Morwell's community earned between $400 and $799 weekly (4,652 individuals), unlike the broader area where 30.3% earn within the $1,500 to $2,999 range. With 43.0% earning under $800 per week, Morwell faces significant income constraints influencing local spending patterns. After housing expenses, only 14.1% of income remains in Morwell, ranking at just the 4th percentile nationally.
Frequently Asked Questions - Income
Housing
Morwell is characterized by a predominantly suburban housing profile, with a higher proportion of rental properties than the broader region
The latest Census data shows that in Morwell, 86.0% of dwellings were houses with the remaining 14.0% being semi-detached homes, apartments, or other types. In comparison, Non-Metro Vic had 88.1% houses and 11.9% other dwellings. Home ownership in Morwell was at 38.7%, similar to Non-Metro Vic's rate. Mortgaged dwellings made up 26.2% while rented properties accounted for 35.0%. The median monthly mortgage repayment in Morwell was $953, lower than Non-Metro Vic's average of $1,213 and significantly below the national average of $1,863. The median weekly rent in Morwell was $215 compared to Non-Metro Vic's $237 and the national figure of $375.
Frequently Asked Questions - Housing
Household Composition
Morwell features high concentrations of lone person households, with a lower-than-average median household size
Family households account for 59.2% of all households, including 18.6% couples with children, 24.2% couples without children, and 15.1% single parent families. Non-family households make up the remaining 40.8%, with lone person households at 37.7% and group households comprising 3.2%. The median household size is 2.2 people, which is smaller than the Rest of Vic average of 2.3.
Frequently Asked Questions - Households
Local Schools & Education
Morwell faces educational challenges, with performance metrics placing it in the bottom quartile of areas assessed nationally
The area's university qualification rate is 11.0%, significantly lower than Victoria's average of 33.4%. Bachelor degrees are the most common at 7.7%, followed by postgraduate qualifications (1.8%) and graduate diplomas (1.5%). Vocational credentials are prevalent, with 41.2% of residents aged 15+ holding them, including advanced diplomas (8.4%) and certificates (32.8%). Educational participation is high, with 29.5% of residents currently enrolled in formal education, including primary (11.1%), secondary (8.2%), and tertiary education (3.0%).
Educational participation is notably high, with 29.5% of residents currently enrolled in formal education. This includes 11.1% in primary education, 8.2% in secondary education, and 3.0% pursuing tertiary education.
Frequently Asked Questions - Education
Schools Detail
Nearby Services & Amenities
Transport
Transport servicing is moderate compared to other areas nationally based on assessment of service frequency, route connectivity and accessibility
Morwell has 107 active public transport stops. These include a mix of train and bus services. There are 19 different routes operating in total.
Each week, these routes provide 2,111 passenger trips combined. The average distance residents live from the nearest stop is 202 meters. On average, there are 301 transport trips daily across all routes, which equates to about 19 weekly trips per individual stop.
Frequently Asked Questions - Transport
Transport Stops Detail
Health
Health performance in Morwell is a key challenge with a range of health conditions having marked impacts on both younger and older age cohorts
Morwell faces significant health challenges, affecting both younger and older age groups. Approximately 48% (~7,008 people) have private health cover, lower than the Rest of Vic.'s 50.2%, but higher than the national average of 55.3%. Mental health issues and arthritis are prevalent, impacting 12.2% and 11.3% of residents respectively, while 55.0% report no medical ailments, compared to Rest of Vic.'s 60.1%.
Morwell has a higher proportion of seniors aged 65 and over at 22.6% (3,324 people), compared to Rest of Vic.'s 21.2%. Health outcomes among seniors largely align with the general population's health profile.
Frequently Asked Questions - Health
Cultural Diversity
In terms of cultural diversity, Morwell records figures broadly comparable to the national average, as found in AreaSearch's assessment of a number of language and cultural background related metrics
Morwell's cultural diversity aligns with the broader regional average. 83.3% are citizens, 81.8% were born in Australia, and 88.1% speak English exclusively at home. Christianity is the predominant religion, practiced by 44.4%.
Islam is overrepresented, comprising 2.4%, compared to 0.8% regionally. The top three ancestral groups are English (29.9%), Australian (28.3%), and Scottish (7.6%). Notably, Dutch (2.3%) Maltese (1.9%), and Italian (5.5%) ethnicities have higher representation in Morwell compared to regional averages.
Frequently Asked Questions - Diversity
Age
Morwell's median age exceeds the national pattern
Morwell's median age is 42 years, similar to Rest of Vic.'s average of 43 but older than Australia's 38 years. The age profile shows that 25-34 year-olds are particularly prominent at 13.7%, while the 35-44 group is smaller at 10.8% compared to Rest of Vic.. Between 2021 and the present, the 25-34 age group has grown from 12.3% to 13.7%. Conversely, the 45-54 cohort has declined from 12.2% to 11.0%. By 2041, population forecasts indicate significant demographic changes for Morwell. The 25-34 age group is projected to grow by 47%, adding 948 residents to reach 2,961. Meanwhile, numbers in the 55-64 age range are expected to fall by 18%.
