Chart Color Schemes
This analysis uses ABS Statistical Areas Level 2 (SA2) boundaries, which can materially differ from Suburbs and Localities (SAL) even when sharing similar names.
SA2 boundaries are defined by the Australian Bureau of Statistics and are designed to represent communities for statistical reporting (e.g., census and ERP).
Suburbs and Localities (SAL) represent commonly-used suburb/locality names (postal-style areas) and may use different geographic boundaries. For comprehensive analysis, consider reviewing both boundary types if available.
est. as @ -- *
ABS ERP | -- people | --
2021 Census | -- people
Sales Activity
Curious about local property values? Filter the chart to assess the volume and appreciation (including resales) trends and regional comparisons, or scroll to the map below view this information at an individual property level.
Find a Recent Sale
Sales Detail
Population
An assessment of population growth drivers in Churchill reveals an overall ranking slightly below national averages considering recent, and medium term trends
Churchill's population was around 12,401 as of November 2025. This reflected an increase of 489 people since the 2021 Census, which reported a population of 11,912 people. The change was inferred from the estimated resident population of 12,224 in June 2024 and an additional 153 validated new addresses since the Census date. This level of population resulted in a density ratio of 15.6 persons per square kilometer. Churchill's growth rate of 4.1% since the census positioned it within 1.4 percentage points of the SA3 area's growth rate of 5.5%. Population growth was primarily driven by natural growth, contributing approximately 46.4% of overall population gains during recent periods.
AreaSearch adopted ABS/Geoscience Australia projections for each SA2 area, released in 2024 with a base year of 2022. For areas not covered, AreaSearch used the VIC State Government's Regional/LGA projections released in 2023, adjusted using weighted aggregation methods. Growth rates by age group were applied across all areas for years 2032 to 2041. Looking ahead, regional areas across the nation are projected to have above median population growth. The area is expected to expand by 1,937 persons to 2041 based on the latest annual ERP population numbers, reflecting a total increase of 14.2% over the 17 years.
Frequently Asked Questions - Population
Development
AreaSearch analysis of residential development drivers sees Churchill recording a relatively average level of approval activity when compared to local markets analysed countrywide
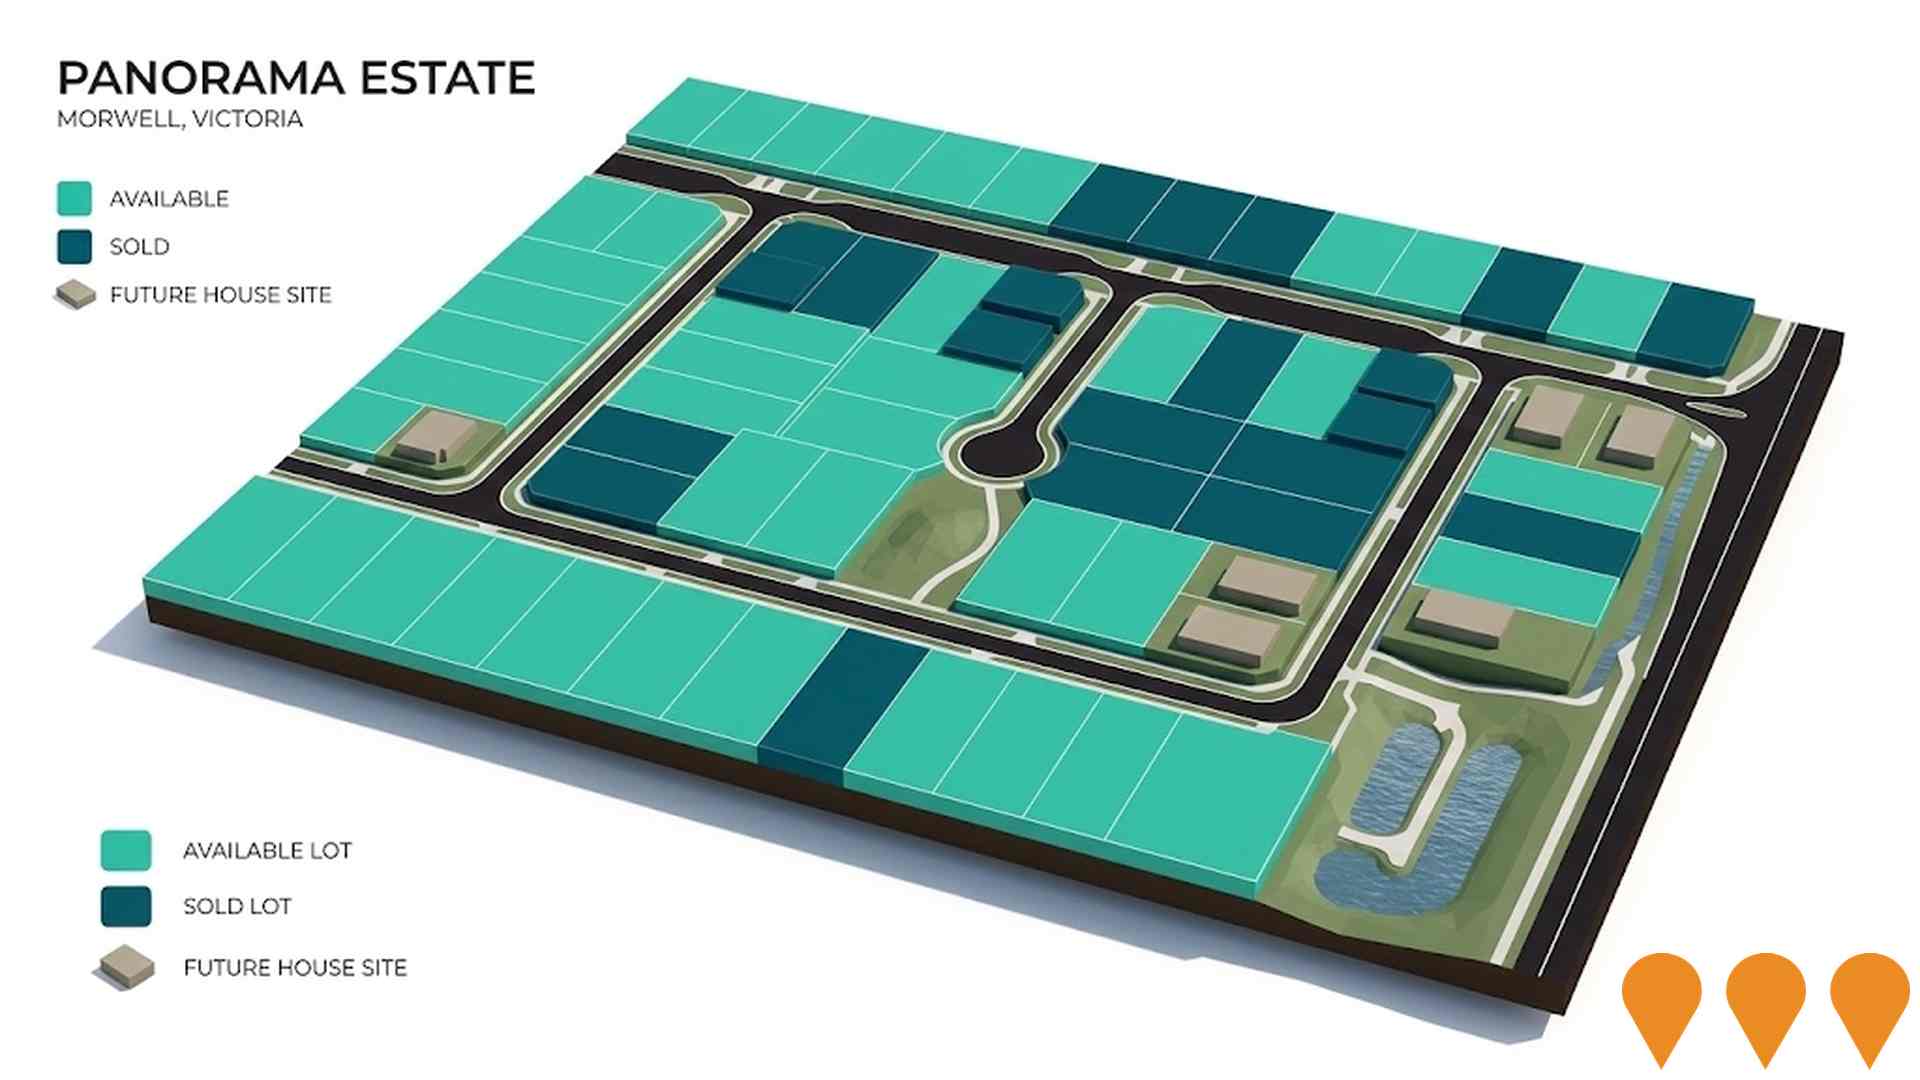
Churchill has averaged approximately 70 new dwelling approvals annually over the past five financial years, totalling 350 homes. As of FY26, 13 approvals have been recorded. On average, 1.5 new residents per year per dwelling constructed were noted between FY21 and FY25, indicating a balanced supply and demand market with stable conditions. The average construction value for new properties was $229,000, below the regional average, suggesting more affordable housing options.
In FY26, $13.3 million in commercial development approvals have been recorded, showing moderate levels of commercial development. Churchill maintains similar construction rates per person compared to Rest of Vic., consistent with broader area market balance, although recent activity has moderated. Current building activity comprises entirely detached houses, preserving the area's low density nature and attracting space-seeking buyers.
The estimated 378 people per dwelling approval reflects its quiet, low activity development environment. By 2041, Churchill is projected to grow by 1,760 residents, with current construction levels expected to meet demand adequately, creating favourable conditions for buyers while potentially enabling growth beyond current forecasts.
Frequently Asked Questions - Development
Infrastructure
Churchill has moderate levels of nearby infrastructure activity, ranking in the top 50% nationally
Changes to local infrastructure significantly influence an area's performance. AreaSearch has identified 40 projects that could impact the area. Key projects include Wooreen Energy Storage System, Hazelwood Mine Rehabilitation Project, Bennetts Creek Battery, and Marinus Link - Victorian Converter Station. The following list details those most relevant.
Professional plan users can use the search below to filter and access additional projects.
INFRASTRUCTURE SEARCH
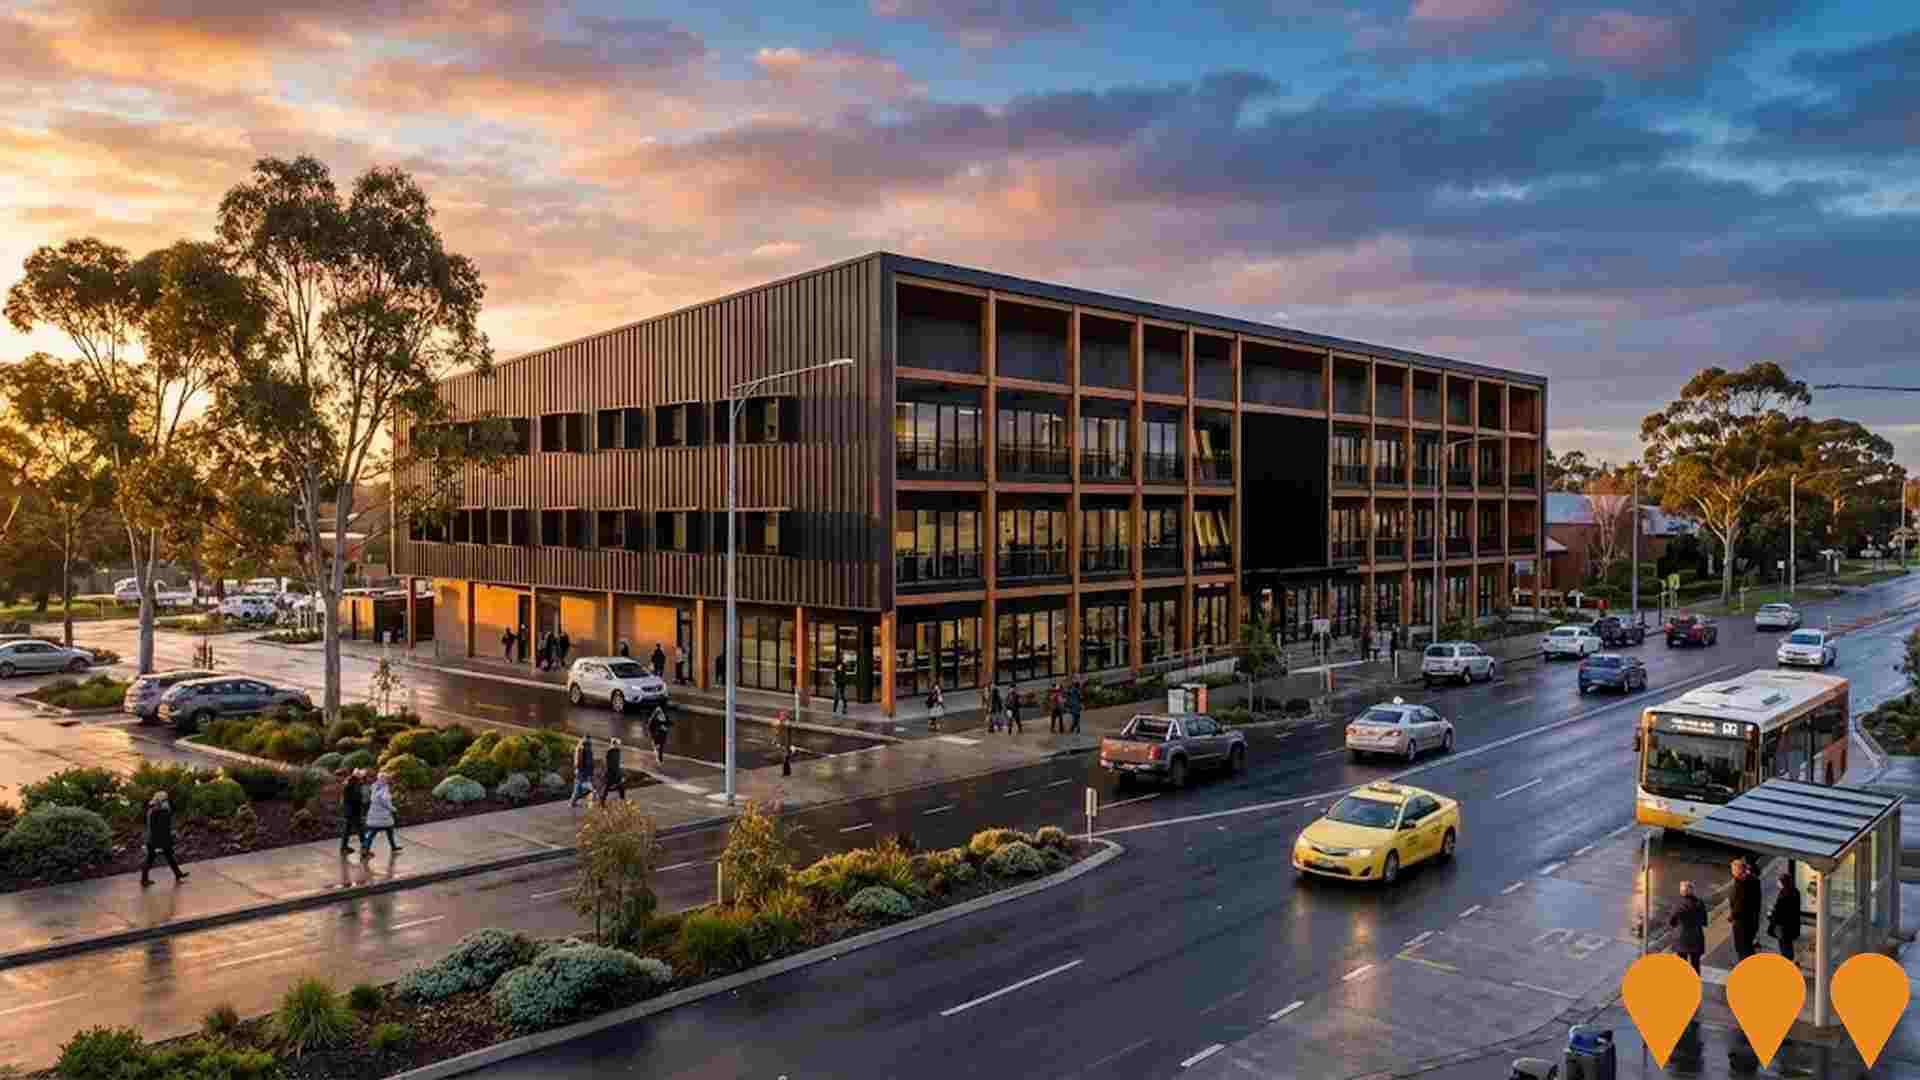
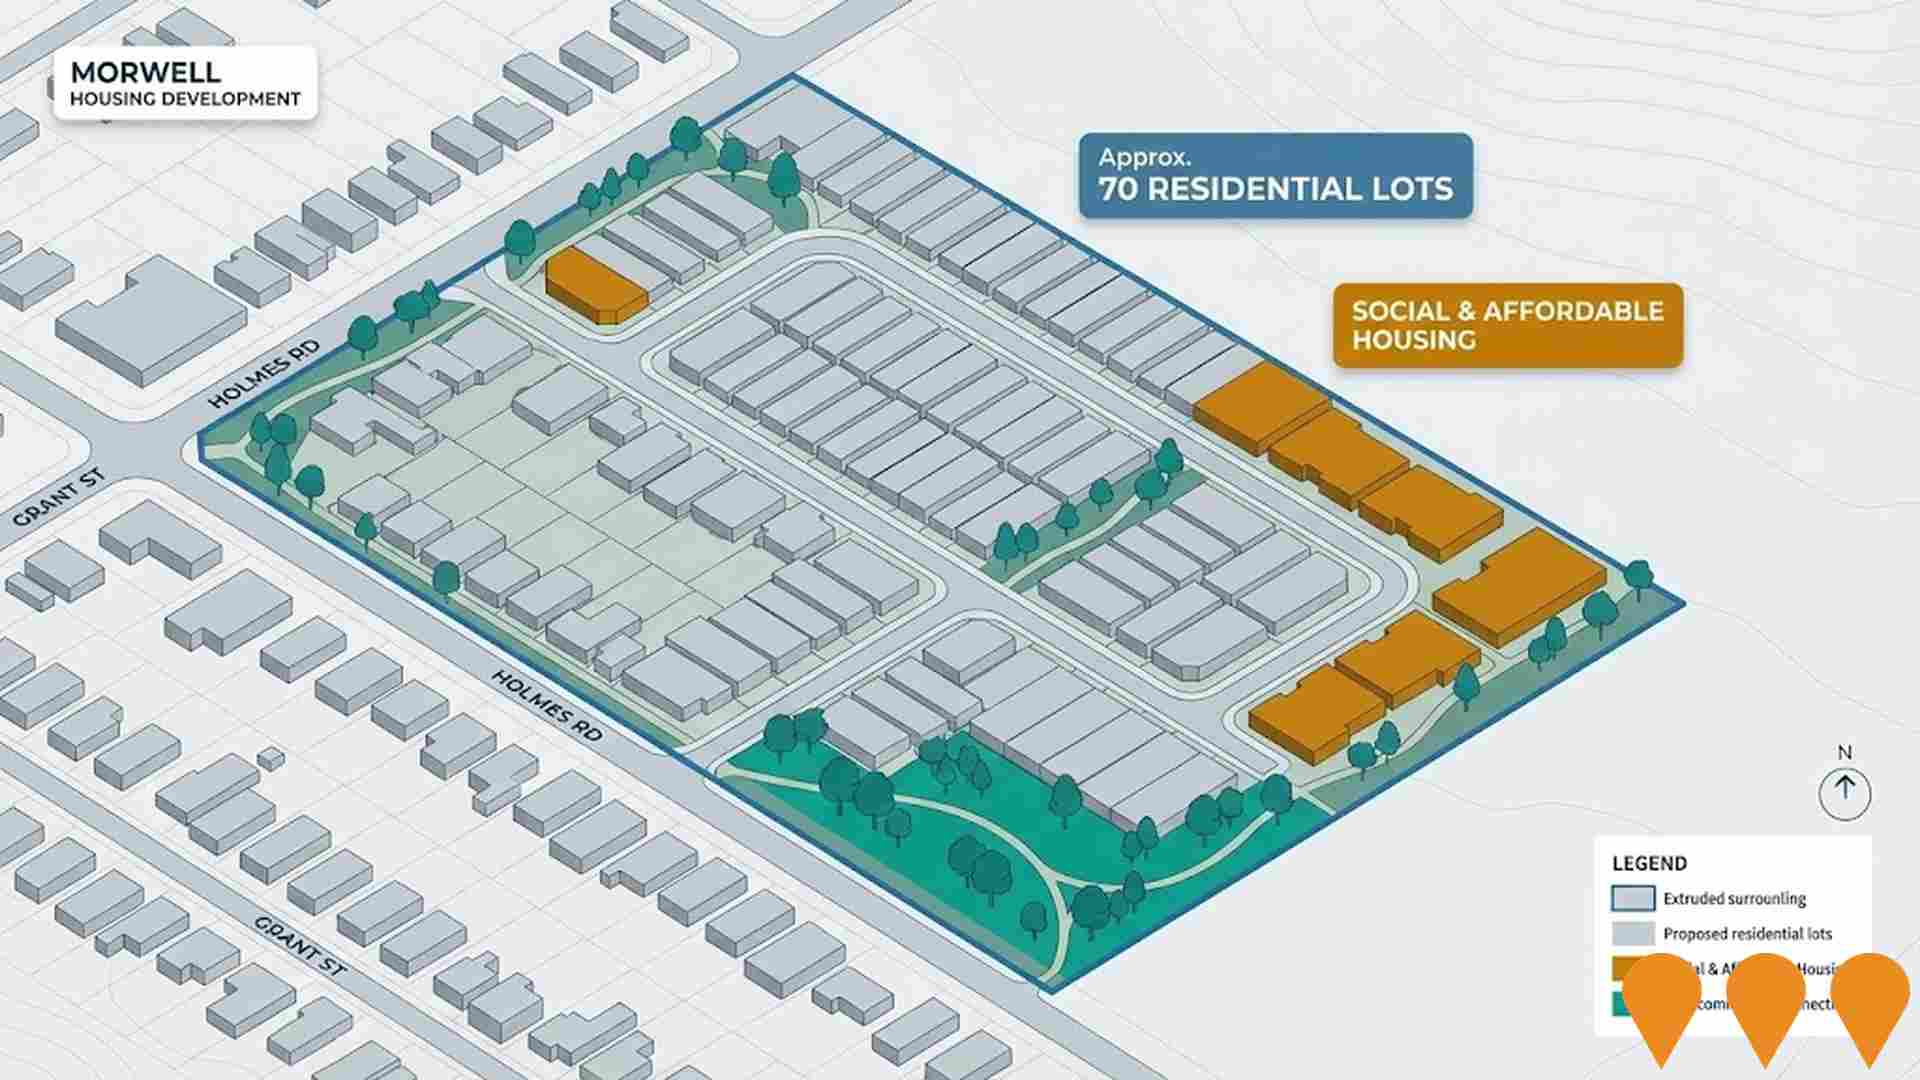
 Denotes AI-based impression for illustrative purposes only, not to be taken as definitive under any circumstances. Please follow links and conduct other investigations from the project's source for actual imagery. Developers and project owners wishing us to use original imagery please Contact Us and we will do so.
Frequently Asked Questions - Infrastructure
Marinus Link
Marinus Link is a 1,500 MW (2 x 750 MW) high-voltage direct current (HVDC) electricity and telecommunications interconnector between north-west Tasmania and the Latrobe Valley in Victoria. Stage 1 (750 MW) comprises approximately 255 km of subsea HVDC cable across Bass Strait and 90 km of underground HVDC cable in Gippsland, with converter stations at Heybridge (TAS) and Hazelwood (VIC). Early works and major procurement contracts are in place, with main construction now underway for a target energisation in 2030.
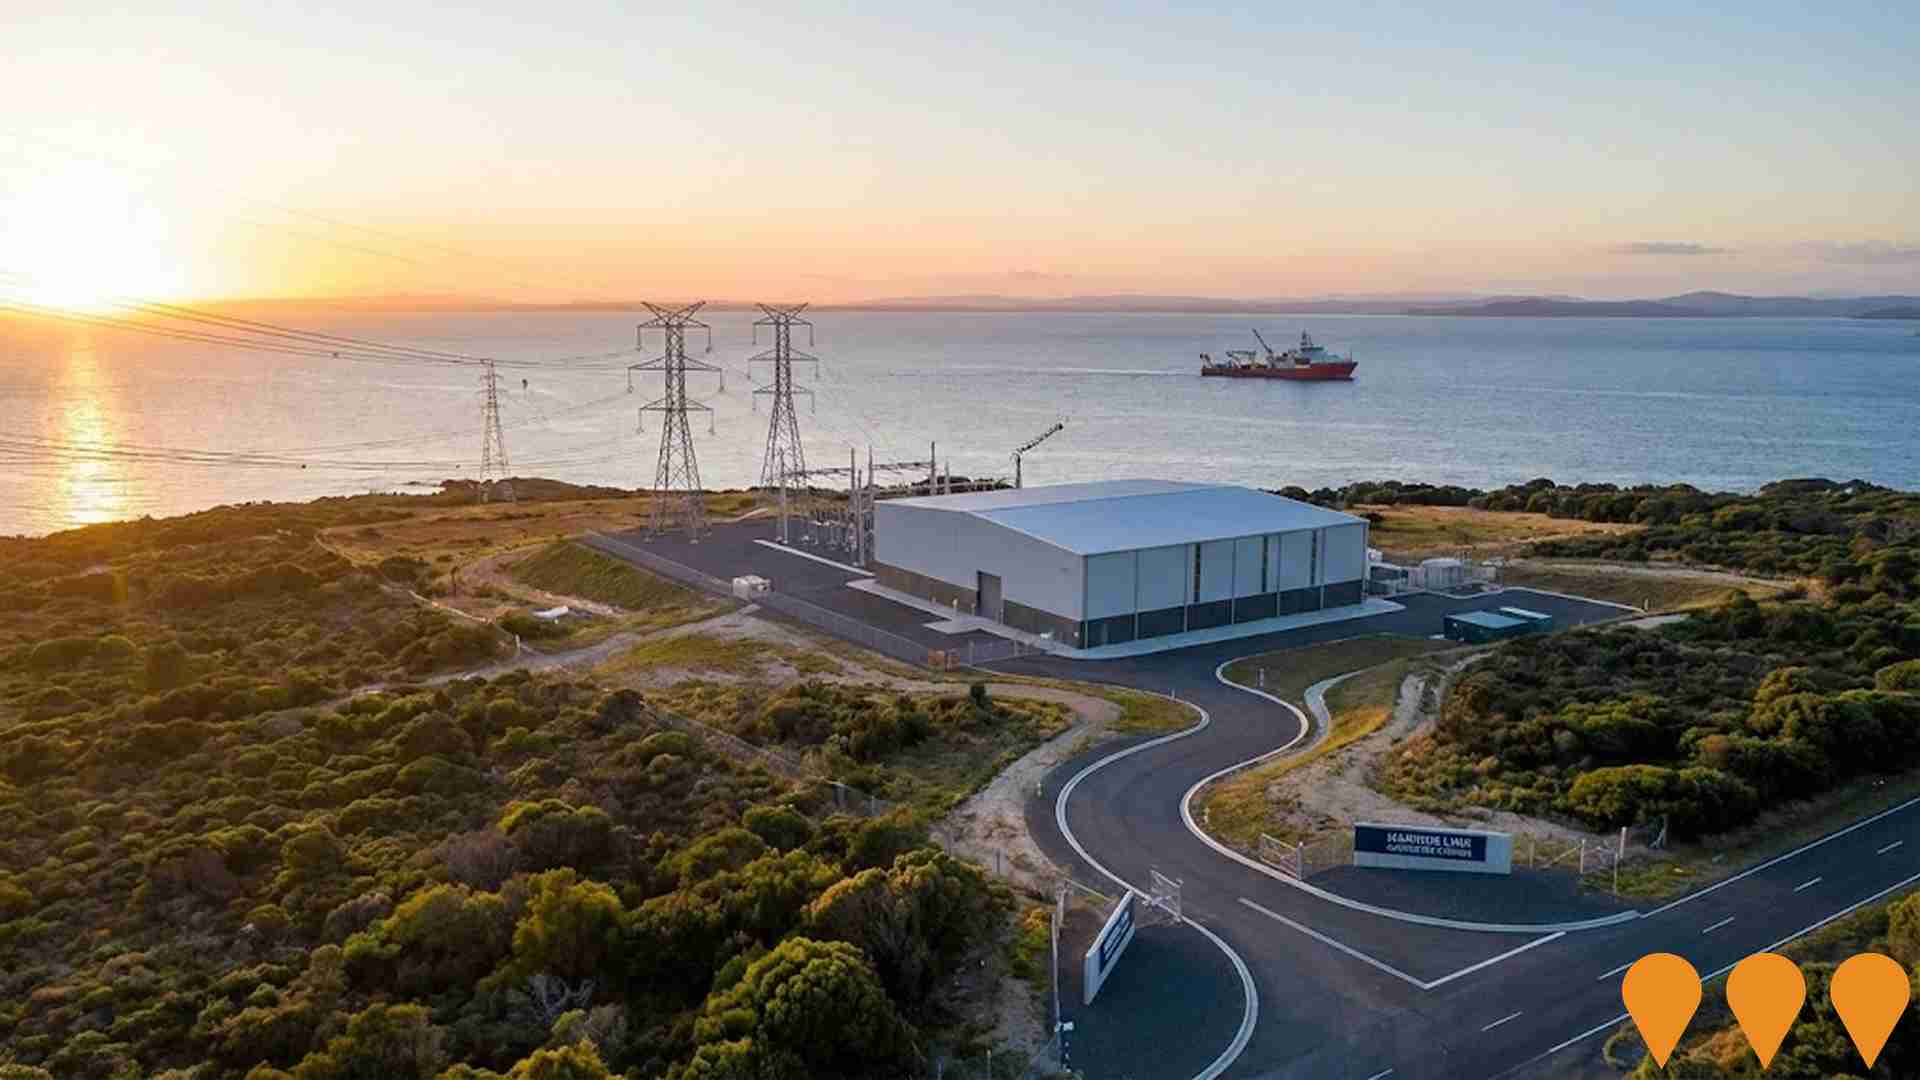
Marinus Link - Victorian Converter Station
The Victorian Converter Station at Morwell forms part of Marinus Link, a proposed 1,500 MW high-voltage direct current (HVDC) interconnector between north-west Tasmania and the Latrobe Valley in Victoria. It will enable renewable energy transfer, support grid stability, and facilitate the National Electricity Market transition.

Hazelwood North Solar Farm
Victoria's largest solar farm: a 450 MW photovoltaic solar energy facility with a 450 MW / 1,800 MWh (4-hour) battery energy storage system on a 1,100-hectare site in the Latrobe Valley between Morwell and Traralgon. The $651 million project will power approximately 150,000 homes, avoid 700,000 tonnes of emissions annually, create ~500 construction jobs, and incorporate agrivoltaic design allowing continued sheep grazing.
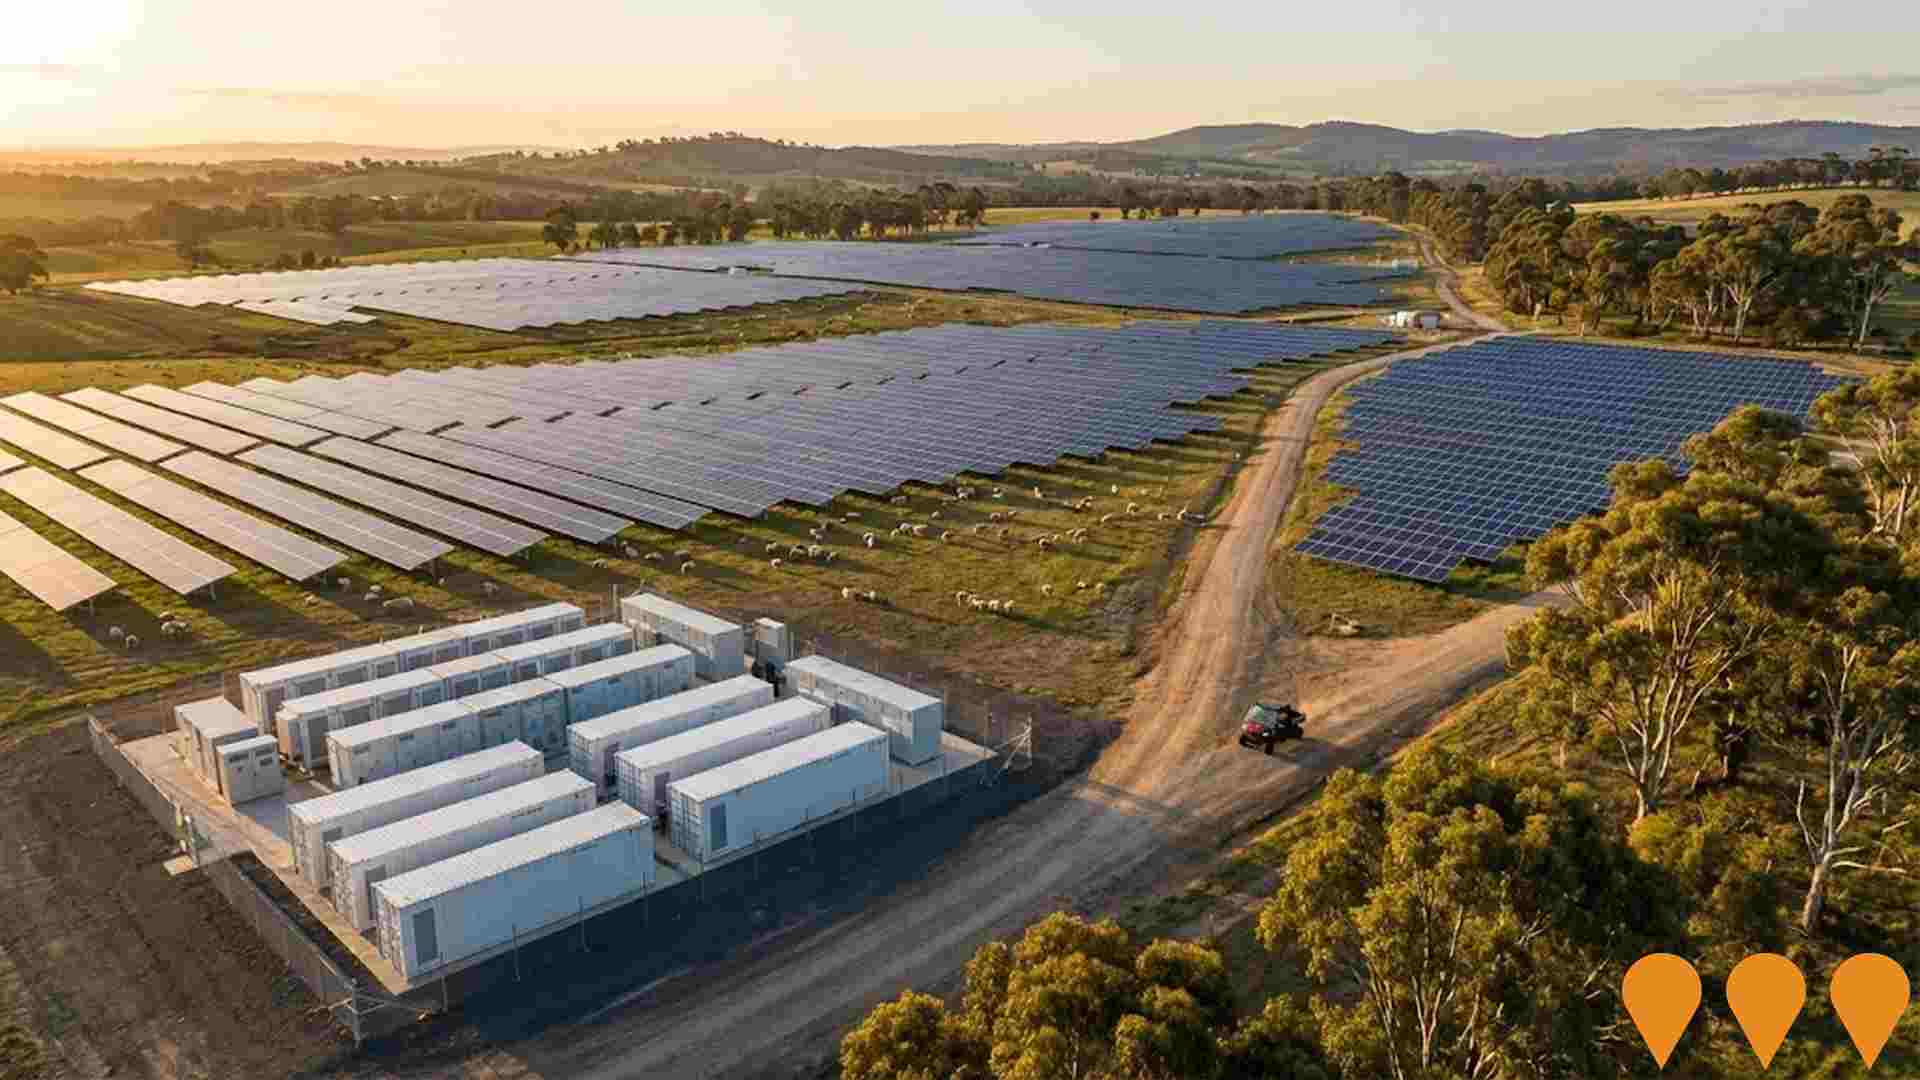
Tramway Road Battery Energy Storage System
300 MW / 1200 MWh grid-scale Battery Energy Storage System (BESS) developed by Eku Energy adjacent to the Hazelwood Terminal Station in Gippsland, Victoria. The project uses LFP battery technology and will support Victoria's renewable energy integration and grid stability. Approved in November 2025 through the Development Facilitation Program. Construction expected to create approximately 150 jobs, with 5-10 ongoing roles. Commercial operations targeted for 2028 subject to final grid connection approval.
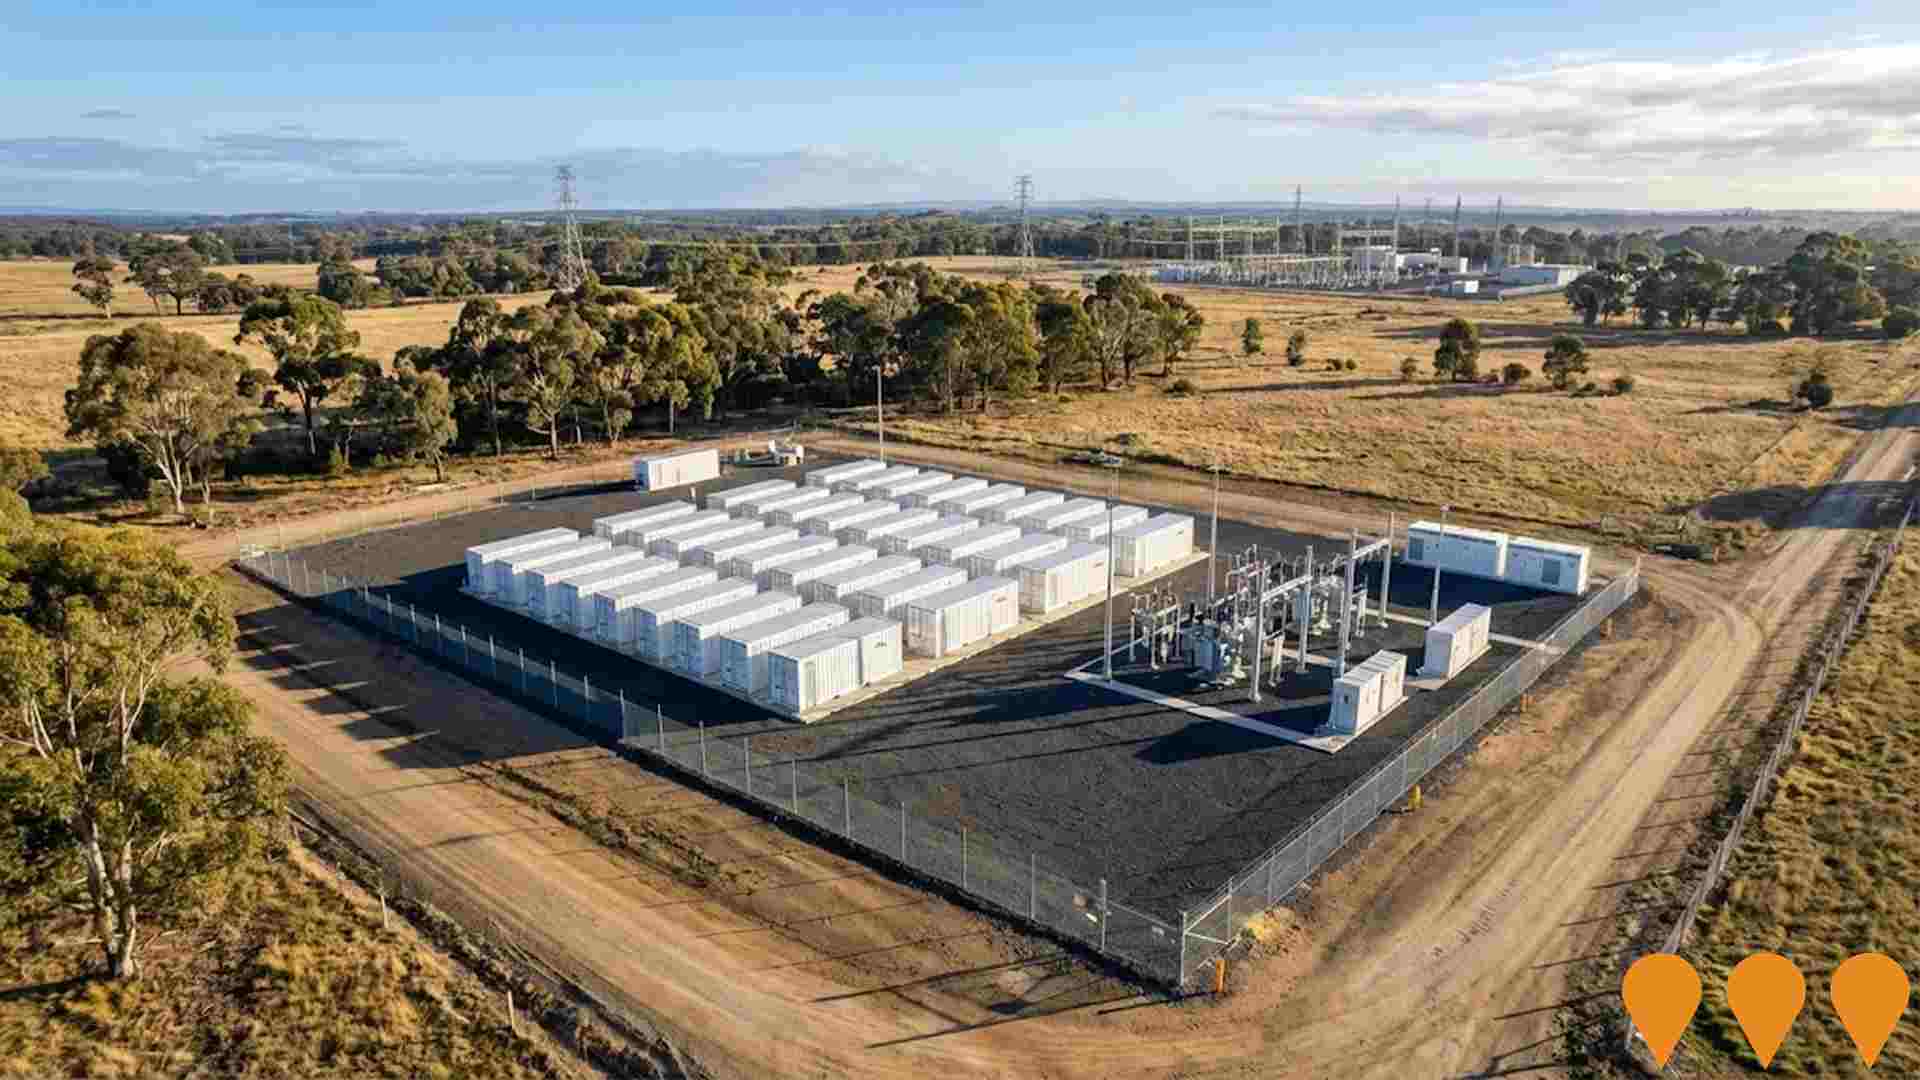
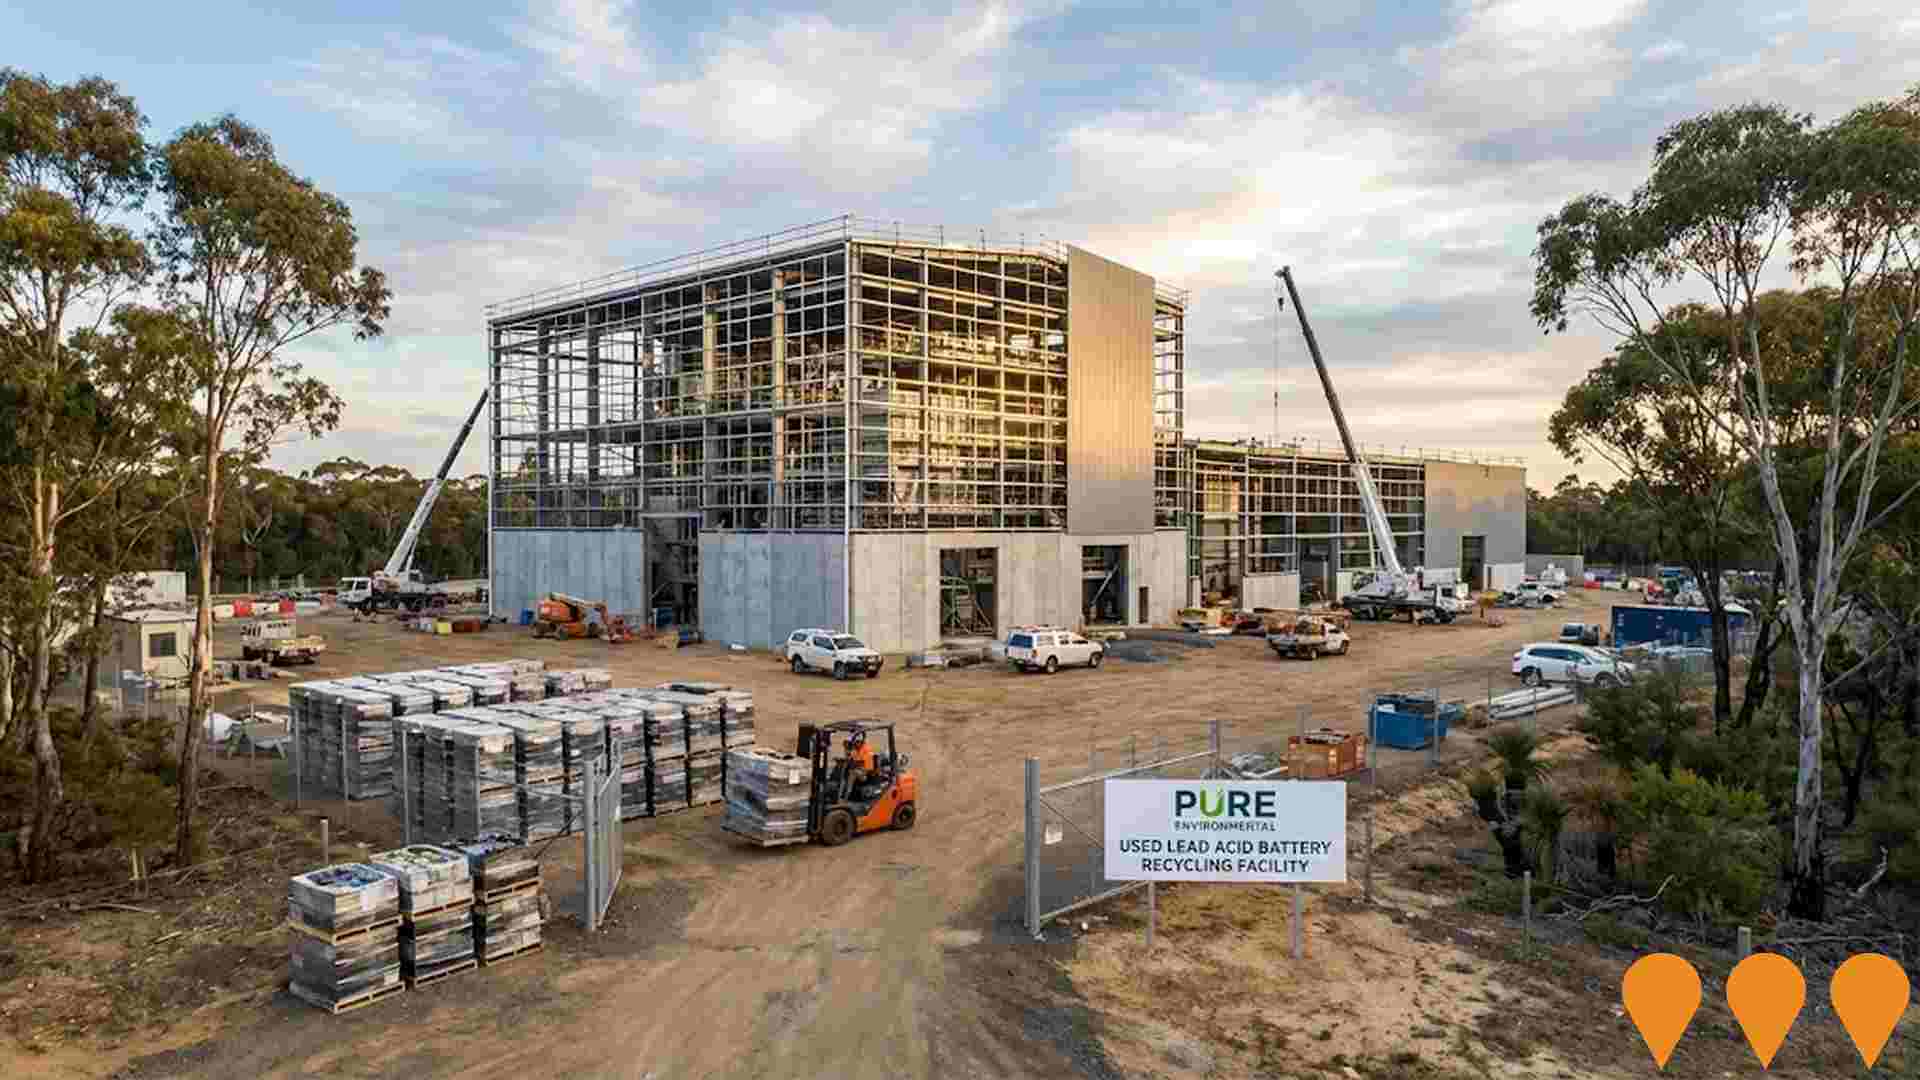
ULAB Lead Acid Battery Recycling Facility
Australia's first advanced used lead-acid battery (ULAB) recycling facility, capable of processing 50,000 tonnes of spent batteries annually and producing 28,000 tonnes of refined lead. The project supports circular economy outcomes by recovering lead for reuse in new batteries and safely managing hazardous waste.

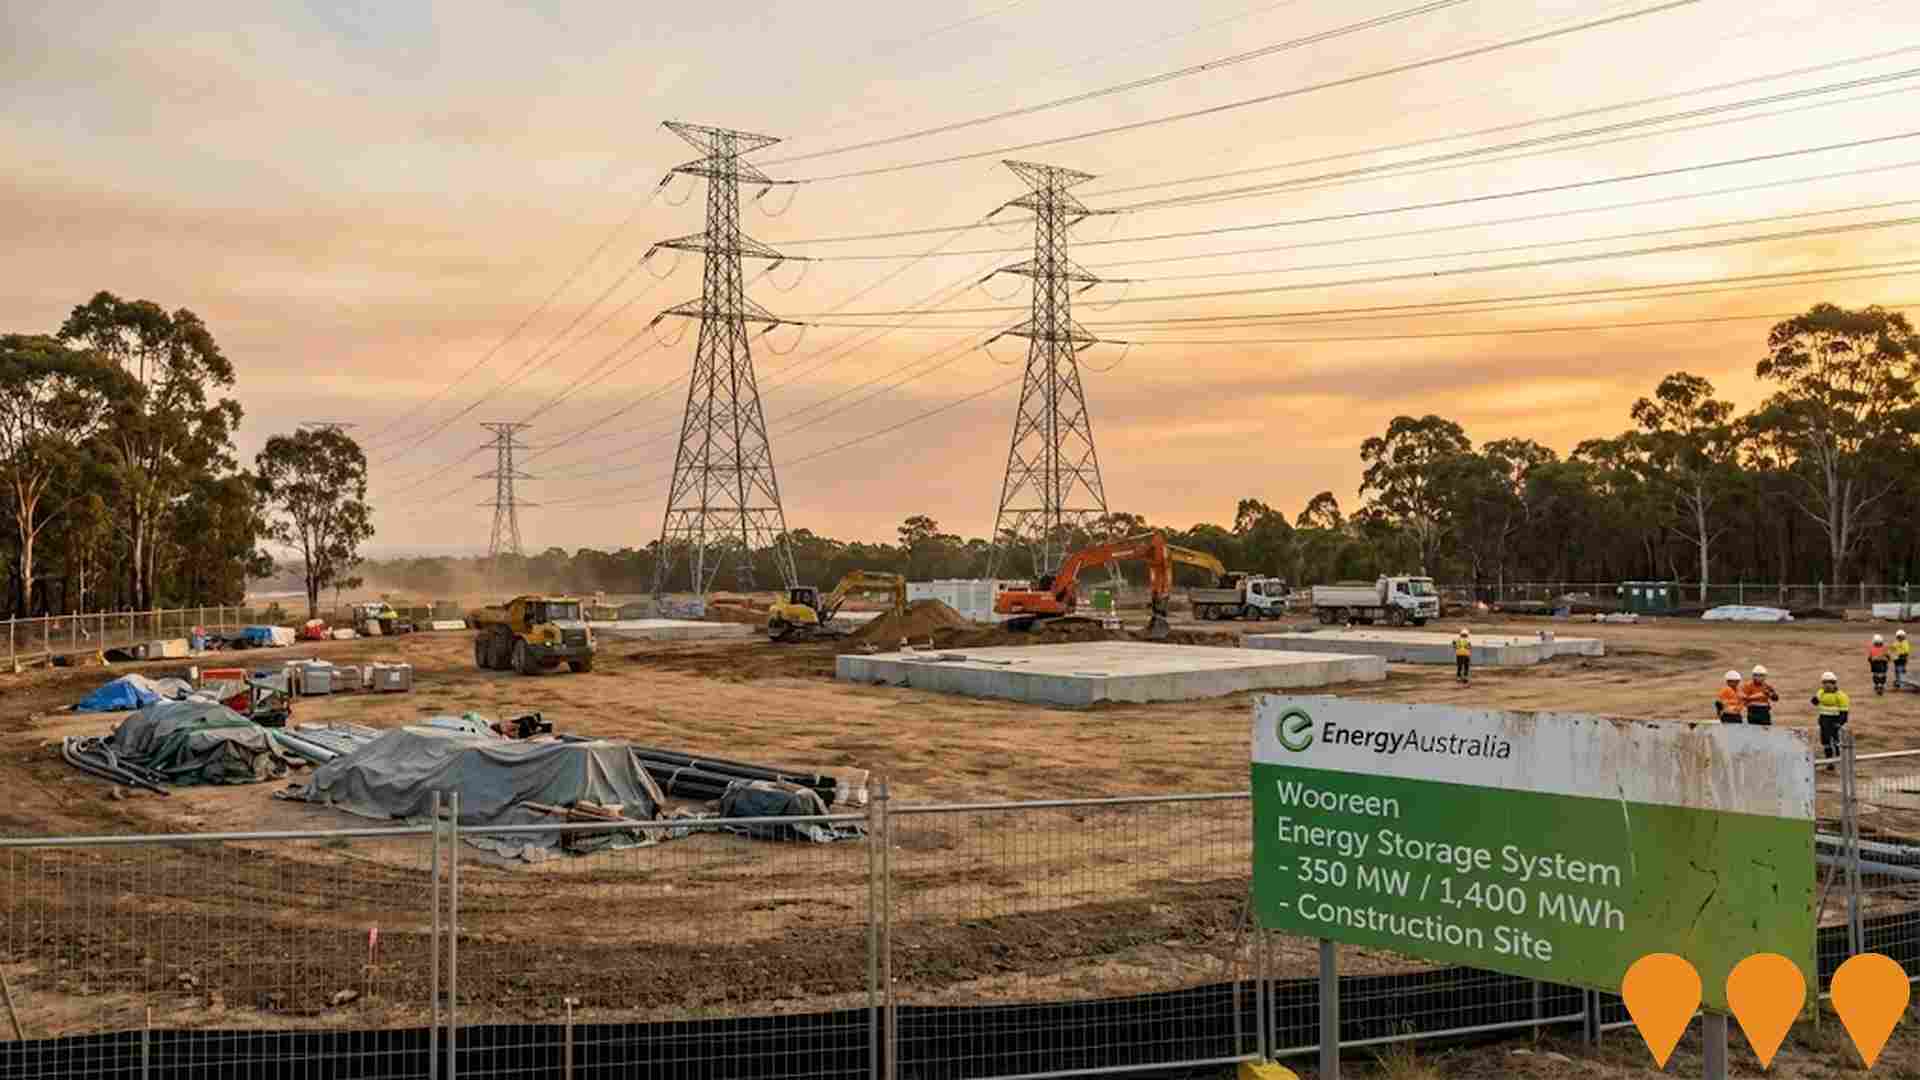
Wooreen Energy Storage System
EnergyAustralia is constructing a utility-scale battery energy storage system of 350 MW with four hours of storage (approx. 1,400+ MWh) at Jeeralang Power Station in Hazelwood North, Victoria. The project will provide grid reliability and enable greater renewable integration for Victoria, with construction underway and targeted completion in 2027.
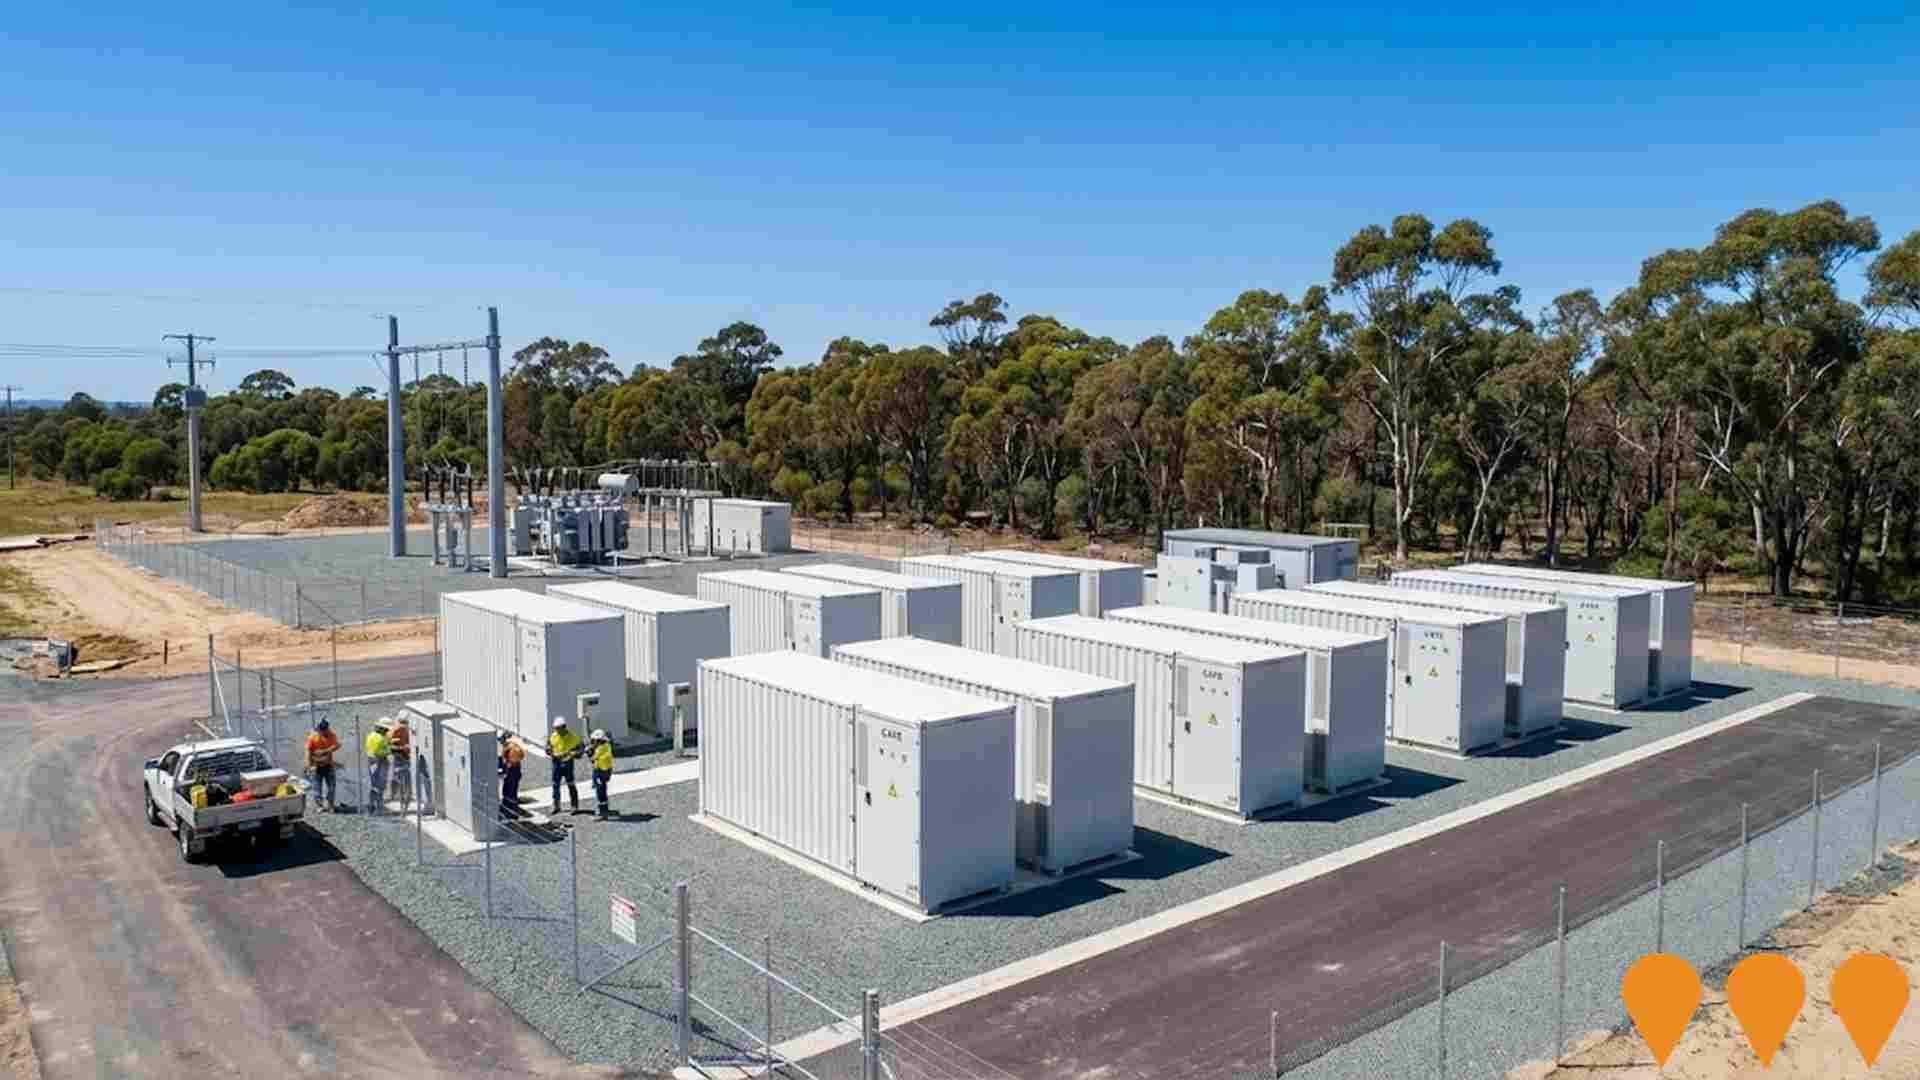
Bennetts Creek Battery
100MW/200MWh Battery Energy Storage System (BESS) designed to provide renewable energy firming for Victoria's electricity grid. Located beside Morwell Terminal Station with new 66kV transmission line connection. The project will store excess renewable energy during high generation periods and discharge when needed to help reduce electricity prices and support grid stability through Frequency Control and Ancillary Services (FCAS).
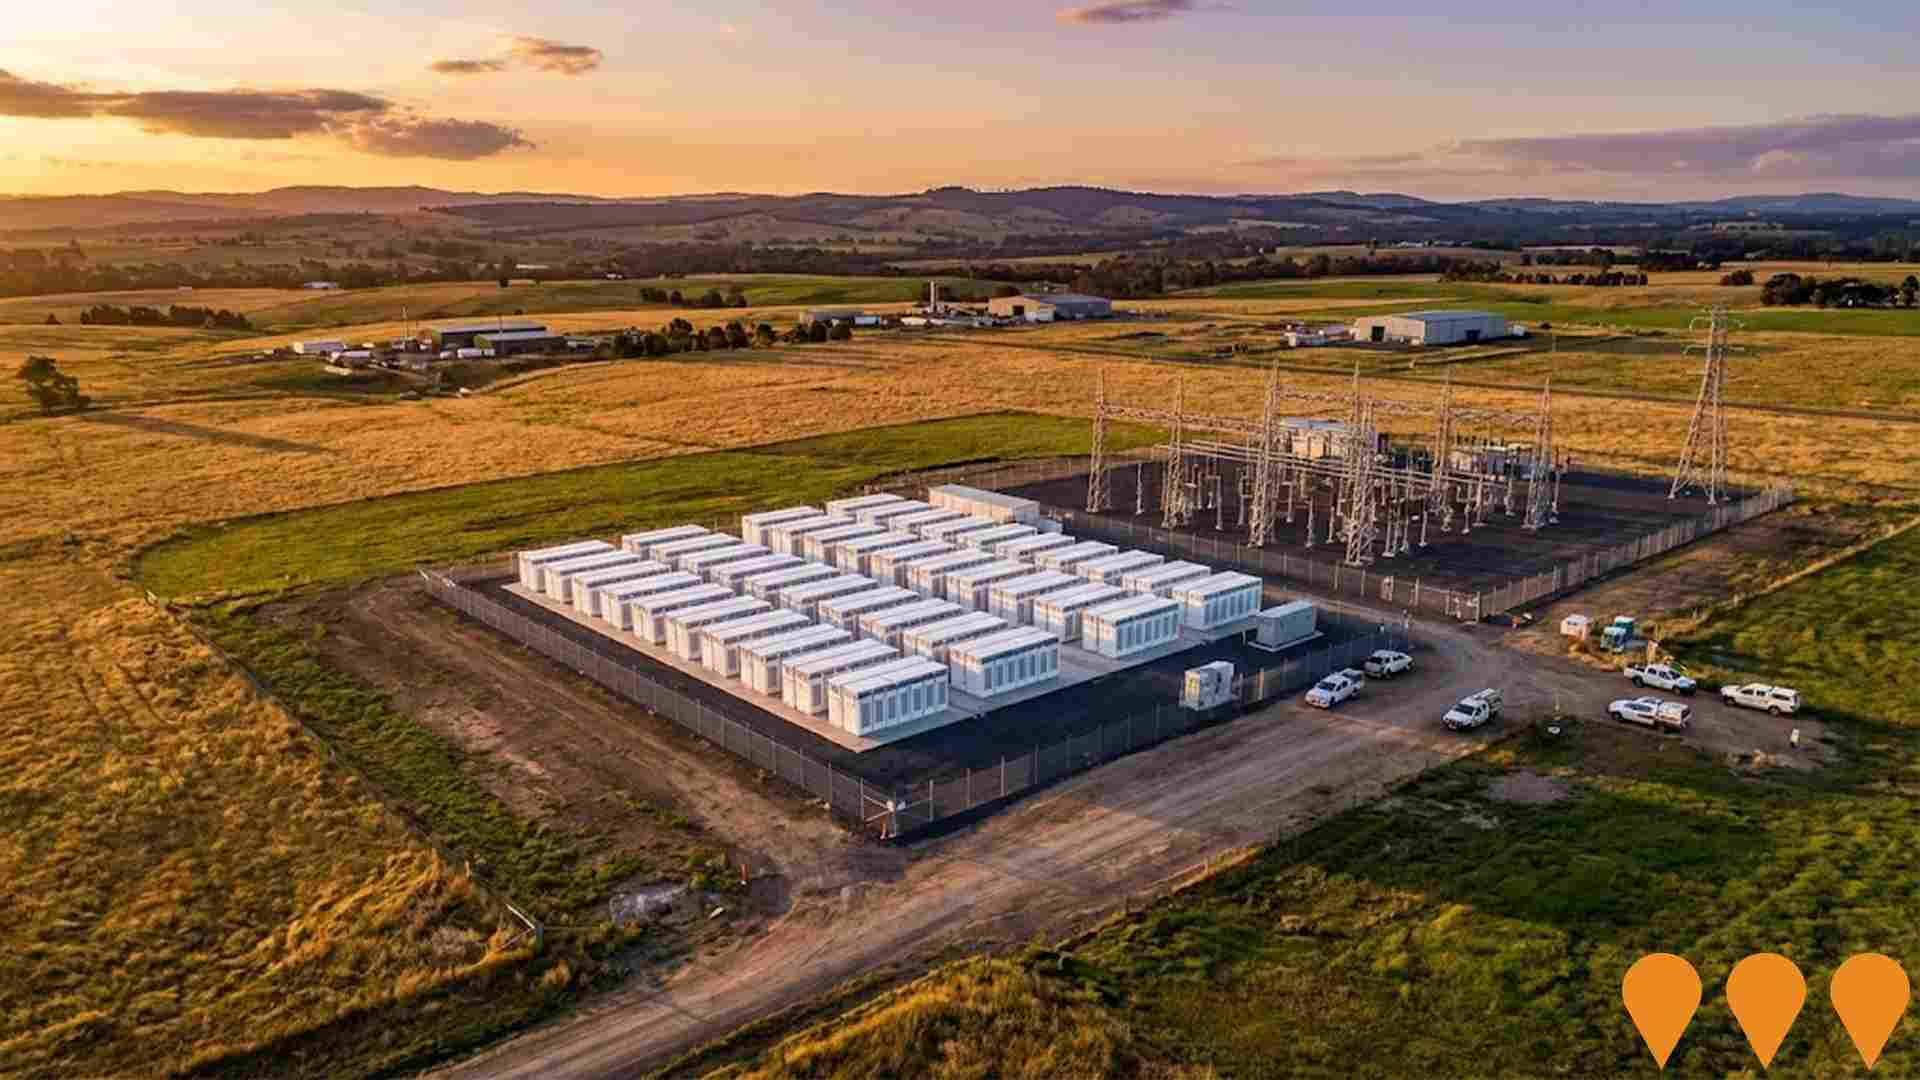
Latrobe Valley Battery Energy Storage System
A 100MW/200MWh battery energy storage system developed by Tilt Renewables with delivery partners Fluence Energy and AusNet. Located south of Morwell beside the existing Morwell Terminal Station, the system uses Fluence Gridstack technology comprising 320 battery cube energy storage containers with associated inverters and transformers. The facility improves Victorian electricity network reliability by storing power during periods of excess supply (such as midday solar generation) and releasing it during peak demand periods. Construction began in January 2024 and the project became fully operational in April 2025, with official opening in September 2025.
Employment
Employment conditions in Churchill remain below the national average according to AreaSearch analysis
Churchill's workforce is skilled with well-represented essential services sectors. The unemployment rate in Churchill was 4.7% as of September 2025.
There was an estimated employment growth of 4.4% over the past year. As of September 2025, 5,854 residents were employed while the unemployment rate was 1.0% higher than Rest of Vic.'s rate of 3.8%. Workforce participation in Churchill was broadly similar to Rest of Vic.'s 57.4%. Employment among residents is concentrated in health care & social assistance, construction, and education & training sectors.
The area has a particular employment specialization in electricity, gas, water & waste services with an employment share 4.7 times the regional level. However, agriculture, forestry & fishing is under-represented, with only 5.4% of Churchill's workforce compared to 7.5% in Rest of Vic.. Over the 12 months to September 2025, employment increased by 4.4% while labour force increased by 4.0%, resulting in a decrease in unemployment by 0.4 percentage points. In contrast, Rest of Vic. experienced an employment decline of 0.7% and labour force decline of 0.6%. State-level data to 25-Nov shows VIC employment grew by 1.13% year-on-year, adding 41,950 jobs, with the state unemployment rate at 4.7%, compared to the national rate of 4.3%. Jobs and Skills Australia's national employment forecasts from May-25 suggest that while national employment is forecast to expand by 6.6% over five years and 13.7% over ten years, growth rates differ significantly between industry sectors. Applying these projections to Churchill's employment mix suggests local employment should increase by 6.2% over five years and 13.1% over ten years.
Frequently Asked Questions - Employment
Income
Income levels sit below national averages according to AreaSearch assessment
AreaSearch's latest postcode level ATO data for financial year ending June 2022 shows that Churchill SA2 had a median income of $46,742 and an average income of $56,877. This is lower than the national averages of $48,741 (median) and $60,693 (average) for Rest of Vic. Based on Wage Price Index growth of 12.16% from financial year ending June 2022 to September 2025, estimated median income in Churchill SA2 would be approximately $52,426 and average income would be around $63,793 by that date. According to the Census conducted in August 2021, incomes in Churchill rank modestly, between the 22nd and 29th percentiles for households, families, and individuals. Income distribution shows that 30.1% of residents earn between $1,500 and $2,999 annually, similar to the surrounding region where 30.3% fall into this bracket. Housing costs consume 88.9% of income on average, with disposable income ranking at the 35th percentile.
Frequently Asked Questions - Income
Housing
Churchill is characterized by a predominantly suburban housing profile, with above-average rates of outright home ownership
Churchill's dwelling structure, as per the latest Census, was 98.4% houses and 1.7% other dwellings (semi-detached, apartments, 'other' dwellings), compared to Non-Metro Vic.'s 88.1% houses and 11.9% other dwellings. Home ownership in Churchill stood at 43.7%, with mortgaged dwellings at 39.1% and rented ones at 17.2%. The median monthly mortgage repayment was $1,300, higher than Non-Metro Vic.'s average of $1,213. Median weekly rent in Churchill was $230, compared to Non-Metro Vic.'s figure of $237. Nationally, Churchill's mortgage repayments were lower at $1,863 and rents were substantially below the national average of $375.
Frequently Asked Questions - Housing
Household Composition
Churchill has a typical household mix, with a higher-than-average median household size
Family households constitute 74.1% of all households, including 28.5% couples with children, 33.2% couples without children, and 11.7% single parent families. Non-family households comprise the remaining 25.9%, with lone person households at 23.7% and group households making up 2.2%. The median household size is 2.5 people, larger than the Rest of Vic. average of 2.3.
Frequently Asked Questions - Households
Local Schools & Education
Educational outcomes in Churchill fall within the lower quartile nationally, indicating opportunities for improvement in qualification attainment
The area's university qualification rate is 17.8%, significantly lower than Victoria's average of 33.4%. Bachelor degrees are the most common at 11.9%, followed by postgraduate qualifications (3.2%) and graduate diplomas (2.7%). Vocational credentials are prevalent, with 43.1% of residents aged 15+ holding them, including advanced diplomas (10.8%) and certificates (32.3%). Educational participation is high, with 29.0% of residents currently enrolled in formal education: 10.7% in primary, 8.2% in secondary, and 4.0% in tertiary education.
Educational participation is notably high, with 29.0% of residents currently enrolled in formal education. This includes 10.7% in primary education, 8.2% in secondary education, and 4.0% pursuing tertiary education.
Frequently Asked Questions - Education
Schools Detail
Nearby Services & Amenities
Transport
Transport servicing is low compared to other areas nationally based on assessment of service frequency, route connectivity and accessibility
Transport analysis indicates 44 active stops operating within Churchill, serving a mix of bus routes. These stops are serviced by 7 individual routes, collectively providing 1028 weekly passenger trips. Transport accessibility is rated limited, with residents typically located 796 meters from the nearest stop.
Service frequency averages 146 trips per day across all routes, equating to approximately 23 weekly trips per stop.
Frequently Asked Questions - Transport
Transport Stops Detail
Health
Health performance in Churchill is well below average with prevalence of common health conditions notable across both younger and older age cohorts
Churchill faces significant health challenges, as indicated by health data. Both younger and older age groups have high prevalence rates for common health conditions.
Only approximately 48% of Churchill's total population (~5,989 people) has private health cover, compared to the national average of 55.3%. The most prevalent medical conditions in Churchill are arthritis (10.6%) and mental health issues (9.6%). Conversely, 62.2% of residents report having no medical ailments, slightly higher than the Rest of Vic's rate of 60.1%. Approximately 20.5% of Churchill's population is aged 65 or over (2,547 people). Despite this, health outcomes among seniors in Churchill are promising and perform better than those of the general population.
Frequently Asked Questions - Health
Cultural Diversity
Churchill is considerably less culturally diverse than average when assessed alongside AreaSearch's national rankings for language and cultural background related metrics
Churchill's cultural diversity was found to be below average, with 89.8% of its population being citizens, 88.3% born in Australia, and 95.9% speaking English only at home. Christianity was the dominant religion, comprising 40.8% of people in Churchill. Islam was overrepresented compared to Rest of Vic., making up 0.5% of Churchill's population versus 0.8%.
The top three ancestry groups were Australian (32.3%), English (30.6%), and Scottish (8.7%). Notably, Dutch (3.2%) and Maltese (1.3%) were overrepresented compared to regional figures of 2.9% and 1.6%, respectively, while Polish was slightly overrepresented at 0.8%.
Frequently Asked Questions - Diversity
Age
Churchill's median age exceeds the national pattern
Churchill's median age in 2021 was 41 years, which is lower than the Rest of Vic. average of 43 but higher than the national average of 38. The 15-24 age group made up 12.8% of Churchill's population, compared to Rest of Vic., while the 75-84 cohort was less prevalent at 6.4%. Post-2021 Census data showed an increase in the 15-24 age group from 11.5% to 12.8%, a decline in the 55-64 cohort from 16.0% to 13.8%, and a decrease in the 45-54 group from 12.4% to 10.9%. Demographic modeling suggests that Churchill's age profile will change significantly by 2041. The 25-34 cohort is projected to grow the most at 46%, adding 666 residents to reach 2,110. Meanwhile, population declines are projected for the 65-74 and 55-64 cohorts.
