Overview
Every address in Australia. One databank.
Economic, demographic and sector data for every location in the country, updated daily.
Many opportunities are missed in the research nobody has time to do.
Information is scattered across registers, council sites and hundreds of other sources, using different formats and update schedules.
- Hundreds of council DA portals
- Dozens of government agencies
- Thousands of sector operators
- Non-standard data formats
- Limited cross examination
- Constant data releases
- Incomplete online registers
- Market reports
Features
Concept to completion, with time on your side.
Frame
A weekly report on every state and territory.
708 charts across every state and territory, in one Excel workbook.
Captured from areasearch.com.au/benchmarks/economics
- Thousands of economic measures, refreshed daily
- All eight states and territories side by side, with 10-year and rolling 3-year trends
- Jobs by industry and occupation, plus household and personal income
Benchmark
See whether a local figure is high or low.
Captured from the next edition of areasearch.com.au/benchmarks/retail/
- See what sectors and uses make sense right now
- A benchmark page each for child care, medical and retail
- Residents per location across 35 retail and service categories, by state and region
- State and regional economic benchmarks
Compare
Any statistic, shaded area by area.
Captured from Heatmap, areasearch.com.au
- Every area shaded by its national percentile
- Hundreds of metrics: population, growth, income, age, employment, housing and more
- Dark, Light, Satellite and Streets basemaps. Your layers stay on when you switch.
Target
Set up to six criteria. See every area that meets them.
Captured from areasearch.com.au/targetSearch
- Up to six metrics at once, each set as a national percentile, such as the top 30%
- Narrow to any state or territory, and to metro or regional areas
- Matches ranked by fit and plotted on an interactive map
- Go from any match straight to a catchment analysis
Assess
Free for every suburb in the country.
Every key figure, with its national rank.
Every chapter: charts, maps, tables and comparisons.
Captured from the sample Pyrmont (NSW) area page
- The free Snapshot: charts, maps, project cards and FAQs.
- Dashboard and Full come with Operator and Pro.
Zero in
Check zoning lot by lot, then run the analysis.
Retail supply, tenants and spending for the area you drew.
Captured from areasearch.com.au/draw and a catchment analysis
- Determine the highest and best use for any site
- Draw a polygon around the exact area you want
- Set a radius from any point
- Set a catchment by drive time or walk time
- Overlay statutory zoning and development controls on the map
Model
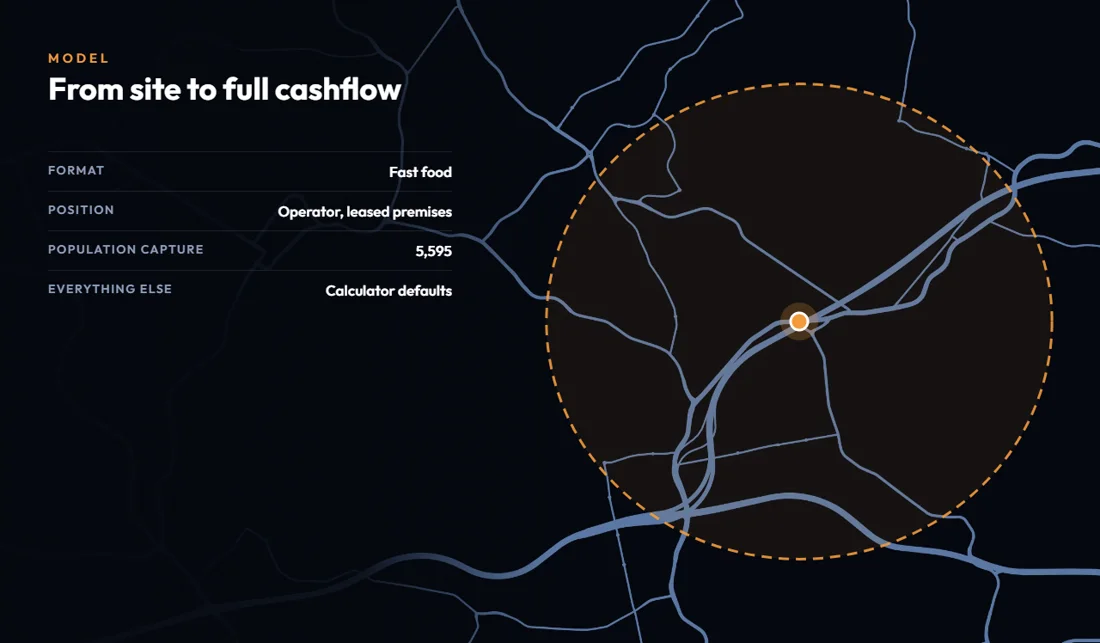
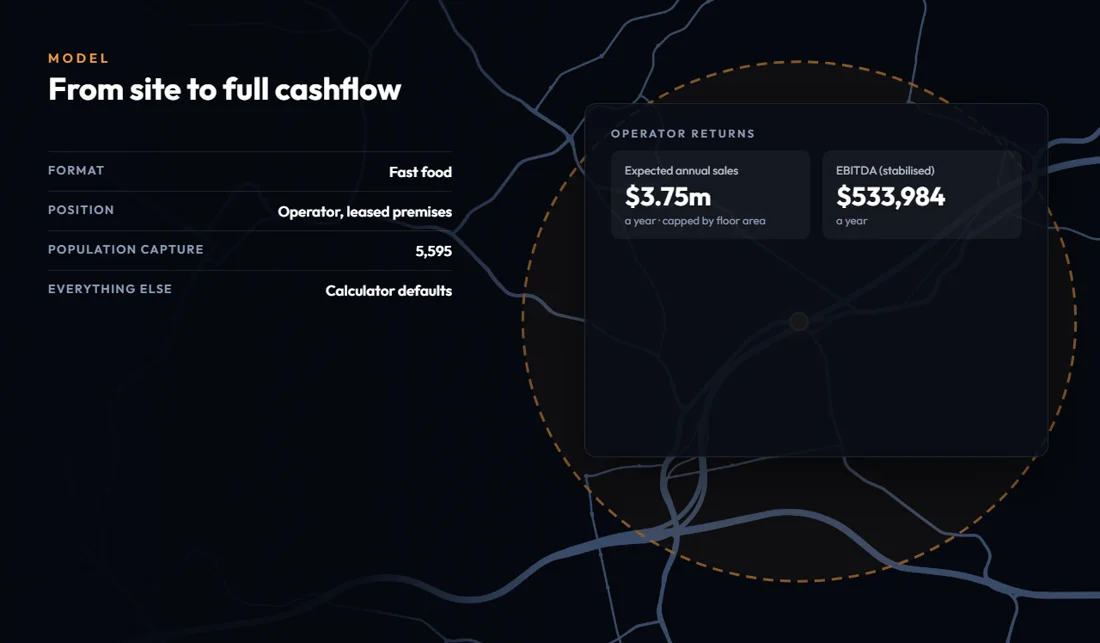
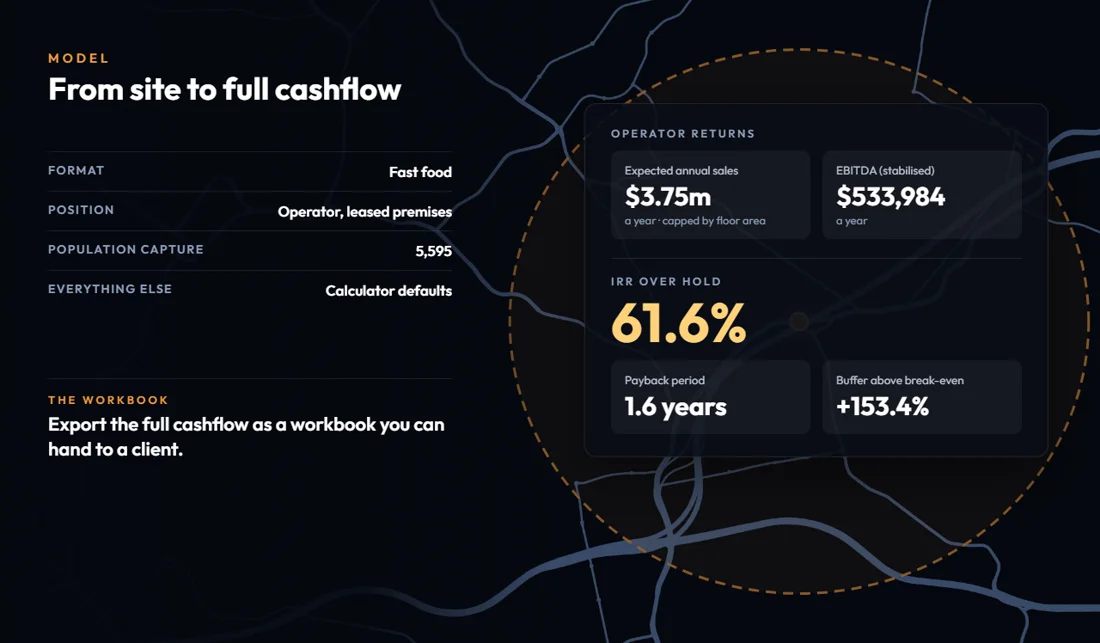
From a site's catchment to a full cashflow.
Captured from the retail returns calculator
- Start from the population your catchment captures, or enter your own figures
- Run it as an operator or as leased premises, and change any assumption
- Returns update as you go, on one screen
- Download the full cashflow as an Excel workbook with live formulas
Report
The Base report on any area, ready to send.
Slides you can edit and present.
The numbers behind every chart.
Edit every word before it goes out.
Captured from Word, PowerPoint and Excel samples
- Run a report on a suburb, a postcode or a shape you draw
- An editable PowerPoint, and Excel with the underlying data
- On Pro, save your colours so the charts match your own slides
Promote
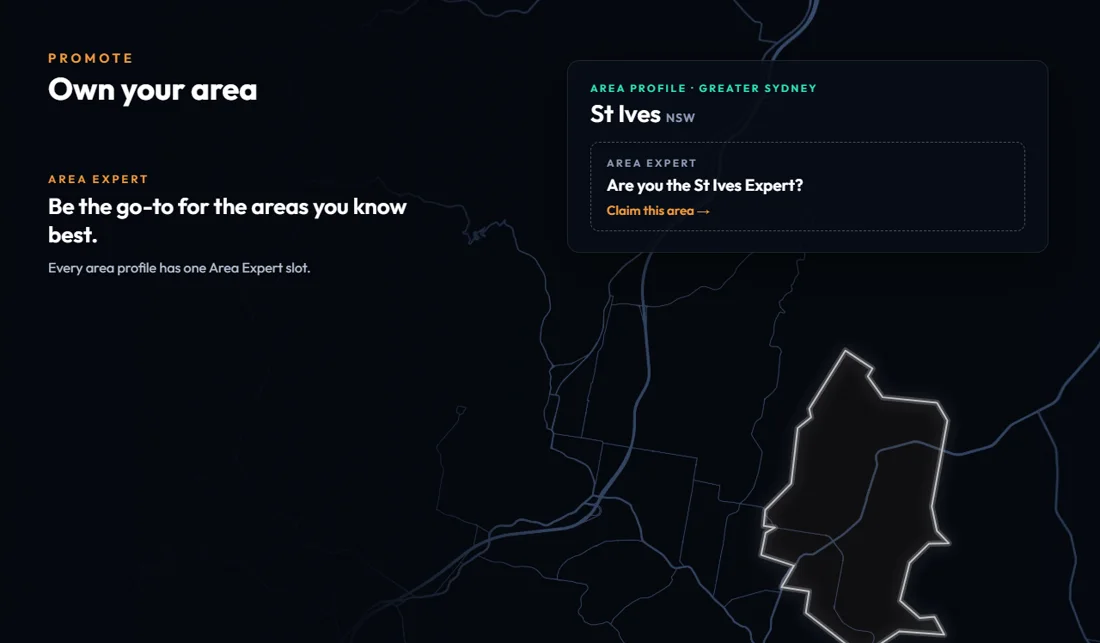
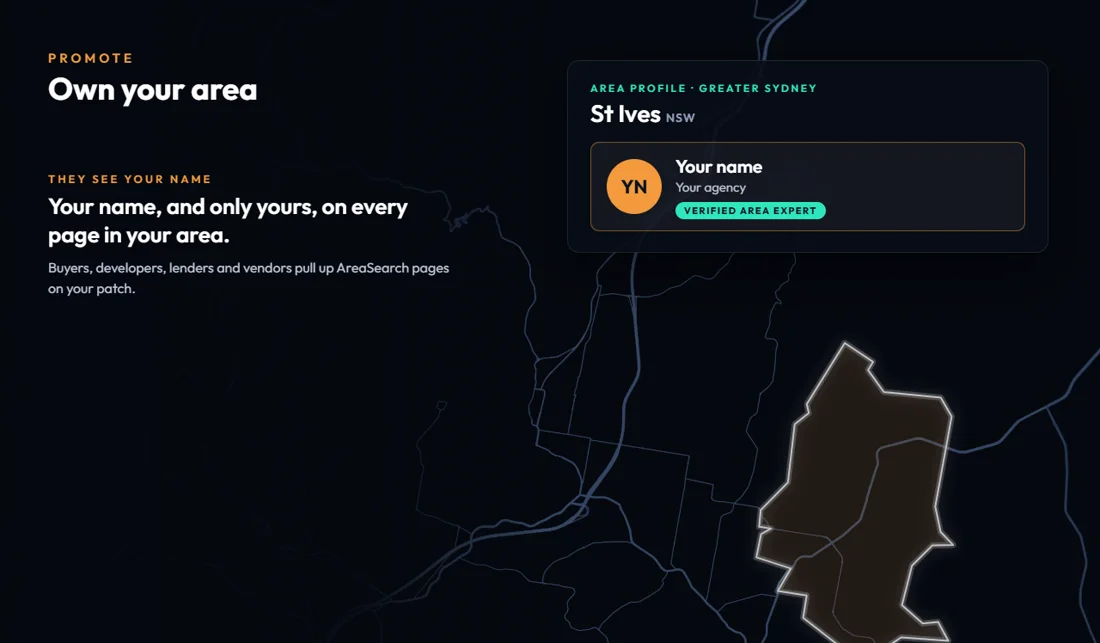
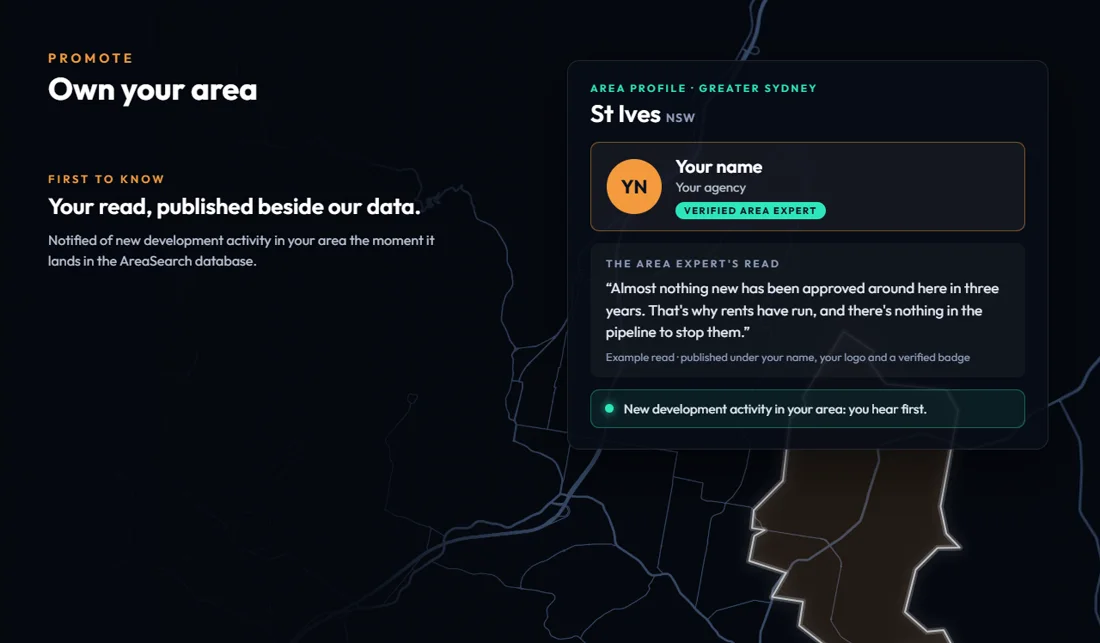
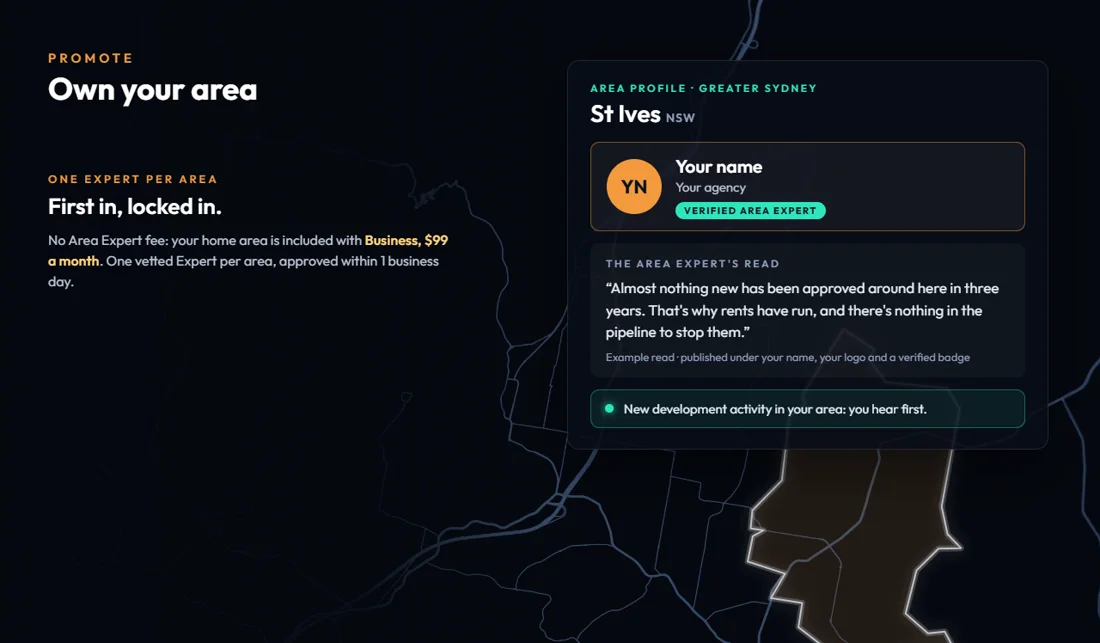
Area and Sector Experts, on the pages people already read.
Shown on the sample St Ives (NSW) area page
- Area Experts know one place. Sector Experts know one sector across a region.
- One approved Area Expert per area, who publishes their own read of the area
- Sector Experts offer further analysis and their own services, starting with child care
- Visitors can ask an expert from the page they are reading. Their details are shared only if they agree.
Every decision has a cost.
A price, a rent or a tenant recommendation is only as strong as the evidence behind it. But assembling that evidence from separate sources, for every appraisal, pitch and information memorandum, has an upfront cost.
Speed wins, but it kills when the data is not accurate. One missed deal is hours, days or weeks written off. Over years, those losses compound, clients go elsewhere and reputation stops carrying weight.
Time
Hours gathering figures before each pitch, repeated for the next one.
Reputation
Your name sits behind every figure you put in front of a client.
Money
Yours, and then your client's.
How it works
How our Area Pages are built.
Records from councils, government agencies and operators are matched to one map. Watch it happen for 14 real suburbs.
Baulkham HillsNSW · 1 of 14
01What goes in
- Enhanced Micro Blocks297: 297
- Schools10: 10
- Child care services26: 26
- Medical services39: 39
- Transport stops235: 235
- Development Applications321: 321
- Property sales386: 386
- Major projects11: 11
02What AreaSearch does
- People and growth
- An estimated 37,416 residents, little changed since the 2021 Census
- Services and transport
- 10 schools, 26 child care services, 39 medical services and 235 transport stops
- Market and pipeline
- Median rent $780 a week, up 8.0% over the 12 months to Jun 2026; 11 major projects tracked
03What comes out
A page for the suburb with a free Snapshot, and reports on any area you draw.
Open the Baulkham Hills page →
Where the data comes from
- Hundreds of council DA portals
- Dozens of government agencies
- Thousands of sector operators
- Online registers, many incomplete
- Market reports
- Regular statistical releases
The information sits in council sites, government registers and hundreds of other sources. Few share a format, and each updates on its own schedule. We collect it, match it to the map and keep it current.
People and growth. Population, age, households and income, and how each has changed.
Services and transport. Jobs, transport, schools and amenities: how residents and visitors use the area.
Market and pipeline. Current sales and rents, supply against demand in each sector, and the development applications and infrastructure that could change them.
Sectors
Supply and demand, sector by sector.
What an area already has, and where it is short, measured against its region.
How does an area's child care supply compare with demand?
Use it for Fee benchmarks, operator analysis and school zones.
- Children per long day care place and fees by service type for any area you draw, set against the wider region.
- Every centre mapped and listed with its distance, places, NQS rating and rate.
- The report comes as PDF, Word, Excel or PowerPoint. The sample runs to 5 pages.
Dashboard: included with the Child Care pack, $150/mo on Pro.Report: order it from any area page. No sector access needed; it is added to a Base report.
Watch the sample report · 37 seconds
Which medical services does an area have, and which is it missing?
Use it for Proving a site and its catchment, choosing the mix of GP, pharmacy and allied health, and supporting approvals.
- Every medical service plotted on a map you can filter by service type, with missing and undersupplied services flagged.
- Each provider type compared with its region, with supply by distance from the site.
- The report covers a catchment you draw, in PDF, Word or Excel. The sample runs to 53 pages.
Dashboard: included with the Medical sector, a $500/mo add-on to Pro.Report: order it on a catchment you draw. No sector access needed; it is added to a Base report.
Watch the sample report · 37 seconds
What retail does an area have, and what is missing?
Use it for Finding out what local shoppers need, what your site can supply and which specific tenants will want to be there.
- Stores plotted on a map you can filter by category, with categories that have no store flagged.
- Store mix and every category compared with its regional benchmark, plus supply and operators by distance.
- The report covers shopping centres, spending and nearby retail applications. The sample runs to 59 pages.
Dashboard: included with the Retail sector, a $500/mo add-on to Pro.Report: order it on a catchment you draw. No sector access needed; it is added to a Base report.
Watch the sample report · 37 seconds
What is happening to housing in an area, and what is in the pipeline?
Use it for Finding growth areas where new housing is not keeping up with population, for Build to Rent and other residential investment.
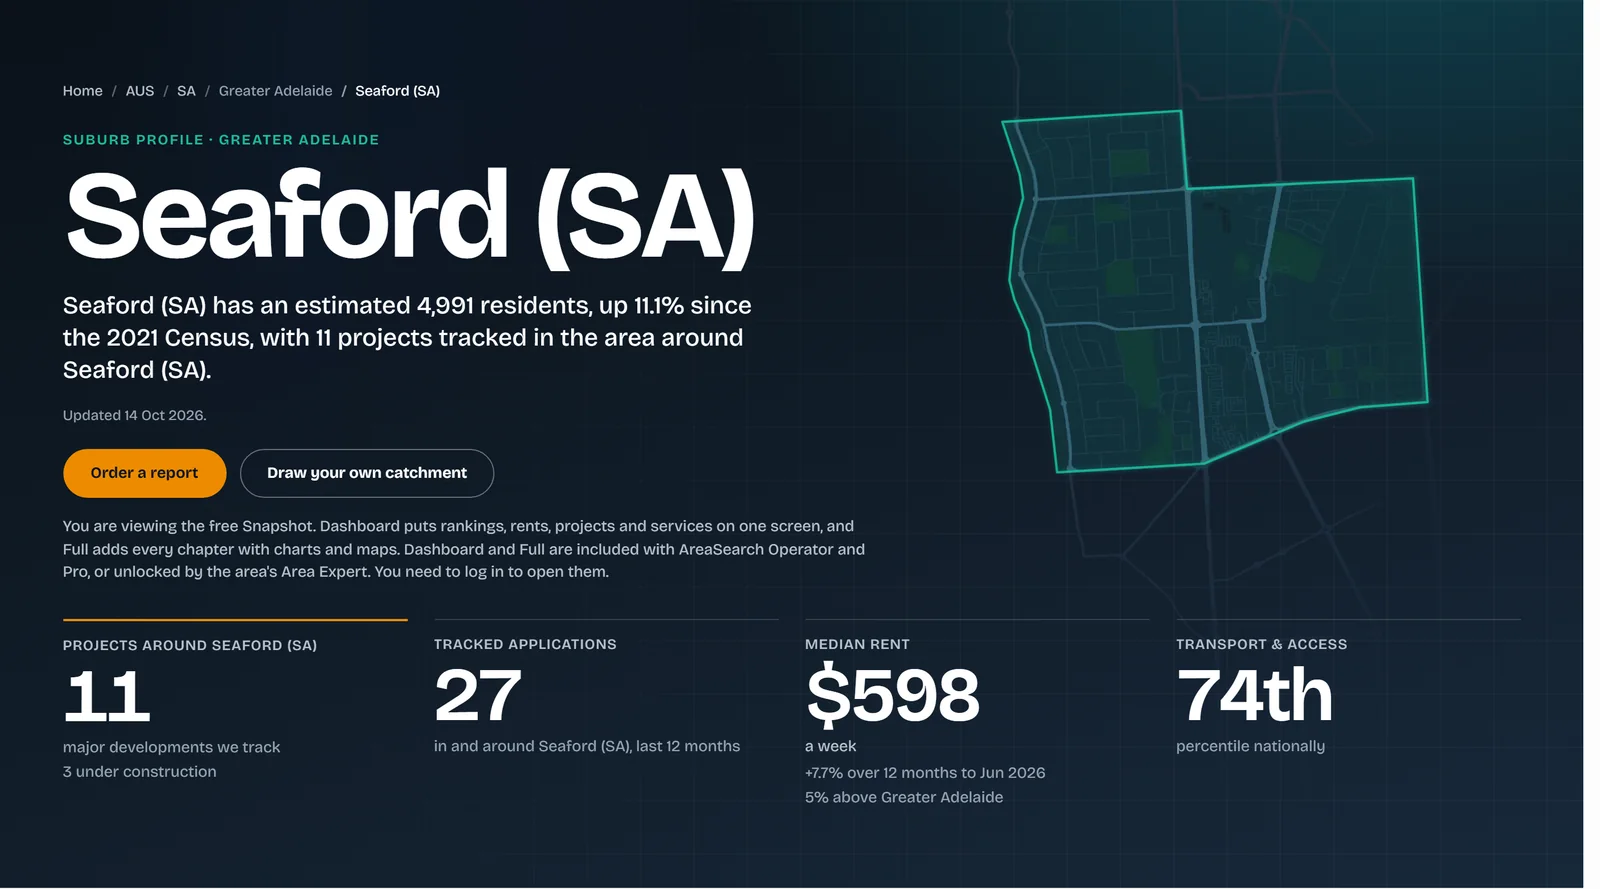
- Population, rents and sales for any suburb or area, with the national percentile for each.
- Projects and development applications tracked in and around the area.
- Draw your own catchment when a suburb boundary is the wrong shape.
The Snapshot of every area is free. Dashboard and Full are included with Operator and Pro.
See the free Snapshot
How do the states and regions compare on jobs, income and industry?
Use it for Putting a state or region in context before you look at a suburb.
- A weekly economic report on every state and territory.
- All eight states and territories side by side, with 10-year and rolling 3-year trends.
- Jobs by industry and occupation, plus household and personal income.
The economics benchmarks page is free to read. Economics and Heatmaps are included with Pro.
Watch the samples · economic report and EcoMaster
How much Specialist Disability Accommodation does an area have for its NDIS participants?
Use it for Finding undersupplied areas, and gauging accessible-housing need beyond formal SDA from the Census need-for-assistance figures.
- SDA places and NDIS participants per 10,000 residents, set against the region.
- SDA housing in the catchment mapped, with the nearest providers listed.
- The report adds supply by suburb, assessed need and the local housing market. The sample runs to 12 pages.
Dashboard: included with the SDA / NDIS pack, $150/mo on Pro.Report: order it on a catchment you draw. No sector access needed; it is added to a Base report.
Watch the sample report · 37 seconds
How much aged care does an area have for its older residents?
Use it for Sizing residential care, home care and retirement living against the older population, with beds, dwellings and distance for every provider nearby.
- Residential places, home care providers and retirement villages, with every provider mapped.
- Beds per 10,000 residents aged 65+, home care density and village vacancy, set against the region.
- The report adds pricing by owner type where providers report it. The sample runs to 15 pages.
Dashboard: included with the Aged Care pack, $150/mo on Pro.Report: order it on a catchment you draw. No sector access needed; it is added to a Base report.
Watch the sample report · 37 seconds
Clients
Who uses AreaSearch?
Eight kinds of client, and where each one usually starts.
Buyers Agents
Show clients why a suburb fits, with the figures behind it.
Target Search finds the suburbs that meet your criteria, such as growth, yield and demographic profile. Then run a PDF report that sets out why the location suits your client's strategy.
Where to start
Open Target Search →“AreaSearch is the most effective tool we've used for narrowing down regions and areas where new dwelling output lags demographic growth. The heatmapping tool in particular lets us easily investigate and understand the differences in local market dynamics across the country and provides our clients with confidence as we progress to acquisition.”
“AreaSearch helps us contextualise and look beyond historic metrics such as vacancy rates. This guides our bidding strategy and allows us to best position assets for performance post-acquisition.”
Valuers
Instant location reports for valuation work.
Run a report on any location or custom area and bring the demographics, maps, sector analysis and latest economic commentary into your valuation. With Target Search and the sector reports you can also take on specific site selection work for clients.
Where to start
Search an area →“Detailed demographic analysis plays an integral part of our valuation undertakings. AreaSearch provides us with trade area specific details that are easy to interpret and presented in a concise format.”
Developers
Data for site selection and feasibility.
Check demographic trends, infrastructure projects and zoning around a site or catchment. The child care and medical tools show where services are short, which helps when planning a specialised development.
Where to start
Draw a catchment →“We have now acquired our fourth Build to Rent site. AreaSearch has been an invaluable tool, helping us identify national locations and assess properties we believe will outperform.”
Financiers
Check the location behind a loan, quickly.
Demographic, economic and market data for the areas you lend into, from project finance to portfolio lending. Lenders use it to assess risk and reach a credit decision sooner.
Where to start
Economics benchmarks →“We need to be confident in our lending decisions, while at the same time be able to reach a decision quickly for our clients and investors. AreaSearch helps us do that at both a local and macro level.”
Institutions
Portfolio-level research for banks, super funds and investment managers.
Compare assets and target markets on the same footing: state and regional economics, sector benchmarks and location risk.
Where to start
All benchmarks →“One of the first things we do…is run an AreaSearch report.”
UHNW Investors
Location checks for private investors and family offices.
Private investors and family offices use AreaSearch to find and check opportunities: who lives in an area and how it is growing, what is being built nearby, and how a site or centre compares with its region.
Where to start
Open Target Search →“AreaSearch helps us quickly identify and assess opportunities…across our extensive shopping centre portfolio.”
Project Marketers
Location evidence for off-the-plan campaigns.
Suburb Snapshots, demographics and growth figures that answer the questions buyers ask. Export the charts, maps and data tables straight into your campaign material.
Where to start
Search an area →“…a closing rate from inspections that practically doubled to over 90%.”
Tenants & Leasing
Catchment evidence for a new site, an approval or a leasing pitch.
Tenants use our catchment reports to support a new location, including in applications to regulators. Leasing agents use the same data to show prospective occupiers what a location can support.
Where to start
Draw a catchment →“Our proposed tenancy fell within the minimum distance boundaries set by the Pharmacy Guild, making approval challenging. I engaged AreaSearch to prepare a detailed catchment report demonstrating clear medical need and a strong case for our pharmacy. The Guild approved our application, and we've been operating successfully ever since.”
Two ways to work with us

Use the platform
Do the research yourself. Demographic, economic and sector data are in one place, so a job that took hours takes minutes.

Work with our team
Give us the brief. We take on custom research, feasibility and strategy work. Or tell us your criteria and we will shortlist the locations that fit.
Team
The people you’ll deal with.
A small team with backgrounds in property research, banking, funds management and technology.

Chris Freeman, Founder
Chris holds a long background in commercial property research, having been Head of Research for major agency Savills and later starting and leading the research function for the Charter Hall Group, Australia's largest property fund manager with over $94bn in funds under management at time of writing. During this time Chris' insights were used to list and sell some of the largest buildings in the country and raise billions in capital. Chris later started AreaSearch believing there was a need in the market for a publicly available platform that pulls together many of the indicators he routinely used to assist with investment decisions, capital raising and sales.

Ronan O'Carroll, Director
Every software company needs an Irish tech person. For AreaSearch, that is Ronan. Ronan joined early on in the AreaSearch journey, significantly improving our systems and processes, applying technical skills and business experience to help across all facets of the company, with a relentless focus on elevating the user experience.

Kimberly Lagat, CFO
As our CFO, Kim has kept the house in order. A Chartered Accountant, Kim became an invaluable part of the AreaSearch team through her experience in the Property Funds Management industry, so has a strong background and understanding of our clients' needs.

Brandon Lloyd, Capital
The most ludicrously overqualified person in the company, Brandon has long been a leading global banker and commodities trader, with well established roles at Mitsui, Citi, SocGen, BNP and most recently Head of Financial Markets for Australia at ING. Brandon joined AreaSearch to leverage his connections and skills to help unlock value for an entirely new client base.

Mandi Milne, Clients and Content
Mandi has recently joined to oversee AreaSearch's marketing content, client liaison & training. Mandi's warm personality and broader perspective has proven invaluable to assisting clients understand the system and helps refine our sometimes technobabble content into something far more palatable.
Questions about the platform? Mandi is the person to ask.
Insights
Our own research.
Longer national studies, and short posts as new figures come out.
Where Australia built its childcare places
Read the feature → Economics · National featureReal GDP per capita under each Australian government
Read the feature →Latest posts
Plans
Two plans, and a free Snapshot of every area.
Dashboard and Full come with Operator and Pro, or are unlocked for an area by its Area Expert.
Operator
or $300 a year, billed yearly
- Who it suits
- Single operators who need standard reporting on fixed boundary areas, fast.
- Users
- Single user
- Credits
- 30 credits a month
- Included
- Dashboard and Full analysis area views. Word report included. Chart data downloads (CSV and XLSX).
- Add-ons
- None. Custom Area Analysis, whole sectors and packs are Pro only.
Pro
or $990 a year, billed yearly
- Who it suits
- Professionals and teams, including Area Experts. Start from the base and add only the sectors you need.
- Users
- Up to 5 users
- Credits
- 99 base credits a month
- Included
- Custom Area Analysis, not included in Operator. Development approvals pipeline, Target Search, Heatmaps and Economics.
- Add-ons
- Whole sectors, Retail or Medical, $500/mo each. Packs for Child Care, Aged Care and SDA / NDIS, $150/mo each.
Credits pay for reports, and 1 credit is worth $1. All prices include GST. No lock-in. Cancel any time.
How credits work
Members pay in credits and guests pay in dollars. A Base report on a suburb or postcode is 5 credits. On a custom area it is 5 credits on Pro and 50 on Operator. Economic reports are free.
Not sure which plan fits? Ask Mandi Milne, Clients and Content.
Are you a local expert? Become an Area Expert for your area. About the Area Expert programme →