On this page
General information only — not financial, investment, legal, or tax advice. Verify all data independently and seek professional advice before making investment decisions. Full disclaimer.
Looking at hospital provision? This guide covers GP, allied health, and specialist medical services. For hospital catchment analysis, bed supply, and utilisation data, see our dedicated hospital assessment guide →
Australia's healthcare sector sits on deep demographic foundations — an ageing population, rising chronic disease prevalence, and growing per-patient spending. The challenge for investors and operators is matching the right services to the communities that need them most: catchments where the population profile, existing competition, and service mix all point to genuine unmet demand. Service quality matters enormously, but so does location — the best clinical team in the wrong catchment will struggle to operate at its full potential.
These foundations are structural. Australia's population is ageing fast, and the over-80 cohort — the patients who need the most care — is growing quickest of all. Older patients see a GP several times more often than working-age adults, and once a chronic condition appears it generates repeat visits for a decade or more. The structural demand is rising on every axis: more older people, more conditions per person, and more spending per patient as they age. Supply cannot keep pace — held back by a training pipeline measured in decades and tight limits on where overseas-trained doctors can bill.
Why site-level analysis changes everything: Two {PAIR_ADJACENCY}metro SA4 regions — {EXAMPLE_HIGH_NAME} and {EXAMPLE_LOW_NAME} — differ sharply on headline population per GP. But zoom to site level and the story can flip: a site inside the “underserved” SA4 may sit near a medical precinct where provider density is actually high. A site inside the “adequately served” SA4 may reveal a pocket where thousands of residents share a single practice. Boundary-based SA4 averages do not reveal such nuances, which could be make or break for a new medical operator. See the full worked example →
With {NATIONAL_POP_65_PLUS} Australians aged 65+ ({NATIONAL_POP_65_PCT} of the population) and a national average of {NATIONAL_POP_PER_GP} residents per GP, supply pressure concentrates in specific metro catchments. The five most underserved metro SA3 regions by population per GP:
- {TOP_GP_UNDERSERVED_AREA_1} — {TOP_GP_UNDERSERVED_POPPER_1} residents per GP, 65+ population {TOP_GP_UNDERSERVED_65PCT_1}
- {TOP_GP_UNDERSERVED_AREA_2} — {TOP_GP_UNDERSERVED_POPPER_2} residents per GP, 65+ population {TOP_GP_UNDERSERVED_65PCT_2}
- {TOP_GP_UNDERSERVED_AREA_3} — {TOP_GP_UNDERSERVED_POPPER_3} residents per GP, 65+ population {TOP_GP_UNDERSERVED_65PCT_3}
- {TOP_GP_UNDERSERVED_AREA_4} — {TOP_GP_UNDERSERVED_POPPER_4} residents per GP, 65+ population {TOP_GP_UNDERSERVED_65PCT_4}
- {TOP_GP_UNDERSERVED_AREA_5} — {TOP_GP_UNDERSERVED_POPPER_5} residents per GP, 65+ population {TOP_GP_UNDERSERVED_65PCT_5}
01The opportunity right now
A structural tailwind that compounds over the lease term
Medical practice investment differs from most property asset classes because demand is driven by population ageing, and the asset class spans a diverse range of service types — from bulk-billed GP through to specialist allied health, diagnostics and pharmacy, not to mention hospitals, which we cover in full here. As people age they visit GPs more often, spend more per visit, and lean harder on allied health across the board.
Scale of the sector
Medicare pays out {MEDICARE_GP_ANNUAL_BENEFITS_BN} a year in GP benefits alone ({MEDICARE_GP_BENEFITS_PER_PERSON} per person), on top of the allied-health, specialist and imaging schedules. Health care and social assistance is the largest employing industry in the country at {NATIONAL_HEALTH_INDUSTRY_PCT} of the workforce. It is a large, government-underwritten market with demand in every suburb.
A Medicare-backed demand floor
{BULK_BILLING_RATE_NATIONAL} of GP attendances are bulk-billed, and every allied-health discipline has its own Medicare and private-health rebate channel. People get sick regardless of the economy, so revenue is more predictable than in most property sectors.
The structural tailwind — ageing and chronic disease
The 65+ cohort visits GPs at {GP_VISIT_RATE_65_PLUS} versus {GP_VISIT_RATE_25_44} for working-age adults, and leans harder on physiotherapy, podiatry, audiology and optometry too. The effects compound at two age thresholds: {NATIONAL_POP_65_PCT} of the population is already over 65, and the 80+ cohort — where chronic-disease burden, mobility limits and care intensity all step up — is growing fastest of all. A patient who develops Type 2 diabetes at 55 generates {DIABETES_GP_MGMT_VISITS} GP management visits a year for life, plus allied-health referrals and specialist follow-up. More people ageing, more conditions per person, more spending per patient.
Diversity — GP is not the whole asset class
"Medical" is really a stack of distinct sub-markets that behave differently: bulk-billed GP (high volume, thin margin), private GP and specialists (income-gated), referral-fed allied health (physiotherapy, psychology, podiatry), convenience health-retail (pharmacy, optometry), direct-access clinical (dental), and capital-heavy diagnostics (imaging, pathology). Each has its own catchment size, its own benchmark, and its own gap — exactly why a per-category benchmark read matters.
Cyclical position — workforce is the supply-side constraint
Unlike retail or office, medicine's cycle is constrained more by workforce than by construction. GP training takes {GP_TRAINING_YEARS}; international medical graduates face a {OTD_MORATORIUM_YEARS} moratorium restricting Medicare billing to Distribution Priority Areas. A well-located practice with an established patient base holds structural value because new supply is slow to respond — the training pipeline and regulatory constraints act as a natural brake on competition. And the variation is intensely local: the average distance from a resident to their nearest GP ranges from {SA4_GP_DIST_METRO_MIN} to {SA4_GP_DIST_METRO_MAX} across metro SA4 regions, and finer geographies vary more still. A catchment that looks adequately served for a 35-year-old can be critically undersupplied for an 80-year-old.
02Using AreaSearch for medical
Two starting points — the tools are the same, the entry point differs
AreaSearch's medical analysis tools work for two different situations. The path you take depends on where you're starting from:
I'm searching for opportunities
You don't have a specific site yet. You want to find underserved catchments where a new practice would be viable.
- Use the heatmap to scan for medical supply gaps and health condition prevalence
- Use Medical Benchmarks for national and state-level supply context across all categories
- Use Target Search to filter nationally by 65+ density, medical supply, income band
- Read area profiles (Health + Medical sections) for shortlisted regions
- Run a custom catchment around candidate sites to confirm with competition-adjusted figures
I have a site to evaluate
A specific address has come across your desk. You need to know whether the demand supports a practice before committing to a lease.
- Read the area profile for the suburb — Health, Age, Income, Medical sections — free, no sign-up
- Run a custom catchment around the address for site-specific demand and competition-adjusted effective population
- Check the MMM classification and DPA status for workforce implications (Section 04)
- Check the site fit against NCC classification and practice economics (Section 04)
The tools are described in detail below. For most users, the area profile is the right starting point — it's free, covers any area in Australia, and gives you health demographics + medical supply context in one click.
The heatmap — broad scan
The homepage choropleth heatmap lets you toggle medical layers — provider accessibility across categories, health condition prevalence, 65+ density — across the entire country. Within thirty seconds you can identify the regions where supply pressure and chronic disease demand concentrate. Use it to narrow your focus to the sub-regions worth drilling into.
Area and suburb profiles — free taster
Open any suburb or SA2 area profile and read the five sections that matter for medical site selection:
- Age section. 65+ cohort size and percentage — the primary demand driver. If 65+ is above the national average and the growth trajectory is positive, demand will be rising for years, not just holding steady. Check the 0–4 cohort too: high birth rates signal paediatric and immunisation volume.
- Health section. Chronic disease prevalence by condition — diabetes, heart disease, mental health, asthma — benchmarked against all SA2s nationally via percentile rank. Top-quartile chronic disease across multiple conditions signals high repeat-visit demand.
- Income, SEIFA and private health insurance. Median household income above the national median, higher SEIFA decile, and strong private health insurance coverage together signal tolerance for private billing and specialist gap fees. Lower-income catchments signal bulk-billing dependency — a different business model, not necessarily a weaker one. All three indicators are in the area profile.
- Employment. Health industry employment share signals an established medical precinct (co-location opportunity). High workforce inflows signal daytime population for a practice in a commercial location — demand that doesn't show up in the residential count.
Medical Benchmarks — sector context
The Medical Benchmarks page gives you the cross-area view that a single area profile can't. National pop-per-provider benchmarks across {MEDICAL_CATEGORY_COUNT} categories. SA4-level accessibility heatmaps. Use it to build a shortlist of regions worth investigating in depth, and to understand where your candidate site sits relative to the broader market.
Target Search — multi-criteria shortlisting
Target Search is reverse-engineered location analysis. Define success criteria — medical supply gaps by category, 65+ density above a threshold, household income band, health condition prevalence — and the platform returns a ranked list of catchments matching all of them, anywhere in Australia. Pro tier.
Custom catchment — the site-specific decision tool
This is the workhorse. Pro tier. Draw a catchment around any address — radius, polygon, or drive-time isochrone ({GP_DRIVE_TIME_PRIMARY} mirrors patient behaviour). The custom catchment gives you competition-adjusted effective population — the residents actually reachable by a practice at that site once nearer competitors take their share. For medical, the behavioural catchment matters more than most sectors: elderly patients travel shorter distances, so their effective catchment is smaller. The map also carries lot-level planning layers — statutory zoning, development controls such as building height, and heritage items.
Every medical report ordered from the website includes a tenancy verification step. The platform's data updates continuously, but before a report is delivered, the tenant register is cross-checked and additional online searches are carried out to catch any missing records, bad geocoding, or cases of retailers not updating their websites. The supply side of the equation is only as good as the tenant count, and this step makes sure nothing is missed.
03The signals that matter
The numbers that reveal whether a medical site decision is worth making
Local demand profile
Key Local Employment Industries
Income & billing model. Median household income above the national median ({NATIONAL_MEDIAN_INCOME_ANNUAL_K}), combined with higher SEIFA decile and private health insurance coverage ({PRIVATE_HEALTH_INSURANCE_PCT} nationally hold cover), signals tolerance for private billing and specialist gap fees. At lower rates, bulk-billing is the expected model — viable with volume, but different unit economics.
GP visits per year by age group
Older cohorts drive significantly more GP visits per year than working-age adults
Age structure. The 65+ cohort visits GPs at {GP_VISIT_RATE_65_PLUS}, compared to {GP_VISIT_RATE_25_44} for working-age adults. A catchment well above the national average of {NATIONAL_POP_65_PCT} over-65 generates fundamentally different workload — and that gap widens further as the 80+ share grows.
Higher prevalence = higher repeat-visit demand per patient
Chronic disease prevalence. {CHRONIC_DISEASE_PREVALENCE}. Each chronic condition generates repeat GP visits for ongoing management, compounding directly into workload and billings.
Medicare utilisation
GP attendance and spending trends up-to-the-quarter
per 100 people
Growth to FY41
per GP Service
Medicare data shows the structural signals above translated into actual service volume, spending, and government support. General practice receives the most extensive coverage by far, with practically all patients covered on some level by the scheme.
GP attendances relative to population are generally higher in lower socioeconomic areas while the opposite is true for allied health, diagnostic imaging and specialist services.
Historical & Projected GP Attendances by Age Cohort
Projected demand growth is driven primarily by the 65+ cohort — the age group with the highest per-capita GP utilisation
AreaSearch projects local GP attendances forward by age cohort using population forecasts and current per-capita utilisation rates, with the 65+ cohort driving the steepest growth nationally.
Note: these projections do not account for future changes in benefits schedule coverage.
Medicare Services per 100 People
Catchment vs national service mix highlights local demand patterns
GP attendances dominate the service count. While far less services are covered in allied health, imaging and specialist categories, per-capita statistics relative to broader benchmarks reveal local requirements.
Supply proximities
Distances from the site and the catchment's residents to their nearest providers can reveal convenience, and overall provision gaps.
Illustrative catchment. Distance to nearest provider is computed for all {MEDICAL_CATEGORY_COUNT} categories — categories beyond the Greater Sydney benchmark distance signal an access gap.
Supply and demand relativities
.
| Category | Count | Catchment Pop per provider | Site Peak Effective pop | National pop per |
|---|
Catchment and site columns are illustrative. National pop per provider from AreaSearch location data ({MEDICAL_CATEGORY_COUNT} categories tracked). Heatmap shading denotes percentile rank — darker = higher relative undersupply.
Effective Population by Distance
Daily population adjustment adds daytime worker demand to the resident base — material in CBDs and employment precincts.
When charted, effective population analysis gives insight into changing catchment dynamics across various distances, allowing users to assess primary target markets and changes in market share as competition increases.
- Does your site hit the regional pop per provider benchmark?
- Within what distance?
- What is its market share at that distance?


Incoming supply — what is in the DA pipeline
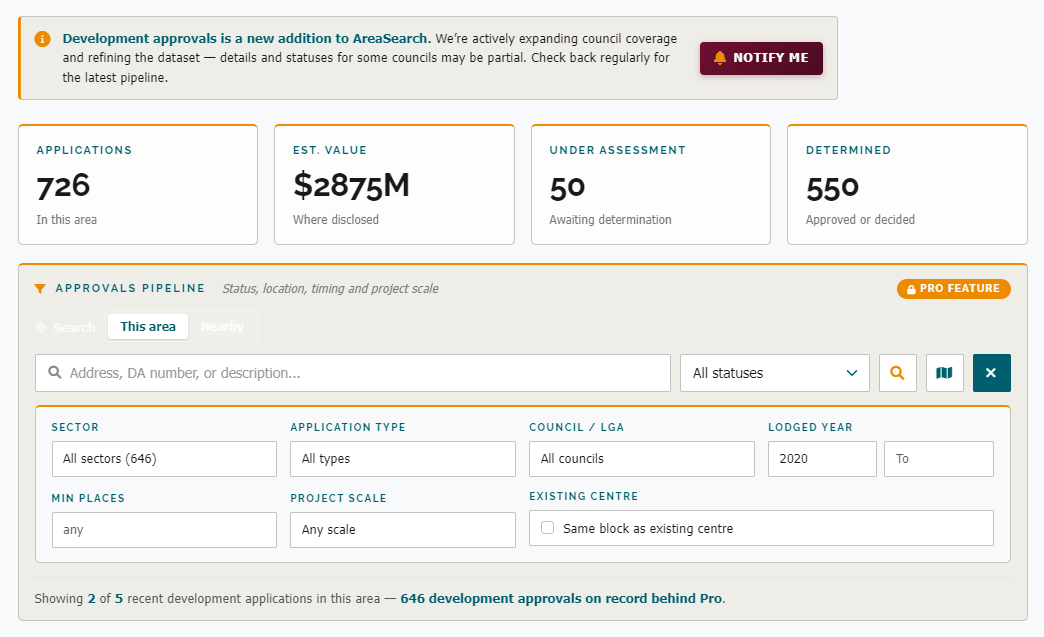
Supply/demand ratios in this section cover what is already operating. A site that looks undersupplied today can be saturated within {MEDICAL_ABSORPTION_TYPICAL} if approved developments are in the pipeline. Council DAs are where the forward supply shows up — approved but not yet built, applications under assessment, and clusters of lodgements that signal other operators have spotted the same opportunity.
AreaSearch's Custom Catchment report scans the DA register within the catchment radius and lists each application — address, status, lodgement date, estimated value, and distance from the site. The report tracks the trailing approval rate and the 12-month count, so you can see whether the pipeline is accelerating or cooling without manually searching council portals.
Co-location and clustering
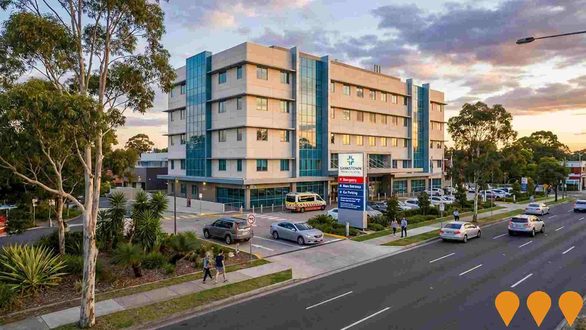
The benefits of colocation are obvious. For allied health providers in particular, however, proximity to referring GPs can be the most important site-selection factor. The GP writes the referral and the patient fills it at the most convenient location. A physiotherapy practice 200 metres from a busy group GP clinic will capture a very different referral flow than one 2 km away. Co-location within a medical precinct — or at minimum within the same shopping strip or commercial centre — is the allied health equivalent of the childcare school-catchment lens.
Hospital proximity can be an additional factor for some disciplines. Physiotherapy and occupational therapy practices near a major hospital may attract post-surgical rehabilitation referrals, for example. If hospital adjacency is central to your thesis, our hospital investment how-to covers that side in depth.
The AreaSearch medical benchmarks page covers co-location statistics by catchment, and the medical detail section of any area profile maps GP clinics, allied health tenancies, and persons-per-tenancy ratios — use it to identify where GP density is high but allied health supply is thin.
04The site fit
GP and allied health economics, building classification, and the workforce check
You have found a catchment with the right demographic profile and clear undersupply. What do the economics look like at this site? The answer looks quite different for GP and allied health, so this section covers both.
GP practice economics
MBS rebate structure — the revenue foundation
Almost all GP revenue flows through the Medicare Benefits Schedule. The standard consultation items (Level A through D) determine gross revenue per patient encounter:
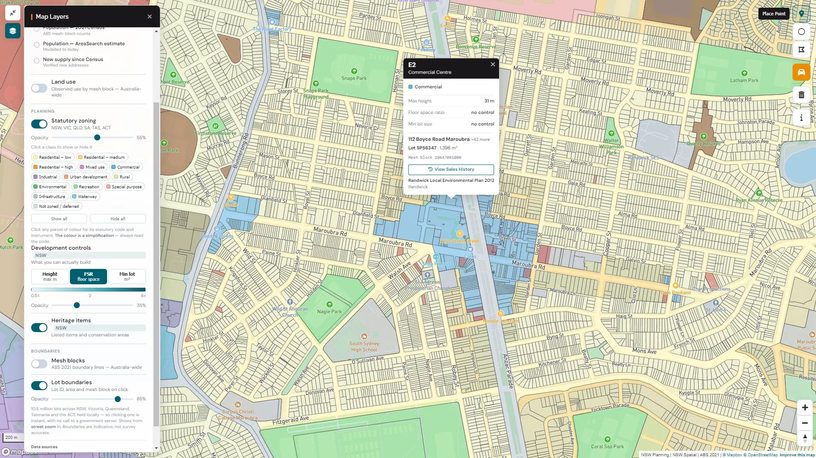
Statutory zoning, development controls and lot boundaries on the map — click any lot for its zoning code and controls.
| Item | Description | Schedule fee | Typical duration |
|---|---|---|---|
| Level A | Brief attendance | {MBS_LEVEL_A_REBATE} | {MBS_LEVEL_A_DURATION} |
| Level B | Standard consultation | {MBS_LEVEL_B_REBATE} | {MBS_LEVEL_B_DURATION} |
| Level C | Prolonged consultation | {MBS_LEVEL_C_REBATE} | {MBS_LEVEL_C_DURATION} |
| Level D | Extended consultation | {MBS_LEVEL_D_REBATE} | {MBS_LEVEL_D_DURATION} |
Level B is the workhorse — it accounts for the majority of GP consultations nationally. Revenue per GP FTE ranges from {REVENUE_PER_GP_FTE_ANNUAL} depending on patient throughput, billing model, and item mix.
Billing model — the margin driver
The billing model your practice can run is determined by the catchment's income profile — Section 03 gave you the demand and revenue signals; this is where those signals meet the business case. Three models, each with different economics:
- Bulk-billing: Patient pays nothing; practice receives the MBS rebate + bulk-billing incentive ({BULK_BILLING_INCENTIVE_METRO} per consult in metro, all Medicare-eligible patients). High volume, lower per-consult margin. Breakeven at {BREAKEVEN_PATIENTS_PER_DAY} patients per GP per day. Currently {BULK_BILLING_RATE_NATIONAL} of GP consultations nationally.
- Mixed billing: Bulk-bill concession and children; gap-charge private patients. The most common model for new practices. Balances volume with margin.
- Private billing: All patients pay the full fee; Medicare reimburses the patient {GP_MEDICARE_REBATE_PCT} of the schedule fee for a GP attendance (the {SPECIALIST_OOH_REBATE_PCT} rate applies to out-of-hospital specialist services, not GPs). The patient's out-of-pocket is the gap between the doctor's fee and that rebate — average gap {AVG_GAP_FEE_PRIVATE}. Requires a high-income catchment with demonstrated private-billing tolerance.
The GP contractor model is standard: the practice retains {PRACTICE_RETAIN_PCT} (the GP takes {GP_TAKE_HOME_PCT}). Practice EBITDA margins of {EBITDA_MARGIN_MEDICAL} are achievable for well-run operations.
Fitout and site requirements
GP consulting rooms are typically NCC {NCC_CLASS_MEDICAL_CONSULTING}. Standard consulting suites remain Class 5 (office); the upgrade to Class 9a (health-care) is triggered when patients receive treatment and may need assistance to evacuate — day surgery, dialysis, chemotherapy.
| Practice model | Typical size | Consulting rooms | Parking |
|---|---|---|---|
| Small (solo/duo) | {GP_PRACTICE_SIZE_SMALL} | {GP_PRACTICE_ROOMS_SMALL} | {GP_PRACTICE_PARKING_SMALL} |
| Medium (group) | {GP_PRACTICE_SIZE_MEDIUM} | {GP_PRACTICE_ROOMS_MEDIUM} | {GP_PRACTICE_PARKING_MEDIUM} |
| Large (super clinic) | {GP_PRACTICE_SIZE_LARGE} | {GP_PRACTICE_ROOMS_LARGE} | {GP_PRACTICE_PARKING_LARGE} |
Consulting rooms require a minimum of {CONSULTING_ROOM_MIN_AREA}; treatment rooms {TREATMENT_ROOM_MIN_AREA}. Parking at {PARKING_MEDICAL_CONVENTION}. Ground floor or lift access is essential for any medical or allied health practice serving elderly patients (DDA compliance + practical mobility access).
Occupancy cost and lease terms
Whatever the billing model, rent has to stay in proportion to revenue. Target total occupancy cost — rent plus outgoings as a share of gross revenue — at {OCCUPANCY_COST_TARGET_PCT}; above {OCCUPANCY_COST_STRESS_PCT} the practice is stressed, and a dip in volume could tip it into loss. This ratio is the fastest way to sanity-check a rent quote against the catchment's realistic patient throughput — and it applies equally to an allied-health suite billing sessions as to a GP practice billing consults.
Medical leases typically run {LEASE_TERM_MEDICAL}, with options often extending toward {LEASE_EXTENSION_TYPICAL}. A longer term suits a purpose-built fit-out you are amortising; a shorter term with options preserves flexibility if you are testing a new catchment. Either way, read the make-good, outgoings and rent-review clauses against the occupancy-cost ceiling above before you sign.
Allied health and other medical services
Revenue model — referral-dependent and mixed-source
Allied health revenue comes from three sources, and the mix varies sharply by discipline:
- Medicare-subsidised sessions: GPs can refer patients to allied health under Chronic Disease Management (CDM) plans — up to {CDM_ALLIED_SESSIONS} Medicare-subsidised allied health sessions per calendar year. Mental Health Treatment Plans (MHTP) allow up to {MHTP_PSYCHOLOGY_SESSIONS} subsidised psychology sessions. These are the base-load referral channels. The Medicare rebate per session is lower than a GP Level B consult, so volume and throughput matter.
- Private health insurance (extras cover): PHI extras rebates for physio, chiro, podiatry, optical, dental. The catchment’s PHI coverage rate (from Section 03e) directly determines what share of patients have rebate access. High-PHI catchments support higher session fees.
- Out-of-pocket / self-referred: Physio, chiro, massage, and exercise physiology have significant self-referral volume. These patients are not referral-dependent — they are driven by proximity, reputation, and convenience. Higher-income catchments support higher out-of-pocket tolerance.
Site requirements by practice type
Most non-GP medical practices are smaller and less capital-intensive than GP. The table below groups the {MEDICAL_CATEGORY_COUNT} categories AreaSearch tracks (excluding GP) by their space profile:
| Type | Disciplines | Typical size | Rooms / layout |
|---|---|---|---|
| Consulting-room based | Psychology, chiropractic, podiatry, psychiatry, audiology | 50–150 m² | 1–4 consulting or treatment rooms. Audiology requires an acoustic testing booth. |
| Treatment + exercise space | Physiotherapy | 120–300 m² | 2–4 treatment rooms + gym / exercise area |
| Consulting + retail | Optometry, pharmacy | 80–200 m² | 1–2 exam or consulting rooms + retail dispensing area |
| Dental | Dental | 55–150 m² | 1–4 chairs. Requires specialist plumbing, suction lines, and sterilisation zone. |
| Diagnostic / collection | Pathology, diagnostic imaging | 40–300+ m² | Pathology: collection room + waiting. Imaging: equipment-dependent (X-ray, ultrasound, MRI) with shielding requirements. |
| Multi-discipline group | Any combination | 150–400 m² | 4–8 rooms across disciplines |
Fitout costs for most allied health and consulting-room practices run {FITOUT_COST_ALLIED_PSM}. Dental is higher — typically {FITOUT_COST_DENTAL_PSM} due to plumbing, suction and sterilisation infrastructure. Diagnostic imaging varies widely depending on equipment.
The practitioner model differs from GP: allied health practitioners are typically employees or sole operators, not contractors on a billing split. This means the practice bears the wage cost directly rather than paying a percentage of billings — making occupancy rate and session throughput the critical margin levers. NCC classification is generally Class 5 (office) unless the practice includes hydrotherapy, day rehab, or other treatment that triggers Class 9a.
The workforce check — MMM classification and DPA status
A catchment can have the right demographic profile, genuine undersupply, and viable practice economics — and still fail if you cannot recruit the practitioners to fill the rooms. For GP in particular, workforce availability is a common constraint; for allied health it is less acute but still material in regional and outer-suburban catchments.
The Modified Monash Model classifies every location in Australia on a {MMM_TIERS_TOTAL}-tier scale from MM1 (major metropolitan) to MM7 (very remote). This classification directly determines workforce access and government incentive eligibility:
| Tier | Classification | Workforce implication |
|---|---|---|
| MM1 | Major cities | Standard GP recruitment from domestic workforce. No DPA incentives. Competitive market — you are recruiting against established practices. |
| MM2 | Regional centres (pop ≥{MMM2_POP_THRESHOLD}) | Moderate recruitment challenge. Some areas designated DPA. Higher bulk-billing incentive ({BULK_BILLING_INCENTIVE_RURAL}). |
| MM3 | Large rural towns ({MMM3_POP_RANGE}) | Material recruitment difficulty. Most areas are DPA — access to overseas-trained doctors (OTDs). |
| MM4–5 | Medium to small rural | Significant challenge. Almost all DPA. Government incentive programs (RRIP, ASGC-RA rebate loadings) available. |
| MM6–7 | Remote / very remote | Critical workforce shortage. Different practice model required — typically salaried, not contractor. |
Distribution Priority Areas (DPA) are the critical workforce mechanism. {DPA_DEFINITION}. OTDs face a {OTD_MORATORIUM_YEARS} moratorium restricting Medicare billing access to DPA areas only. This has a direct consequence for site selection: if your site is MM1 and not DPA, you are recruiting exclusively from the domestic GP workforce. If the site is DPA-designated, you can access the international pipeline.
AreaSearch flags MMM classification and DPA status in every area profile, so you can validate workforce assumptions before they become lease commitments.
How the calculator works
Pick a practice category from the selector below — the calculator loads the right economic model for it. Medical isn't one business type, so each model differs: GP revenue flows from MBS rebates and gap fees, with the GP contractor split as the largest cost line; allied health (physiotherapy, psychology, podiatry, chiropractic, psychiatry) is room- and session-based with practitioners as employees; dental is chair-based with an associate commission split plus lab costs; and diagnostics (pathology, imaging) is volume-per-machine with an equipment-capex view. Adjust the sliders and switch to Greenfield / Capex to add fitout or equipment. Set the inputs for your practice and request your cash flow model — we email you the full model (revenue, EBITDA, returns and a year-by-year cash flow) built from your settings. Pharmacy is a retail format — selecting it links to the pharmacy returns calculator, which handles dispensing margin and front-of-shop economics. Optometry and audiology link to the retail returns calculator for product-margin economics.
Medical Practice Returns Calculator
Sensitivity — EBITDA at different consultation volumes
This calculator is a financial modelling tool provided by AreaSearch for indicative analysis only — not investment, tax, or legal advice. Excludes PIP incentive payments, Medicare rebate indexation timing, and practice-specific factors. GP revenue model uses Level B as the base item — actual item mix will vary. Seek independent financial advice before committing capital.
05Worked example
{EXAMPLE_HIGH_NAME} vs {EXAMPLE_LOW_NAME} — two {PAIR_ADJACENCY}SA4 regions in Greater {PAIR_METRO}, with materially different GP supply profiles.
{EXAMPLE_HIGH_NAME} and {EXAMPLE_LOW_NAME} are two {PAIR_ADJACENCY}SA4 regions in Greater {PAIR_METRO}. Both are predominantly residential. Their population per GP practice — {EXAMPLE_HIGH_POP_PER_GP} and {EXAMPLE_LOW_POP_PER_GP} respectively — suggest very different supply levels. On the surface, the region with the higher ratio looks like the stronger opportunity.
| {EXAMPLE_HIGH_NAME} | {EXAMPLE_LOW_NAME} | |
|---|---|---|
| Population per GP practice | {EXAMPLE_HIGH_POP_PER_GP} | {EXAMPLE_LOW_POP_PER_GP} |
| Population 65+ | {EXAMPLE_HIGH_POP_65_PCT} | {EXAMPLE_LOW_POP_65_PCT} |
| 65+ forecast growth | {EXAMPLE_HIGH_POP_65_GROWTH} | {EXAMPLE_LOW_POP_65_GROWTH} |
| Long-term conditions prevalence | {EXAMPLE_HIGH_LONGTERM_CONDITIONS} | {EXAMPLE_LOW_LONGTERM_CONDITIONS} |
| Median household income | {EXAMPLE_HIGH_INCOME} | {EXAMPLE_LOW_INCOME} |
The supporting metrics — ageing profile, condition prevalence, forecast growth, and income — shape both the volume and type of demand each region generates. But a region is a large area, and GP practices are not spread evenly across it. Two sites — one in each SA4 — show what the numbers look like at street level.
{EXAMPLE_DPA_NOTE}
Site-level analysis — where the regional average breaks down
A patient’s real choice set is the practices within a short drive, regardless of which statistical boundary they fall in. Pockets within an “undersupplied” region can sit next to a medical precinct, and pockets within a “well-supplied” region can have genuine gaps. Below are two illustrative site catchments that demonstrate exactly this.
Site A — {EXAMPLE_HIGH_NAME}
Illustrative site · SA4 pop per GP: {EXAMPLE_HIGH_POP_PER_GP}
Site inside the “underserved” SA4 · {SITE_A_GEO}
| {SITE_A_HDR_NEAR} | {SITE_A_HDR_DRIVE} | |
| Population | {SITE_A_POP_NEAR} | {SITE_A_POP_DRIVE} |
| Population 65+ | {SITE_A_POP65_NEAR} | {SITE_A_POP65_DRIVE} |
| 65+ forecast growth | {SITE_A_POP65_GROWTH_NEAR} | {SITE_A_POP65_GROWTH_DRIVE} |
| Peak effective population | {SITE_A_PEAKEFF_NEAR} | {SITE_A_PEAKEFF_DRIVE} |
| SA4 pop per GP practice | {EXAMPLE_HIGH_POP_PER_GP} | |
| Pop per GP practice | {SITE_A_POP_PER_PRACTICE_NEAR} | {SITE_A_POP_PER_PRACTICE_DRIVE} |
| DPA status | {SITE_A_DPA} | |
Category gaps: {SITE_A_CATEGORY_GAPS}
{SITE_A_VERDICT}
Site B — {EXAMPLE_LOW_NAME}
Illustrative site · SA4 pop per GP: {EXAMPLE_LOW_POP_PER_GP}
Site inside the “adequately served” SA4 · {SITE_B_GEO}
| {SITE_B_HDR_NEAR} | {SITE_B_HDR_DRIVE} | |
| Population | {SITE_B_POP_NEAR} | {SITE_B_POP_DRIVE} |
| Population 65+ | {SITE_B_POP65_NEAR} | {SITE_B_POP65_DRIVE} |
| 65+ forecast growth | {SITE_B_POP65_GROWTH_NEAR} | {SITE_B_POP65_GROWTH_DRIVE} |
| Peak effective population | {SITE_B_PEAKEFF_NEAR} | {SITE_B_PEAKEFF_DRIVE} |
| SA4 pop per GP practice | {EXAMPLE_LOW_POP_PER_GP} | |
| Pop per GP practice | {SITE_B_POP_PER_PRACTICE_NEAR} | {SITE_B_POP_PER_PRACTICE_DRIVE} |
| DPA status | {SITE_B_DPA} | |
Category gaps: {SITE_B_CATEGORY_GAPS}
{SITE_B_VERDICT}
The takeaway: The SA4-level population per GP practice said {EXAMPLE_HIGH_NAME} was underserved and {EXAMPLE_LOW_NAME} was adequate. The site-level catchment tells the opposite story. Regional figures are useful context — depending on them to commit a lease would be a serious mistake.
Sources: ABS · AIHW · APRA · Department of Health, Disability and Ageing · Medicare (MBS Online) · RACGP · AreaSearch. Updated {LATEST_REFRESH_DATE}. This article is a preliminary scoping resource. Make your own enquiries and seek independent professional advice before acting on any information here.