On this page
General information only — not financial, investment, legal, or tax advice. Verify all data independently and seek professional advice before making investment decisions. Full disclaimer.
New to pharmacy approvals? As if the demographic needs component was not difficult enough, figuring out where your site sits relative to the regulatory requirements adds another layer of complexity. We untangle the two-layer approval system, the Location Rules, and the state-by-state ownership rules in Section 04, the approval maze →
A pharmacy is a hybrid business. One half behaves like healthcare — script volume driven by an ageing population, GP referrals and the PBS — the other half like retail, with front-of-shop stock, margin and foot traffic. On top of this sits something few other retail or medical formats carry: a federal approval gate that decides whether its main offering, PBS medicines, can actually be dispensed at any given location. Getting a pharmacy business right means reading the local market to determine whether the dispensary and retail sides can together support a viable business, and clearing the approval.
The demand foundations are structural. Australia's population is ageing, and older residents fill far more scripts than working-age adults — retirement age GP use averages {GP_VISIT_RATE_65_PLUS}, and every one of those visits tends to generate a prescription. With {NATIONAL_POP_65_PLUS} Australians already aged 65+ ({NATIONAL_POP_65_PCT} of the population) and that share steadily rising, the script-demand floor lifts every year. Supply, by contrast, is structurally constrained: the Location Rules impact where new PBS dispensing pharmacies can open, and well-located operators enjoy predictable returns as competitors cannot simply open next door.
Why site-level analysis is everything: Take two {PAIR_ADJACENCY}metro SA4 regions — {EXAMPLE_HIGH_NAME} ({EXAMPLE_HIGH_POP_PER_PHARMACY} residents per pharmacy) and {EXAMPLE_LOW_NAME} ({EXAMPLE_LOW_POP_PER_PHARMACY}). The headline gap looks decisive, but it is built on the wrong denominator: dividing the PBS scripts each region actually dispenses by the pharmacies actually operating there can rank the two differently. And at street level neither regional figure decides anything — an individual site inside the “undersupplied” region can sit 800 m from an existing pharmacy, inside the 1.5 km minimum and unapprovable at any level of demand, while a site inside the “well-served” region can qualify under one of the alternative items. Boundary-based averages do not reveal the whole dynamic. See the full worked example →
AreaSearch tracks {PHARMACY_LOCATION_COUNT_ROUND} pharmacy locations working out to about {POP_PER_PHARMACY_AUS} residents per pharmacy nationally. These pharmacies fill an estimated {PBS_TOTAL_SCRIPTS} PBS scripts per year, generating {PBS_TOTAL_BENEFITS} in PBS benefits paid.
The largest networks by location count:
- {PHARMACY_TOP_NETWORK_1_NAME} — {PHARMACY_TOP_NETWORK_1_COUNT}
- {PHARMACY_TOP_NETWORK_2_NAME} — {PHARMACY_TOP_NETWORK_2_COUNT}
- {PHARMACY_TOP_NETWORK_3_NAME} — {PHARMACY_TOP_NETWORK_3_COUNT}
The most undersupplied SA2 areas by residents per pharmacy*:
- {UNDERSUPPLIED_SA2_1_NAME} — {UNDERSUPPLIED_SA2_1_POP_PER}
- {UNDERSUPPLIED_SA2_2_NAME} — {UNDERSUPPLIED_SA2_2_POP_PER}
- {UNDERSUPPLIED_SA2_3_NAME} — {UNDERSUPPLIED_SA2_3_POP_PER}
01The opportunity right now
Resilient demand, constrained supply and an expanding role in primary care
Although pharmacies are often co-located with conventional retailers—and may look similar from a leasing perspective—their underlying business model is markedly different. Demand is underpinned by the PBS, new competition is constrained by pharmacy location rules, staffing requires specialised qualifications, and an ageing population provides a strong long-term demand driver. These characteristics can make a well-located pharmacy a resilient and enduring business. However, the cost of misjudging local demand can be substantial once a business has committed to premises, specialised staff and inventory. However, the Location Rules do not eliminate competitive risk: new developments, pharmacy relocations and changing customer flows can materially reshape a local market.
Scale of the sector
AreaSearch tracks {PHARMACY_LOCATION_COUNT} pharmacy locations in total, or roughly one for every {POP_PER_PHARMACY_AUS} residents. The network is large and stable, {SECTOR_NETWORK_HISTORY}, with demand driven by the needs of local residents and proximity to GPs, medical centres, hospitals and aged-care facilities. An estimated {PBS_TOTAL_SCRIPTS} PBS scripts are filled per year — {PBS_SCRIPTS_PER_GP} per GP attendance and {PBS_SCRIPTS_P100_ALL} per 100 people — amounting to {PBS_TOTAL_BENEFITS} in PBS benefit expenditure. The vast majority of pharmacy locations are PBS approved. Those which are not, such as compounding, private-script and cannabis pharmacies, are bound to a private-only revenue model.
A PBS-backed demand floor
Most of a pharmacy's script volume flows through the Pharmaceutical Benefits Scheme, and that demand is remarkably insensitive to the economy — people fill prescriptions regardless of the cycle. With {BULK_BILLING_RATE_NATIONAL} of GP attendances bulk-billed and every one a potential script, underlying demand is steadier than in almost any pure-retail format. The whole system is funded through the {CPA_CURRENT}, the agreement between the Commonwealth and the profession that sets dispensing remuneration and the Location Rules the sector runs on: {CPA_VALUE}, running {CPA_TERM}.
The structural tailwind — ageing
The 65+ cohort is the engine of script demand. Older residents visit a GP at {GP_VISIT_RATE_65_PLUS} versus far fewer for working-age adults, and each chronic condition generates repeat prescriptions for years. Already {NATIONAL_POP_65_PCT} of the population is over 65 ({NATIONAL_POP_65_PLUS} people), and the fastest-growing cohort of all is the 80+ group, where medication use steps up sharply. More older people, more conditions per person, more scripts per person — the demand curve only steepens over a typical lease term.
The headwind — 60-day prescriptions
The counterweight is pressure on dispensing frequency. {DISPENSING_60DAY} means eligible patients with stable, ongoing conditions now collect two months of supply for one dispensing fee instead of one — compressing dispensing-fee revenue on the affected scripts and reducing foot-traffic. It is fully rolled out and priced into the market in {LATEST_REFRESH_DATE}, and makes a front-of-shop stream and a genuinely undersupplied catchment matter more than before.
The offsetting tailwind — scope of practice
Pushing the other way is a widening clinical role. {SCOPE_EXPANSION}. The policy direction is clear: services initially trialled for vaccinations, uncomplicated UTIs and hormonal contraception are being made permanent and extended to a broader range of common conditions. Although still modest relative to conventional dispensing, this creates a credible growth pathway through consultation and service revenue, diversifies pharmacy income and gives customers additional reasons to visit between prescription collections.
Cyclical position
Essential health-retail is resilient, but the macro backdrop still matters for financing and rents. The RBA cash rate sits at {CASH_RATE_CURRENT} ({CASH_RATE_DATE}), national unemployment holds at {AUS_UNEMP_CURRENT} ({AUS_UNEMP_DATE}), and health-related prices have risen {CPIHEALTH_12MO_AUS} over the past year. Population growth remains a structural tailwind, with annual net overseas migration adding {AUS_NOM_LATEST} ({AUS_NOM_DATE}) — every new household needs a pharmacy within reach. Steady employment and sustained population growth support demand while elevated rates and input costs are important to consider when stress testing an opportunity.
02Using AreaSearch for pharmacy
From national scan to site feasibility and approval
AreaSearch's tools work for two different situations. The path you take depends on where you're starting from:
I'm searching for opportunities
You want to find catchments where a new pharmacy would be both commercially viable and approvable.
- Use the heatmap to scan for pharmacy supply gaps and 65+ density across the country — view regional trends and zoom to areas of interest
- Use Target Search to filter nationally in bulk by socioeconomics, age cohorts and pharmacy undersupply
- Read area profiles for shortlisted regions
- Run a custom catchment around candidate sites to confirm the gap with competition-adjusted figures and full MBS and PBS analysis
- Check the site geometry against the Location Rules before you go any further (Section 04)
I have a site to evaluate
A specific address has come across your desk. You need to know whether the demand supports a pharmacy — and whether it can clear s90 — before committing to a lease.
- Read the area profile for the suburb — Age, Health, Income and more — free, no sign-up
- Run a custom catchment for site-specific supply and demand analysis
- Measure the distance to the nearest approved pharmacy, GP and supermarket — the exact metrics the Location Rules turn on (Section 04)
- Assemble the output as a needs-assessment evidence pack for your application — or order a report and we'll do it for you
The tools are described in detail below. For most users, the area profile is the right starting point — it's free, covers any area in Australia, and gives you age, health and local economic context in one click.
The heatmap — broad scan
The homepage choropleth heatmap lets you toggle layers — pharmacy accessibility, GP density, 65+ share — across the entire country. Within thirty seconds you can identify the regions where script demand and thin pharmacy supply overlap. Use it to narrow your focus to the sub-regions worth drilling into.
Area and suburb profiles — free taster
Open any suburb or SA2 area profile and read the sections that matter for a pharmacy site:
- Age section. The 65+ cohort size and percentage — the primary script-demand driver. A catchment above the national average of {NATIONAL_POP_65_PCT} over-65, with a positive growth trajectory, means demand rising for years. Check the 0–4 cohort too for baby and paediatric volume.
- Health section. Chronic-disease prevalence by condition — diabetes, heart, respiratory, mental health — benchmarked nationally by percentile. Higher prevalence means more repeat scripts per patient.
- Income and SEIFA. Higher income supports stronger front-of-shop spend and private-service uptake; lower-income catchments lean harder on bulk-billed scripts — a different, not weaker, model.
- Medical analysis. Time for custom catchment analysis.
Target Search — multi-criteria shortlisting
Target Search is reverse-engineered location analysis. Define success criteria — pharmacy undersupply, 65+ density above a threshold, household income band, scripts filled per capita, GP proximity — and the platform returns a ranked list of catchments matching all of them, anywhere in Australia. Pro tier.
Custom catchment — the needs-assessment evidence pack
This is the workhorse, and for pharmacy it doubles as the backbone of an application. Draw a catchment around any address — radius, polygon, or drive-time — and the report returns competition-adjusted effective population (the residents actually reachable once nearer pharmacies take their share), concentric-radial population accumulation, distance to the nearest approved pharmacy, GP and supermarket, incoming development pipeline, and extensive local GP and PBS utilisation analysis. Precisely the evidence a Location-Rules assessment weighs. The map also carries lot-level planning layers — statutory zoning, development controls and heritage items.
Every report ordered from the website includes a tenancy verification step. The platform's data updates continuously, but before a report is delivered the pharmacy and GP register within the catchment is cross-checked and additional online searches are carried out to catch rare cases of missing records, bad geocoding, or operators that have not updated their websites. The supply side of a Location-Rules case is only as good as the competitor count, and this step makes sure nothing is missed.
03The signals that matter
The numbers that reveal whether a pharmacy site decision is worth making
Co-location & proximity
For a dispensing pharmacy, proximity to prescribing GPs is not just convenient — it is written into the Location Rules and heavily influences the approval process. The doctor writes the prescription and the patient fills it at the nearest convenient pharmacy, so a pharmacy across the forecourt from a busy GP clinic captures a very different flow than one a few hundred metres away. Nationally the average resident is about {NATIONAL_GP_MEAN_DIST} from their nearest GP, with roughly {POP_PER_GP_AUS} residents per GP ({GP_COUNT_AUS} GPs), and {NATIONAL_PHARMACY_MEAN_DIST} from their nearest pharmacy.
Location Rules — standard item
- Pharmacy spacing: {LR_STANDARD_DISTANCE}
- GP & supermarket proximity: {LR_STANDARD_PROXIMITY}
Alternative items
- Shopping centre: {LR_SHOPPING_CENTRE}
- Medical centre: {LR_MEDICAL_CENTRE}
- Rural: {LR_RURAL_DISTANCE}
Local demand profile
Key Local Employment Industries
PBS prescriptions per person by age group — national benchmark
Script volume rises steeply with age — the 65+ cohort accounts for the bulk of PBS dispensing
Socioeconomics. Median household income above the national median, combined with higher SEIFA decile, signals stronger front-of-shop retail spend — vitamins, cosmetics, fragrance, baby. Lower income catchments can still be strong pharmacy sites, but the model skews toward dispensary volume.
Age structure & script demand. The 65+ share is the single best demographic proxy for script demand. That cohort visits GPs at {GP_VISIT_RATE_65_PLUS}. A catchment well above the national {NATIONAL_POP_65_PCT} over-65 average generates materially more scripts per resident — and that gap widens further as the 80+ share grows. The country overall records about {GP_SERVICES_PER_100_AUS} GP services per 100 people each year, the great majority generating at least one script. With {BULK_BILLING_RATE_NATIONAL} of attendances bulk-billed ({BULK_BILLING_QTR}), the script pipeline is broad-based rather than income-gated.
PBS utilisation by category
Each chronic condition generates repeat prescriptions for ongoing management — {PBS_TOP_CATEGORIES} medicines account for the bulk of PBS volume, and a catchment with above-average prevalence compounds directly into script demand.
Higher prevalence = more repeat prescriptions per patient
| PBS Category | 0‑18 | 19‑64 | 65+ | Total |
|---|---|---|---|---|
| Cardiovascular | 5.4% | 22.8% | 37.4% | 29.8% |
| Nervous System | 38.4% | 31.5% | 16.1% | 23.7% |
| Alimentary & Metabolism | 4.5% | 13.7% | 17.9% | 15.5% |
| Anti-infectives | 27.2% | 8.5% | 4.6% | 7.1% |
| Genitourinary & Hormones | 10.7% | 7.6% | 3.9% | 5.5% |
| Respiratory | 7.6% | 3.6% | 3.8% | 3.8% |
| Blood & Blood-forming | — | 2.6% | 5.5% | 4.0% |
| Musculoskeletal | — | 4.1% | 3.6% | 3.7% |
| Dermatologicals | 6.3% | 1.4% | 1.2% | 2.0% |
| Sensory Organs | — | 1.4% | 4.2% | 3.0% |
| Antineoplastic & Immunomod. | — | 2.8% | 1.8% | 2.0% |
| Total per 100 | 224 | 868 | 3,712 | 1,227 |
Share of scripts within each age cohort — shading = per-capita intensity ranked within cohort. Table data - illustrative.
Projections
GP Attendances by Age Cohort
Projected demand growth is driven primarily by the 65+ cohort — the age group with the highest per-capita GP utilisation and script demand
AreaSearch projects local GP attendances forward by age cohort at the catchment level using population forecasts and current per-capita utilisation rates, with the 65+ cohort driving the steepest growth nationally.
Note: these projections do not account for future changes in benefits schedule coverage.
PBS dispensing follows an even steeper age gradient than GP attendances. The 65+ cohort accounts for roughly half of all scripts despite being less than 16% of the population, while the under-18 cohort generates comparatively few.
Projections assume current per-capita dispensing rates hold; policy changes (e.g. 60-day prescriptions) may alter volumes.
PBS Prescriptions by Age Cohort
The 65+ cohort dominates PBS volume and drives virtually all projected growth in dispensing
The competitive environment
The headline supply metric is residents per pharmacy: nationally about {POP_PER_PHARMACY_AUS} people per location. But state and regional averages hide enormous variation. Across states the figure runs from {PPP_STATE_HIGH_VALUE} in {PPP_STATE_HIGH_NAME} down to {PPP_STATE_LOW_VALUE} in {PPP_STATE_LOW_NAME}; at SA4 level the spread is wider still, from {PPP_SA4_HIGH_VALUE} in the most stretched region to {PPP_SA4_LOW_VALUE} in the most saturated — a spread ratio of about {PPP_SA4_SPREAD_RATIO}.
Population per pharmacy by state
Residents per pharmacy varies widely by state — higher bars mean thinner supply. National average shown as the dashed benchmark line.
A raw catchment population can misrepresent what a pharmacy actually serves. A 'Concentric Radial' approach takes into account the position of both competitors and population clusters outputting an effective/competition adjusted population count. The below chart shows how a site's reachable market changes with distance as competition increases.
Effective Population with daily population adjustment
Daily population adjustment adds daytime worker demand to the resident base — material in CBDs and employment precincts.
Each site's competitive position is ranked against every pharmacy in the country.
Effective Population (x) vs. Distance to Nearest Competitor (y)
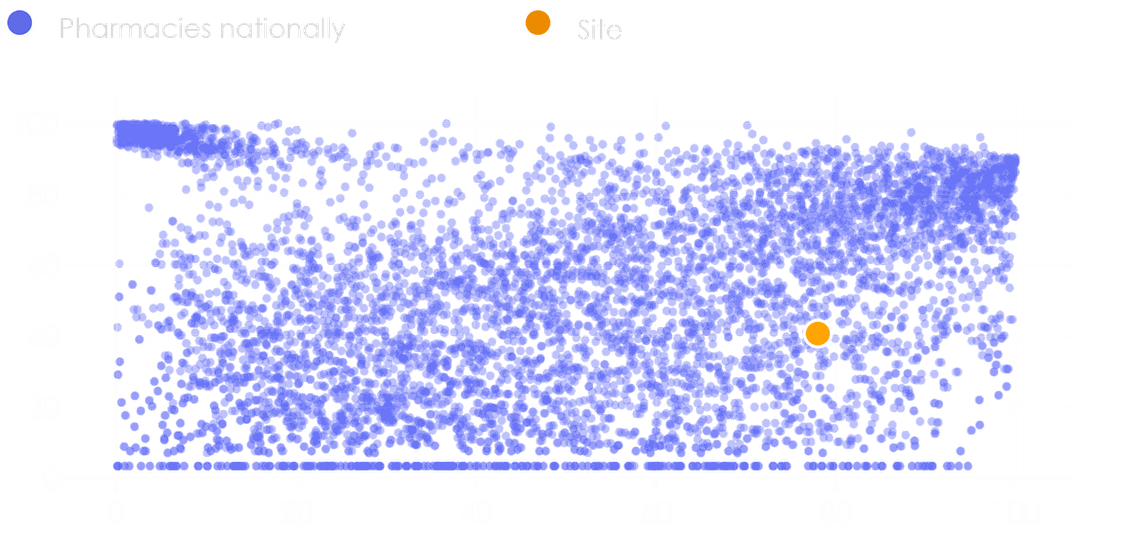
Each dot is an Australian pharmacy plotted by its competition-adjusted effective population and distance to its nearest competitor.
Incoming supply — the DA pipeline
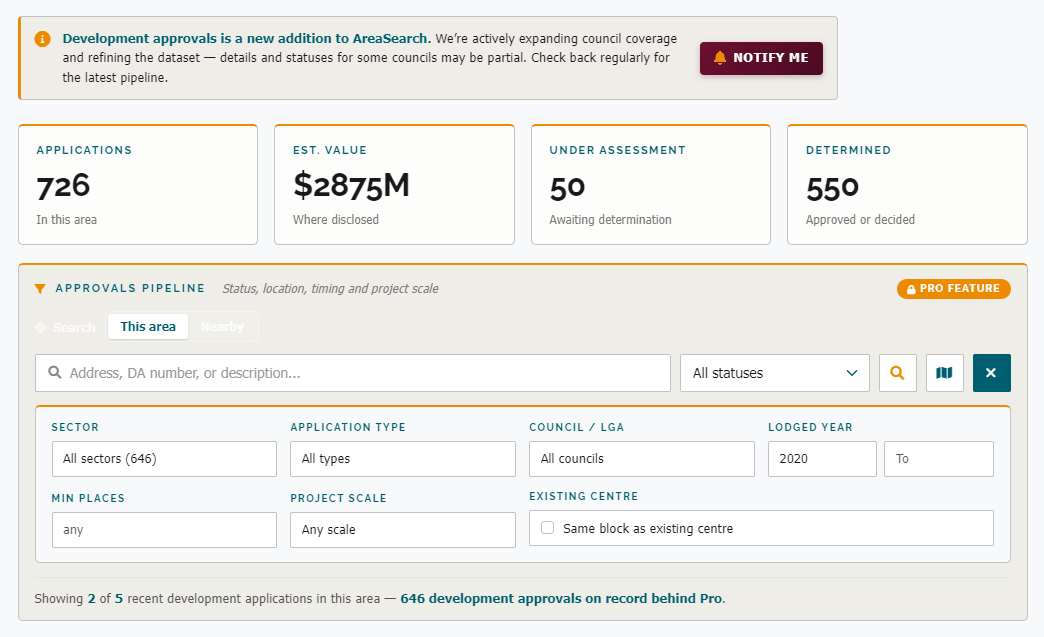
Supply-and-demand ratios describe what is already operating. A catchment that looks undersupplied today can be saturated within a couple of years if approved developments are in the pipeline — and for pharmacy, a new competitor landing inside your 1.5 km radius can end your s90 case before you open. Council DAs are where forward supply shows up: approved but not yet built, applications under assessment, and clusters of lodgements that signal other operators have spotted the same gap. AreaSearch scans the DA register within the catchment radius and tracks the trailing approvals trend, so you can see whether the pipeline is accelerating or cooling.
04The site fit
The first question is usually whether the PBS licensing rules are met
You have found a catchment with the right demographic profile and a genuine supply gap. Before the economics, a pharmacy faces a question no other retail or medical format does: is this site even approvable?
The approval maze — who actually decides
Almost everyone new to the sector conflates two completely separate approvals.
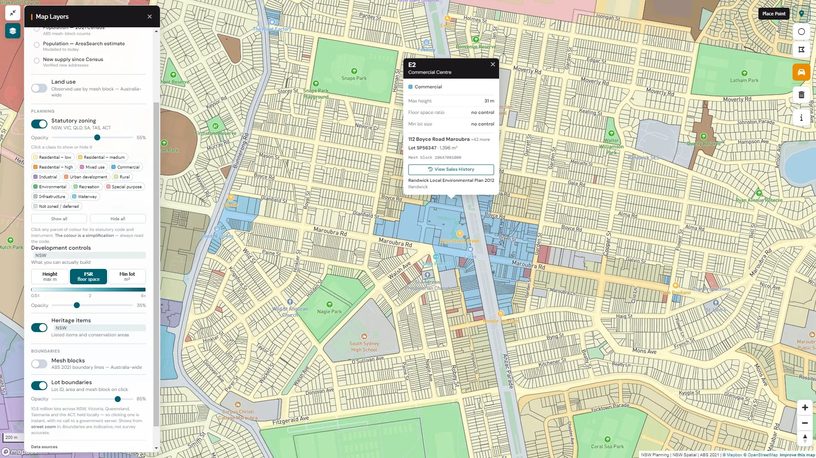
Statutory zoning, development controls and lot boundaries on the map — click any lot for its zoning code and controls.
- State/territory registration grants the right to operate a pharmacy business at premises — it governs who may own a pharmacy and the standards the premises must meet. It is issued by a state authority and the rules vary by jurisdiction (see the table below).
- Federal Section 90 approval, under the {PHARMACY_APPROVAL_ACT}, grants {S90_APPROVAL_DEF}. It is decided by the {HEALTH_DEPT_NAME} on the recommendation of the {ACPA_NAME}.
The two are independent. A pharmacy can legally operate without s90 — patients simply pay full private prices, the model behind some compounding, private-script and cannabis pharmacies — but without s90 it cannot dispense PBS medicines or claim Commonwealth reimbursement, which is where the volume is. The approval pathway itself is straightforward once you see it: {APPROVAL_PATHWAY}. The {ACPA_NAME} {ACPA_ROLE}, and it meets {ACPA_MEETING_CADENCE}.
Two more bodies complete the map, and naming them resolves the most common confusion. {GUILD_APPROVAL_CLARIFIER} — so despite its prominence it does not sit in your approval chain at all. Separately, {AHPRA_ROLE}, and {PPA_ROLE}. Registration of the pharmacist, approval of the premises, and payment of program claims are three different things handled by three different bodies.
The bodies that touch a pharmacy approval. State registration and federal s90 are independent; the guild negotiates but does not approve.
The Location Rules
The federal layer is uniform nationwide, and it hangs off one instrument: the {LR_INSTRUMENT}. These are the distance and proximity thresholds that decide whether a new pharmacy can win s90 at a given site — and they map exactly onto the metrics AreaSearch computes (nearest-competitor distance, GP proximity, supermarket proximity).
| Scenario | The threshold |
|---|---|
| New pharmacy (standard) | {LR_STANDARD_DISTANCE} {LR_STANDARD_PROXIMITY} |
| New pharmacy (rural / remote) | {LR_RURAL_DISTANCE} |
| Small shopping centre | {LR_SHOPPING_CENTRE} |
| Large medical centre | {LR_MEDICAL_CENTRE} |
| Relocations | {LR_RELOCATION_NOTE} |
The complete set of items, exclusions and relocation rules is in the {LR_HANDBOOK} — read it before you rely on any single threshold, because exclusions and definitions do the heavy lifting. The point for site selection is simple: measure the straight-line distance to the nearest approved pharmacy, the GP, and the supermarket first. If this check fails, the application faces a much harder path, regardless of demographic strength.
State by state — ownership & registration
Where the federal layer is uniform, the state layer is where the hurdles genuinely vary: who may hold an interest in a pharmacy, how many pharmacies one owner may hold, permitted corporate structures, and which authority registers the premises. No single government page consolidates this, so the table below is high-value — but treat it as a starting map and confirm each cell with the relevant authority before you commit.
| State / territory | Registering authority | Ownership cap | Permitted structures |
|---|---|---|---|
| VIC | {OWN_VIC_REGULATOR} | {OWN_VIC_CAP} | {OWN_VIC_STRUCTURES} |
| NSW | {OWN_NSW_REGULATOR} | {OWN_NSW_CAP} | {OWN_NSW_STRUCTURES} |
| QLD | {OWN_QLD_REGULATOR} | {OWN_QLD_CAP} | {OWN_QLD_STRUCTURES} |
| WA | {OWN_WA_REGULATOR} | {OWN_WA_CAP} | {OWN_WA_STRUCTURES} |
| SA | {OWN_SA_REGULATOR} | {OWN_SA_CAP} | {OWN_SA_STRUCTURES} |
| TAS | {OWN_TAS_REGULATOR} | {OWN_TAS_CAP} | {OWN_TAS_STRUCTURES} |
| ACT | {OWN_ACT_REGULATOR} | {OWN_ACT_CAP} | {OWN_ACT_STRUCTURES} |
| NT | {OWN_NT_REGULATOR} | {OWN_NT_CAP} | {OWN_NT_STRUCTURES} |
Queensland is mid-transition. {OWN_QLD_TRANSITION}. If you are looking at Queensland, treat this row as time-sensitive and confirm the current position directly with the Council.
What evidence helps
An s90 application is won on evidence, and the evidence a Location-Rules assessment weighs is exactly the output of the custom catchment described in Section 02: the competition-adjusted effective population, the measured straight-line distances to the nearest approved pharmacy, the full-time GP and the qualifying supermarket, and the incoming development pipeline. Packaged together, that is the needs-assessment evidence pack — the difference between asserting a catchment is undersupplied and demonstrating it.
Two-stream economics
Once a site is approvable, the business is a blend of two very different revenue streams. The dispensary is the demand-driven portion — typically around {DISPENSARY_REVENUE_PCT} of revenue — earning a regulated margin on PBS and private scripts. Front-of-shop is the retail portion — around {FRONT_OF_SHOP_PCT} — earning a merchandise margin on health, beauty and convenience lines. They behave differently: the dispensary is steadier but margin-compressed (the 60-day change bites here), while front-of-shop is more discretionary but higher-margin and more responsive to foot traffic and merchandising. Resilient pharmacies generally provide both.
Industry benchmark data (from the profession's published Guild Digest ranges) gives a feel for a typical established pharmacy:
| Benchmark | Typical range |
|---|---|
| Average pharmacy turnover | {AVG_PHARMACY_TURNOVER} |
| Blended gross margin | {PHARMACY_GROSS_MARGIN} |
| Wages (% of turnover) | {PHARMACY_WAGES_PCT} |
| Rent / occupancy (% of turnover) | {PHARMACY_RENT_PCT} |
| Dispensary throughput | {SCRIPTS_PER_WEEK_TYPICAL} scripts / week |
Lease, rent and physical factors
Rent has to stay in proportion to turnover. Occupancy cost — rent plus outgoings — running at {PHARMACY_RENT_PCT} is the benchmark; drift well above it and a dip in script volume can tip the business into loss. That ratio is the fastest sanity-check on a rent quote against the catchment's realistic throughput. Beyond rent, the physical factors that move a pharmacy are convenience-driven: co-location with or immediate proximity to a busy GP clinic, easy parking and pram/wheelchair access for older and less-mobile patients, visibility and walk-in foot traffic, and a supermarket anchor pulling routine trips past the door. A primary catchment is generally tight, spanning {PHARMACY_CATCHMENT_RADIUS}, so metres matter more here than in most retail formats.
How the calculator works
A pharmacy earns from two streams, so the calculator models both. The dispensary stream estimates script volume from catchment effective population, age mix and PBS prescription rates, then applies the average gross per script and dispensing margin; the front-of-shop stream is retail floor area × sales per m² × retail gross margin. Use the Operator / Investor toggle to pick your position and Lease / Buy / Build to pick your entry route — the inputs and outputs adjust to match. Inputs are grouped into three tabs: Site sets the floor area, Operation covers the two revenue streams, staffing and running costs to build EBITDA, and Property covers rent, acquisition or development cost, and exit assumptions to complete the return. Hover any dotted label for a tooltip. Set the inputs for your pharmacy and request your cash flow model — we email you the full model (revenue, EBITDA, returns and a year-by-year cash flow) built from your settings. Use it as a screening tool before a full feasibility study.
Pharmacy Returns Calculator
Sensitivity — EBITDA at different effective populations
This calculator is a financial modelling tool provided by AreaSearch for indicative analysis only — not investment, tax, or legal advice. Excludes stock and working capital, GST, tax, financing and site-specific factors. The dispensary figures are sensitive to the 60-day dispensing change, and the defaults are illustrative benchmarks rather than trading figures. Regulatory rules are summarised as at {LATEST_REFRESH_DATE} and are not legal advice — confirm the current position with the Department and the ACPA, and with your state authority, before committing. Confirm every input against your own trading data and seek independent financial advice before committing capital.
05Worked example
{EXAMPLE_HIGH_NAME} vs {EXAMPLE_LOW_NAME} — two {PAIR_ADJACENCY}SA4 regions in Greater {PAIR_METRO}, with materially different pharmacy supply profiles.
{EXAMPLE_HIGH_NAME} and {EXAMPLE_LOW_NAME} are two {PAIR_ADJACENCY}SA4 regions in Greater {PAIR_METRO}. On residents per pharmacy — {EXAMPLE_HIGH_POP_PER_PHARMACY} against {EXAMPLE_LOW_POP_PER_PHARMACY} — one looks markedly more stretched than the other.
| {EXAMPLE_HIGH_NAME} | {EXAMPLE_LOW_NAME} | |
|---|---|---|
| Resident population | {EXAMPLE_HIGH_POP} | {EXAMPLE_LOW_POP} |
| Working population | {EXAMPLE_HIGH_WORKING_POP} | {EXAMPLE_LOW_WORKING_POP} |
| Workers per 100 residents | {EXAMPLE_HIGH_WORKERS_PER_100} | {EXAMPLE_LOW_WORKERS_PER_100} |
| Pharmacy locations | {EXAMPLE_HIGH_PHARMACY_COUNT} | {EXAMPLE_LOW_PHARMACY_COUNT} |
| Population per pharmacy | {EXAMPLE_HIGH_POP_PER_PHARMACY} | {EXAMPLE_LOW_POP_PER_PHARMACY} |
| PBS scripts — region’s residents / yr | {EXAMPLE_HIGH_TOTAL_SCRIPTS} | {EXAMPLE_LOW_TOTAL_SCRIPTS} |
| Resident scripts per pharmacy / yr | {EXAMPLE_HIGH_SCRIPTS_PER_PHARMACY} | {EXAMPLE_LOW_SCRIPTS_PER_PHARMACY} |
| Population 65+ | {EXAMPLE_HIGH_POP_65_PCT} | {EXAMPLE_LOW_POP_65_PCT} |
| 65+ forecast growth | {EXAMPLE_HIGH_POP_65_GROWTH} | {EXAMPLE_LOW_POP_65_GROWTH} |
| Median household income | {EXAMPLE_HIGH_INCOME} | {EXAMPLE_LOW_INCOME} |
A region is a large area, and pharmacies are not spread evenly across it, and PBS volumes are attributed to the patient’s home address rather than the dispensing pharmacy, so a region with a large daytime workforce dispenses more than this figure shows. Two illustrative sites — one in each region — show what the numbers look like at street level, where the Location Rules bite.
Site-level analysis — market and approval geometry
A pharmacy’s catchment is the residents within a short drive, whichever boundary they fall in — and its approvability is decided by the straight-line distances around it. The two sites below are illustrative, not real addresses, and each is judged on both market and approval geometry.
Site A — {EXAMPLE_HIGH_NAME}
Illustrative site · inside the undersupplied region
{SITE_A_GEO}
| {SITE_A_HDR_NEAR} | {SITE_A_HDR_DRIVE} | |
| Resident population | {SITE_A_POP_NEAR} | {SITE_A_POP_DRIVE} |
| Daily population | {SITE_A_DAILY_POP_NEAR} | {SITE_A_DAILY_POP_DRIVE} |
| Daytime uplift | {SITE_A_UPLIFT_NEAR} | {SITE_A_UPLIFT_DRIVE} |
| Population 65+ | {SITE_A_POP65_NEAR} | {SITE_A_POP65_DRIVE} |
| 65+ forecast growth | {SITE_A_POP65_GROWTH_NEAR} | {SITE_A_POP65_GROWTH_DRIVE} |
| Pharmacies in catchment | {SITE_A_PHARM_COUNT_NEAR} | {SITE_A_PHARM_COUNT_DRIVE} |
| Effective population | {SITE_A_EFF_POP_NEAR} | {SITE_A_EFF_POP_DRIVE} |
| Approval geometry | ||
| Nearest approved pharmacy | {SITE_A_NEAREST_PHARMACY} | |
| Nearest full-time prescriber | {SITE_A_NEAREST_GP} | |
| Qualifying supermarket | {SITE_A_SUPERMARKET} | |
Approval: {SITE_A_APPROVAL_VERDICT}
Market: {SITE_A_MARKET_VERDICT}
Site B — {EXAMPLE_LOW_NAME}
Illustrative site · inside the well-served region
{SITE_B_GEO}
| {SITE_B_HDR_NEAR} | {SITE_B_HDR_DRIVE} | |
| Resident population | {SITE_B_POP_NEAR} | {SITE_B_POP_DRIVE} |
| Daily population | {SITE_B_DAILY_POP_NEAR} | {SITE_B_DAILY_POP_DRIVE} |
| Daytime uplift | {SITE_B_UPLIFT_NEAR} | {SITE_B_UPLIFT_DRIVE} |
| Population 65+ | {SITE_B_POP65_NEAR} | {SITE_B_POP65_DRIVE} |
| 65+ forecast growth | {SITE_B_POP65_GROWTH_NEAR} | {SITE_B_POP65_GROWTH_DRIVE} |
| Pharmacies in catchment | {SITE_B_PHARM_COUNT_NEAR} | {SITE_B_PHARM_COUNT_DRIVE} |
| Effective population | {SITE_B_EFF_POP_NEAR} | {SITE_B_EFF_POP_DRIVE} |
| Approval geometry | ||
| Nearest approved pharmacy | {SITE_B_NEAREST_PHARMACY} | |
| Nearest full-time prescriber | {SITE_B_NEAREST_GP} | |
| Qualifying supermarket | {SITE_B_SUPERMARKET} | |
Approval: {SITE_B_APPROVAL_VERDICT}
Market: {SITE_B_MARKET_VERDICT}
The takeaway: Neither site is a verdict on its region — that is the point. Within the region that looked more stretched, this particular site is unapprovable, because an incumbent sits inside the 1.5 km minimum. Within the region that looked well-served, this particular site clears under one of the alternative items and serves a larger effective population.
Sources: ABS · RBA · Department of Health, Disability and Ageing (s90 / ACPA / Location Rules / Applicant's Handbook) · Federal Register of Legislation · PBS · Pharmacy Board of Australia (Ahpra) · Pharmacy Programs Administrator · Pharmacy Guild of Australia · state & territory pharmacy authorities · AreaSearch. Updated {LATEST_REFRESH_DATE}. This article is a preliminary scoping resource. Make your own enquiries and seek independent professional advice before acting on any information here.