On this page
General information only — not financial, investment, legal, or tax advice. Verify all data independently and seek professional advice before making investment decisions. Full disclaimer.
A mislocated hospital can lose hundreds of millions of dollars. Occupancy stays below break-even, visiting surgeons choose better-performing facilities to list at, and without a credentialled surgical team generating volume the position never reaches stabilisation. A well-located competitor in the same metro reaches target occupancy because the demand drivers it underwrote — aging population, PHI coverage, specialty shortfalls — actually exist in its catchment.
Australians aged 65+ are {POP_65_PLUS_SHARE_POPULATION} of the population but {POP_65_PLUS_SHARE_HOSPITALISATIONS} of hospitalisations and {POP_65_PLUS_SHARE_PATIENT_DAYS} of patient days. Separations in the 65+ cohort are growing faster than hospital capacity can respond — against a bed base already below the OECD average ({NATIONAL_BEDS_PER_1000} per 1,000 vs {OECD_AVG_BEDS_PER_1000}), in a sector where adding capacity takes the better part of a decade.
Why the headline metric is not enough: Two metro SA4 regions can carry a similar beds-per-1,000 ratio and look equivalent on paper. But the surgical demand profile underneath can be completely different — one dominated by day surgery and ophthalmology, the other with an aging, high-PHI population generating orthopaedic and cardiac demand that no local private facility serves. The bed count told you nothing about the opportunity or the revenue profile. See the full worked example →
Australia has {NATIONAL_HOSPITAL_COUNT} hospitals with {NATIONAL_TOTAL_BEDS} beds — a national supply of {NATIONAL_BEDS_PER_1000} beds per 1,000 population ({NATIONAL_PUBLIC_BEDS_PER_1000} public, {NATIONAL_PRIVATE_BEDS_PER_1000} private). Among Australia's most bed-constrained metro SA4 regions right now:
| SA4 Region | Beds / 1,000 |
|---|---|
| {TOP_HOSP_UNDERSERVED_AREA_1} | {TOP_HOSP_UNDERSERVED_BEDS_1} |
| {TOP_HOSP_UNDERSERVED_AREA_2} | {TOP_HOSP_UNDERSERVED_BEDS_2} |
| {TOP_HOSP_UNDERSERVED_AREA_3} | {TOP_HOSP_UNDERSERVED_BEDS_3} |
| {TOP_HOSP_UNDERSERVED_AREA_4} | {TOP_HOSP_UNDERSERVED_BEDS_4} |
| {TOP_HOSP_UNDERSERVED_AREA_5} | {TOP_HOSP_UNDERSERVED_BEDS_5} |
01The opportunity right now
Why institutional capital keeps returning to a sector that is visibly struggling
Hospital investment is structurally different from most property sectors — and right now more openly distressed than most. Three structural reasons the capital keeps coming:
- The aging compound. The 65+ cohort is {POP_65_PLUS_SHARE_POPULATION} of the population yet generates {POP_65_PLUS_SHARE_HOSPITALISATIONS} of hospitalisations and {POP_65_PLUS_SHARE_PATIENT_DAYS} of patient days. Separation demand from the 85+ cohort alone is projected to grow {SEPARATION_DEMAND_GROWTH_85_PLUS} by {FORECAST_YEAR}.
- PHI as a demand floor. {PHI_COVERAGE_NATIONAL} of Australians hold private health cover. Government policy actively supports private hospital utilisation through the {PHI_REBATE_NAME}, {LHC_NAME} loading, and the {MLS_NAME}. Private hospitals carry {PRIVATE_SHARE_ELECTIVE_SURGERY} of elective surgery.
- VMO lock-in. Private hospitals operate on a visiting medical officer model — surgeons are credentialled at specific facilities and bring their patient lists. Once a hospital builds a surgical team across key specialties, the referral networks, support staff and equipment investment compound. Switching costs are high for both surgeon and hospital, which is why a well-located and well-operated facility holds its position for decades.
The other side of the ledger: operating margins compressed from {SECTOR_MARGIN_2018} in 2018 to {SECTOR_MARGIN_2023} in 2023 as labour costs — over half of a private hospital's cost base — outpaced PHI reimbursement indexation. Almost {HOSPITALS_OPERATING_AT_LOSS} of private hospitals now operate at a loss. Healthscope — the second-largest operator — entered receivership in 2025.
But the sector's complexity is also its opportunity. Private hospitals span day surgery, overnight acute, psychiatric, rehabilitation, and maternity — each with different cost structures, reimbursement profiles, and profitability. Groups that get their service mix and location analysis right can achieve strong returns even in the current environment. The operators that have struggled have largely struggled to navigate that complexity — not because the underlying demand has disappeared.
At SA4 scale, metro bed supply ranges from {BEDS_LOWEST_SA4_VALUE} per 1,000 ({BEDS_LOWEST_SA4_NAME}) to {BEDS_HIGHEST_SA4_VALUE} ({BEDS_HIGHEST_SA4_NAME}), and at a site-specific catchment level the variation is sharper and the surgical specialty mix differs entirely. Hospital catchments are surgeon-defined as much as geography-defined: a hospital that secures a high-profile orthopaedic surgeon draws patients from a wider radius than the same building with less-established names.
Beds per 1,000 population — metro SA4 comparison
Metro SA4 regions with population > 50,000. Beds per 1,000 people nationally sits at 3.6 and is split roughly 2.4 public and 1.2 private. Full needs analysis for hospital services goes far beyond these figures, however.
02Using AreaSearch for hospital site selection
Two starting points — the tools are the same, the entry point differs
AreaSearch's medical analysis tools work for two different situations. The path you take depends on where you're starting from:
I'm searching for opportunities
You don't have a specific site. You want to find corridors where bed supply is constrained, surgical requirements are unmet, population is aging, and PHI coverage supports demand.
- Use the heatmap to scan nationally for bed supply gaps and aging population concentrations
- Use Target Search to filter by 65+ density, bed supply, PHI coverage, income band
- Read area profiles (Health, Age, Income, Medical sections) for shortlisted regions
- Run a custom catchment around candidate sites to validate with site-specific supply and demand
I have a site to evaluate
A specific address or corridor has come across your desk. You need to know whether the demand is real and the specialty gaps exist before committing capital.
- Read the area profile for the suburb — Health, Age, Income, Medical sections — free, no sign-up
- Run a custom catchment around the address for site-specific bed supply, specialty coverage, and surgical demand
- Check the site fit against NCC classification, capital requirements, and hospital economics (Section 04)
- Compare against competing hospitals — bed counts, specialty coverage, and drive-time overlap
For most users, the area profile is the right starting point — free, covers any area in Australia, and gives you demographic and health context in seconds. For hospital supply metrics, Professional tools are the next step.
The heatmap — supply & demand scan
The homepage choropleth heatmap lets you toggle hospital and medical layers — bed, separation and surgery per capita ratios by type (public/private), PHI coverage, unmet demand and projections across the entire country. See where statistics overlap and narrow your focus to the corridors worth drilling into.
Area and suburb profiles — free taster
Open any suburb or SA2 area profile and read the sections that matter for hospital investment:
- Age & Population sections. 65+ and 85+ cohort size and percentage — the primary demand driver. If 65+ is above the national average and the growth trajectory is positive, separation demand will be rising for years. Check the 85+ cohort specifically: it drives the highest utilisation rates and the longest stays.
- Health section. Chronic disease prevalence by condition — arthritis, diabetes, heart disease, COPD — benchmarked against all SA2s nationally. Top-quartile chronic disease across multiple conditions signals high surgical and inpatient demand.
- Income and private health insurance. Median household income and PHI coverage together signal the ability to support private hospital demand. Higher PHI coverage = stronger elective surgery pipeline. Lower-PHI catchments still generate public hospital demand but limit private feasibility.
Target Search — multi-criteria shortlisting
Target Search is reverse-engineered location analysis. Define success criteria — bed supply below a threshold, 65+ density above a level, PHI coverage, household income band, population growth rate — and the platform returns a ranked list of areas matching all of them, anywhere in Australia. Use it to move from a national scan to a handful of corridors worth validating with a custom catchment. Pro tier.
Custom catchment — the site-specific decision tool
This is the workhorse. Pro tier. Draw a catchment around any address — radius, polygon, or drive-time isochrone. The custom catchment gives you site-specific bed supply, specialty coverage, and resident demand analysis — not the SA4 average, but the actual supply picture for people who live within the catchment you define. The gap between modelled demand and existing supply is the leakage a new facility could recapture. The map also carries lot-level planning layers — statutory zoning, development controls such as building height and floor-space ratio, and heritage items. If the specialist and GP referral base around a site is central to your thesis, our medical practice how-to covers that side of the catchment in depth.
03The signals that matter
The numbers driving smart hospital site decisions
All communities require hospital services. The rate and composition of provision can vary widely across geographies, however, with age and socioeconomic profiles dictating the public/private split, and the type and complexity of surgeries required. Whether a new hospital development is viable weighs on whether the volume of separations can sustain full-time staffing across specialties, in a labour market where skilled clinical workforce is in high demand.
Local demand profile
Key Local Employment Industries
Demand estimation. AreaSearch estimates resident hospital demand by applying national age-specific utilisation rates by specialty — separations, patient days, and surgeries per capita — to the local population profile. Because the 65+ cohort uses hospitals at roughly {UTILISATION_RATIO_65_PLUS} times the rate of working-age adults, two catchments with the same total population can produce vastly different demand.
Hospital admission rates by age group — national (per 1,000 population)
Source: AIHW {AIHW_HOSPITAL_DATA_YEAR}. Separations per 1,000 population by age group.
PHI coverage & income. Private hospital demand correlates directly with private health insurance penetration. {PHI_COVERAGE_NATIONAL} of Australians hold cover nationally, but coverage varies significantly by area. Median household income proxies PHI propensity and tolerance for out-of-pocket surgical gaps, as does the SEIFA decile which is released at the hyperlocal SA1 level.
Health condition prevalence — national benchmarks
Prevalence per 100 population. Higher prevalence = stronger demand signal for linked surgical specialties.
Chronic disease prevalence. Elevated rates of conditions like arthritis, diabetes, heart disease, and kidney disease signal higher hospital demand — both medical and surgical. Diabetes in particular drives admissions across multiple specialties (renal, ophthalmology, vascular) as complications cascade. Where local prevalence exceeds national rates, linked services see disproportionate demand.
Patient day demand by age cohort — current vs projected
Illustrative. Patient day demand per 1,000 population by age cohort, current vs 20-year projection.
Patient day demand. The 65–84 cohort generates roughly {UTILISATION_RATIO_65_PLUS} times the patient days of working-age adults, and the 85+ cohort roughly {UTILISATION_RATIO_85_PLUS} times. When a catchment’s 65+ share is growing faster than its total population, aggregate demand projections understate the real trajectory.
Hospital supply landscape
{NATIONAL_OVERNIGHT_DAY_RATIO}
{NATIONAL_PUBLIC_PRIVATE_BEDS_RATIO}
{NATIONAL_SEPARATIONS_PUB_PRV_RATIO}
{NATIONAL_PATIENT_DAYS_PUB_PRV_RATIO}
{NATIONAL_SURGERIES_PUB_PRV_RATIO}
Beds per 1,000 people nationally sits at {NATIONAL_BEDS_PER_1000}, split roughly {NATIONAL_PUBLIC_BEDS_PER_1000} public and {NATIONAL_PRIVATE_BEDS_PER_1000} private. But bed counts alone tell a partial story, and the public and private systems serve fundamentally different roles. The public system carries emergency, paediatric and complex surgical care, while private hospitals concentrate on elective procedures where patient choice, wait times and PHI coverage drive volume. Day hospitals target high-volume, low-acuity procedures and {SAME_DAY_SHARE_PRIVATE} of private hospital patients now stay less than 24 hours. AreaSearch maps every hospital — public and private — within the primary and secondary catchment, reporting beds, separations, patient days, surgeries, and ED visits. Separation, patient day and surgery ratios, per bed and per population, reveal how hard existing capacity is working.
National elective surgeries by specialty — public vs private
Public: AIHW elective surgery waiting times {AIHW_HOSPITAL_DATA_YEAR}. Private: AIHW Private Hospital Data Bureau (PHDB) {PHDB_DATA_YEAR}.
Public hospitals performed {NATIONAL_TOTAL_SURGERIES} elective surgeries nationally in the latest year assessed. General surgery, urology and ophthalmology lead the public caseload, while orthopaedics, ophthalmology and plastic surgery dominate private volumes. The split varies sharply by specialty — paediatric surgery runs almost entirely through the public system, while specialties like orthopaedics carry three times the private volume of public. Complex surgical specialties such as cardio-thoracic and neurosurgery generate fewer separations overall but longer patient stays, meaning their contribution to patient days and bed demand is disproportionate to their volume.
The PHDB records roughly {PHDB_TOTAL_SEPARATIONS} private hospital separations annually, generating {PHDB_TOTAL_REVENUE} in charges. Same-day separations outnumber overnight stays {PHDB_DAY_OVERNIGHT_RATIO}. Surgical admissions account for {PHDB_SURGICAL_SHARE} of separations but {PHDB_SURGICAL_REVENUE_SHARE} of revenue ({PHDB_SURGICAL_REVENUE}); medical admissions make up {PHDB_MEDICAL_SHARE} of separations and {PHDB_MEDICAL_REVENUE_SHARE} of revenue; other admissions contribute {PHDB_OTHER_SHARE} and {PHDB_OTHER_REVENUE_SHARE} respectively. For every surgical separation, there are roughly {PHDB_NONSURG_TO_SURGICAL_RATIO} non-surgical separations — medical and other admissions that generate patient days and revenue alongside the surgical caseload.
Specialty demand & surgical leakage — quantifying the gap
The gap between local surgical supply against resident demand is leakage — demand that exists among residents but is serviced outside the catchment. This represents a recapture opportunity where the addressable population is sufficiently large to support the required volume, workforce, and equipment. Where supply already meets demand, on the other hand, a new facility would be splitting a finite pool which would risk occupancy falling below the roughly {BREAKEVEN_OCCUPANCY} break-even rate.
At the catchment level, this analysis allows for estimation of current and potential revenues for any specialty and any site in the country. Beyond this, AreaSearch assesses nearly 200 individual surgical procedures for public wait time differentials and leakage, pointing to unmet demand.
Surgery wait times — national median days by urgency category ({AIHW_HOSPITAL_DATA_YEAR})
Source: AIHW {AIHW_HOSPITAL_DATA_YEAR}. National median days waited for elective surgery by urgency category.
Surgery wait times — trend
Source: AIHW. National median days waited for elective surgery by urgency category.
Wait times as a demand signal. Elective surgery wait times — particularly in the non-urgent category — reveal where public capacity constraints push patients toward private alternatives. Catchments where wait times run well above the metro median signal proven unmet demand — residents are already waiting, and a private facility offering shorter wait times has a clear value proposition.
Forward projections. Hospital investment has a multi-decade horizon. Population growth adds demand, but the age profile determines the specialty mix — the 65+ cohort generates the highest surgical volume per capita. Today’s first-home-buyer corridor is the 2040s orthopaedic catchment. AreaSearch projects demand per specialty using age-weighted procedure rates, showing which cohorts are driving growth and whether the inflection is five years away or fifteen.
Patient day demand vs reported patient days
Illustrative. Demand grows with the ageing population; supply grows only when new capacity is built.
AreaSearch translates the demand-supply gap into a bed requirement — the number of beds the catchment needs today, projected forward based on utilisation trends by age cohort. This shows not just whether a gap exists, but how large it is, how fast it is growing, and which cohorts are driving it.
Bed requirement by age cohort — illustrative catchment
| Age cohort | Current | 2031 | 2036 | 2041 |
|---|---|---|---|---|
| 0–24 | 45 | 48 | 50 | 52 |
| 25–44 | 85 | 90 | 95 | 100 |
| 45–64 | 180 | 200 | 220 | 240 |
| 65+ | 310 | 380 | 460 | 550 |
| Total demand (beds) | 620 | 718 | 825 | 942 |
| Existing beds | 480 | 480 | 480 | 480 |
| Shortfall | −140 | −238 | −345 | −462 |
Illustrative catchment. Bed demand derived from age-specific utilisation rates applied to population projections. Bed counts adjusted based on development pipeline, where applicable.
Staffing & workforce feasibility
From the specialty gap analysis, AreaSearch estimates the clinical workforce required to service the unmet demand. Surgeon FTE is derived from national average caseloads per specialty. Anaesthetist FTE is weighted by each specialty’s anaesthetic intensity — cardiac and neurosurgery need significantly more anaesthetist time per surgeon than ophthalmology, which is largely performed under local anaesthesia. Perioperative and recovery nursing applies a standard ratio of approximately five nurses per theatre.
The result moves the conversation from "is there a gap?" to "can we staff it?"
Workforce shortage designations. The Department of Health designates certain areas and specialties as having workforce shortages — Distribution Priority Areas (DPAs) for GPs, and Districts of Workforce Shortage (DWS) for specialists. Sites within these designated areas face more lenient requirements for employing overseas-trained practitioners, materially affecting staffing feasibility and recruitment timelines. AreaSearch identifies which specialties carry these designations for the area — a signal that affects both the opportunity (less competition) and the execution risk (harder to recruit domestically).
Incoming supply — what is in the DA pipeline
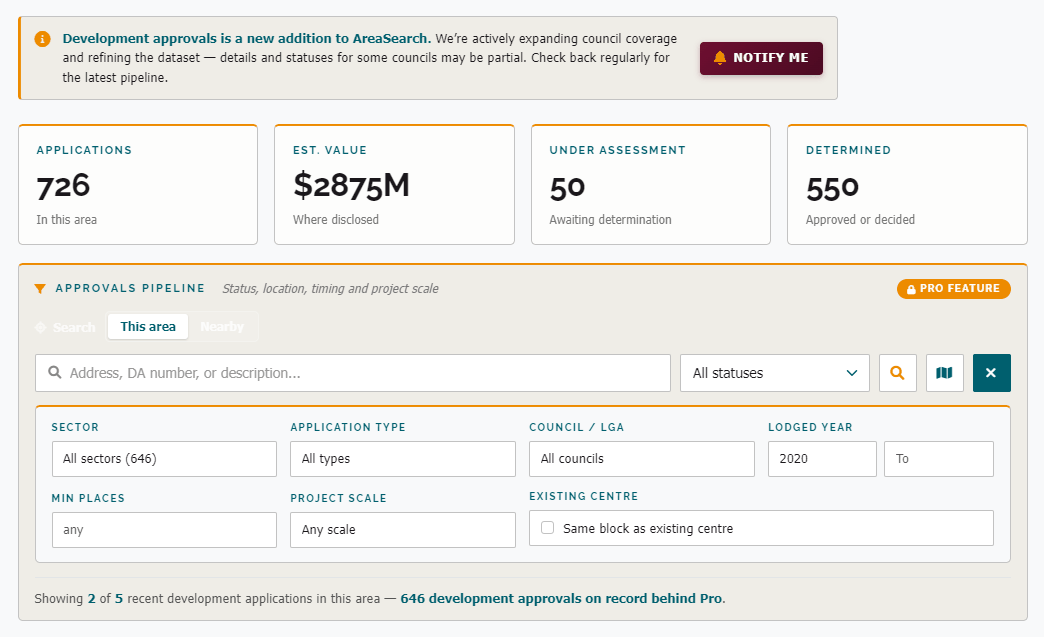
Every supply ratio in this section covers what is already operating. A site that looks undersupplied today can be saturated within {HOSPITAL_ABSORPTION_TYPICAL} if approved developments are in the pipeline. Council DAs are where the forward supply shows up — approved but not yet built, applications under assessment, and clusters of lodgements that signal other operators have spotted the same opportunity.
AreaSearch’s Custom Catchment report scans the DA register within the catchment radius and lists each application — address, status, lodgement date, estimated value, and distance from the site. The report tracks the trailing approval rate and the 12-month count, so you can see whether the pipeline is accelerating or cooling without manually searching council portals.
04The site fit
NCC Class {NCC_CLASS}, bed-level economics, and the capital reality
You've found a corridor with constrained beds, aging population, and specialty gaps worth filling. Can the site deliver the hospital, and can the economics sustain it?
Physical requirements
Hospitals are NCC Class {NCC_CLASS} — triggering substantially higher construction standards than Class 5 (office) or Class 9b (assembly): fire compartmentation, smoke control, emergency power, structural resilience, and patient evacuation. All must comply with the Australasian Health Facility Guidelines ({AUSHFG_VERSION}). Requirements scale with hospital type:
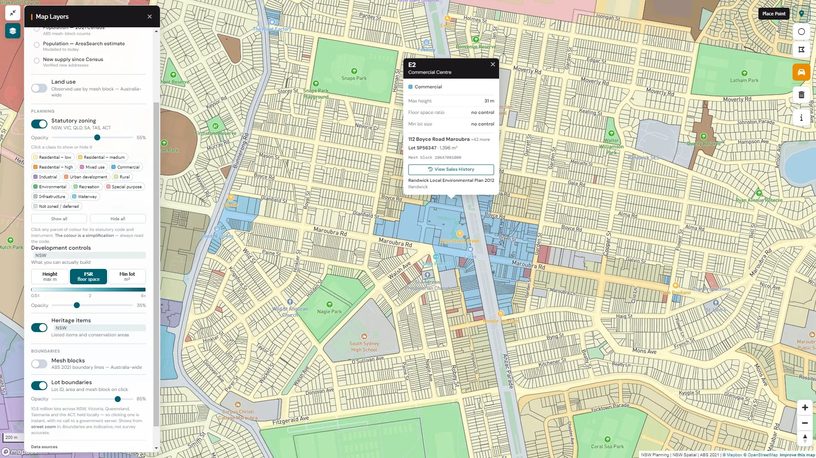
Statutory zoning, development controls and lot boundaries on the map — click any lot for its zoning code and controls.
| Requirement | Day hospital | Medium overnight (70–150 beds) | Major overnight (200+ beds) |
|---|---|---|---|
| Typical site area | 2,000–5,000 m² | 1–3 hectares | 3–10+ hectares |
| Parking | Staff + patient drop-off | {PARKING_RATIO_PER_BED} spaces per bed | {PARKING_RATIO_PER_BED} spaces per bed + multi-level |
| Emergency access | Not typically required | Ambulance bay, covered entry | ED with ambulance bay, helicopter landing |
| Utilities | Standard commercial + medical gas | Generator backup, medical gas, water treatment | Full redundancy: dual power, generator, water, medical gas |
| Public transport | Desirable | Important for workforce | Essential — hospitals employ 500–5,000+ staff |
| Capital range | {DAY_HOSPITAL_TOTAL_COST} | {OVERNIGHT_HOSPITAL_TOTAL_COST_MEDIUM} | {OVERNIGHT_HOSPITAL_TOTAL_COST_LARGE} |
Licensing and approvals
All states require Approval in Principle (AIP) before construction begins, followed by a commissioning inspection and state licence before the facility can admit patients. The Federal Minister for Health must separately "declare" the facility — without this, it cannot receive private health insurance benefits. NSQHS accreditation is a condition of licence in all states.
The full greenfield timeline from concept to doors opening is typically {GREENFIELD_CONCEPT_TO_OPEN} for a major facility. Brownfield expansion runs {BROWNFIELD_EXPANSION} per stage. Day hospitals: {DAY_HOSPITAL_CONCEPT_TO_OPEN}.
Hospital economics — the bed as the unit of analysis
The unit of economics is the bed; the unit of revenue is the separation — charged at rates each hospital negotiates with each health fund. Three drivers decide whether the model works:
- Occupancy. Fixed costs run regardless of volume. Break-even is approximately {BREAKEVEN_OCCUPANCY}; target stabilised occupancy is 70–85%.
- Scale. Larger hospitals share resources, reduce theatre downtime, and attract a wider range of specialists and insurer negotiating power.
- Case mix. Complex cardiac surgery generates substantially more revenue per separation than routine endoscopy. Hospitals attracting high-complexity surgeons outperform on a per-bed basis.
How the calculator works
Enter facility parameters (beds, theatres, case mix), revenue assumptions, and facility margin. Toggle Build to add land and build cost. Set the inputs for your hospital and request your cash flow model — we email you the full model (revenue, EBITDA, returns and a year-by-year cash flow) built from your settings.
Hospital Returns Calculator
On a Build you borrow by setting the construction loan. The investment loan refinances it at completion - the lesser of the LVR on the value at completion (the rent capitalised at the exit cap rate) and the facility balance - and principal and interest start in Year 1, when the hospital starts trading. With the construction loan at $0 the build is funded by equity and there is nothing to refinance, so the levered and unlevered returns are the same.
This calculator is a financial modelling tool provided by AreaSearch for indicative analysis only — not investment, tax, or legal advice. It uses simplified assumptions and excludes financing costs, tax, depreciation, and the complexity of hospital operating models. Make your own enquiries and seek independent professional advice before committing capital.
05Worked example
{EXAMPLE_HIGH_NAME} vs {EXAMPLE_LOW_NAME} — two {PAIR_ADJACENCY}SA4 regions in Greater {PAIR_METRO}, with materially different hospital supply profiles.
At SA4 level, the headline bed supply metrics tell a clear story:
| Metric | {EXAMPLE_HIGH_NAME} | {EXAMPLE_LOW_NAME} |
|---|---|---|
| Beds per 1,000 | {EXAMPLE_HIGH_BEDS} | {EXAMPLE_LOW_BEDS} |
| Private beds per 1,000 | {EXAMPLE_HIGH_PRIVATE_BEDS} | {EXAMPLE_LOW_PRIVATE_BEDS} |
| Population 65+ | {EXAMPLE_HIGH_POP_65} | {EXAMPLE_LOW_POP_65} |
| Median household income | {EXAMPLE_HIGH_INCOME} | {EXAMPLE_LOW_INCOME} |
SA4 headline: {EXAMPLE_HIGH_NAME} looks undersupplied ({EXAMPLE_HIGH_BEDS} beds per 1,000). {EXAMPLE_LOW_NAME} looks better-served ({EXAMPLE_LOW_BEDS} beds per 1,000). A more than {ADJACENT_SA4_BEDS_MULTIPLE}x difference. The obvious conclusion is to look for sites in {EXAMPLE_HIGH_NAME}.
Zoom to site level and the story changes.
Site A — {EXAMPLE_HIGH_NAME}
In the undersupplied SA4 (SA4 beds per 1,000: {EXAMPLE_HIGH_BEDS}) · {SITE_A_GEO}
| Metric | 10 km | 20 min drive |
|---|---|---|
| Population | {SITE_A_POP_NEAR} | {SITE_A_POP_DRIVE} |
| Population 65+ | {SITE_A_POP65_NEAR} | {SITE_A_POP65_DRIVE} |
| Beds per 1,000 | {SITE_A_BEDS_PER_1000_NEAR} | {SITE_A_BEDS_PER_1000_DRIVE} |
| Surgical specialties | {SITE_A_SPECIALTY_NEAR} | {SITE_A_SPECIALTY_DRIVE} |
| Bed demand growth to {FORECAST_YEAR} | {SITE_A_DEMAND_GROWTH_NEAR} | {SITE_A_DEMAND_GROWTH_DRIVE} |
| Median household income | {SITE_A_INCOME_NEAR} | {SITE_A_INCOME_DRIVE} |
Well-served at site level — a major hospital precinct in the neighbouring SA4 pushes local supply to ~{SITE_A_BEDS_PER_1000_NEAR} beds per 1,000, well above the national average, and the 20-minute drive ring holds at ~{SITE_A_BEDS_PER_1000_DRIVE}. Demand is broadly matched by existing supply.
Site B — {EXAMPLE_LOW_NAME}
In the better-served SA4 (SA4 beds per 1,000: {EXAMPLE_LOW_BEDS}) · {SITE_B_GEO}
| Metric | 10 km | 20 min drive |
|---|---|---|
| Population | {SITE_B_POP_NEAR} | {SITE_B_POP_DRIVE} |
| Population 65+ | {SITE_B_POP65_NEAR} | {SITE_B_POP65_DRIVE} |
| Beds per 1,000 | {SITE_B_BEDS_PER_1000_NEAR} | {SITE_B_BEDS_PER_1000_DRIVE} |
| Surgical specialties | {SITE_B_SPECIALTY_NEAR} | {SITE_B_SPECIALTY_DRIVE} |
| Bed demand growth to {FORECAST_YEAR} | {SITE_B_DEMAND_GROWTH_NEAR} | {SITE_B_DEMAND_GROWTH_DRIVE} |
| Surgical leakage | {SITE_B_LEAKAGE} | |
| Median household income | {SITE_B_INCOME_NEAR} | {SITE_B_INCOME_DRIVE} |
Below average at site level despite the SA4 headline of {EXAMPLE_LOW_BEDS} — this site's catchments extend into adjacent lower-supply corridors, pulling supply to ~{SITE_B_BEDS_PER_1000_NEAR} at 10 km and ~{SITE_B_BEDS_PER_1000_DRIVE} at 20 minutes, both below the national average. Observed leakage within ophthalmology, and a number of other specialties, for elective surgery confirms patients are already travelling. Inflow from neighbouring underserved SA4s shows this catchment already functions as a partial service hub — a facility offering the missing elective specialties could capture both the outbound leakage and the inbound demand.
The takeaway: The SA4-level bed supply said {EXAMPLE_HIGH_NAME} was undersupplied and {EXAMPLE_LOW_NAME} was better-served. The site-level catchments tell a more nuanced story — a well-served pocket inside the “undersupplied” region sitting right beside a major hospital precinct, and genuine gaps inside the “better-served” one where catchments bleed into lower-supply corridors. At Site B, supply drops below the SA4 headline, leakage to CBD precincts confirms patients are already travelling for care, and inflow from neighbouring SA4s shows unmet demand converging on this location. The regional comparison identifies where to look — the site-level catchment determines whether the opportunity is actually there.
Sources: ABS · AIHW · APRA · BCG · APHA · OECD Health at a Glance 2025 · Department of Health, Disability and Ageing · Australasian Health Facility Guidelines · AreaSearch. Updated {LATEST_REFRESH_DATE}. This article is a preliminary scoping resource. Make your own enquiries and seek independent professional advice before acting on any information here.