On this page
General information only — not financial, investment, legal, or tax advice. Verify all data independently and seek professional advice before making investment decisions. Full disclaimer.
A $30 million aged-care facility in the wrong location faces a permanent staffing shortage and empty beds. A retirement village targeting the wrong buyer profile spends years filling units while the operator waits for returns. Both outcomes hinge on reading the local market correctly before committing capital, and ideally before committing extensive man hours.
Retirement living and residential aged care serve different people at different life stages. Retirement living targets independent over-65s who sell the family home and buy into a village while residential aged care provides 24-hour clinical care for older Australians — typically from their 80s onwards — who can no longer live independently.
Retirement living is most commonly provided under a licence or lease arrangement where the operator earns an upfront contribution and a deferred management fee (DMF) on exit, though some villages offer freehold (strata title) ownership. Aged care operators are funded primarily through a federal government payment per resident per day (explained in section 04), plus accommodation charges paid by the resident or their family.
Given their tight link, with both services often offered on the same campus, and because each require answers to the same questions (where is the ageing population concentrated, and how does local supply compare to local demand?), this article covers both products together.
Why one metric is never enough: An area with few beds per 10,000 over-65s looks undersupplied on paper — but if it has limited GP and hospital access, poor public transport, and low home equity, a new facility might struggle to fill beds and fund RADs. Conversely, a suburb that looks saturated on the headline ratio may have unmet demand from families who want a parent in aged care close to where they live, in a walkable neighbourhood near medical services and everyday amenity. The supply ratio is not the be-all end-all. Whether the opportunity is real depends on proximity to health services, distance to where families live, local open space and amenity, and the socioeconomic profile that determines what residents can afford to pay. Worked example →
Nationally, Australia has {RAC_SERVICES_NATIONAL} residential aged care services with {RAC_PLACES_NATIONAL} operational places, {HCP_SERVICES_NATIONAL} in-home care providers, and {RV_DWELLINGS_NATIONAL} retirement village dwellings while {POP_65PLUS_PCT_NATIONAL} of the population are aged 65+. The following five SA3 regions were found to have the highest proportion of residents aged 65 and over.
Top 5 areas by share of population aged 65+
- {TOP_AGED_DENSITY_AREA_1} — 65+ {TOP_AGED_DENSITY_65PLUS_PCT_1}, {TOP_AGED_DENSITY_RAC_CENTRES_1} aged care centres, {TOP_AGED_DENSITY_HOMECARE_1} in-home care providers, {TOP_AGED_DENSITY_RV_COUNT_1} villages
- {TOP_AGED_DENSITY_AREA_2} — 65+ {TOP_AGED_DENSITY_65PLUS_PCT_2}, {TOP_AGED_DENSITY_RAC_CENTRES_2} aged care centres, {TOP_AGED_DENSITY_HOMECARE_2} in-home care providers, {TOP_AGED_DENSITY_RV_COUNT_2} villages
- {TOP_AGED_DENSITY_AREA_3} — 65+ {TOP_AGED_DENSITY_65PLUS_PCT_3}, {TOP_AGED_DENSITY_RAC_CENTRES_3} aged care centres, {TOP_AGED_DENSITY_HOMECARE_3} in-home care providers, {TOP_AGED_DENSITY_RV_COUNT_3} villages
- {TOP_AGED_DENSITY_AREA_4} — 65+ {TOP_AGED_DENSITY_65PLUS_PCT_4}, {TOP_AGED_DENSITY_RAC_CENTRES_4} aged care centres, {TOP_AGED_DENSITY_HOMECARE_4} in-home care providers, {TOP_AGED_DENSITY_RV_COUNT_4} villages
- {TOP_AGED_DENSITY_AREA_5} — 65+ {TOP_AGED_DENSITY_65PLUS_PCT_5}, {TOP_AGED_DENSITY_RAC_CENTRES_5} aged care centres, {TOP_AGED_DENSITY_HOMECARE_5} in-home care providers, {TOP_AGED_DENSITY_RV_COUNT_5} villages
01The opportunity right now
Why these subsectors behave differently from mainstream property — and what that means for investors
Aged care and retirement living share three features that set them apart from mainstream residential and commercial property.
- Government-backed demand. The majority of a residential aged care facility's revenue comes from federal government funding — a per-resident daily payment determined by the AN-ACC classification (explained in section 04). Retirement living is largely privately funded, but downsizers benefit from the federal Downsizer Contribution, which lets over-{DOWNSIZER_AGE_THRESHOLD}s put up to {DOWNSIZER_CONTRIBUTION_MAX} of home-sale proceeds into superannuation regardless of caps.
- A growing customer base. Today, {POP_65PLUS_PCT_NATIONAL} of Australians are aged 65+ and {POP_85PLUS_PCT_NATIONAL} are 85+. National aged-care supply sits at {RAC_PLACES_PER_10K_65PLUS_NATIONAL} places per 10,000 people aged 65+. This population cohort is projected to grow {POP_65PLUS_GROWTH_PCT} between {POP_GROWTH_BASE_YEAR} and {FORECAST_YEAR}; the 85+ population by {POP_85PLUS_GROWTH_PCT}.
- Less cyclical than conventional property. Aged-care revenue is set by government funding rates, not by what the rental market will bear. Retirement village revenue comes from upfront contributions and exit fees, not from lease renewals — though retirement living does compete with conventional residential property for downsizer buyers, so dwelling values and local housing supply still matter.
Sector scale
Federal government expenditure on aged care — residential, in-home, and the Commonwealth Home Support Programme — totals {SECTOR_TOTAL_REVENUE_NATIONAL}, delivered through {SECTOR_TOTAL_PROVIDERS} and {HCP_SERVICES_NATIONAL} in-home care providers. Retirement living sits outside this figure — its revenue comes from private upfront contributions and deferred management fees, not government funding.
The two products at a glance
| Product | Who it serves | How operators get paid | Key demand metric |
|---|---|---|---|
| Retirement Living RL | Independent over-65s downsizing from the family home | Upfront contribution from resident + deferred management fee (DMF) on exit | Dwellings per 10k 65+ + local home equity |
| Residential Aged Care RAC | Over-80s needing 24-hour clinical care | Federal AN-ACC funding per resident per day + accommodation deposit (RAD) or daily payment (DAP) | Aged-care places per 10,000 people aged 65+ |
What's changing right now
The Aged Care Act 2024 — the regime change
The new {NEW_ACT_NAME} commenced {AGED_CARE_ACT_COMMENCEMENT} . It replaces both the Aged Care Act 1997 and the ACQSC Act 2018 with a single rights-based framework. The {STATEMENT_OF_RIGHTS} is now a statutory anchor — providers must demonstrate compliance with 12 enumerated rights. The previous 8 Quality Standards consolidate into {STRENGTHENED_STANDARDS_COUNT} strengthened standards, more detailed and measurable, with provider performance reported transparently via Star Ratings on My Aged Care.
For investors, the regime change is material: higher compliance obligations, expanded ACQSC enforcement powers, and the accommodation reform that lifted the maximum RAD without Independent Health and Aged Care Pricing Authority (IHACPA) approval from $550,000 (1 January 2025 reform) to {RAD_MAX_NO_APPROVAL} (indexed annually each 1 July).
- Support at Home Program. The new {SUPPORT_AT_HOME_NAME} replaced Home Care Packages and Short-Term Restorative Care from {SAHP_COMMENCE_DATE}, with {SUPPORT_AT_HOME_CLASSIFICATIONS} replacing the 4-level HCP system. CHSP transitions to SaHP no earlier than {CHSP_TRANSITION}. For RAC investors: home care capacity expansion is the government's preferred response, which signals lower expectations of residential bed growth relative to community-based care.
- AN-ACC funding refresh quarterly. Latest base price {ANACC_LATEST_RATE} (up from {ANACC_PRIOR_BASE_PRICE}); reviewed by the Aged Care Pricing Authority each cycle. Plus hotelling supplement at {HOTELLING_SUPPLEMENT} for everyday living costs.
- The ageing population is accelerating. The first wave of late Baby Boomers is entering the 80+ age bracket. Capital deployed today is positioning for that sustained growth.
Operators in the two sectors often look at the same suburb and reach different conclusions — because the age group, the supply benchmark, and the revenue model are different for each product. But the two can also complement each other: a retirement village feeds residents into the adjacent aged-care facility as care needs increase, giving the operator a built-in pipeline and the resident continuity of community.
Aged cohort growth {POP_GROWTH_BASE_YEAR}–{FORECAST_YEAR} (national projection)
The 85+ age group more than doubles — and that is the group most likely to need residential aged care.
02Using AreaSearch for aged care and retirement living site selection
Two starting points — the tools are the same, the entry point differs
AreaSearch's aged care analysis tools work for two different situations. The path you take depends on where you're starting from:
Searching for opportunities RLRAC
- No specific site — scanning nationally for undersupplied areas
- Goal: find areas where ageing demographics outpace existing supply
- Use the heatmap to scan 65+ population share and aged-care supply density
- Use Target Search to filter nationally by age cohort, supply gap, dwelling value, and MMM tier
- Read area profiles for shortlisted regions
- Run a custom catchment around candidate sites to confirm
Evaluating a specific site RLRAC
- A specific address is under consideration
- Priority: confirm that local demand and supply conditions justify the investment
- Read the area profile for the suburb — age structure, supply counts, tenure and wealth
- Run a custom catchment around the address for site-level age and supply numbers
- Check MMM tier for workforce feasibility (section 03)
For most users, the area profile is the right starting point — free, covers any area in Australia, and gives you demographic and health context in seconds. For sector supply analysis, Professional tools are the next step.
The heatmap — broad scan
The homepage heatmap toggles aged-care-relevant layers across the country. The most useful layers depend on the product:
- 65+ population share and forecasts.
- Residential statistics and latest income estimates to estimate downsizer wealth and RAD-affordability.
- Employment industry representation — plan staffing strategy around local workforce distribution.
- Supply/demand ratios. Residential places and retirement dwellings per 10,000 over-65
Area and suburb profiles — free
Open any suburb or SA2 area profile and the aged-care-relevant signals are surfaced in the demographic + services sections:
- Age structure. 65–74, 75–84, and 85+ age groups as a share of total population. This is the core demand indicator for both products.
- Tenure & wealth. Owner-occupier outright share — indicates how much home equity is available locally to fund retirement village entry.
- Health indicators. Private health insurance coverage, GP attendances per 100 people aged 65+, and chronic disease prevalence among the older cohort — these shape co-contribution capacity and care demand intensity.
- Amenities. Check if residents have easy access to hospitals, GPs, supermarkets and more. Gauge connectivity with public transport route and trip relativities.
Target Search — multi-criteria national shortlist
Target Search is reverse-engineered location analysis. You set thresholds across metrics — 65+ cohort share, places per 10,000 over-65s, MMM tier, median dwelling value, owner-occupier outright share — and the platform returns a ranked list of areas matching all of them, anywhere in Australia. RAC queries focus on supply gaps and workforce feasibility; RL queries on downsizer wealth and existing village density. Pro tier.
Custom catchment — the site-level decision tool
Pro tier. Draw a catchment around any address — radius, polygon, or drive-time — and the platform returns supply and demand numbers for that exact area, not the broader LGA or SA2. Includes RAD/DAP pricing analysis by room type and provider, retirement village dwelling pricing and vacancy, home care provider density, and the full DA pipeline from local council registers. The map also carries lot-level planning layers — statutory zoning, development controls such as building height and minimum lot size, and heritage items.
The area profile tells you whether a region is worth investigating. The custom catchment tells you whether it is worth investing in.
03The signals that matter
The demand, health, supply, and pricing signals that reveal whether an aged care or retirement living site is worth pursuing
Local demand profile
Key Local Employment Industries
Income, ownership & co-contribution capacity. Income, ownership, and private health insurance shape the market for both products. For retirement living, outright home ownership is the critical signal — downsizers fund ingoing contributions from home equity, so high ownership and strong dwelling values mean deeper buyer pools. For RAC, higher-income catchments support stronger RAD deposits and co-contribution capacity. PHI cover nationally sits at {PHI_NATIONAL_PCT}; above-average cover signals willingness to pay for premium room types.
Why amenity access matters. Aged care facilities near hospitals, GPs, and pharmacies reduce ambulance transfers and make visiting specialists more available. For retirement living, walkable access to medical services, shopping, and public transport is a core selling point — residents are independent but increasingly reliant on nearby services. AreaSearch reports distance-to-nearest for key health and retail amenities so you can assess whether a site's surroundings support the product.
Health and acuity drivers
Common conditions among 65+ cohort
Higher prevalence = higher care intensity and faster transition into residential care
What drives people into care. The age profile tells you how many older people live in the catchment. The health profile tells you how quickly they will need care. Dementia is the single strongest predictor of transition from independent living to 24-hour care. The rate of 65+ residents with three or more long-term conditions is a broader marker of care complexity.
GP attendance rates among the 65+ cohort reinforce the picture — higher rates signal more chronic disease management, more referrals into home care and residential care, and a population already engaging heavily with the health system.
GP attendances per 100 people aged 65+
GP attendance intensity among the 65+ cohort — a proxy for local health-service demand and care complexity
Population projections — forward demand
Both products draw from the ageing population, but at different life stages. Retirement living demand begins in the early-to-mid 70s — downsizers seeking lower-maintenance living. RAC demand concentrates in the 85+ cohort, where the median entry age is 84–85. The projection data separates these bands so you can see which product the local growth supports. High-growth corridors will outstrip current per-10k supply benchmarks within a decade. Conversely, a catchment that shows undersupply today but has a flat or declining 85+ trajectory may not sustain a new facility through its lease period.
65-74, 75-84, and 85+ cohort growth to {FORECAST_YEAR}. The 85+ band drives RAC demand; the 65-74 band seeds the RL pipeline.
Residential aged care supply RAC
Australia operates {RAC_SERVICES_NATIONAL} residential aged care services with {RAC_PLACES_NATIONAL} operational places — about {RAC_PLACES_PER_10K_65PLUS_NATIONAL} per 10,000 people aged 65+.
Viability at a given location depends on the local ageing population, existing supply, and whether the care workforce can staff it. The under-supplied tail is where greenfield builds are most likely to fill while more mature markets typically lend themselves better to refurbishment, repositioning and introduction of niche services.
RAC places per 10,000 65+ — national distribution
Spread of SA3 regions by per-10k 65+ supply density. The under-supplied tail is where greenfield builds make sense.
AreaSearch also reports on home care provider density. These services are measured as total providers per 10,000 65+. There is no public capacity metric, however, so the count is directional rather than precise. Fewer home care providers than the regional rate implies an accelerated transition from independent living into 24-hour residential care. The government's shift toward community-based care (section 01) signals clear intent to delay this transition as demographic demand rises over coming decades.
RAC pricing — RAD and DAP
Accommodation in residential aged care is funded through a Refundable Accommodation Deposit (RAD — a lump sum, refundable on departure) or a Daily Accommodation Payment (DAP — the rental equivalent, calculated using the Maximum Permissible Interest Rate set by the Australian Government). Most residents choose a combination. AreaSearch breaks this down by room type and provider type at catchment level, benchmarked against the national median.
National median RAD by room type
National median Refundable Accommodation Deposit by room configuration. Single + Ensuite commands the premium; Shared + No Bath is the entry point. Source: December 2022 GEN service-details extract, the most recent published.
National room-type mix
Share of listed room configurations nationally — single ensuite dominates new builds; shared configurations persist in older stock.
Room types matter. The six standard room configurations — shared or single, combined with ensuite, shared bathroom, or no bathroom — produce materially different RAD levels. Single rooms with ensuite command the highest RAD, well above other configurations, and account for the majority of listed rooms nationally.
Provider type matters. For-profit, religious, charitable, and government operators price differently. For-profit operators generally command higher RADs but carry higher operating cost structures.
Maximum RAD without IHACPA approval: {RAD_MAX_NO_APPROVAL} (cap lifted from $550,000 on 1 January 2025; indexed annually each 1 July).
Current MPIR: {MPIR_LATEST}, resetting {MPIR_FREQUENCY}. The MPIR locks at the date of entry for that resident's entire stay. When rates are low, residents forfeit less interest by paying a RAD lump sum — so the revenue mix tilts toward RADs. When rates are high, the opportunity cost of a lump sum rises and more residents opt for DAP. For the operator, a higher RAD share means less accommodation revenue but lower capital requirements — use the RAD share slider in the Returns Calculator to model the impact.
AreaSearch ranks each catchment's cost of care relative to all SA2 areas nationally
National median RAD by provider type
National median RAD by provider ownership type. Source: December 2022 GEN service-details extract, the most recent published.
Retirement living supply RL
Retirement living is independent, age-restricted housing with shared amenity — typically for people in their 70s who are selling the family home. Australia has approximately {RV_VILLAGES_NATIONAL} retirement villages with {RV_DWELLINGS_NATIONAL} dwellings nationally.
AreaSearch reports the local retirement village count, dwelling count, dwellings per 10,000 65+, and estimated average dwelling price, and vacancies, benchmarked against the region. Higher per capita density signals a mature market where repositioning beats greenfield; lower density signals opportunity.
The 65+ age group exists everywhere. The home equity needed to fund a retirement village entry does not. An area can have the right age profile and still not work for retirement living if local property values are too low to fund ingoing contributions. Read the outright ownership rate and median dwelling value alongside the age data — these together determine the depth of the local buyer pool.
RL dwellings per 10,000 65+
Catchment RL dwelling density benchmarked against the national average.
National RL indicative entry price
National distribution of advertised retirement village dwelling prices — read alongside local median dwelling values to assess affordability
Dwelling price vs local home equity. If the indicative village entry price is close to or above the local median house price, the downsizer is not releasing equity — they are merely transferring it. The financial incentive weakens, and demand slows. The strongest retirement living markets are those where entry prices sit well below the surrounding residential market, giving buyers a meaningful equity release.
Access and amenity. Retirement village residents are independent — they drive, shop, and socialise. Proximity to shopping centres, medical services, and public transport matters. AreaSearch reports the distance to nearest supermarket, GP, pharmacy, and hospital alongside the retirement living data.
MMM workforce viability — the regional reality check
The Modified Monash Model (MMM) classifies every Australian location from MM1 (major city) to MM7 (very remote). For RAC, the tier directly predicts workforce supply — MM1–MM3 are feasible without supplement; MM4+ typically cannot staff without supplement payments or dedicated workforce strategies. For retirement living, MMM matters less (independent living requires fewer clinical staff), but MM4+ locations still face construction and maintenance workforce constraints.
| MMM tier | Description | Workforce viability |
|---|---|---|
| MM1 | Major city | Strong |
| MM2 | Regional centre | Strong |
| MM3 | Large rural town | Workable |
| MM4 | Medium rural town | Difficult — supplement often required |
| MM5 | Small rural town | Difficult — supplement often required |
| MM6 | Remote | Supplement-dependent |
| MM7 | Very remote | Supplement-dependent |
Verify MMM tier before anything else. Use the Department of Health's Health Workforce Locator — insert any address to get the MMM tier, DPA classification, and DWS status. This is the authoritative lookup for any aged-care site-selection conversation. An above-average per-10k-65+ supply gap in MM4 is interpreted differently from the same gap in MM1, because the MM4 operator is carrying a workforce premium.
Incoming supply — what is in the DA pipeline
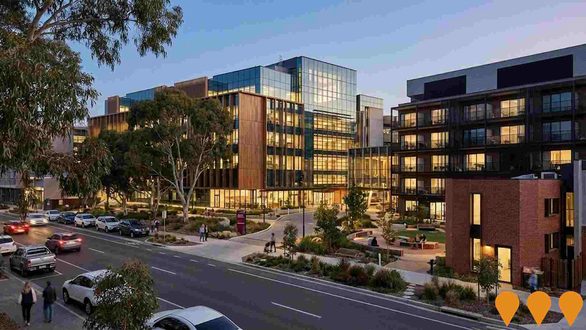
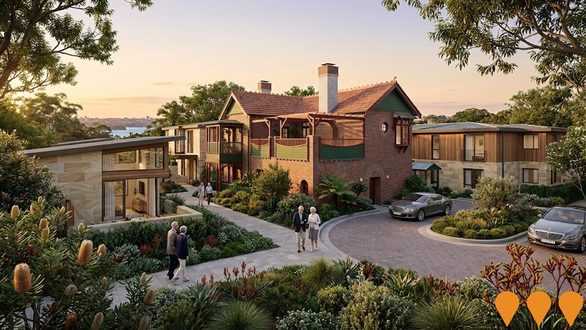
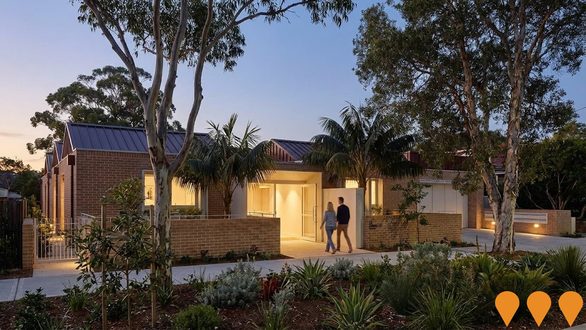
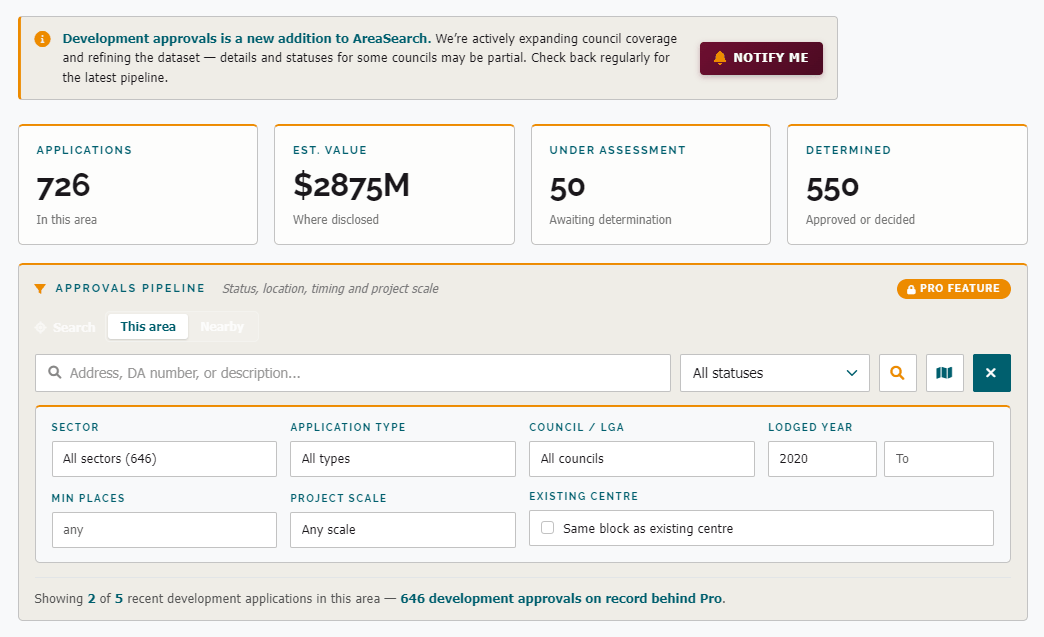
Current supply and demand ratios only cover what exists today. Council development application registers reveal what is approved, under assessment, or recently lodged — the forward supply that will change the competitive landscape within 2-3 years.
AreaSearch's Custom Catchment report scans the DA registers of every LGA that intersects the catchment, filters for aged care and retirement living applications, and reports each one with its status, estimated value, and distance from the site. This is the pipeline risk that desktop research alone cannot surface — a greenfield site that looks undersupplied today may already have 200 approved beds within 5 km.
An area can show undersupply on every demographic measure and still be unbuildable if the local labour market cannot staff to the 215-minute mandate. Workforce feasibility — the ability to attract, house, and retain clinical staff in a specific place — is what separates a viable facility from a stranded asset. Centres that fail typically fail on workforce, not occupancy.
04The site fit
Operator economics, site feasibility, and the regulatory framework for both products
Retirement living operator economics RL
You have found a catchment with the right age profile, strong home equity, and existing village demand. What do the economics look like?
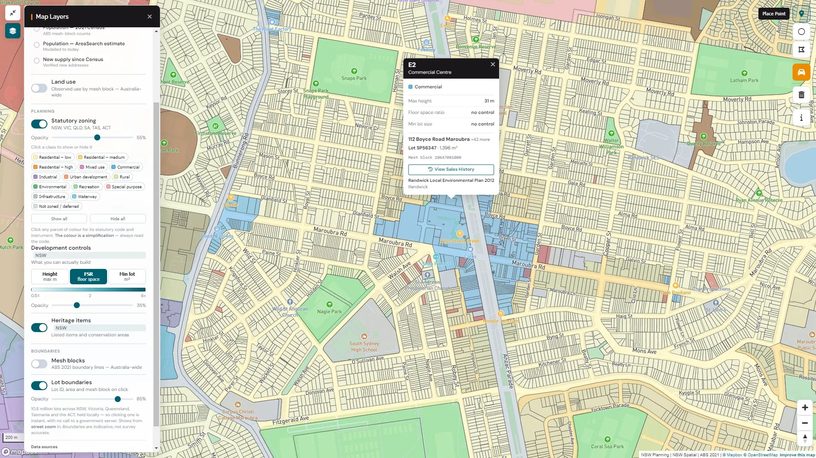
Statutory zoning, development controls and lot boundaries on the map — click any lot for its zoning code and controls.
DEFERRED MANAGEMENT FEE (DMF) effective yield per resident cycle
DMF earned     = ingoing contribution x DMF%
                 (capped at accrual period)

Annualised DMF = DMF earned / avg length of stay

Effective yield = DMF% / avg length of stay
                  e.g. 35% / 10 yrs = 3.5% p.a.

Convention: DMF {RV_DMF_TYPICAL}
Avg stay:   {RV_AVG_LENGTH_OF_STAY}
Use the Returns Calculator below to model specific scenarios.
- DMF effective yield over avg length of stay: {RV_DMF_EFFECTIVE_YIELD} — the headline operator return on the DMF mechanism.
- Average length of stay convention: {RV_AVG_LENGTH_OF_STAY} — drives the cycle frequency through which DMF accrues.
- Tenure types: Loan-Lease-Licence (LLL, ~70% of villages), strata title, community title, long-term lease, rental. LLL means the resident does not own the unit — the ingoing contribution is repaid on exit less DMF.
- Capital gain share: varies by contract — all splits from 0% to 100% to operator exist. Disclosed in the residence contract; no statutory default in any jurisdiction.
- Refurbishment cycle: {RV_REFURBISHMENT_FREQUENCY}. Outgoing resident typically bears wear-and-tear refurb cost; capital improvements borne by operator.
LLL vs strata — the underwriting distinction. Under Loan-Lease-Licence (the dominant tenure), the operator retains title and the resident's interest is a loan secured against a licence. The resident does not own the unit; the ingoing contribution is refunded on exit less DMF. This means RL capital value is an operator-level going-concern valuation, not a per-unit comparable. Strata villages are the exception — residents hold title and operator income comes from service charges, not DMF.
The life-course pathway — and why downsizing doesn't happen on schedule. The textbook transition runs: family home → retirement village → residential aged care. In practice, the transition stalls. Transaction costs erode the financial benefit, cash assets from a sale become assessable for the age pension where the family home is not, and spare bedrooms serve real functions (home office, visiting family, live-in carer). These frictions explain why downsizer demand is slower and more geographically concentrated than age data alone suggests.
Residential aged care operator economics RAC
RAC revenue comes from three sources: federal funding (AN-ACC), accommodation payments (RAD/DAP), and resident contributions. Understanding these determines whether a facility is financially viable at a given occupancy level.
The funding model — three components
- AN-ACC (federal, per-resident). Australian National Aged Care Classification replaced ACFI in October 2022. Each resident is classified into one of {ANACC_CLASS_COUNT} case-mix classes; each class carries a National Weighted Activity Unit (NWAU) multiplier. The weighted-average per-bed funding is the headline number for revenue modelling — currently {ANACC_LATEST_RATE} (up from {ANACC_PRIOR_BASE_PRICE}). Reviewed quarterly by the Aged Care Pricing Authority. Hotelling supplement: {HOTELLING_SUPPLEMENT} (covers cleaning, catering, laundry).
- Accommodation payments — RAD or DAP. Refundable Accommodation Deposit (lump sum, refundable on departure) or Daily Accommodation Payment (rental equivalent at MPIR). Maximum RAD without IHACPA approval: {RAD_MAX_NO_APPROVAL} (reform lifted cap from $550,000 on 1 January 2025; indexed annually each 1 July). Current MPIR: {MPIR_LATEST}, resetting {MPIR_FREQUENCY}. The MPIR locked at the date of entry applies for that resident's entire stay.
- Resident contributions. Basic Daily Fee at {BASIC_DAILY_FEE_PCT} of single basic age pension ({BASIC_DAILY_FEE}). Plus Means-tested Care Fee — annual cap {MTCF_ANNUAL_CAP_PRE_NOV25} and lifetime cap {MTCF_LIFETIME_CAP_PRE_NOV25} for pre-November-2025 residents. From 1 November 2025: Non-Clinical Care Contribution with a {NCC_LIFETIME_CAP_POST_NOV25} (significantly higher lifetime exposure, but capped at 4 cumulative years).
RAC daily revenue per occupied bed (illustrative)
AN-ACC variable       {ANACC_BASE_PRICE}
+ Hotelling supplement  {HOTELLING_SUPPLEMENT}
+ Basic Daily Fee       {BASIC_DAILY_FEE}
+ DAP (non-RAD beds)   varies — RAD x MPIR / 365
                        e.g. $450,000 x {MPIR_LATEST} / 365
─────────────────────────────────────────────────
Revenue per bed = AN-ACC + hotelling + BDF + DAP (if applicable)
Use the Returns Calculator below to model specific scenarios.
The 215 care minutes mandate. Every RAC service must deliver {ANACC_CARE_MINUTES} of total care per resident per day — 44 minutes must be Registered Nurse time. Quarterly reporting to the ACQSC validates compliance. This is the line that ties workforce scarcity directly to operating viability: if you cannot staff for 215 minutes, you are not eligible to operate.
RAC operating benchmarks
- Stabilised occupancy: {RAC_STABILISED_OCCUPANCY} — top-quartile metro operators target 92-95%. Below 80% is loss-making at most cost structures. National average: {RAC_OCCUPANCY_NATIONAL}.
- RAD pricing: national average {RAD_AVG_MAX_NATIONAL}, places-weighted across published facility maxima (December 2022 GEN service-details extract, the most recent published. The by-room-type and by-provider figures above are medians). AreaSearch breaks RAD down by room type, provider type, and catchment — see the RAD charts above.
- EBITDA per bed: {RAC_EBITDA_PER_BED_RANGE} (industry convention range — varies materially with acuity mix, RAD share, and operating cost structure).
- Site area for 100-bed facility: {RAC_SITE_AREA_100_BED} (Class 9c convention; varies with single-storey vs multi-storey).
State-by-state retirement living regulatory landscape
Each Australian state and territory has its own Retirement Villages Act. DMF caps, exit-fee disclosure, settlement timeframes, and resale obligations vary materially. Two jurisdictions have had major recent reforms: VIC (Retirement Villages Amendment Act 2025, commenced 1 May 2026) and WA (Retirement Villages Amendment Act 2024, commenced 2026 with 12-month operator transition period). Engage a retirement-village-specialist lawyer in the relevant jurisdiction before structuring contracts.
| State | Act | Cooling-off | DMF convention | Settlement / buy-back |
|---|---|---|---|---|
| NSW | {RV_NSW_ACT} | {RV_NSW_COOLING_OFF} | {RV_DMF_NSW} | {RV_SETTLEMENT_NSW} |
| VIC | {RV_VIC_ACT} | {RV_VIC_COOLING_OFF} | {RV_DMF_VIC} | {RV_SETTLEMENT_VIC} |
| QLD | {RV_QLD_ACT} | {RV_QLD_COOLING_OFF} | {RV_DMF_QLD} | {RV_SETTLEMENT_QLD} |
| WA | {RV_WA_ACT} | {RV_WA_COOLING_OFF} | {RV_DMF_WA} | {RV_SETTLEMENT_WA} |
| SA | {RV_SA_ACT} | {RV_SA_COOLING_OFF} | {RV_DMF_SA} | {RV_SETTLEMENT_SA} |
| TAS | {RV_TAS_ACT} | {RV_TAS_COOLING_OFF} | {RV_DMF_TAS} | {RV_SETTLEMENT_TAS} |
| ACT | {RV_ACT_ACT} | {RV_ACT_COOLING_OFF} | {RV_DMF_ACT} | {RV_SETTLEMENT_ACT} |
| NT | {RV_NT_ACT} | {RV_NT_COOLING_OFF} | {RV_DMF_NT} | {RV_SETTLEMENT_NT} |
NCC classifications + construction cost benchmarks
The two products build under different NCC classifications, which drive different compliance obligations and different cost-per-unit benchmarks:
| Product | NCC classification | Build cost benchmark | Notes |
|---|---|---|---|
| RAC | Class 9c (Residential Care Building) | {RAC_BUILD_COST_PER_BED} per bed | Allows for any low/high care mix without re-approval as needs change. ≥10% of residents need physical assistance to evacuate. |
| RL (villas) | Class 1a (detached) or Class 2 (apartments) | Standard residential construction rates apply | Same NCC classifications as mainstream housing. Serviced apartments with high care = Class 3. Premium for waterfront/inner-metro/luxury fitout. |
RAC build cost benchmarks sourced from Caulfield Krivanek Architecture Aged Care Building Cost Indicator (June 2026 edition). Always verify with current edition — construction cost inflation varies materially by state and build type.
Tax, GST & land tax
GST treatment — two different answers
| Product | GST treatment | Why |
|---|---|---|
| Residential Aged Care RAC | GST-free | Government-funded residential aged care is a GST-free supply under section 38-25 of the GST Act. No GST on resident contributions, AN-ACC payments, or RAD/DAP. |
| Retirement Living RL | Mixed | Accommodation is generally input-taxed (residential rental). Serviced apartments with daily meals/laundry can be GST-free. Commercial cafe/clubhouse elements are taxable. Margin scheme commonly elected on developer first-sales. |
Land tax — exemptions and exceptions
- NSW. RAC and RV both exempt under section 10R of the Land Tax Management Act 1956 — provided land is used solely for aged care or retirement village purposes. Partial-use proportional reduction available where the site is mixed.
- VIC. Charitable institution exemption available for housing for relief of poverty/old age — but the test was tightened from 2025. Not-for-profit aged care providers retain exemption; for-profit RV/RAC owners now generally pay land tax.
- Other states. QLD, WA, SA, and TAS have similar charity-conditioned exemptions. For-profit operators generally pay land tax with limited concession. Always verify with the relevant state revenue office.
Stamp duty
Concessional or exempt for charitable not-for-profit aged care purchases (e.g. NSW Duties Act charitable exemption). For-profit aged care purchases pay full transfer duty. Charity exemptions vary by state but are generally narrow — the entity must satisfy a charitable purpose test, not merely operate a charitable-style service. RV transactions attract standard transfer duty unless a specific exemption applies.
Capital gains tax + negative gearing
- RV — CGT. LLL contracts: resident has loan/licence, not ownership — main residence CGT exemption does not apply to the RV interest. Strata RV: ownership = potential main-residence treatment for the resident. For the operator, RV land is investment property and CGT applies on disposal.
- RAC — operator level. RAC facilities are operating businesses, not individual investment properties. Capital gains apply at the entity level on disposal of the operating asset. DAP is accommodation revenue (income). RAD is a refundable deposit — a liability, not revenue — returned in full on the resident's departure.
The land-tax question decides the structure. For-profit RV and RAC owners generally pay land tax on the site (VIC tightened its charity test from 2025), while not-for-profit providers retain exemptions. On a large metro site the land-tax line can move the stabilised yield by a full percentage point — settle the ownership structure and exemption position before the feasibility, not after.
How the calculator works
Use the mode toggle to switch between RAC and Retirement Living. All sliders are interconnected. Hover any dotted label for a tooltip explaining the input. The calculator runs two modes side-by-side. Mode A — Residential Aged Care models the operator-investor: AN-ACC + RAD/DAP revenue, operating EBITDA, stabilised yield, IRR. Mode B — Retirement Living models the village operator: ingoing-contribution + DMF mechanics, operating margin, effective unit yield, IRR. Set the inputs for your facility or village and request your cash flow model — we email you the full model (revenue, EBITDA, returns and a year-by-year cash flow) built from your settings.
Aged Care Returns Calculator
Sensitivity — EBITDA at different occupancy levels
This calculator is a financial modelling tool provided by AreaSearch for indicative analysis only — not investment, tax, or legal advice. AN-ACC, RAD/DAP, MPIR, and state RV regulations all change at varying review cycles (quarterly, annually, or on legislative refresh). Verify all current rates with the relevant authority before transacting: Department of Health, Disability and Ageing for AN-ACC, RAD limits, MPIR, and Aged Care Act compliance; the relevant state Retirement Villages Act administering body for DMF and exit-fee disclosure obligations. Operator economics range widely with acuity mix (RAC) and demographic and pricing tier (RL). Construction cost benchmarks (Rawlinsons / RLB) are point-in-time. Speak to a qualified accountant, aged-care lawyer, and operator-specialist advisor before committing capital. Past sector performance does not guarantee future returns; the regulatory environment for both products is in active reform.
05Worked example
{EXAMPLE_HIGH_NAME} vs {EXAMPLE_LOW_NAME} — two {PAIR_ADJACENCY}SA4 regions in Greater {PAIR_METRO}, with materially different supply profiles.
{EXAMPLE_HIGH_NAME} and {EXAMPLE_LOW_NAME} are {PAIR_ADJACENCY}SA4 regions in Greater {PAIR_METRO} — same state regulator, same metropolitan economy, same demographic platform. On paper, they should look similar. The data shows otherwise.
| {EXAMPLE_HIGH_NAME} | {EXAMPLE_LOW_NAME} | |
|---|---|---|
| RAC places per 10k 65+ | {EXAMPLE_HIGH_RAC_PER10K} | {EXAMPLE_LOW_RAC_PER10K} |
| 85+ share of population | {EXAMPLE_HIGH_85PLUS_PCT} | {EXAMPLE_LOW_85PLUS_PCT} |
| 75+ share of population | {EXAMPLE_HIGH_75PLUS_PCT} | {EXAMPLE_LOW_75PLUS_PCT} |
| Retirement villages | {EXAMPLE_HIGH_RV_COUNT} | {EXAMPLE_LOW_RV_COUNT} |
| Median household income | {EXAMPLE_HIGH_INCOME} | {EXAMPLE_LOW_INCOME} |
| Population growth | {EXAMPLE_HIGH_POP_GROWTH} | {EXAMPLE_LOW_POP_GROWTH} |
{SA4_SUPPLY_SPREAD_MULTIPLE} variation in RAC supply density between two {PAIR_ADJACENCY}SA4 regions. But the regional average alone doesn't tell you where to build. Aged care supply is physically concentrated at specific addresses — a parent SA4 that looks undersupplied can contain pockets of local saturation where several facilities cluster, and a well-supplied SA4 can contain genuine gaps where no facility serves the immediate catchment. A site-level custom catchment routinely crosses SA4 boundaries, capturing supply and demand that no single regional average accounts for.
Site-level analysis within each SA4
The SA4 comparison above is useful context — but it's an average across a large region. Below are two illustrative site catchments that demonstrate exactly how the site-level picture can diverge from the regional headline.
{SITE_A_LABEL}
In the undersupplied SA4 ({EXAMPLE_LOW_NAME}) · {SITE_A_GEO}
| Catchment | |
| Resident population | {SITE_A_POP} |
| 65+ / 75+ / 85+ share | {SITE_A_65PLUS_PCT} · {SITE_A_75PLUS_PCT} · {SITE_A_85PLUS_PCT} |
| RAC places per 10k 65+ | {SITE_A_RAC_PER_10K} ({SITE_A_RAC_PLACES_EXISTING} places) |
| Retirement villages | {SITE_A_RV_VILLAGES} |
| Median dwelling value | {SITE_A_MEDIAN_DWELLING} |
| RAC places required (today → {FORECAST_YEAR}) | {SITE_A_RAC_PLACES_REQ_TODAY} → {SITE_A_RAC_PLACES_REQ_FORECAST} |
{SITE_A_VERDICT}
{SITE_B_LABEL}
In the well-supplied SA4 ({EXAMPLE_HIGH_NAME}) · {SITE_B_GEO}
| Catchment | |
| Resident population | {SITE_B_POP} |
| 65+ / 75+ / 85+ share | {SITE_B_65PLUS_PCT} · {SITE_B_75PLUS_PCT} · {SITE_B_85PLUS_PCT} |
| RAC places per 10k 65+ | {SITE_B_RAC_PER_10K} ({SITE_B_RAC_PLACES_EXISTING} places) |
| Retirement villages | {SITE_B_RV_VILLAGES} |
| Median dwelling value | {SITE_B_MEDIAN_DWELLING} |
| RAC places required (today → {FORECAST_YEAR}) | {SITE_B_RAC_PLACES_REQ_TODAY} → {SITE_B_RAC_PLACES_REQ_FORECAST} |
RAC RL {SITE_B_VERDICT}
The takeaway: The SA4-level ratio said {EXAMPLE_LOW_NAME} was undersupplied and {EXAMPLE_HIGH_NAME} was comfortable. The site-level catchments tell the opposite story — a saturated pocket inside the "undersupplied" region, and a genuine gap inside the "well-supplied" one. This isn't an anomaly; it's what happens when supply is clustered at specific addresses and regional averages smooth the variation away. The regional comparison identifies where to look — the site-level catchment determines whether the opportunity is actually there.
Sources: ABS · Centre for Population · Aged Care Quality and Safety Commission (ACQSC) · GEN Aged Care Data · Department of Health, Disability and Ageing · Modified Monash Model (MMM) · Productivity Commission (ROGS Section 14) · State Retirement Villages Acts (8 jurisdictions) · National Construction Code · Rawlinsons / RLB · AreaSearch. Updated {LATEST_REFRESH_DATE}. This article is a preliminary scoping resource. Make your own enquiries and seek independent professional advice before acting on any information here.