On this page
General information only — not financial, investment, legal, or tax advice. Verify all data independently and seek professional advice before making investment decisions. Full disclaimer.
The {TAX_REFORM_PACKAGE_LABEL}, announced at {TAX_REFORM_ANNOUNCEMENT_DATETIME}, changes how negative gearing and capital gains tax apply to residential property. For established housing acquired after the cutoff, {TAX_REFORM_NG_LOSS_OFFSET_NEW}. From {TAX_REFORM_CGT_EFFECTIVE_DATE}, the existing CGT discount is replaced by {TAX_REFORM_CGT_NEW_REGIME}. {TAX_REFORM_NEW_BUILD_TREATMENT}. The result is three tax treatments: properties held before the cutoff, established properties acquired afterward, and new residential properties. The core fundamentals of residential investment remain familiar—demand, supply, affordability, rents, location and financing—but construction-cost exposure and the changed tax settings deserve more deliberate weighting than they have in recent years.
These metro SA3s recorded persistently fewer dwelling approvals than their population growth implied in the latest five-year period assessed. Approval coverage is the estimated share of implied dwelling need met; lower figures indicate a larger shortfall.
| SA3 | Approval coverage of implied need | Three-year rent growth |
|---|---|---|
| {TOP_SHORTFALL_AREA_1} | {TOP_SHORTFALL_APPROVAL_COVERAGE_1} | {TOP_SHORTFALL_RENT_GROWTH_3YR_1} |
| {TOP_SHORTFALL_AREA_2} | {TOP_SHORTFALL_APPROVAL_COVERAGE_2} | {TOP_SHORTFALL_RENT_GROWTH_3YR_2} |
| {TOP_SHORTFALL_AREA_3} | {TOP_SHORTFALL_APPROVAL_COVERAGE_3} | {TOP_SHORTFALL_RENT_GROWTH_3YR_3} |
| {TOP_SHORTFALL_AREA_4} | {TOP_SHORTFALL_APPROVAL_COVERAGE_4} | {TOP_SHORTFALL_RENT_GROWTH_3YR_4} |
| {TOP_SHORTFALL_AREA_5} | {TOP_SHORTFALL_APPROVAL_COVERAGE_5} | {TOP_SHORTFALL_RENT_GROWTH_3YR_5} |
Only areas below the dwelling requirement implied by local household size are included. Rent growth is the total change over the latest three years.
01The opportunity right now
Residential investment still hinges on demand, supply, affordability, rents, location and financing, but the available formats and the tax treatment attached to each one now matter more.
The {TAX_REFORM_PACKAGE_LABEL}, announced at {TAX_REFORM_ANNOUNCEMENT_DATETIME}, changes the relative appeal of established property, new supply and development. The core investment process is familiar: understand the market, assess the site, model the cash flow and price the risks. While the reform changes which pathway may suit a particular investor, it does not replace those fundamentals.
The gap between residential demand and supply
National approvals have fallen from {APPROVALS_AUS_PEAK} dwellings per 1,000 residents in {APPROVALS_AUS_PEAK_PERIOD} to {APPROVALS_AUS_LATEST} in {APPROVALS_AUS_LATEST_PERIOD} while population has maintained consistent growth ({POP_GROWTH_SINCE_CENSUS_NATIONAL} since the 2021 Census). Geographic variations are notable, however, with {STATE_COMPARISON_AREA_1} estimated to have covered {STATE_COMPARISON_COVERAGE_1} of implied dwelling need over the past 5 years, compared with {STATE_COMPARISON_AREA_2} at {STATE_COMPARISON_COVERAGE_2}. Local levels see higher levels of variation again. For investors, the questions are: what type of housing is lacking locally, and is there an opportunity to acquire existing stock or deliver new supply at a viable cost?
National population growth per dwelling approval
Annual population growth divided by dwelling approvals, using AreaSearch population and development data.
There is more than one way to invest in residential property
Established buy-and-hold
Acquire an existing house, townhouse or apartment to rent out, renovate or occupy while renting a room. For post-cutoff purchases, {TAX_REFORM_NG_LOSS_OFFSET_NEW}, so yield, serviceability and the ownership structure deserve more attention.
New build or off-the-plan
Invest in a new apartment, townhouse or house, either off the plan or after construction is complete. {TAX_REFORM_NEW_BUILD_TREATMENT}. {TAX_REFORM_CGT_NEW_BUILD_CHOICE}.
Small-scale development
Use a site’s zoning, lot dimensions, costs and approval pathway to assess a granny flat, duplex, townhouse or multi-dwelling outcome in an undersupplied market. Site feasibility and execution are as important as a suburb’s headline metrics.
Build-to-rent, co-living and larger-scale housing
BTR is a long-hold, single-owner rental format rather than a conventional sell-down project. Co-living uses the same operated, long-hold model, with smaller private rooms and shared kitchens and living spaces. Federal eligibility includes {BTR_MIN_DWELLINGS_FEDERAL}, {BTR_HOLD_PERIOD_FEDERAL} of single ownership and {BTR_AFFORDABLE_QUOTA_FEDERAL}. Eligible projects may also qualify for a {BTR_MIT_WITHHOLDING_RATE} MIT (managed investment trust) withholding rate for certain foreign investors.
.. and there are multiple kinds of investor
An individual or family may need dependable cash flow and borrowing headroom. An SMSF investor must stay within superannuation and limited-recourse borrowing rules. A trust or company may suit different ownership and distribution needs. A developer or institution is looking for a site that can support scale, funding, construction and either an exit or a long-term rental operation. Some investors prioritise income now; others accept a lower yield for stronger expected value growth. The same location can support different strategies—or none—depending on who is investing.
02Using AreaSearch for residential
Two starting points — the tools are the same, the entry point differs
You might be looking for somewhere to invest, or checking a property you've already found. Either way, you're working from official data, thoroughly cross-examined, and at the most granular levels available, a firmer footing than biased market commentary or a single sale down the street.
I'm searching for opportunities
You do not have a specific site yet. You want to find under-supplied or yield-strong areas, then identify viable addresses within them.
- Use the heatmap to scan for supply-pressured or high-yield regions nationally
- Use Target Search to filter by yield, growth, undersupply ratio and demographic factors by percentile rank
- Read area profiles for shortlisted suburbs for a zero commitment spot check
- Run a custom catchment around candidate addresses to confirm at site level
I have a property to evaluate
A specific address has come across your desk. You need to know whether the area economics support the investment before committing time and capital.
- Read the area profile and sales trends for the suburb for the latest capital values, rental, and demographic information — no sign-up required
- Run a custom catchment around the address for site-specific supply, demand, and infrastructure
- Run the Returns Calculator (Section 04) under the applicable tax cohort
The tools are described below. For most users, the area profile is the right starting point. It is free, and covers any area in Australia.
The heatmap — broad scan
The homepage choropleth heatmap lets you toggle residential layers — dwelling approvals per 1,000 population, rental yield, population growth — across the entire country. Within thirty seconds you can identify the regions where supply pressure or yield concentrates. Narrow your focus to the sub-regions worth drilling into.
Area and suburb profiles — free taster
Open any suburb or SA2 area profile and read the sections that matter for residential investment:
- Population. Growth rate (historical and projected), NOM contribution, age cohort breakdown, and economic profile — the demand side.
- Housing. Tenure (owner-occupier vs renter share), dwelling structure mix, median rent and mortgage, rent-to-income ratio.
- Rents. Rolling 12-month median weekly rent by dwelling type and bedroom count, year-on-year rent growth, bond activity, all sourced from state rental bond authorities.
- Income. Median household income, income distribution, employment stack — the affordability reading.
- Development. DA pipeline, approvals per 1,000 population, dwelling completions — forward supply and competition.
- Schools. Distance to nearby primary and secondary schools, plus school quality. Closer access to public schools, and stronger school results, have both been linked to higher house prices.
- Transport. Distance to rail stations and other transport links. Homes within walking distance of a station consistently sell at a premium to those further away.
- Land and zoning. Zoning, land use and how much developable land remains. A rezoning can lift the value of the sites it covers, while planning limits on new housing have been shown to raise the price of existing homes.
Target Search — multi-criteria shortlisting
Reverse-engineered location analysis. Define your success criteria — yield > x AND growth > y AND undersupply ratio < z AND median income > w — and the platform returns a ranked list of catchments matching all of them, anywhere in Australia. Operator and Pro tier.
Custom catchment — the site-level decision
Pro tier. Draw a catchment around any address — radius, polygon, or drive-time isochrone. Population, supply, demand, infrastructure, and affordability metrics rebuild around the actual boundary, not the SA3 the address happens to sit inside. Check pricing premiums by dwelling type and bedroom count in your exact area, to ensure your investment meets the market.
03The signals that matter
Yield, growth, supply, demand, affordability and infrastructure
No single measure settles whether an area is worth investing in, with some key signals below each telling their own part of the story. At local levels, combined with the full range of demographic and planning data (zoning, cadastre and more), such metrics are essential to helping you judge whether an opportunity is worth pursuing, and on what terms.
| Capital | Median house | Median unit | House price growth, 10 years (p.a.) | Implied gross yield | House price to earnings | Rent share of earnings | Dwelling approvals per 1,000 residents, {CAP_APPROVALS_PERIOD} |
|---|---|---|---|---|---|---|---|
| Sydney | {CAP_HOUSE_PRICE_SYDNEY} | {CAP_UNIT_PRICE_SYDNEY} | {CAP_HOUSE_GROWTH_10YR_SYDNEY} | {CAP_GROSS_YIELD_SYDNEY} | {CAP_PRICE_EARNINGS_SYDNEY} | {CAP_RENT_SHARE_SYDNEY} | {CAP_APPROVALS_PER_1000_SYDNEY} |
| Melbourne | {CAP_HOUSE_PRICE_MELBOURNE} | {CAP_UNIT_PRICE_MELBOURNE} | {CAP_HOUSE_GROWTH_10YR_MELBOURNE} | {CAP_GROSS_YIELD_MELBOURNE} | {CAP_PRICE_EARNINGS_MELBOURNE} | {CAP_RENT_SHARE_MELBOURNE} | {CAP_APPROVALS_PER_1000_MELBOURNE} |
| Brisbane | {CAP_HOUSE_PRICE_BRISBANE} | {CAP_UNIT_PRICE_BRISBANE} | {CAP_HOUSE_GROWTH_10YR_BRISBANE} | {CAP_GROSS_YIELD_BRISBANE} | {CAP_PRICE_EARNINGS_BRISBANE} | {CAP_RENT_SHARE_BRISBANE} | {CAP_APPROVALS_PER_1000_BRISBANE} |
| Adelaide | {CAP_HOUSE_PRICE_ADELAIDE} | {CAP_UNIT_PRICE_ADELAIDE} | {CAP_HOUSE_GROWTH_10YR_ADELAIDE} | {CAP_GROSS_YIELD_ADELAIDE} | {CAP_PRICE_EARNINGS_ADELAIDE} | {CAP_RENT_SHARE_ADELAIDE} | {CAP_APPROVALS_PER_1000_ADELAIDE} |
| Perth | {CAP_HOUSE_PRICE_PERTH} | {CAP_UNIT_PRICE_PERTH} | {CAP_HOUSE_GROWTH_10YR_PERTH} | {CAP_GROSS_YIELD_PERTH} | {CAP_PRICE_EARNINGS_PERTH} | {CAP_RENT_SHARE_PERTH} | {CAP_APPROVALS_PER_1000_PERTH} |
| Hobart | {CAP_HOUSE_PRICE_HOBART} | {CAP_UNIT_PRICE_HOBART} | {CAP_HOUSE_GROWTH_10YR_HOBART} | {CAP_GROSS_YIELD_HOBART} | {CAP_PRICE_EARNINGS_HOBART} | {CAP_RENT_SHARE_HOBART} | {CAP_APPROVALS_PER_1000_HOBART} |
| Darwin | {CAP_HOUSE_PRICE_DARWIN} | {CAP_UNIT_PRICE_DARWIN} | {CAP_HOUSE_GROWTH_10YR_DARWIN} | {CAP_GROSS_YIELD_DARWIN} | {CAP_PRICE_EARNINGS_DARWIN} | {CAP_RENT_SHARE_DARWIN} | {CAP_APPROVALS_PER_1000_DARWIN} |
| Canberra | {CAP_HOUSE_PRICE_CANBERRA} | {CAP_UNIT_PRICE_CANBERRA} | {CAP_HOUSE_GROWTH_10YR_CANBERRA} | {CAP_GROSS_YIELD_CANBERRA} | {CAP_PRICE_EARNINGS_CANBERRA} | {CAP_RENT_SHARE_CANBERRA} | {CAP_APPROVALS_PER_1000_CANBERRA} |
| All capitals | {CAP_HOUSE_PRICE_NATIONAL} | {CAP_UNIT_PRICE_NATIONAL} | {CAP_HOUSE_GROWTH_10YR_NATIONAL} | {CAP_GROSS_YIELD_NATIONAL} | {CAP_PRICE_EARNINGS_NATIONAL} | {CAP_RENT_SHARE_NATIONAL} | {CAP_APPROVALS_PER_1000_NATIONAL} |
Median sale prices from the ABS, {CAP_PRICE_PERIOD}; the all-capitals figures cover the eight capital cities combined. Rents are rolling-year medians from state rental bond records{CAP_RENT_MISSING_NOTE}. Implied gross yield compares the median rent on new leases with the median sale price, so it is a guide, not the yield on any particular property. Rent is not published for the capitals combined. Earnings are average full-time earnings for one person, not household income. Approvals cover each greater capital city area.
Yield and vacancy
Gross rental yield is a year's rent divided by the price of the property. Comparing median rents with median sale prices, implied gross yield across the capitals currently ranges from {CAP_YIELD_LOW_VALUE} in {CAP_YIELD_LOW_NAME} to {CAP_YIELD_HIGH_VALUE} in {CAP_YIELD_HIGH_NAME}. Net yield is what is left after rates, insurance, maintenance, management fees and, for apartments and townhouses, strata levies. From {TAX_REFORM_NG_EFFECTIVE_DATE}, for established homes bought after {TAX_REFORM_ANNOUNCEMENT_DATETIME}, {TAX_REFORM_NG_LOSS_OFFSET_NEW}, so a property whose rent does not cover its costs weighs more heavily on the investor's cash flow.
Yield assumes the property is let. Where vacancy is high, the weeks between tenants eat into it, so check how long rentals are sitting on the market in the area before making a decision.
AreaSearch reports median weekly rents from state rental bond records, by dwelling type and number of bedrooms, with year-on-year growth, for areas and custom catchments in {RENT_STATES}. In {SALES_STATES}, yield is also calculated directly from local rents and sale prices, and we are actively expanding sales coverage to other states.
total return ≈ net yield + capital growth
Example: 3.5% gross yield − 2.0% costs = 1.5% net yield, plus 6.5% growth = 8.0% total return (before tax)
Implied gross yield and 10-year house price growth by capital
Growth
Over the ten years to {CAP_PRICE_PERIOD}, median house prices rose fastest in {CAP_GROWTH_HIGH_NAME}, at {CAP_GROWTH_HIGH_VALUE} a year, and slowest in {CAP_GROWTH_LOW_NAME}, at {CAP_GROWTH_LOW_VALUE}. Across all capitals the ten-year rate was {CAP_HOUSE_GROWTH_10YR_NATIONAL} a year, and {CAP_HOUSE_GROWTH_1YR_NATIONAL} over the latest year.
A single strong year says little about the next ten. Especially at local levels where sales composition can jump significantly as major developments come online. When modelling a long hold, test the returns against long-run growth rates, not just recent ones, and assess across dwelling types. Then closely examine the demand behind future price growth — planned infrastructure, population forecasts, and approval pipeline.
House price growth by capital, 10 years (p.a.)
Supply
Development applications are the earliest sign of new supply. Approvals follow, but not every one gets built, and apartments take much longer to finish than single houses. Nationally, {APPROVALS_AUS_LATEST} dwellings were approved per 1,000 residents in {APPROVALS_AUS_LATEST_PERIOD} and {ECO_COMPLETIONS_PER_1000_AUS} were completed per 1,000 residents in the year to {ECO_COMPLETIONS_PER_1000_PERIOD}, but locally this metric varies widely from one area to the next.
National dwelling approvals per 1,000 residents
Demand
Population growth drives housing demand, and overseas migration is the largest part of it. In the year to {ECO_NOM_PERIOD}, net overseas migration added {ECO_NOM_AUS} people, or {ECO_NOM_SHARE_OF_GROWTH} of national population growth.
The housing required by a student from overseas or a working holiday maker, however, can differ markedly from that required by upsizing familes, or downsizing seniors, both in composition and location. Students and young workers prefer studios and one and two bedroom apartments close to universities, hospitals and city jobs, though in tighter markets, grouping together to lease a larger house is common. Young families look for three and four bedroom houses near schools while older owners are more likely to own outright, and often look to move to smaller, low-maintenance homes.
The make-up of an area also affects how steady its market is. Rental demand in student-heavy suburbs depends on enrolments and international student numbers, and in mining and resource towns on a single industry. Areas with a broad mix of ages, incomes and employers are less exposed to any one source of demand falling away, and naturally, those with a lower proportion of rental housing present less competitive risk to local landlords.
Unemployment rate
Illustrative, not a real location.
Affordability
Prices and rents can only run so far ahead of incomes. The median capital-city house costs {CAP_PRICE_EARNINGS_NATIONAL} average full-time annual earnings, from {CAP_PE_LOW_VALUE} in {CAP_PE_LOW_NAME} to {CAP_PE_HIGH_VALUE} in {CAP_PE_HIGH_NAME}. For renters, the median rent takes {ECO_RENT_SHARE_AUS} of average full-time weekly earnings nationally.
A common test of housing stress is AHURI's 30:40 indicator: lower-income households spending more than 30% of their income on housing. Area profiles show median rent and mortgage repayments against local household income, so you can see how close an area is to that ceiling.
Capital-city house price to full-time earnings
Median capital-city house price divided by average full-time annual earnings, June quarter each year.
Infrastructure
New transport, health, education and urban renewal projects can change how attractive an area is to live in, and how many homes it can hold. AreaSearch tracks {INFRA_PROJECTS_ACTIVE} projects that are proposed, approved or under construction, and shows which of them fall near any area or custom catchment.
Incoming supply — what is in the DA pipeline
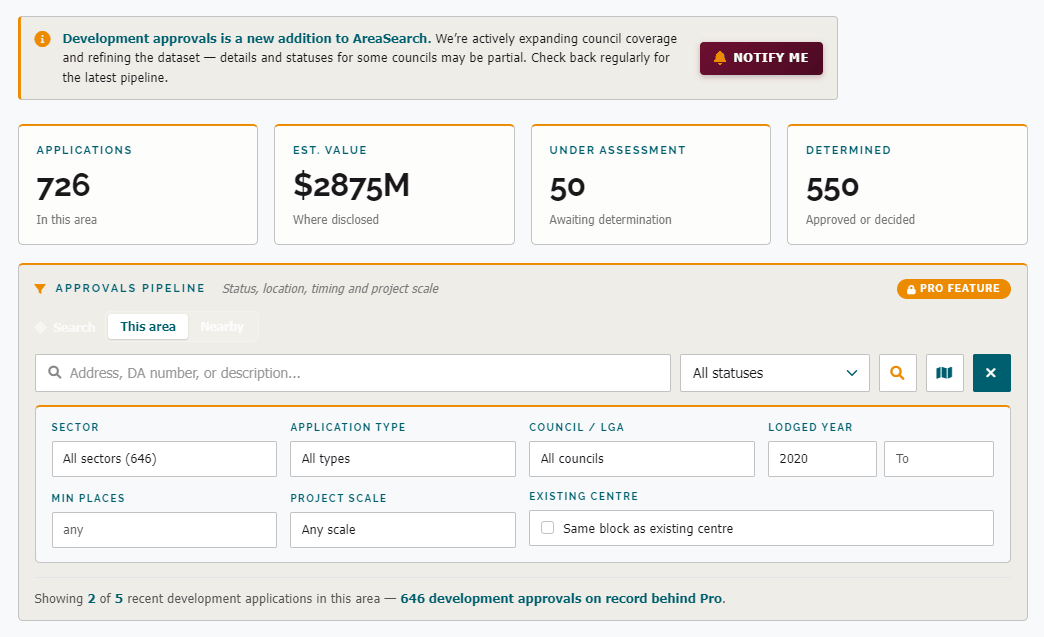
Approvals figures show how much housing is coming at area level. Development applications show exactly where. A suburb that looks short of housing today can change quickly if several apartment or townhouse projects nearby are approved, and those new homes will compete for the same tenants and buyers as the property you are assessing.
- Approved but not yet built — committed supply that has not yet reached the rental or sales market.
- Applications under assessment — not all will be approved, but a cluster of applications shows that developers see the same opportunity.
- Project scale and type — the number and type of dwellings proposed shows whether new supply will compete with a house, a townhouse or an apartment.
AreaSearch's custom catchment report scans council DA registers within the catchment and lists each application with its status, lodgement date, estimated value and distance from the site, so you can check forward supply without searching council portals one by one.
04The site fit
How tax treatment, state duties and taxes, and what the site allows you to build change the return on a residential property
An area with the right demand, supply and affordability is only half the assessment. The next question is what this particular site allows. Its zoning, height and floor space controls, and the size and frontage of the lot decide whether it can take a granny flat, a subdivision, townhouses or apartments, and so what the land is worth to a developer as well as to a landlord.
The return then depends on how the property is taxed: whether it is established or new, which state it is in, and who owns it.
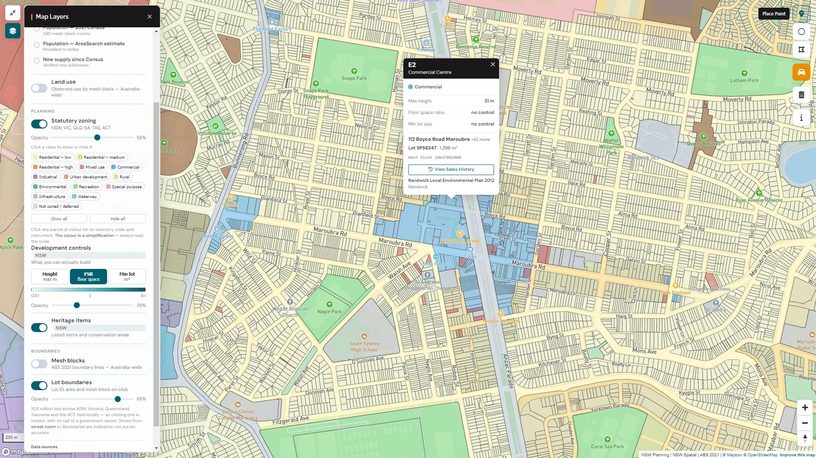
Statutory zoning, development controls and lot boundaries on the map — click any lot for its zoning code and controls.
Tax framework
Federal tax (pre and post reform), stamp duty, land tax, FIRB — all eight jurisdictions
Federal — depreciation
Buyers of established homes can depreciate the building itself but not the fittings already in it ({DIV40_SECONDHAND_RULE}), so new builds carry larger depreciation claims in the early years. The building itself depreciates at {DIV43_CAPITAL_WORKS_RATE} for homes built after {DIV43_CONSTRUCTION_CUTOFF}, and those deductions remain available after the {TAX_REFORM_PACKAGE_LABEL}.
Federal — other investment tax rules
Foreign resident capital gains withholding: when any residential property is sold, the buyer must withhold {FRCGW_RATE} of the price for the ATO unless the seller provides a clearance certificate confirming they are an Australian resident. Since {FRCGW_THRESHOLD_REMOVED_DATE} this applies at any sale price, so investors should apply for a clearance certificate well before settlement.
Vacant land: interest, rates and other holding costs on vacant residential land are not deductible until a home on it is built and available to rent ({VACANT_LAND_DEDUCTION_START}); instead, they are added to the land's cost base.
Travel: individual investors cannot deduct the cost of travelling to inspect, maintain or collect rent from a residential rental property ({TRAVEL_DEDUCTION_RESIDENTIAL}).
SMSF: a self-managed super fund can borrow to buy property only through a limited recourse borrowing arrangement, for a single asset. Super funds are exempt from the negative gearing and CGT changes in the {TAX_REFORM_PACKAGE_LABEL}, which makes holding residential property inside super relatively more attractive than before.
Stamp duty on an investment property
Transfer duty is charged on a sliding scale: a base amount plus a percentage of the price above each band's starting point. Enter a purchase price to see the duty in each state and the band that applies. First home buyer and off-the-plan concessions are not included.
| State | Duty | Band that applies | Foreign purchaser surcharge |
|---|---|---|---|
| NSW | {DUTY_AT_EXAMPLE_NSW} | {DUTY_RATE_AT_EXAMPLE_NSW} | {FOREIGN_PURCHASER_SURCHARGE_NSW} |
| VIC | {DUTY_AT_EXAMPLE_VIC} | {DUTY_RATE_AT_EXAMPLE_VIC} | {FOREIGN_PURCHASER_SURCHARGE_VIC} |
| QLD | {DUTY_AT_EXAMPLE_QLD} | {DUTY_RATE_AT_EXAMPLE_QLD} | {FOREIGN_PURCHASER_SURCHARGE_QLD} |
| WA | {DUTY_AT_EXAMPLE_WA} | {DUTY_RATE_AT_EXAMPLE_WA} | {FOREIGN_PURCHASER_SURCHARGE_WA} |
| SA | {DUTY_AT_EXAMPLE_SA} | {DUTY_RATE_AT_EXAMPLE_SA} | {FOREIGN_PURCHASER_SURCHARGE_SA} |
| TAS | {DUTY_AT_EXAMPLE_TAS} | {DUTY_RATE_AT_EXAMPLE_TAS} | {FOREIGN_PURCHASER_SURCHARGE_TAS} |
| ACT | {DUTY_AT_EXAMPLE_ACT} | {DUTY_RATE_AT_EXAMPLE_ACT} | {FOREIGN_PURCHASER_SURCHARGE_ACT} |
| NT | {DUTY_AT_EXAMPLE_NT} | {DUTY_RATE_AT_EXAMPLE_NT} | {FOREIGN_PURCHASER_SURCHARGE_NT} |
Land tax
Land tax is charged each year on the total land value (not the purchase price) of the investment properties you own in a state, above that state's tax-free threshold. Your own home is exempt, and holdings in different states are assessed separately. Rates rise in steps as land value increases. Enter a total land value to compare the tax in each state.
| State | Tax-free threshold (land value) | Land tax | Top rate | Foreign surcharge | Note |
|---|---|---|---|---|---|
| NSW | {LT_THRESHOLD_NSW} | {LT_AT_EXAMPLE_NSW} | {LT_TOP_RATE_NSW} | {LAND_TAX_NSW_FOREIGN_SURCHARGE} | Assessed on a three-year average of land values; thresholds frozen |
| VIC | {LT_THRESHOLD_VIC} | {LT_AT_EXAMPLE_VIC} | {LT_TOP_RATE_VIC} | {LAND_TAX_VIC_ABSENTEE_SURCHARGE} (absentee) | Vacant residential land tax: {LAND_TAX_VIC_VRLT} |
| QLD | {LT_THRESHOLD_QLD} | {LT_AT_EXAMPLE_QLD} | {LT_TOP_RATE_QLD} | {LAND_TAX_QLD_FOREIGN_SURCHARGE} | Counts Queensland land only |
| WA | {LT_THRESHOLD_WA} | {LT_AT_EXAMPLE_WA} | {LT_TOP_RATE_WA} | {LAND_TAX_WA_FOREIGN_SURCHARGE} | Perth metro land also pays the Metropolitan Region Improvement Tax |
| SA | {LT_THRESHOLD_SA} | {LT_AT_EXAMPLE_SA} | {LT_TOP_RATE_SA} | {LAND_TAX_SA_FOREIGN_SURCHARGE} | Threshold indexed each year to site values |
| TAS | {LT_THRESHOLD_TAS} | {LT_AT_EXAMPLE_TAS} | {LT_TOP_RATE_TAS} | {LAND_TAX_TAS_FOREIGN_SURCHARGE} | |
| ACT | {LT_THRESHOLD_ACT} | {LT_AT_EXAMPLE_ACT} | {LT_TOP_RATE_ACT} | {LAND_TAX_ACT_FOREIGN_SURCHARGE} | Charged on every investment property, with no tax-free threshold |
| NT | {LT_THRESHOLD_NT} | {LT_AT_EXAMPLE_NT} | {LT_TOP_RATE_NT} | Nil | No land tax |
Sources: Revenue NSW, SRO Victoria, QRO, RevenueWA, RevenueSA, SRO Tasmania, ACT Revenue Office, NT Territory Revenue Office. Rates as checked {STATE_TAX_RATES_AS_AT}.
FIRB — foreign purchaser framework
Foreign buyers are currently banned from buying established dwellings ({FIRB_ESTABLISHED_DWELLING_BAN}), with limited exceptions. They can still buy new dwellings with FIRB approval, and vacant land if they build on it ({FIRB_VACANT_LAND_BUILD_RULE}). Where an established dwelling can be bought, the application fee is three times the new-dwelling fee ({FIRB_FEE_ESTABLISHED_TRIPLED}); the new-dwelling fee is {FIRB_FEE_NEW_DWELLING_TIER1}. A foreign-owned home left empty for more than half the year attracts an annual vacancy fee of {FIRB_VACANCY_FEE} (FIRB Guidance Note 6).
Build-to-rent. Developments that meet the federal build-to-rent rules ({BTR_MIN_DWELLINGS_FEDERAL}, {BTR_HOLD_PERIOD_FEDERAL} of single ownership and {BTR_AFFORDABLE_QUOTA_FEDERAL}) are exempt from the negative gearing and CGT changes in the {TAX_REFORM_PACKAGE_LABEL}. They also qualify for a {BTR_MIT_WITHHOLDING_RATE} MIT withholding rate for eligible foreign investors, a higher capital works deduction ({DIV43_BTR_RATE}), and land tax reductions in some states. The national build-to-rent pipeline is {BTR_PIPELINE_VALUE_PCA} across {BTR_PIPELINE_DWELLINGS_PCA} (Property Council, {BTR_PIPELINE_AS_AT}).
Pre-purchase checks
Building and pest inspection
Get an independent building and pest inspection before you commit. It picks up structural defects, safety hazards and termite damage, and gives you grounds to renegotiate or walk away.
Planning and vendor disclosure
Every state requires the seller to disclose key information about the property, such as zoning, easements, title and building approvals, although what is included varies. Read it before signing and check it allows what you plan to do with the property.
Strata report
For apartments and townhouses, a strata report covers {STRATA_REPORT_SCOPE}. A poorly run owners corporation, a thin sinking fund or an unresolved defects dispute can cut returns well below what the rent suggests.
Conveyancing
A solicitor or licensed conveyancer reviews the contract, runs the searches and handles settlement. Have them look at the contract before you sign, not after.
Key borrowing parameters
Lenders mortgage insurance applies at {LMI_TRIGGER_LVR}. Investor loans are typically priced {TYPICAL_INVESTOR_RATE_PREMIUM}. APRA requires lenders to test repayments at {APRA_SERVICEABILITY_BUFFER}, and limits high debt-to-income lending: {APRA_DTI_CAP_2026}.
Borrowing cuts both ways. Yield shows only the income part of a return; capital growth is the rest. A loan lifts the return on your cash only when the property's total return beats the interest rate. At 8% against a 6% loan it works for you; at 5% against 7% it drags your return down, and the rent may not cover the repayments, leaving you to fund the gap. A rate rise or weaker growth can flip one into the other — compare the levered and unlevered IRR in the calculator below.
Many AreaSearch users are PIPA and MFAA members who use the platform to back their advice with local data.
Buyer's agents
A buyer's agent finds and negotiates a purchase for you. A {QPIA_FULL_NAME} accredited through {PIPA_FULL_NAME} (PIPA) follows a code of conduct and ongoing training requirements; check the PIPA member directory.
Mortgage brokers
Brokers are represented by the {MFAA_FULL_NAME} (MFAA) and the {FBAA_FULL_NAME}. Since {BID_EFFECTIVE} they have had a legal duty to act in the borrower's best interests.
How the calculator works
Pick the state at the top — stamp duty and land tax are state-specific, and the rent default re-seeds to that state's median. The three buttons switch between Buy & hold (acquire an existing dwelling), Build & sell (develop and sell on completion) and Build to rent (develop, let up, hold and sell at your exit cap); inputs are grouped into numbered tabs. In the build modes the typology selector loads Rawlinsons/RLB build-cost defaults, GST is charged the way each strategy actually pays it (margin scheme on sales; no input credits for build-to-rent), and the cash flow model’s residual land value is what the site is worth at your required margin. Set the inputs for your investment and request your cash flow model — we email you the full model (the yields and margins, the rent-cover check, the returns, a sensitivity grid and a year-by-year cash flow) built from your settings. Hover any dotted label for a tooltip. Returns are before tax: no income tax, negative gearing benefit or capital gains tax is deducted, because each depends on your own tax position.
Returns Calculator
Sensitivity — IRR varying by capital growth (cols) × vacancy (rows)
Indicative analysis only. Not investment, tax, or legal advice. Returns are pre-tax: no income tax or capital gains tax is deducted. Transfer duty follows each state's general scale and land tax a simplified one-band schedule — always verify current rates with the relevant state revenue office (Revenue NSW, SRO Victoria, QLD OSR, etc.) and the ATO. Foreign-buyer surcharges (typically 7-8%) are not included in the headline stamp duty figure. Speak to a qualified accountant, mortgage broker, and conveyancer before transacting. Past performance does not guarantee future returns.
05Worked example
Two Greater Sydney regions — chasing growth or buying yield
For years the standard investor play was to buy where prices were rising fastest, often accepting a low yield with negative gearing absorbing the shortfall. That approach depends on continual price rises, and for established homes bought after the cutoff it no longer gets the same tax support. {EX_LEAD_CLAUSE}: over the latest year, house prices {EX_LOWYIELD_GROWTH_1YR_WORD} in the lowest-yielding region, {EX_LOWYIELD_NAME}, and {EX_HIGHYIELD_GROWTH_1YR_WORD} in the highest-yielding, {EX_HIGHYIELD_NAME}.
| {EX_LOWYIELD_NAME} | {EX_HIGHYIELD_NAME} | |
|---|---|---|
| Median house price | {EX_LOWYIELD_PRICE} | {EX_HIGHYIELD_PRICE} |
| Median house rent | {EX_LOWYIELD_RENT} | {EX_HIGHYIELD_RENT} |
| Gross house yield | {EX_LOWYIELD_YIELD} | {EX_HIGHYIELD_YIELD} |
| House price change, latest year | {EX_LOWYIELD_GROWTH_1YR} | {EX_HIGHYIELD_GROWTH_1YR} |
| House price growth, 5 years (p.a.) | {EX_LOWYIELD_GROWTH_5YR} | {EX_HIGHYIELD_GROWTH_5YR} |
| House price growth, 10 years (p.a.) | {EX_LOWYIELD_GROWTH_10YR} | {EX_HIGHYIELD_GROWTH_10YR} |
| Rent growth, 3 years | {EX_LOWYIELD_RENT_GROWTH_3YR} | {EX_HIGHYIELD_RENT_GROWTH_3YR} |
AreaSearch NSW sales and rental bond data, SA4 regions. Across all {EX_SYD_REGION_COUNT} Greater Sydney regions, house prices fell over the latest year in {EX_LOWHALF_FALLING} of the {EX_LOWHALF_COUNT} lower-yielding regions and rose in {EX_HIGHHALF_RISING} of the {EX_HIGHHALF_COUNT} higher-yielding ones.
Passive or active
Both buyers below use the returns calculator's defaults: a {CARD_DEPOSIT} deposit, {CARD_RATE} interest, {CARD_VACANCY} vacancy and {CARD_MGMT} management. The passive buyer takes the median house in the lowest-yielding region above. The active buyer screens for a suburb where a second dwelling pays, uses a buyer's agent to find an off-market or distressed purchase below the median, and adds a granny flat.
Passive — {EX_LOWYIELD_NAME}
Buys the median house at the median rent and waits for prices to rise
| Purchase price | {CARD_A_COST} |
| Rent ({CARD_A_WEEKLY_RENT} a week) | {CARD_A_GROSS_RENT} |
| Gross yield | {CARD_A_GROSS_YIELD} |
| Rent after vacancy and management | {CARD_A_NET_RENT} |
| Interest on the loan | {CARD_A_INTEREST} |
| Rent less interest | {CARD_A_GAP} |
| Price change, latest year ({CARD_A_GROWTH_1YR}) | {CARD_A_GROWTH_DOLLARS} |
| Cash put in (deposit + {CARD_A_DUTY} stamp duty) | {CARD_A_CASH} |
| Return on cash, year 1 | {CARD_A_RETURN_ON_CASH} |
{CARD_A_VERDICT}
Active — {CARD_B_SUBURB}
Buys {CARD_B_DISCOUNT} below the {CARD_B_MEDIAN_PRICE} median and adds a {CARD_B_FLAT_M2} granny flat
| Purchase price | {CARD_B_PURCHASE} |
| Granny flat build | {CARD_B_FLAT_COST} |
| Rent (house {CARD_B_HOUSE_RENT} + flat {CARD_B_FLAT_RENT} a week) | {CARD_B_GROSS_RENT} |
| Gross yield on total cost | {CARD_B_GROSS_YIELD} |
| Rent after vacancy and management | {CARD_B_NET_RENT} |
| Interest on the loan | {CARD_B_INTEREST} |
| Rent less interest | {CARD_B_GAP} |
| Price change, latest year ({CARD_B_GROWTH_1YR}) | {CARD_B_GROWTH_DOLLARS} |
| Cash put in (deposit + {CARD_B_DUTY} stamp duty) | {CARD_B_CASH} |
| Return on cash, year 1 | {CARD_B_RETURN_ON_CASH} |
{CARD_B_VERDICT}
The takeaway: {EX_TAKEAWAY} Figures are before income tax and running costs. The purchase discount is a scenario, not a market measure; rents and prices are suburb medians (the flat is let at the median rent for a one-bedroom house), the build cost and stamp duty come from the returns calculator, and a granny flat needs a suitable lot and approval.
Sources: ABS (population and migration, dwelling approvals, Total Value of Dwellings, labour force, earnings) · State rental bond records ({RENT_STATES}) · NSW Valuer General (property sales) · ATO · Australian Government Budget ({TAX_REFORM_PACKAGE_LABEL}) · Treasury (build-to-rent) · Foreign Investment Review Board · RBA · APRA · ASIC · AHURI (30:40 indicator) · Revenue NSW · SRO Victoria · Queensland Revenue Office · RevenueWA · RevenueSA · SRO Tasmania · ACT Revenue Office · NT Territory Revenue Office · NSW Department of Planning (Housing SEPP) · Standards Australia (AS 4349) · PIPA · MFAA · FBAA · Property Council of Australia (build-to-rent pipeline) · Rawlinsons Australian Construction Handbook · RLB · Kendall & Tulip (RBA, 2018) · Lu, Shi & Pettit (2023) · Carleton, Joyeux & Milunovich (2022) · AreaSearch data. Updated {LATEST_REFRESH_DATE}.