


The Australian economy grew 0.3% in the first quarter of 2026, taking annual GDP growth to 2.5%. Growth was supported by a resilient labour market and population growth. #AusEcon
Market Overview
June 2026 Economic Summary
Steady at the surface, strained beneath: Australia's hawkish holding pattern
Australia's $2.76 trillion economy is expanding at a clip that looks reassuring from altitude — 2.5% annual GDP growth, rising wages, elevated household spending. But zoom in and the picture grows more complicated. Per capita gains amount to just 1.0%, inflation is running at double the Reserve Bank's ceiling, and a property market firing on all cylinders is drawing investors back at the fastest pace in a decade. The RBA is watching, and not blinking.
Download Reports
Coming Soon
Integrate seamlessly with your workflows and communicate the latest market drivers to clients.
.svg)
0.6895
AUD/USD
.svg)
4.6845
AUD/CNY
.svg)
0.5219
AUD/GBP
Key Economic Indicators
Click to navigate| Indicator | As At | Units | Latest | -1yr | -2yr | -3yr | -4yr | -5yr |
|---|---|---|---|---|---|---|---|---|
| GDP | 2026-Mar | $m | 695,945 (+2.5%) | 678,840 (+1.3%) | 670,388 (+1.1%) | 663,102 (+2.8%) | 645,027 (+3.6%) | 622,355 |
| CPI | 2026-May | Index | 102.09 (+4.0%) | 98.20 (+2.1%) | 96.17 (+3.6%) | 92.85 (+6.3%) | 87.31 (+5.8%) | 82.52 |
| Population | 2025-Dec | Persons | 27,801,023 (+1.5%) | 27,388,529 (+1.6%) | 26,956,660 (+2.4%) | 26,320,285 (+2.1%) | 25,773,795 (+0.6%) | 25,630,698 |
| Employment | 2026-Mar | Persons ('000) | 14,768 (+1.8%) | 14,509 (+1.9%) | 14,238 (+2.2%) | 13,935 (+4.1%) | 13,392 (+3.4%) | 12,954 |
| Unemployment | 2026-Mar | % | 4.25 (+19bps) | 4.06 (+18bps) | 3.88 (+30bps) | 3.58 (-39bps) | 3.97 (-170bps) | 5.67 |
| Job Ads | 2026-May | No | 625,607 (-1.7%) | 636,415 (-11.4%) | 718,041 (-15.9%) | 853,511 (-2.0%) | 870,824 (+27.2%) | 684,550 |
| Household Spending | 2025-Sep | $m | 232,015 (+5.1%) | 220,838 (+2.8%) | 214,921 (+6.6%) | 201,614 (+28.4%) | 156,982 (-0.4%) | 157,628 |
| House Prices | 2026-Mar | $000s | 1,092 (+9.1%) | 1,001 (+4.9%) | 954 (+11.1%) | 859 (-3.8%) | 893 (+17.3%) | 761 |
| Attached Prices | 2026-Mar | $000s | 736.00 (+7.0%) | 688.00 (+5.0%) | 655.00 (+8.1%) | 606.00 (-1.9%) | 618.00 (+2.0%) | 606.00 |
| Dwelling Approvals | 2026-Apr | No | 201,248 (+9.9%) | 183,174 (+10.1%) | 166,327 (-8.3%) | 181,418 (-13.4%) | 209,519 (+0.9%) | 207,575 |
| Superannuation | 2025-Sep | $bn | 4,466 (+9.4%) | 4,082 (+13.4%) | 3,599 (+9.7%) | 3,281 (-4.4%) | 3,434 (+18.5%) | 2,897 |
| ASX All Ords | 2026-May | Index | 8,965 (+3.5%) | 8,660 (+8.6%) | 7,971 (+9.6%) | 7,273 (-2.4%) | 7,455 (+0.6%) | 7,407 |
Infrastructure & Major Projects
Transforming Australia's future
Sample 16 Active
 Denotes AI-based impression for illustrative purposes only, not to be taken as definitive under any circumstances. Developers and project owners wishing us to use original imagery please Contact Us and we will do so.
 NSW
NSW
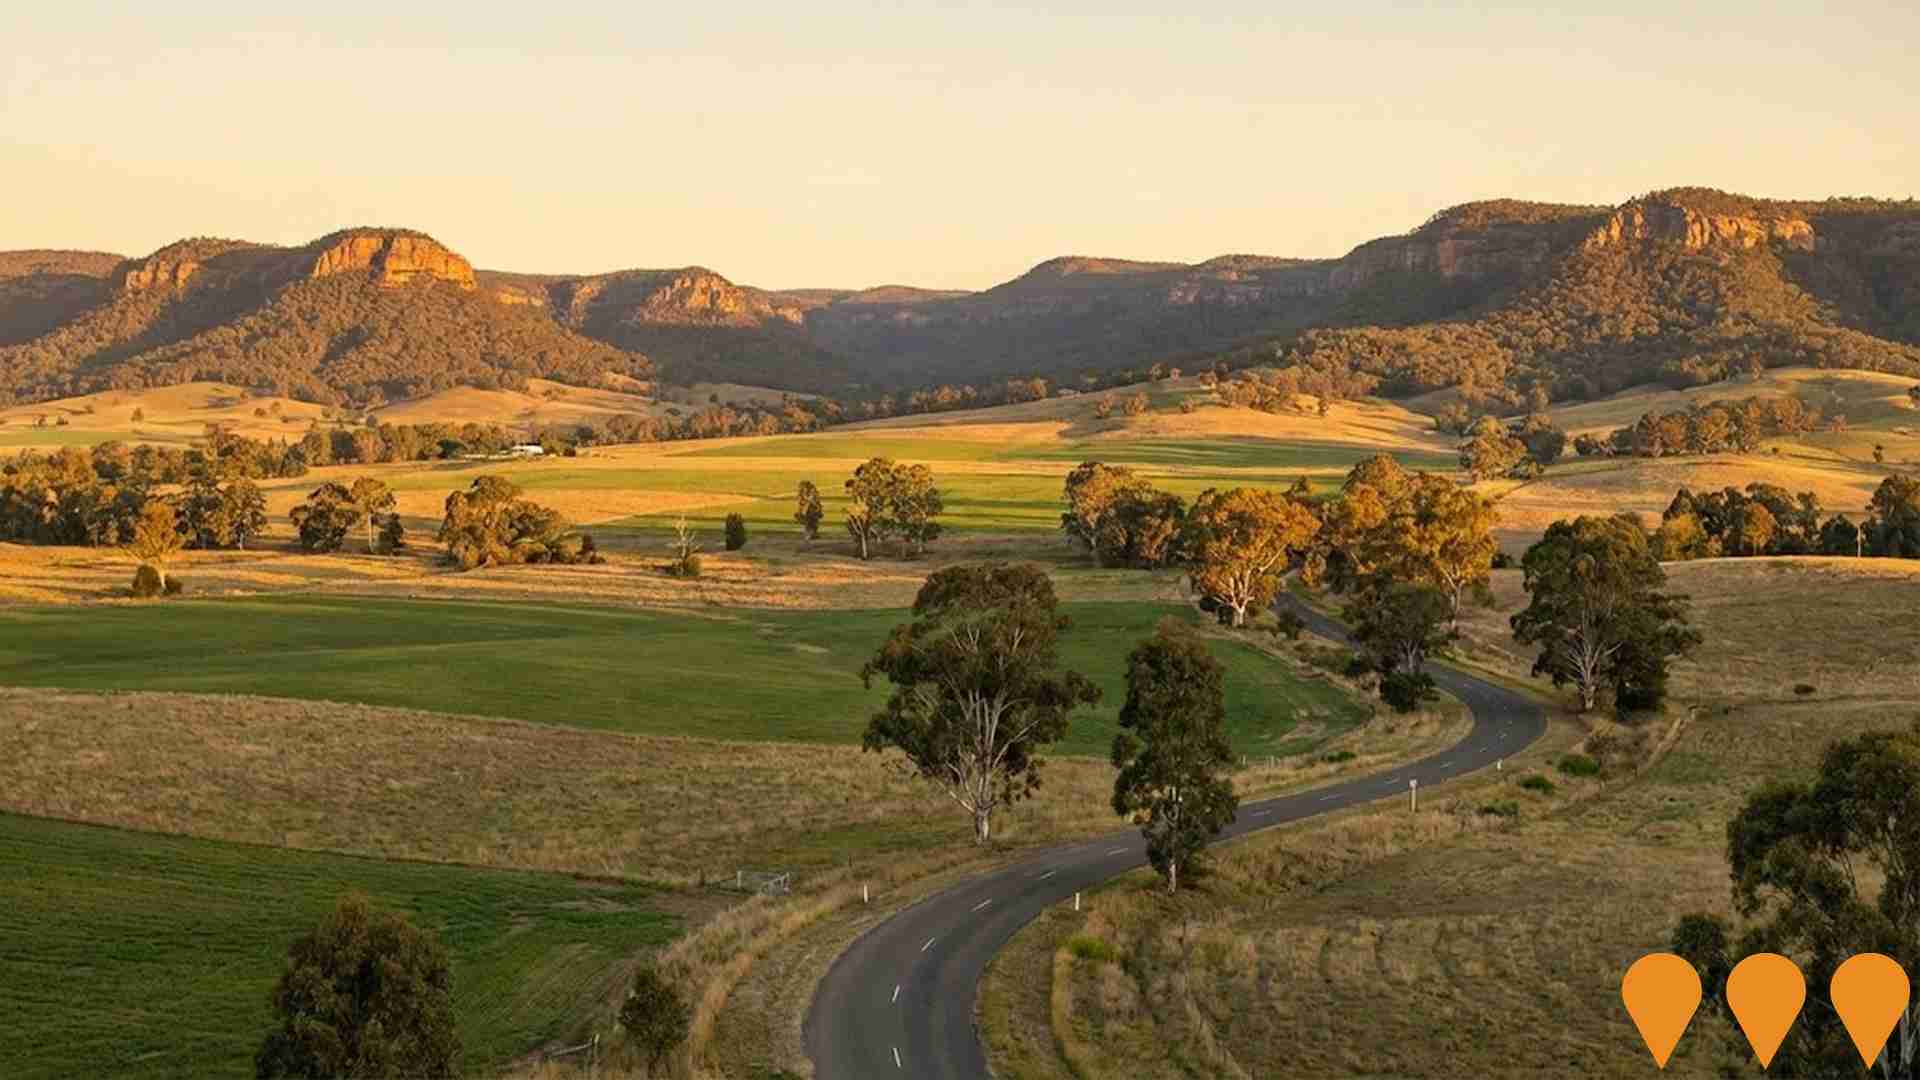
Bylong Coal Mine Project
A major open-cut and underground thermal coal mine proposal aiming to extract 6.5 million tonnes per annum over 25 years. Despite the NSW Independent Planning Commission's refusal
View Mudgee Surrounds - West
 QLD
QLD
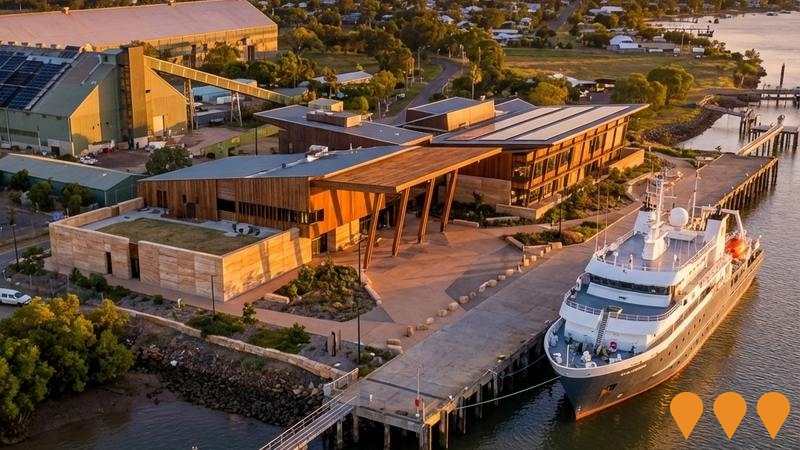
Port of Bundaberg Expansion
Major port expansion and infrastructure overhaul at the Port of Bundaberg to boost export capabilities for bulk commodities, minerals, and agricultural goods. A $21.9 million bulk
View Bargara - Burnett Heads
 QLD
QLD
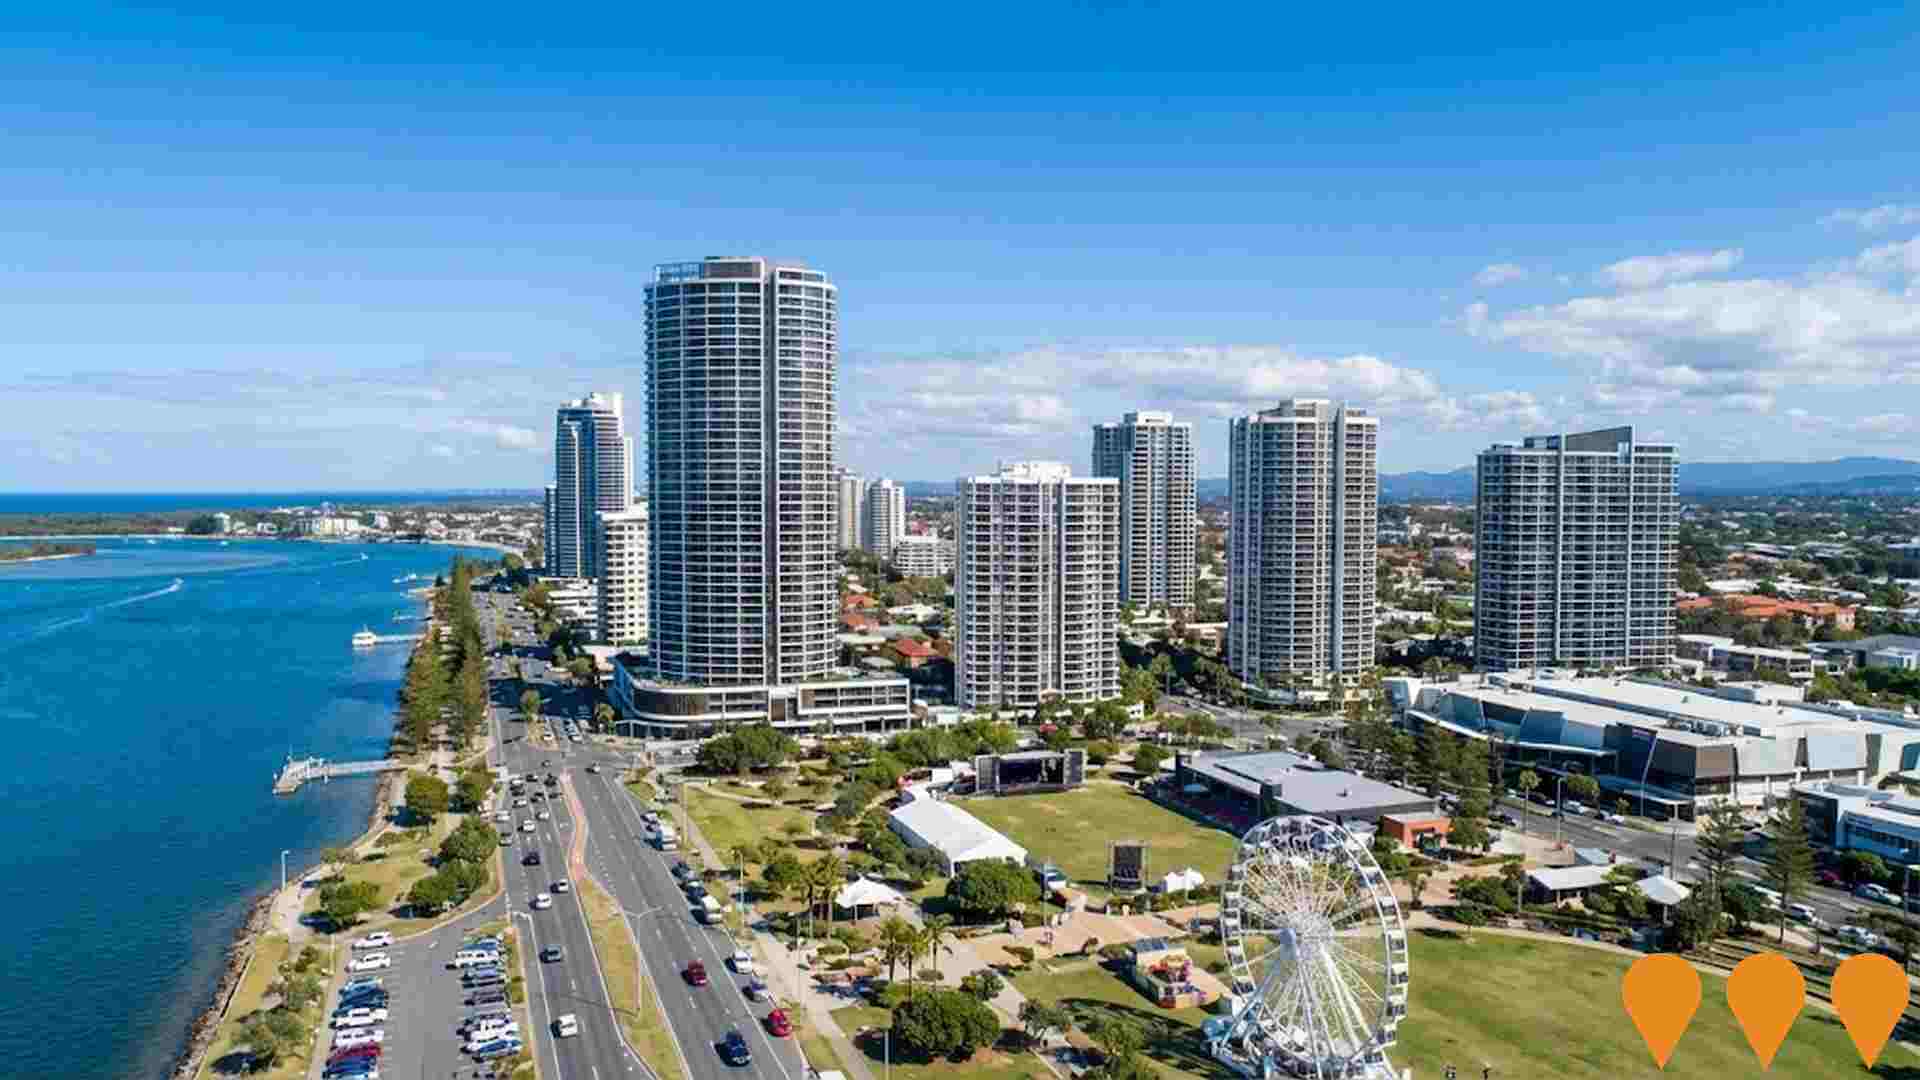
Southport Priority Development Area
The Southport Priority Development Area (PDA) encompasses 198.3 hectares of the Gold Coast CBD, declared on 4 October 2013 under the Economic Development Act 2012. It includes the
View Southport - North
 NSW
NSW
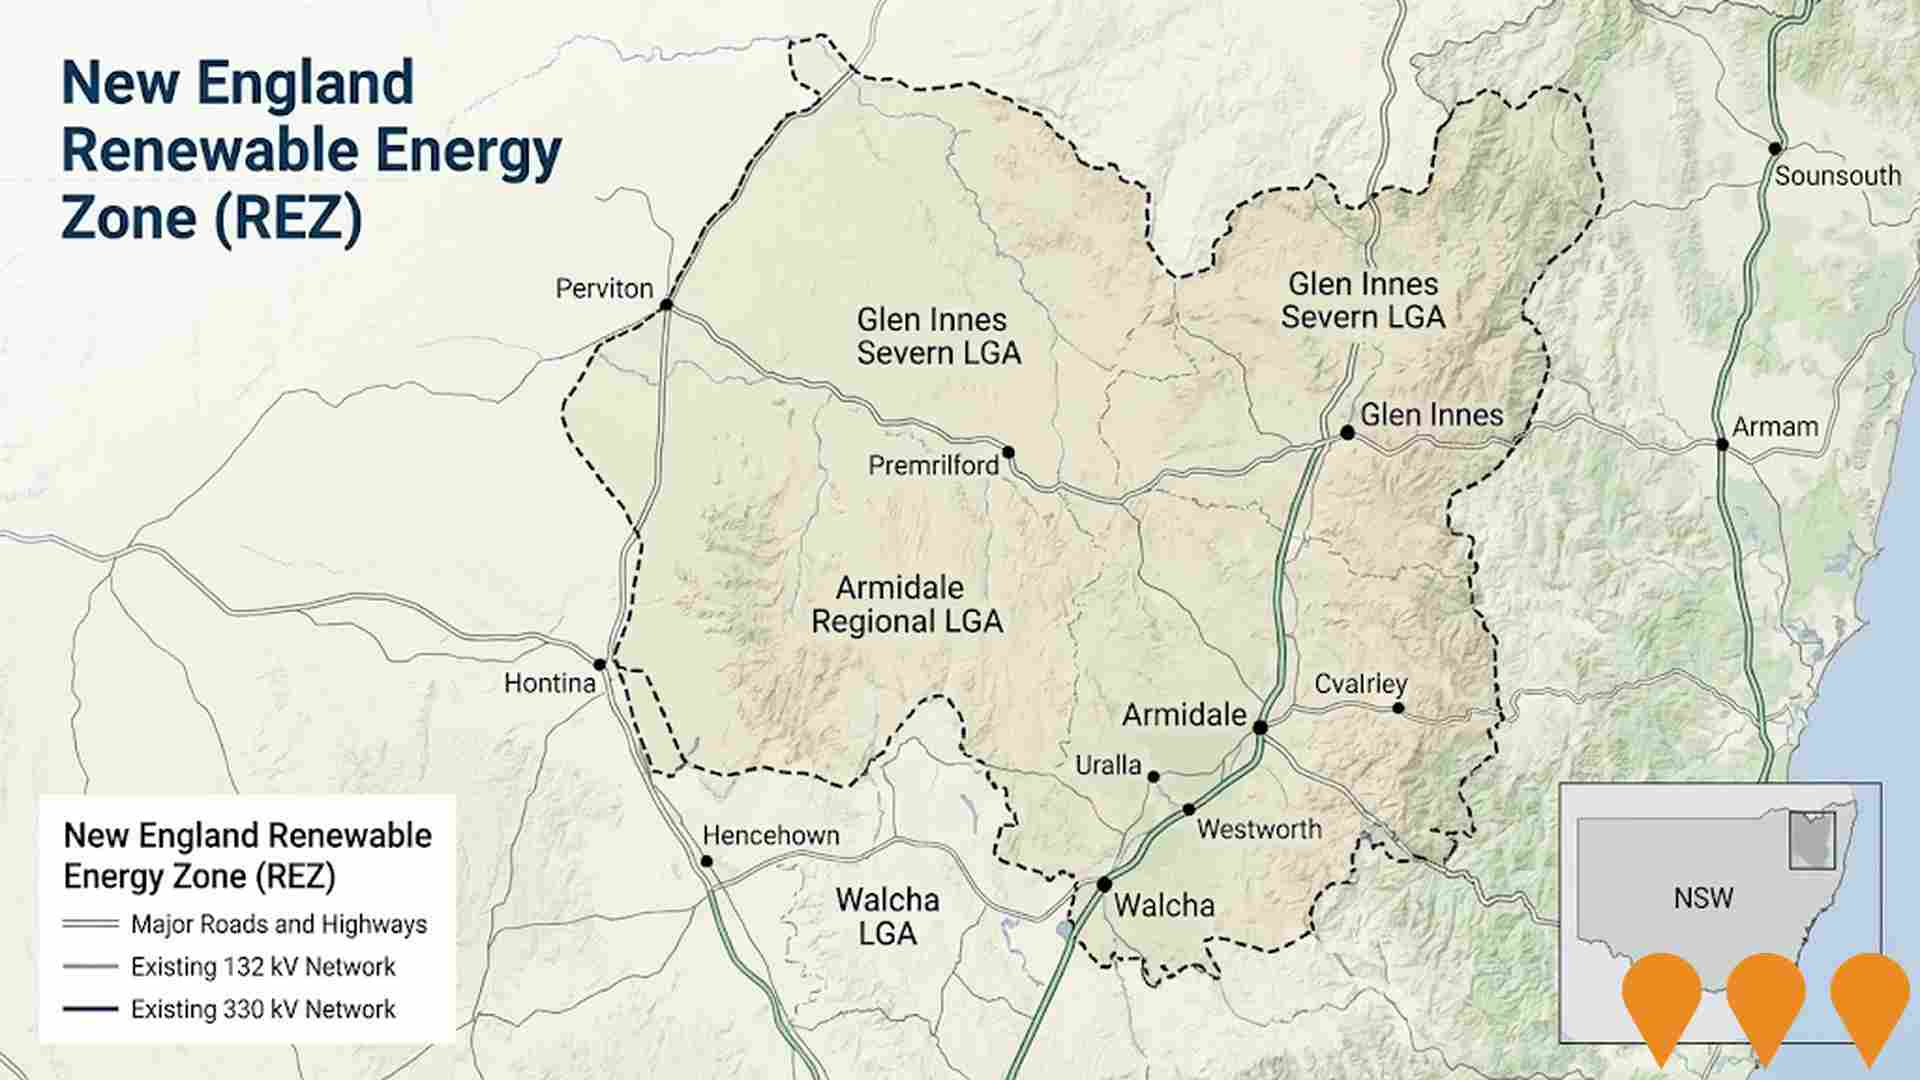
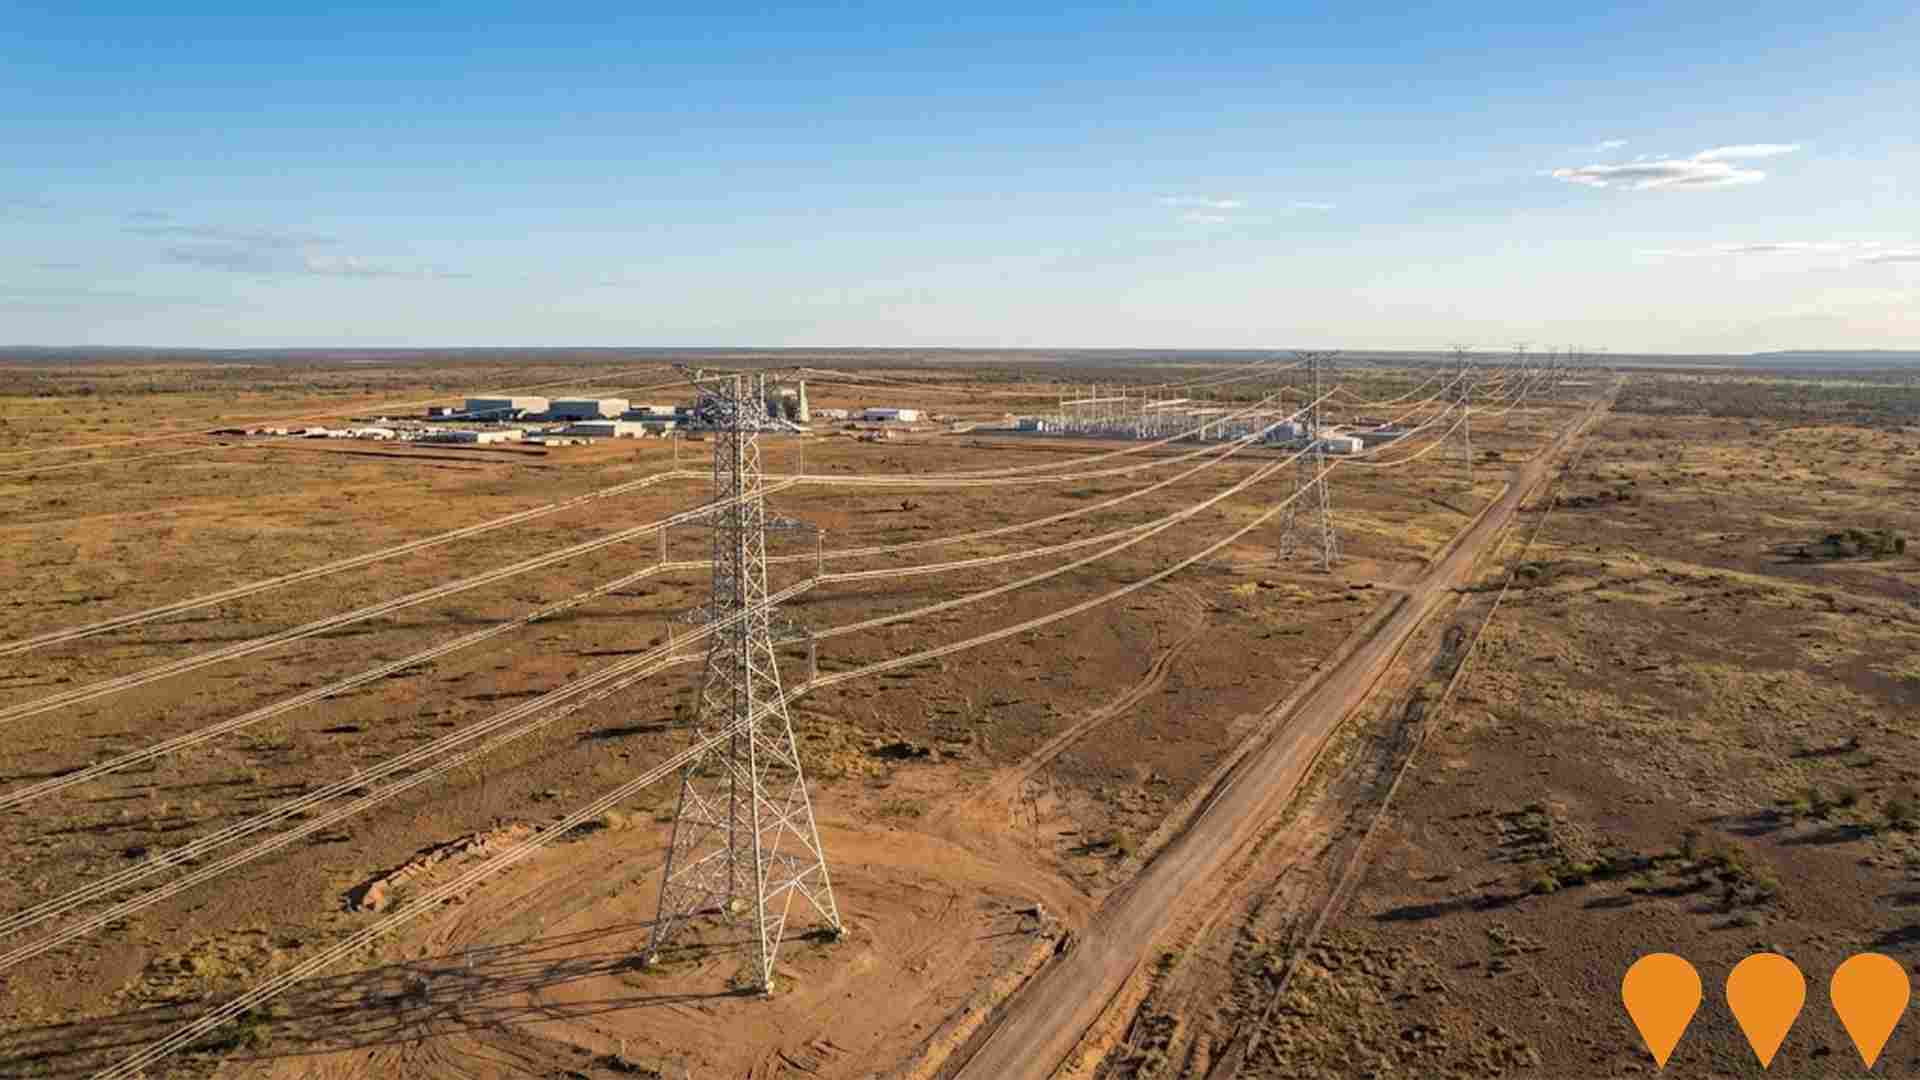
New England Renewable Energy Zone (REZ)
EnergyCo is planning the New England REZ network infrastructure to connect solar, wind and storage projects to the NSW electricity grid using new high voltage transmission lines, e
View Armidale
 WA
WA
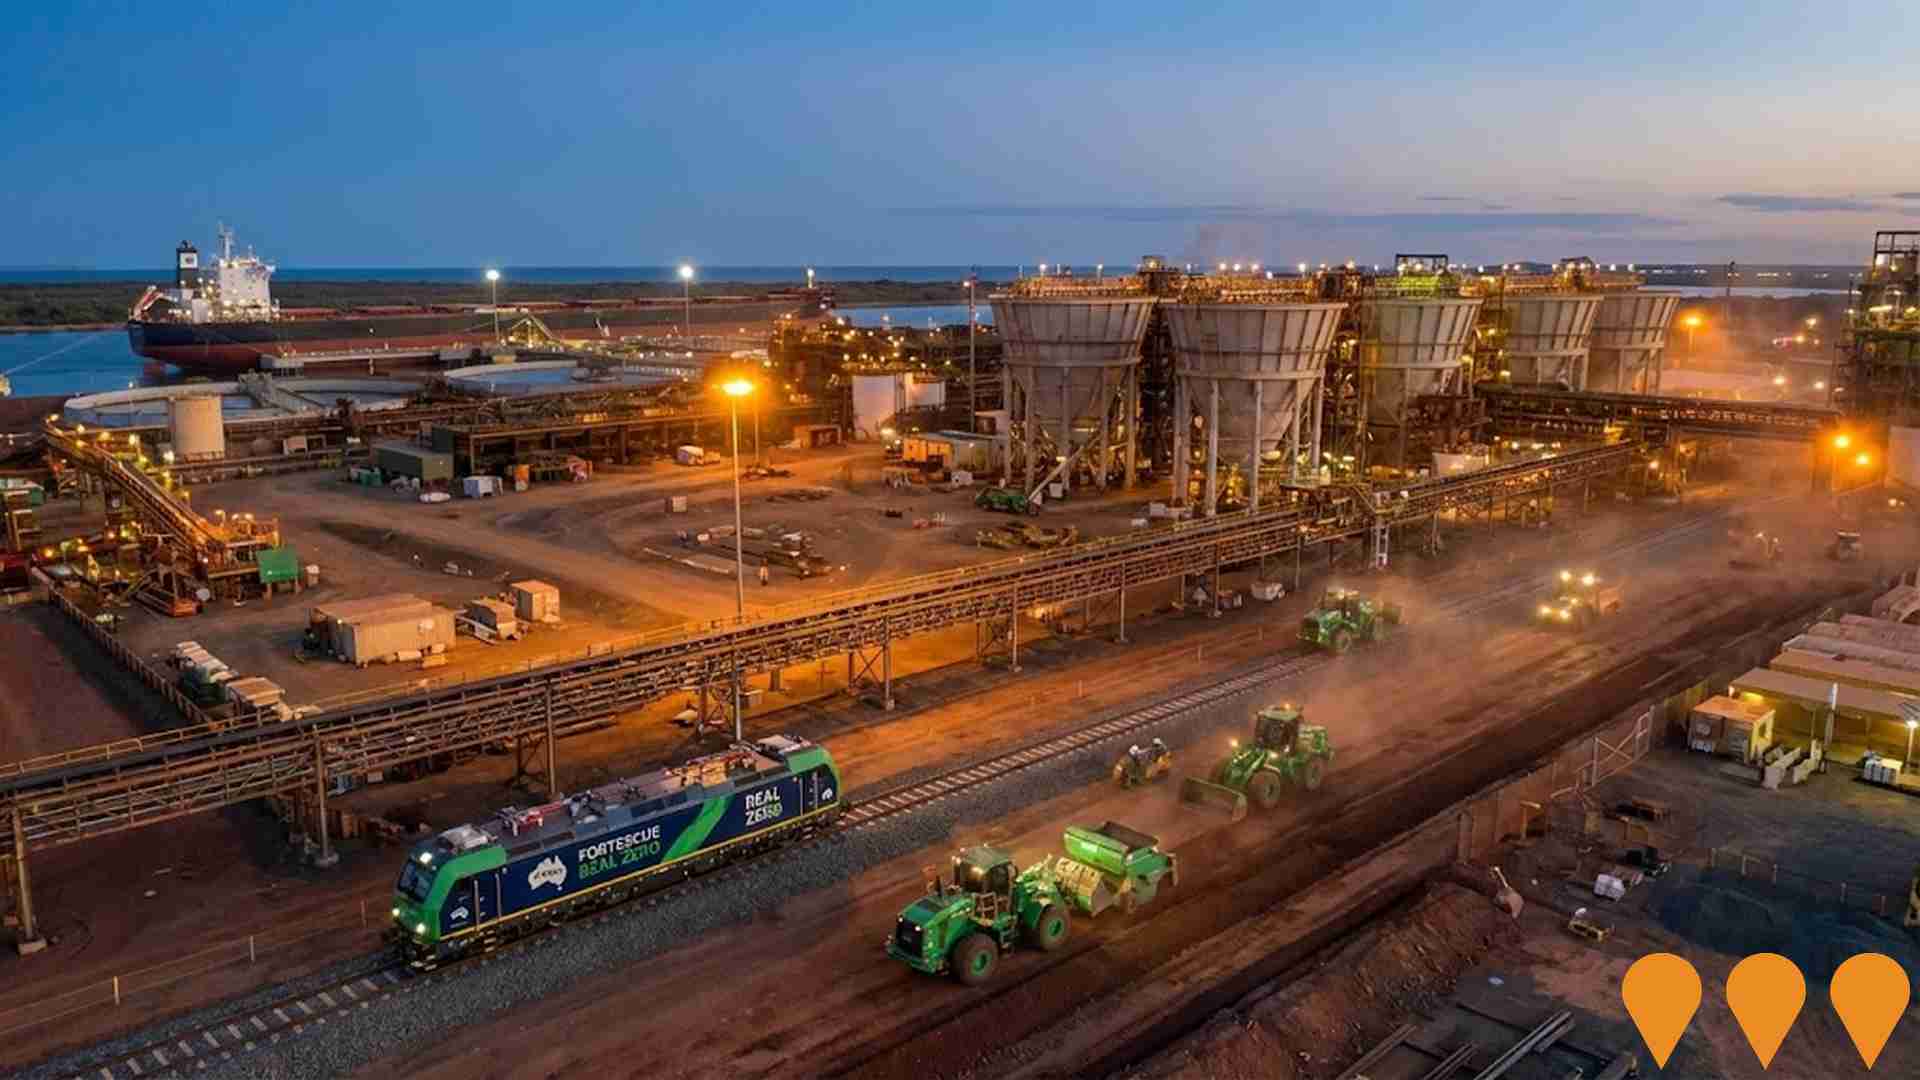
Fortescue Port Hedland Operations Decarbonisation and Modernisation
Comprehensive decarbonisation and modernisation of Fortescue's Port Hedland facilities as part of its Real Zero terrestrial emissions target by 2030. The Herb Elliott Port at Ander
View Port Hedland
 WA
WA
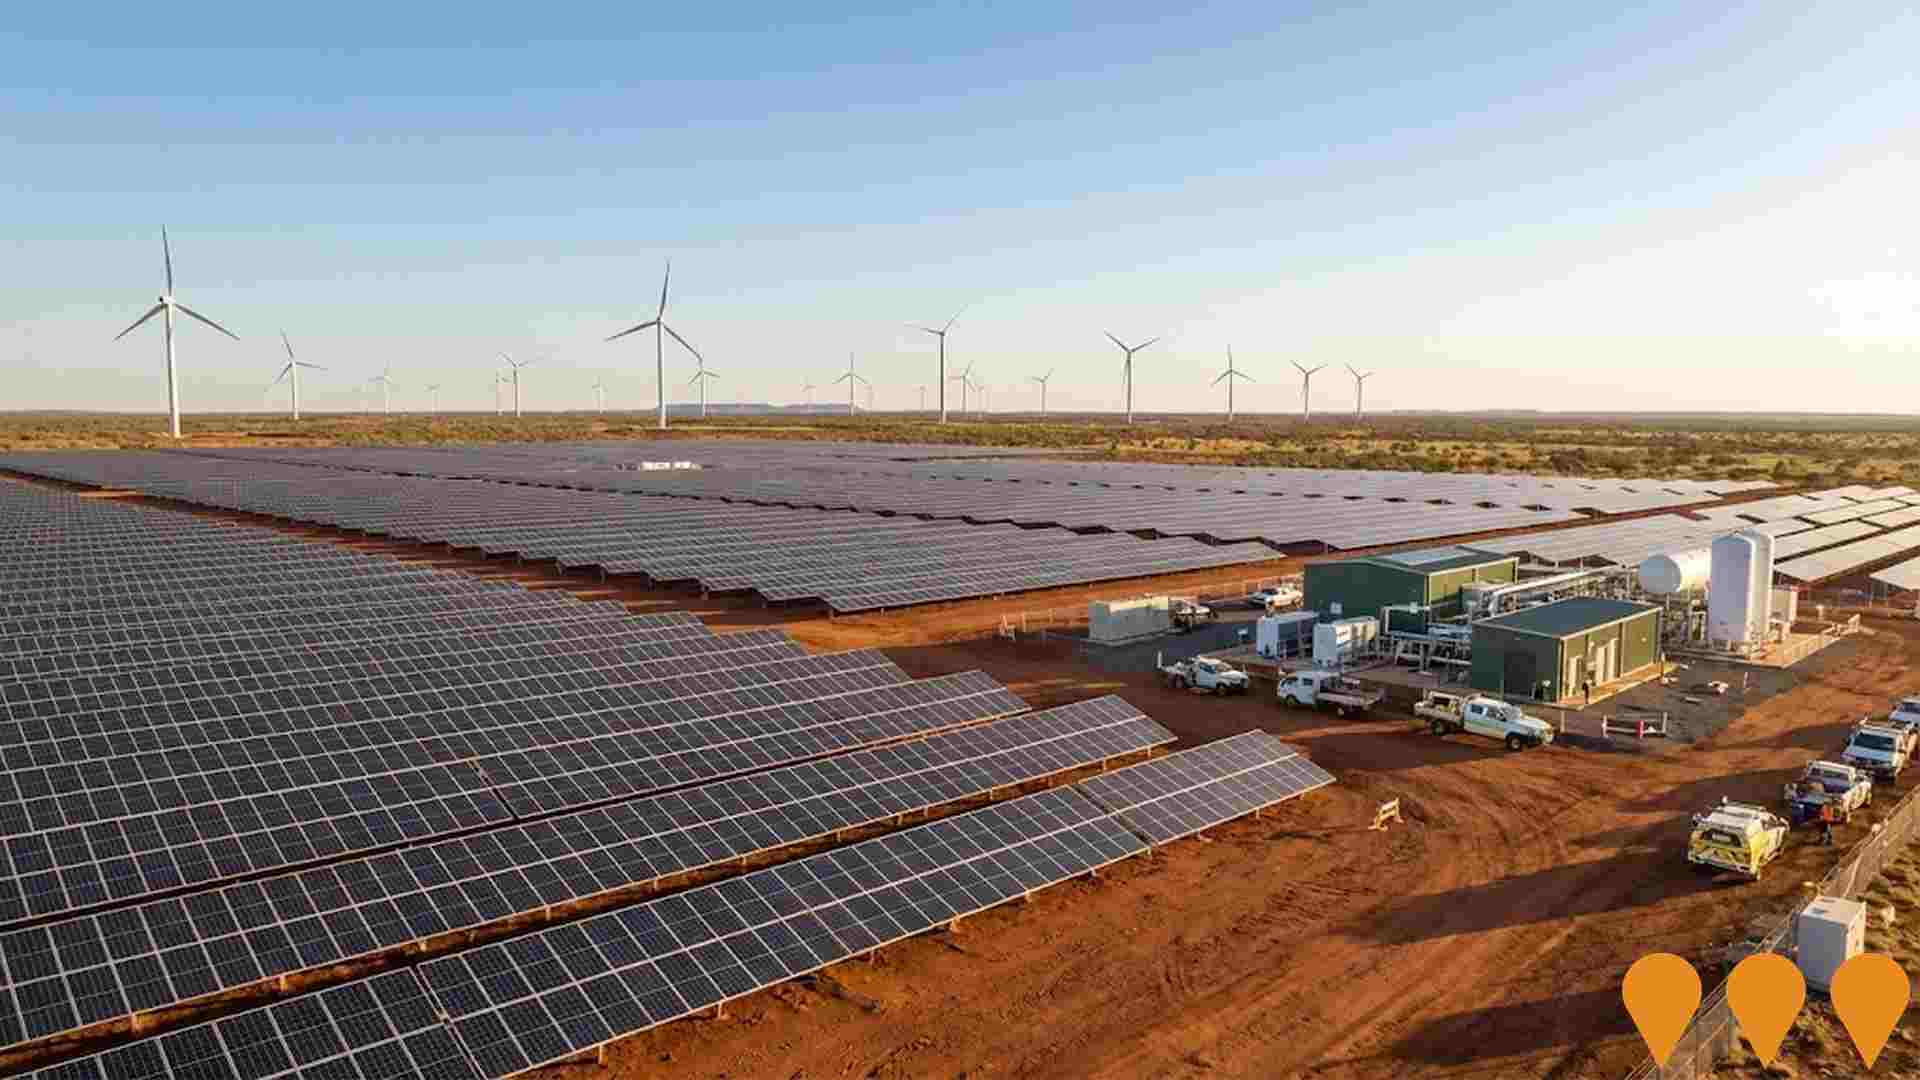
Australian Renewable Energy Hub (AREH)
The Australian Renewable Energy Hub (AREH) is a giga-scale renewable energy project in the East Pilbara region. Spanning over 6,500 km2, it intends to deliver 26 GW of combined sol
View East Pilbara
 VIC
VIC
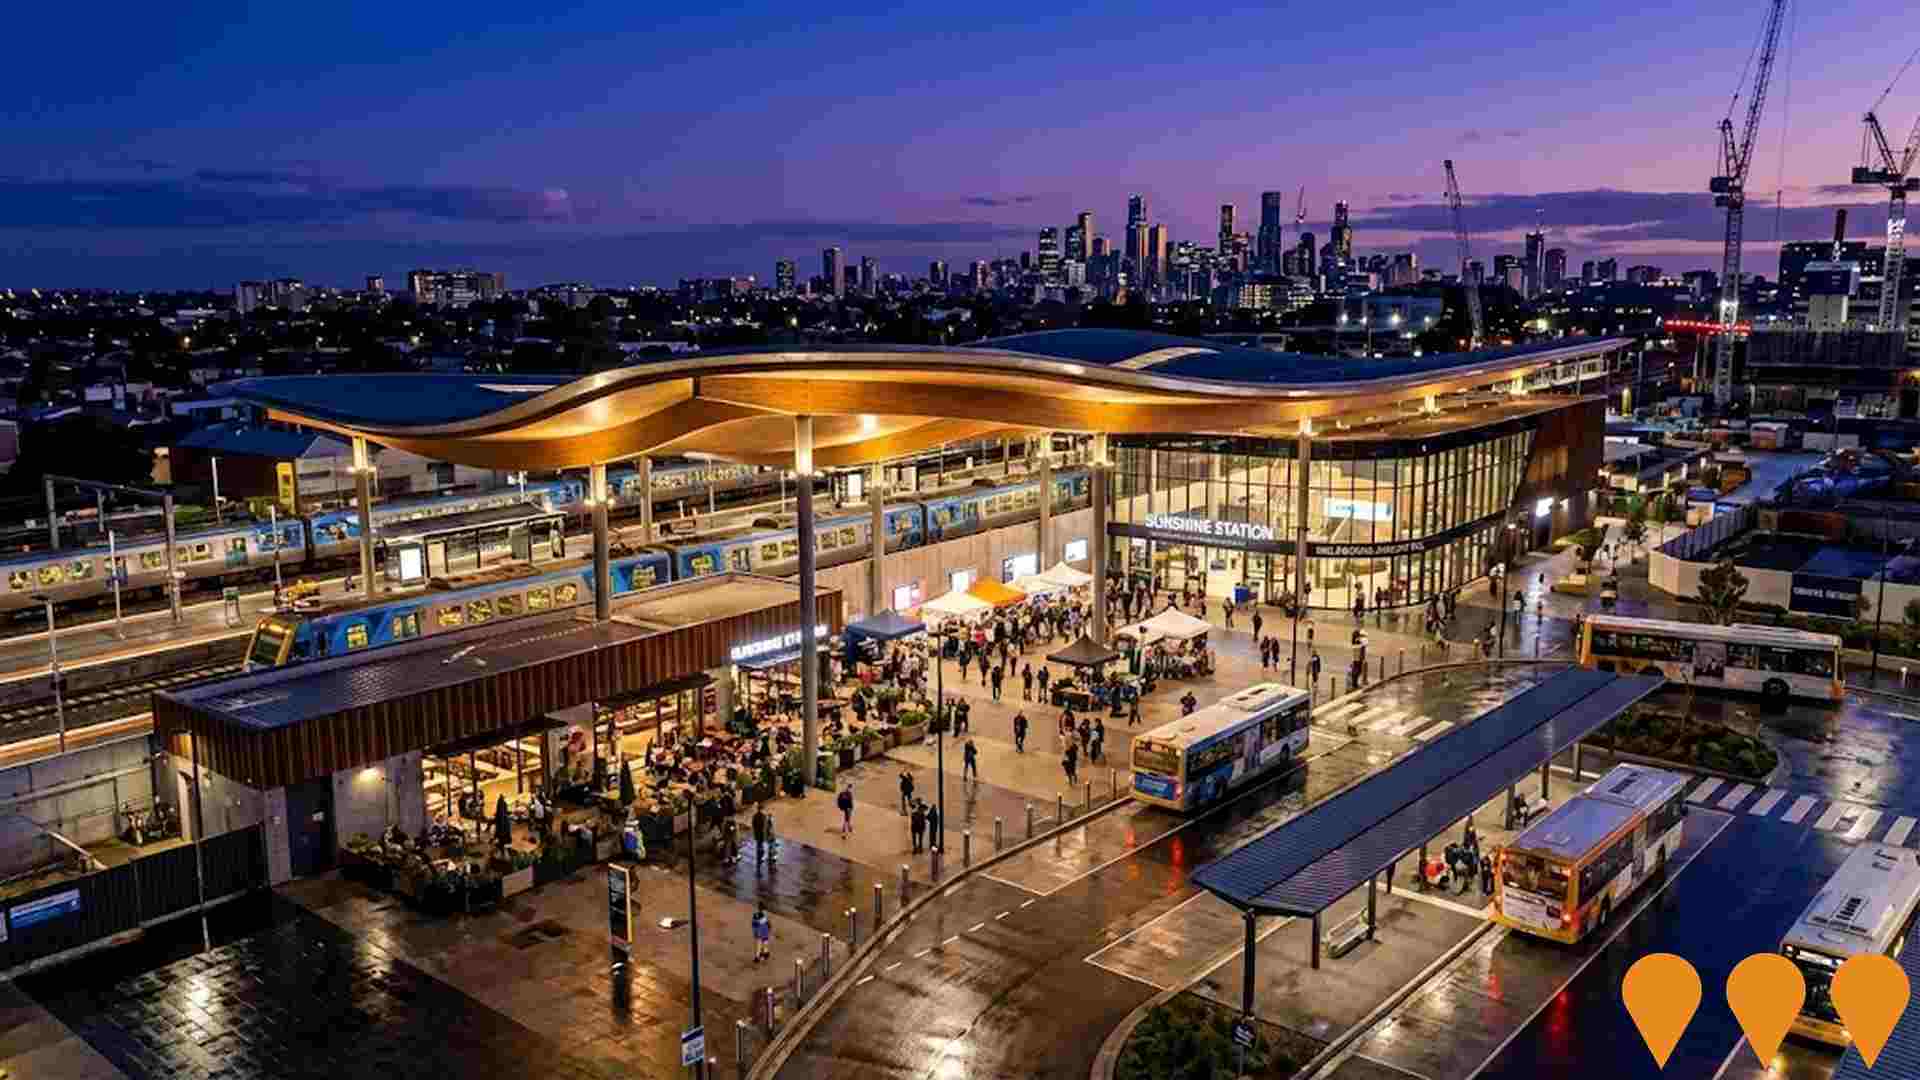
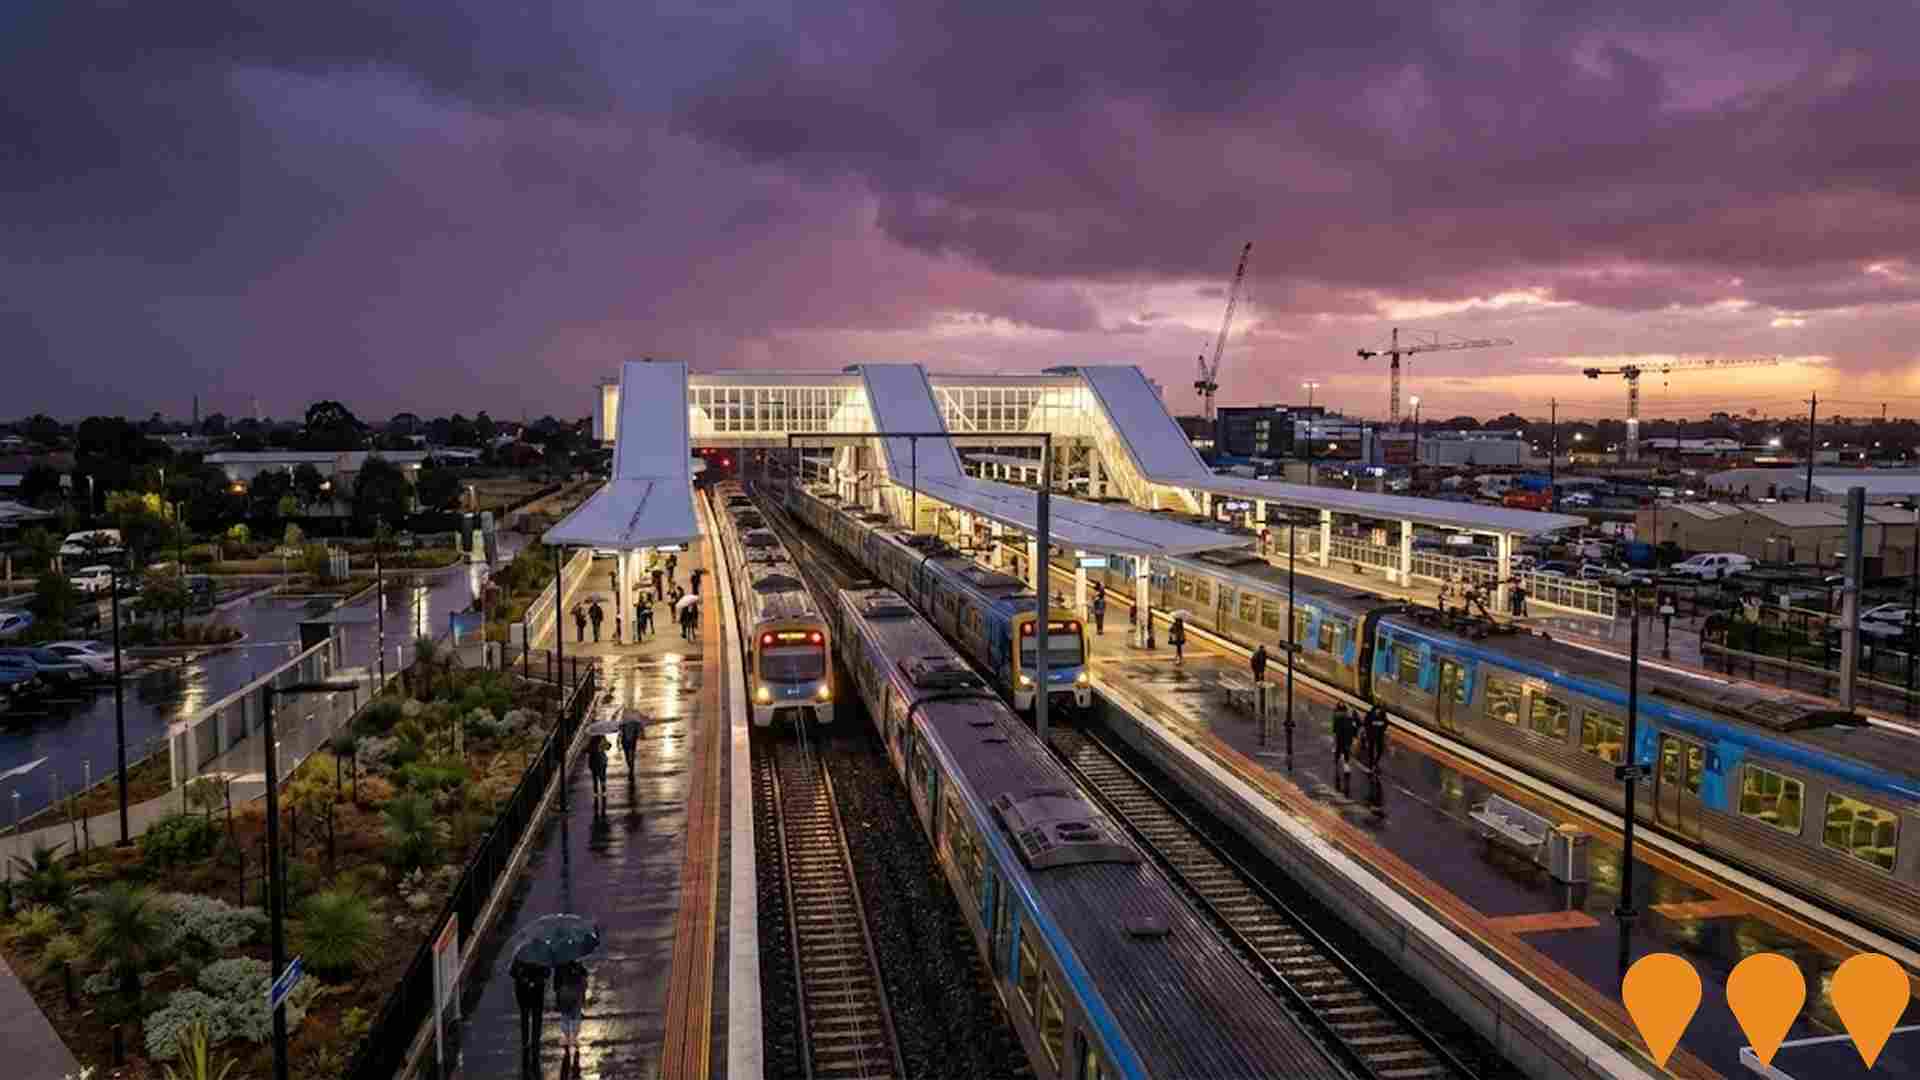
Sunshine Precinct
Long-term Victorian Government urban renewal and transport precinct program centred on Sunshine Station, Sunshine CBD and Albion Quarter. The precinct is being positioned as a majo
View Sunshine North
 NT
NT
Middle Arm Sustainable Development Precinct
A 1,500-hectare industrial hub designed for low-carbon industries including green hydrogen, carbon capture and storage (CCS), and critical minerals processing. The precinct serves
View Migratory - Offshore - Shipping (NT)
 SA
SA
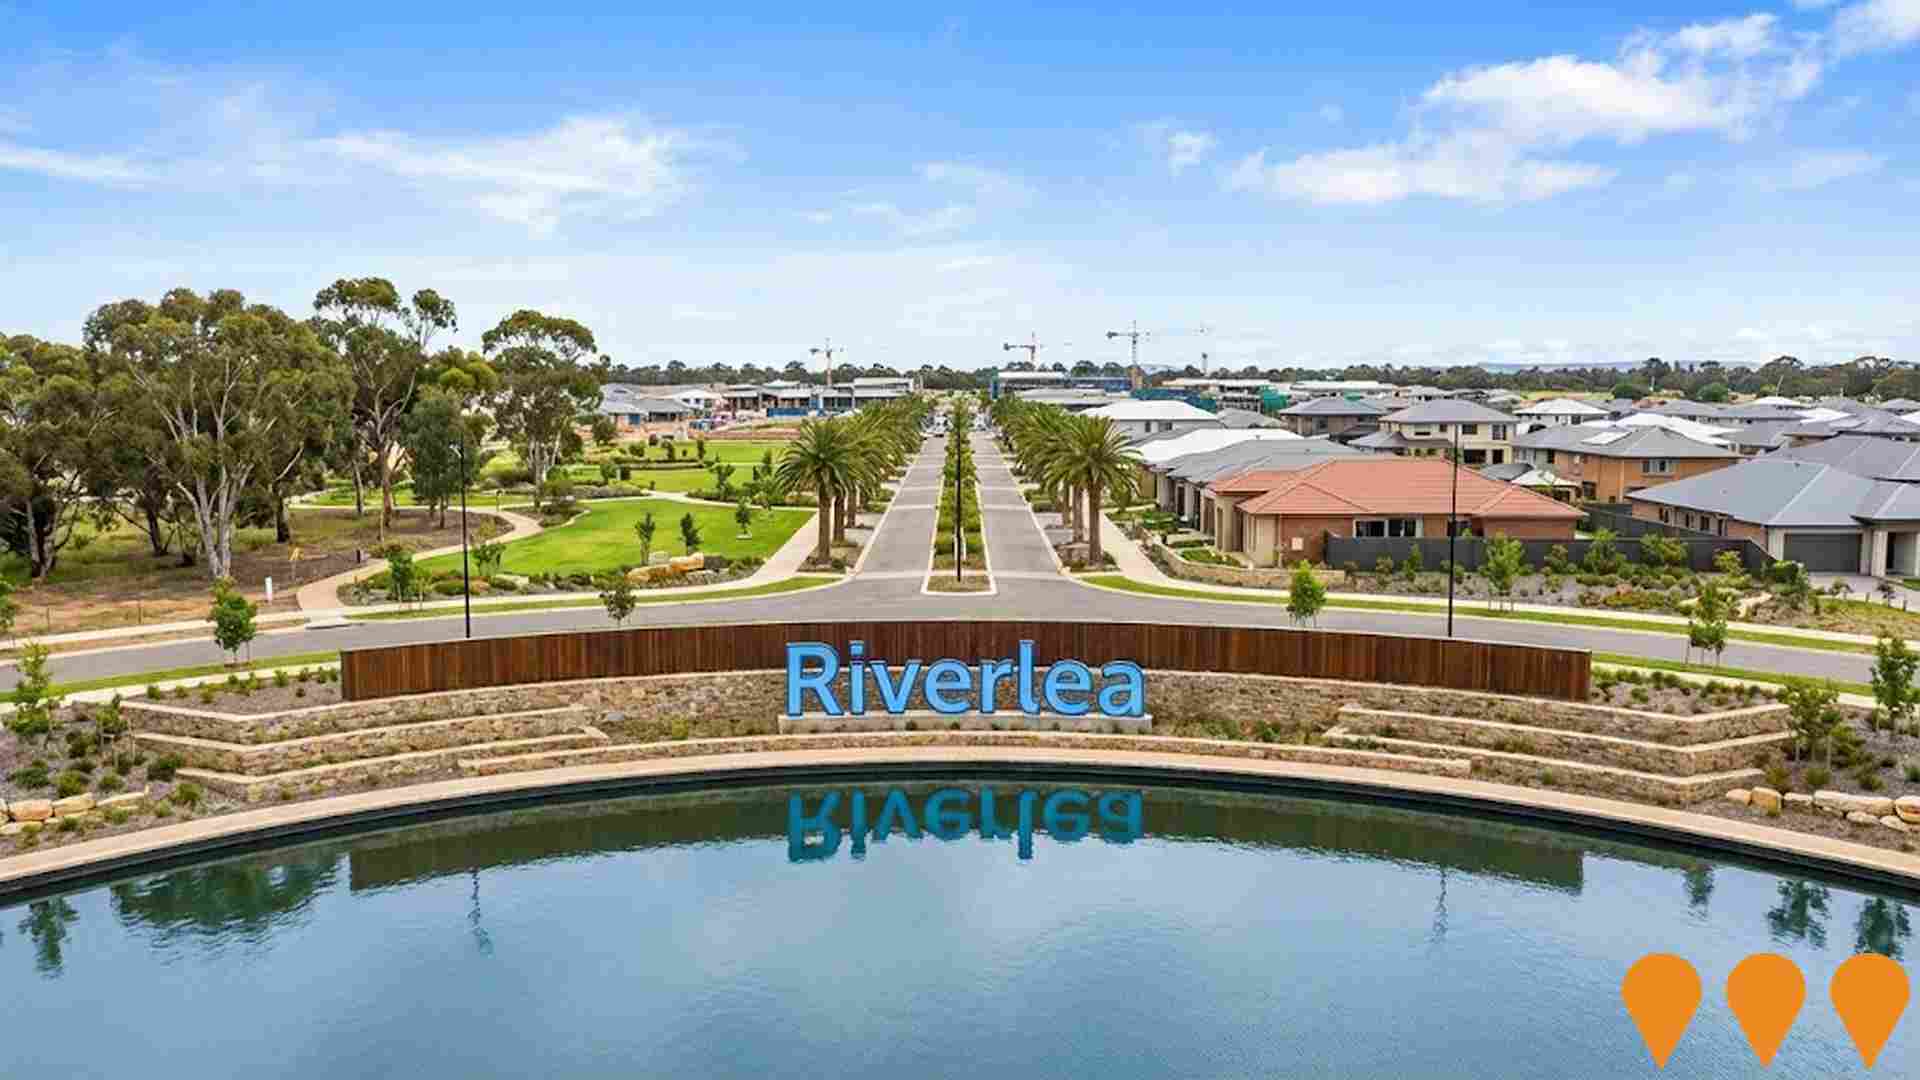
Riverlea Estate (Buckland Park Township)
South Australia's largest master-planned community, covering 1,340ha and planned to deliver 12,000 homes for over 40,000 residents. As of May 2026, The Palms Shopping Village is in
View Virginia - Waterloo Corner
 VIC
VIC
Sunshine Superhub and Albion Station Upgrade
A major transformation of Sunshine Station into a transport superhub and the complete rebuild of Albion Station as part of Melbourne Airport Rail Stage 1. The project involves 6km
View Sunshine
 SA
SA
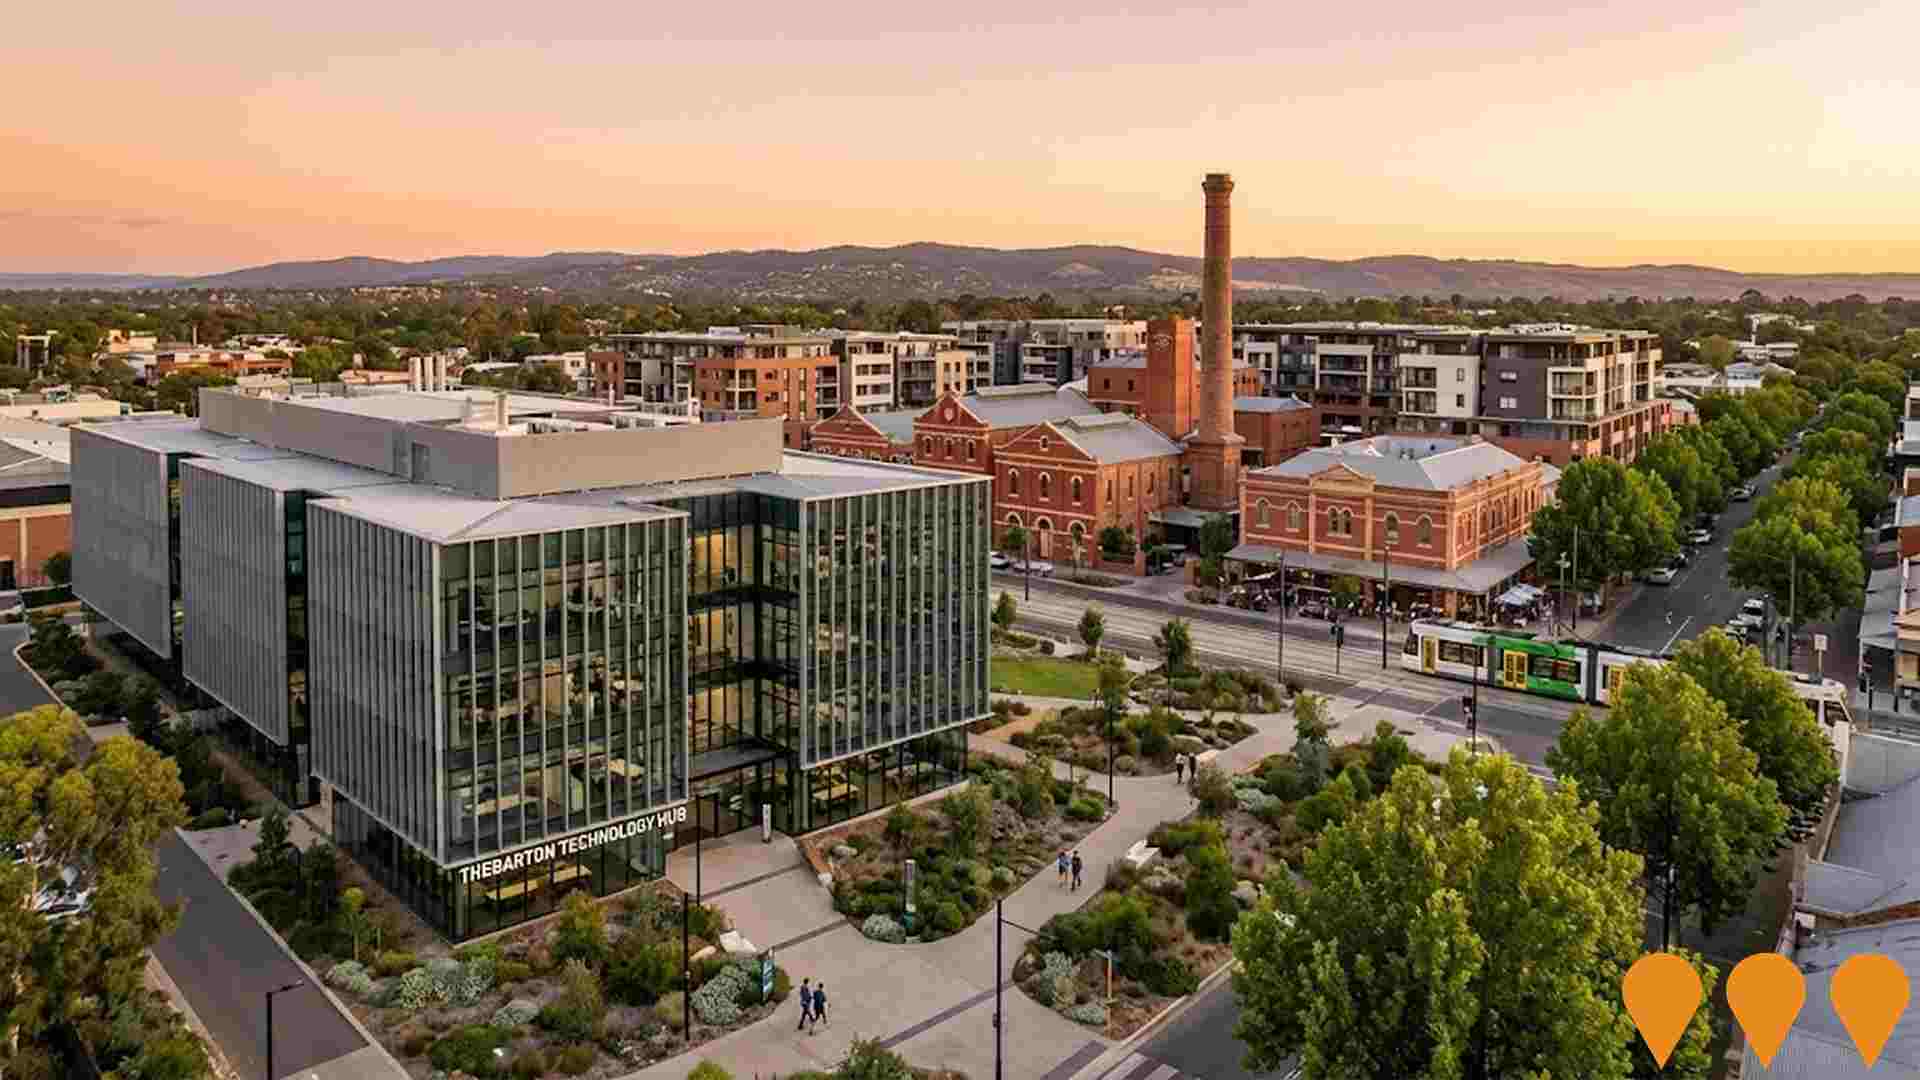
Southwark Grounds
A 1 billion dollar urban renewal project transforming the historic 8.4-hectare former West End Brewery site. The development features approximately 1,300 diverse homes including at
View Richmond (SA)
 ACT
ACT
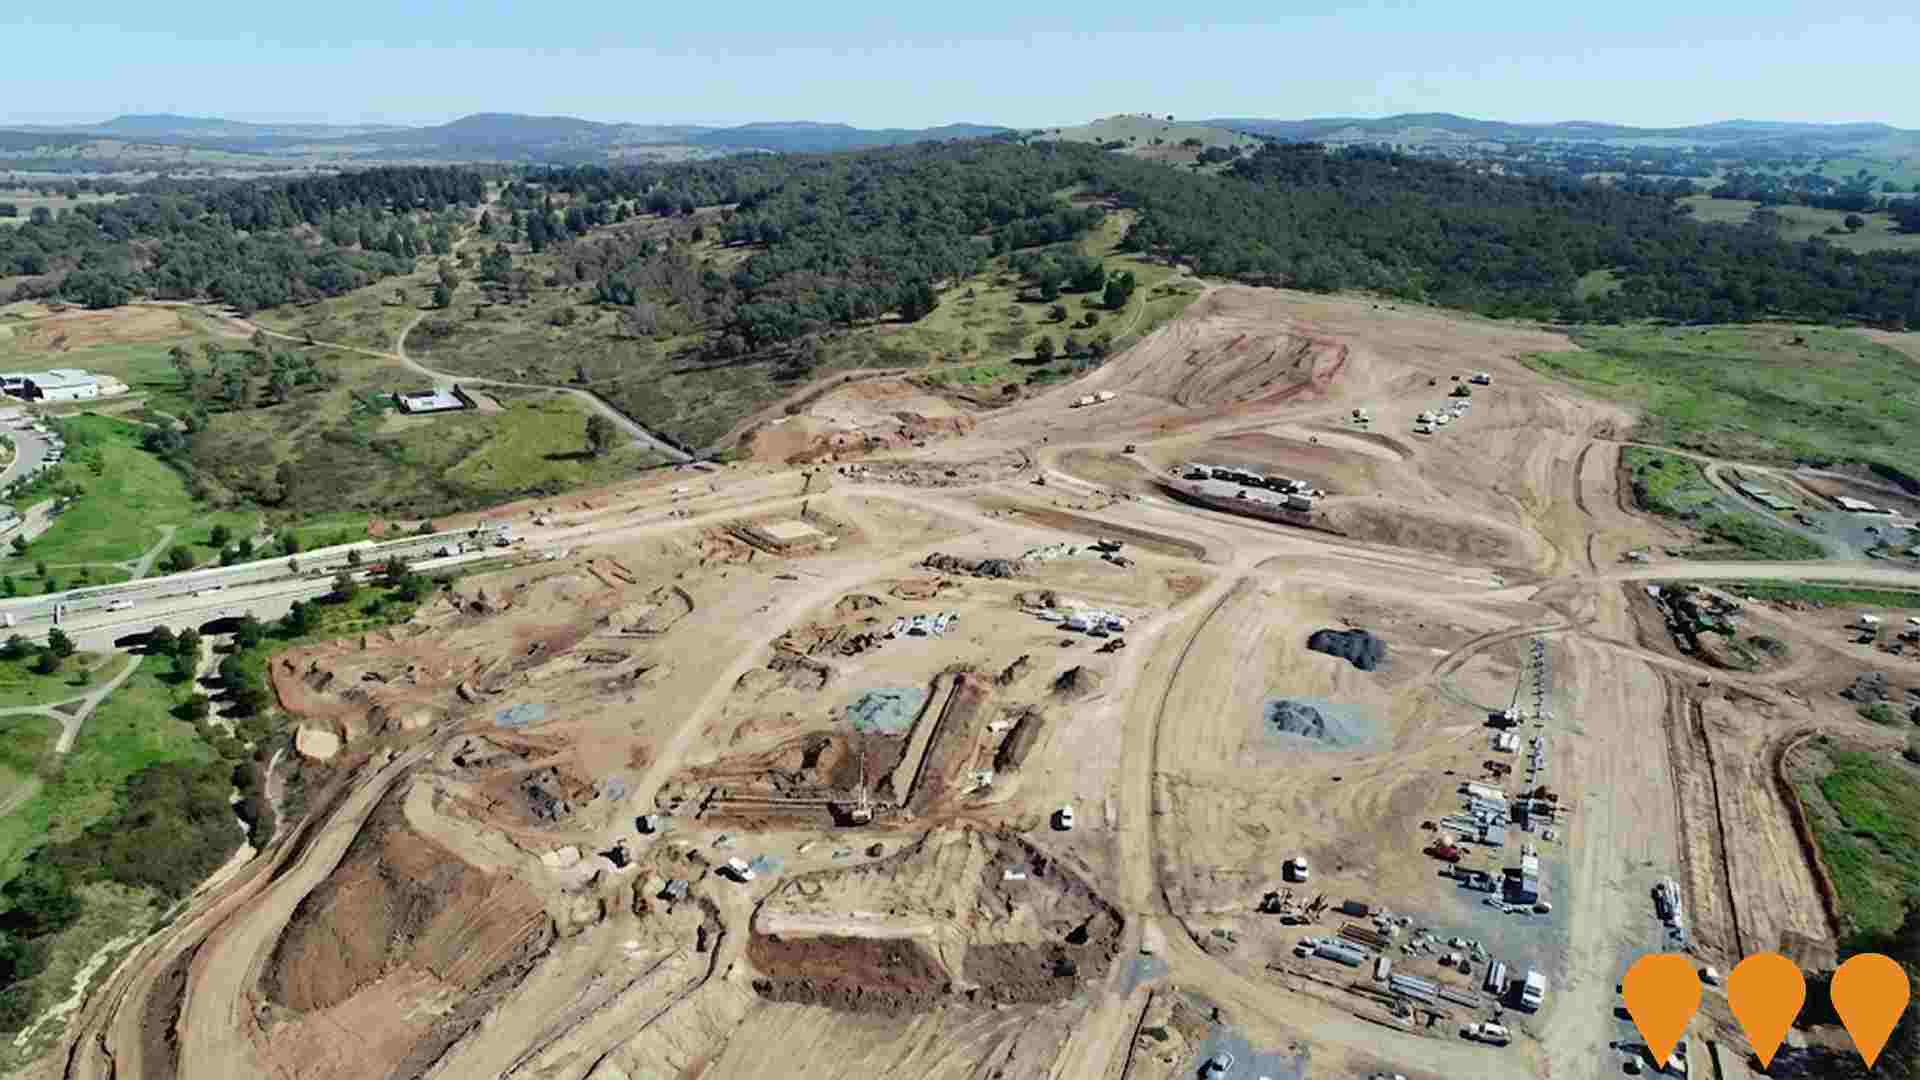
Molonglo Town Centre
Molonglo Town Centre is Canberra's sixth town centre, designed as a 97-hectare precinct to serve as the commercial and community heart of the Molonglo Valley. As of early 2026, the
View Arboretum
 QLD
QLD
Queensland Energy Roadmap 2026
The Queensland Energy Roadmap 2026 is a state policy framework released on 10 October 2025. It reverses earlier plans by extending state-owned coal asset operations until at least
View Brisbane City
 QLD
QLD
Wellcamp Aerospace and Defence Precinct
Wagner Corporation is developing a 430-hectare master-planned aerospace and defence precinct at Toowoomba Wellcamp Airport. Officially launched in May 2025, the precinct is anchore
View Toowoomba - West
 NSW
NSW
Woollahra Station Activation
Completion of the partially built Woollahra train station on the T4 Eastern Suburbs Line between Edgecliff and Bondi Junction, first constructed in the 1970s and abandoned. The new
View Double Bay - Darling Point
 NSW
NSW
North South Rail Line - Bradfield to Macarthur Corridor (South West Rail Link Extension)
A joint NSW and Australian Government initiative to preserve and study a future approximately 20km north-south metro rail corridor from Bradfield (Western Sydney Aerotropolis) to M
View Oran Park
GDP & Economic Output
Economy expands 2.5% but per capita gains tell a more modest story
Australian GDP reached $695.9bn in the March Quarter of 2026, with the annual total at $2.76t — up 2.3% year-on-year. Headline growth of 2.5% masks modest per capita gains of just 1.0%, as population growth dilutes individual gains. Manufacturing, Financial Services, and Mining are running well above their 10-year averages, while Agriculture contracts against a long-run norm of +4.0%. Growth momentum appears to be stabilising at a moderate pace.
Australian GDP totalled $695.9bn in the March Quarter of 2026, reaching a combined $2.76t over the rolling year. The economy expanded 2.5% year-on-year, with the annual measure growing 2.3%. Growth appears to be stabilising at a moderate pace, supported by broad-based gains across goods-producing industries and financial services. The trajectory suggests a recovery phase building from a period of significantly weaker aggregate expansion, with momentum now running across multiple sectors simultaneously.
At $25,033 per person in the March Quarter, GDP per capita grew just 1.0% year-on-year — well below the 2.5% headline rate. With population growth of approximately 1.5% absorbing much of the aggregate expansion, gains per person remain modest. This persistent divergence between headline and per capita growth means the average Australian's economic output is growing at roughly two-fifths the pace of the economy as a whole — a dynamic that continues to define Australia's current economic cycle.
Manufacturing output surged 3.2%, running 2.8 percentage points above its 10-year average of 0.4% — the standout industrial performer. Financial Services expanded 4.9% against a long-run average of 2.5%, while Mining added 3.1% versus its 10-year norm of 0.9%. Weighing on the result, Agriculture contracted 0.7% against a 10-year average of 4.0% — a 4.7pp shortfall — while Health (+2.2%) and Professional Services (+1.7%) also ran materially below their historical norms of 5.1% and 4.1% respectively.
Scroll to load chart
Recent Posts
Population & Migration
Migration retreats from post-COVID highs as population growth moderates to 1.5%
Australia's population reached 27.8 million in December 2025, growing 1.5% over the year. Overseas migration fell 8.9% to 301,000 persons — 488.8pp below its 10-year average growth rate — while natural increase of 112,600 rose 7.9%, tracking 10.5pp above its average. WA (+2.2%) and VIC (+1.7%) lead state growth; TAS (+0.5%) lags.
Australia's population reached 27.8 million as at December 2025, growing 1.5% (approximately 417,000 persons) over the year. Growth has moderated from the post-COVID peak migration surge, with tightened visa settings reducing temporary and student arrivals. The 1.5% rate reflects a normalisation phase — overseas migration is declining while natural increase plays a proportionally larger role in sustaining population gains.
Annual population growth comprised two national components: overseas migration of 301,000 persons (-8.9% YoY) and natural increase of 112,600 persons (+7.9% YoY). Natural increase is the standout, running 10.5pp above its 10-year average growth rate of -2.6%. Overseas migration, while the dominant contributor at 301,000 persons, contracted sharply — its -8.9% growth sits 488.8pp below the 10-year average of +479.9%, reflecting the unwinding of post-COVID catch-up flows. Interstate migration nets to zero at the national level.
State population growth diverges sharply from the national 1.5% rate. WA (+2.2%), VIC (+1.7%) and QLD (+1.6%) outpace the national rate, while NSW (+1.2%), SA (+1.0%) and TAS (+0.5%) lag. In overseas migration, ACT recorded the fastest intake growth (+9.9%) and NT held positive (+2.0%), while TAS (-18.0%), WA (-13.8%) and VIC (-12.2%) saw the sharpest contractions — suggesting rental market pressures and infrastructure capacity are increasingly reshaping where migrants settle.
Scroll to load chart
Recent Posts
Development Activity
Approvals recovering but completions lag as pipeline bottleneck deepens
201,200 dwellings were approved in the year to April 2026, up 9.9% YoY and 11.1pp above the 10-year average growth rate, though the level at 7 per 1,000 persons remains below the long-run average of 8. Attached approvals led with 17.5% growth, 20.3pp above average. ACT (+93.5%) and QLD (+19.4%) are leading approval growth; VIC contracted 1.5%. Completions fell 2.7%, flagging a delivery bottleneck.
201,200 dwellings were approved in Australia in the year to April 2026, up 9.9% year-on-year—11.1 percentage points above the 10-year average growth rate of -1.2%. Despite this cyclical recovery in momentum, the level of approvals remains below long-run norms at 7 per 1,000 persons against the 10-year average of 8 (-7.1%). Approvals appear to have troughed and are now in recovery, with the pipeline rebuilding after an extended period of contraction.
The three pipeline stages show diverging trajectories: approvals (201,200, Apr-26) and commencements (196,000, Dec-25, +16.1%—16.6pp above the 10-year average of -0.5%) are both recovering strongly, but completions (172,200, Dec-25) fell 2.7%, with the delivery rate dropping to just 6 per 1,000 persons against an average of 7 (-16.3%). This signals a bottleneck at the final stage: supply is being approved and commenced at an accelerating pace but is not converting to completed dwellings. Attached dwelling approvals are driving the type-mix recovery, growing 17.5% against a 10-year average decline of 2.8%, while house approvals grew a more moderate 4.9%.
State approval growth ranges widely on a per-capita basis: ACT recorded the strongest expansion (+93.5%), followed by QLD (+19.4%) and NT (+16.5%), while VIC was the only jurisdiction to decline (-1.5%). Commencement momentum is led by NT (+47.1%), NSW (+24.2%) and WA (+22.9%), with TAS the slowest at +2.4%. Commercial development is mixed: retail building values grew 9.9%—6.1pp above the 10-year average—while office values contracted 5.4% against a long-run average gain of 8.5%, the sharpest underperformance across the commercial pipeline.
Scroll to load chart
Recent Posts
Housing Market
Regional markets surge as Australian housing affordability diverges
Capital city house prices reached $1,090,000 in Mar-26, up 9.1% YoY. Regional prices surged 11.9% to $754,000, running 4.7pp above the 10-year average of 7.2%. Capital city attached affordability is 13.5% below its historical average — the only segment tracking favourably — while regional affordability has deteriorated sharply. NT, WA, and QLD lead growth; VIC and NSW lag significantly.
The median house price across Australia's capital cities reached $1,090,000 in March 2026, up 9.1% over the year. Capital city attached dwellings rose 7.0% to $736,000, 3.7 percentage points above the 10-year average growth of 3.3%. Regional markets outperformed capitals: house prices reached $754,000, up 11.9% — 4.7pp above the 10-year average of 7.2%. Regional attached prices rose 13.9%, 6.3pp above the 10-year average of 7.6%. Growth remains elevated across all segments, with regional markets accelerating most aggressively.
Capital city attached dwellings are priced at 6.65x annual household income, 13.5% below the 10-year average of 7.69x — the only segment tracking below its historical affordability norm. At 6.65x, capital attached housing remains seriously unaffordable, yet represents relative improvement. Regional houses at 6.81x are 7.5% above their 10-year average of 6.34x, placing them firmly in seriously unaffordable territory. Regional attached at 6.42x is 11.1% above its 10-year average of 5.78x. Regional affordability is deteriorating faster than in capital cities.
Price growth is strongest in NT (+25.0%) and WA (+22.0%) for capital city houses, with QLD also elevated at +21.4%. Growth is weakest in VIC (+1.8%), NSW (+2.4%), and TAS (+3.5%). For attached dwellings, WA leads at +27.8%, QLD at +21.8%, and NT at +19.4%, while VIC is the only capital market recording price falls at -2.1%. NSW holds the highest capital city house prices at $1,490,000 and attached at $848,000, while TAS records the lowest house prices at $740,000. The growth divergence between resource-driven states and major eastern capitals continues to widen.
Scroll to load chart
Recent Posts
Housing Finance
Investor lending surges 25%, powering housing finance well above trend
Housing finance commitments totalled $112.4bn in March 2026, up 8.7% year-on-year — 5.3 percentage points above the 10-year average growth rate of 3.4%. Investor lending is the standout, surging 25.0% against a 10-year average of 12.6%. ACT, TAS and NSW lead state growth while NT contracts 6.8%.
Housing finance commitments totalled $112.4bn in March 2026, up 8.7% compared to a year ago. Annual growth sits 5.3 percentage points above the 10-year average of 3.4%, indicating lending volumes are running well above trend. Housing finance has recovered firmly from the rate-driven contraction of 2022-23, with the pace of recovery accelerating into early 2026 as rate cut expectations and improved borrowing conditions support renewed demand.
Owner-occupier lending stood at $75.8bn (67.4% of total) while investor lending reached $36.7bn (32.6% of total). Owner-occupier lending grew 2.3% — modest but consistent with trend — while investor lending surged 25.0%, nearly double its 10-year average of 12.6%. Investors now account for 32.6% of new lending, with elevated activity reflecting strong rental yields and expectations of continued capital appreciation as easing monetary conditions improve return profiles.
At the state level, ACT (+14.6%), TAS (+11.6%) and NSW (+11.5%) recorded the strongest total lending growth, while NT (-6.8%) and WA (+2.8%) lagged well below the national pace. Owner-occupier trends mirror this divergence — ACT (+13.7%) and NSW (+7.6%) lead while WA (-5.7%) and NT (-11.3%) contracted outright. The concentration of growth in eastern states aligns with stronger price momentum and rental demand in those markets, where rate cuts have most improved borrowing capacity and renewed investor appetite.
Scroll to load chart
Recent Posts
Monetary & Financial Conditions
RBA holds at 4.35% with rate cuts off the table for 2026
The RBA cash rate stands at 4.35% as at June 2026, on hold for 2 months following recent tightening. Variable mortgage rates at 6.80% (May 2026) are 32.8% above their 10-year average. Two-year bond yields at 4.66% sit 112.2% above their decade average of 2.20%. The near-flat yield curve signals markets expect no near-term easing.
The RBA cash rate stands at 4.35% as at June 2026. The cash rate has been on hold for 2 months since May 2026, following approximately 50bp of tightening from mid-2025 as the Board moved to contain persistent underlying inflation. The RBA has adopted a hawkish pause stance, with rate cuts firmly off the table for the remainder of 2026. Bond market pricing, with the 2-year yield at 4.66% against a decade average of 2.20%, underscores how elevated current financial conditions remain relative to the prior decade of ultra-accommodative policy.
Monetary tightening continues to transmit fully to borrowers. Variable owner-occupier mortgage rates stand at 6.80% as at May 2026, a 2.45% spread over the cash rate and 32.8% above the 10-year average of 5.12%. The 3-year fixed rate at 6.73% sits 46.6% above its 10-year average of 4.59%. Small business lending at 9.00% is 30.5% above its 10-year average of 6.90%, constraining business investment capacity. Across all borrower categories, rates remain materially above prior-decade norms.
Bond markets confirm the persistence of tight conditions. The 2-year government bond yield stands at 4.66%, some 112.2% above its 10-year average of 2.20%. The 10-year yield sits at 4.77% at the latest weekly close (week ending 27 June 2026), easing from the June monthly level of 4.98% — still 74.9% above its 10-year average of 2.85%. The yield curve spread is approximately 11bp positive (10yr over 2yr), a near-flat configuration signalling market uncertainty over the rate path and limited expectation of a near-term easing cycle.
Scroll to load chart
Recent Posts
FX Rates & Commodities
AUD near decade highs; rural commodities surge while mining lags
The Australian dollar averaged US$0.7200 in May 2026, up 12.5% year-on-year and 9.1% above its 10-year average of US$0.66. The trade-weighted index of 66.60 is 8.1% above its decade norm. Rural commodity growth of 16.2% outpaces its historical average by 10.1pp, while mining commodity growth of 4.7% trails its 9.3% norm. The AUD has softened to US$0.6895 in current spot trade.
The Australian dollar is trading at US$0.6895 as at 27 June 2026, having eased from a May 2026 monthly average of US$0.7200. The trade-weighted index stands at 66.60 (May 2026). The AUD is 9.1% above its 10-year average of US$0.66, and the TWI is 8.1% above its 10-year average of 61.61. On a year-on-year basis, the AUD is up 12.5% and the TWI has risen 11.7%, reflecting sustained broad-based currency appreciation supported by an elevated interest rate differential and resilient export revenues.
Across major crosses as at 27 June 2026, the AUD trades at CNY 4.6845, GBP 0.5219, and EUR 0.6200 (May 2026 average). The AUD/JPY cross is the most elevated versus history at 114.14 (May 2026)—15.7% above its 10-year average of 98.63—reflecting persistent Bank of Japan monetary accommodation. AUD/EUR has risen 8.8% year-on-year to 0.6200, underpinning competitive pricing in European markets. The AUD/CNY rate of 4.6845 is critical for commodity export revenues; a firm AUD acts to moderate the windfall from elevated agricultural and resource export prices.
The commodity price index (AUD terms) is growing at 6.1% year-on-year in May 2026, 2.8pp below its 10-year average of 8.9%. The rural subsector is the key standout: prices growing at 16.2% versus a 10-year norm of 6.1% (+10.1pp), reflecting elevated global agricultural prices. Mining commodity growth of 4.7% lags its 9.3% historical average by 4.6pp, with iron ore facing headwinds from Chinese demand uncertainty. Gold at AUD $5,927/oz provides a partial offset, but subdued mining commodity growth remains a modest drag on Australia's terms of trade.
Scroll to load chart
Recent Posts
Employment
Unemployment rises above 10-year average as labour market eases
Australia's unemployment rate is 4.3% as at March 2026, above the 10-year average of 4.0% and rising 4.9% year-on-year. Unemployed persons grew 7.0%, 7.1pp above the 10-year average—the key standout. South Australia and Queensland lead employment growth; Victoria and Tasmania lag. The labour market is easing from historic lows.
The unemployment rate in Australia stands at 4.3% as at March 2026, above the 10-year average of 4.0%. The rate has risen 4.9% over the year, reflecting a gradual easing from historically tight conditions. The number of unemployed persons grew 7.0% over the year—7.1 percentage points above the 10-year average of near zero—marking a clear cyclical turning point from prior lows.
Australia employs 14.8 million persons as at March 2026, up 1.8% (266,000) over the year. Full-time employment grew 1.9% while part-time grew approximately 1.6%, with full-time positions accounting for around 73% of new jobs created. Growth remains concentrated in full-time work—a positive quality signal—even as headline unemployment drifts above its long-run average.
At the state level, Victoria records the highest unemployment rate at 4.8%, while Queensland is the lowest at 3.7%, against the national rate of 4.3%. Employment growth diverges markedly: South Australia leads at 2.6% and Queensland follows at 2.3%, while Tasmania contracted 0.6% and Victoria and ACT recorded the weakest growth at 0.7%. Queensland stands out as the only state combining the lowest unemployment rate with above-average employment growth.
Scroll to load chart
Recent Posts
Job Advertisements
Job ads fall 1.7% in May 2026, tracking well below historical growth norms
Australian job advertisements totalled 625,600 in May 2026, down 1.7% year-on-year, with growth running 8.4pp below the 10-year average pace. Sales ads are the standout laggard at 7.1pp below historical norms. SA, TAS and WA lead hiring growth nationally while ACT (-12.4%) lags sharply.
Job advertisements in Australia totalled 625,600 in May 2026, down 1.7% compared to a year ago. Annual growth is running 8.4 percentage points below the 10-year average pace of +6.7%, pointing to a sustained cooling in hiring demand. As a leading indicator of employment conditions 3-6 months ahead, below-trend job ad growth signals a softer labour market through late 2026. With applications per ad rising, employers are gaining bargaining power as businesses prioritise retention over expansion.
Across categories, all three segments are tracking below their historical growth averages. Professional ads totalled 182,000 in May 2026, with annual growth of -0.5%, which is 6.4 percentage points below the 10-year average pace. Industrial ads at 128,500 rose 1.5% year-on-year but remain 6.9 percentage points below historical norms. Sales ads are the standout laggard at 7.1 percentage points below the 10-year average, posting growth of just +0.2%. Broad-based softness across all categories reflects cooling demand rather than sectoral rotation.
State-level job ad growth spans from +2.2% in SA to -12.4% in ACT, a 14.6 percentage point range that reflects an uneven hiring cycle nationally. TAS (+2.0%) and WA (+1.3%) also outperform in total ads. In professional categories, TAS (+6.1%) and NSW (+6.0%) lead, while ACT (-9.8%) and NT (-7.2%) lag most sharply. The concentration of weakness in ACT likely reflects public-sector fiscal caution, while SA and WA's outperformance aligns with resource-sector activity. These divergences point to an uneven labour market outlook over the next 3-6 months.
Scroll to load chart
Recent Posts
Wages & Earnings
Wage growth steadies at 3.2% as full-time earnings top $109,000
Australia's WPI grew 3.2% to 160.3 in March quarter 2026, sitting 15.3% above the 10-year average level of 139.1. Full-time workers earned $2,129 per week ($109,517 annually) as at November 2025, with weekly earnings up 4.0%. ACT (+3.7%) and WA (+3.6%) led WPI growth; NT (+2.3%) lagged. Wage growth has moderated from recent highs, signalling stabilisation.
Wages grew 3.2% over the year to the March quarter 2026, as measured by the Wage Price Index, with the index at 160.3. The current level sits 15.3% above the 10-year average index level of 139.1, reflecting cumulative wage gains built across recent cycles. Wage growth has moderated from the elevated rates recorded at the post-pandemic peak, with market commentary pointing to stabilisation rather than continued escalation. At 3.2%, growth remains positive but the trajectory has clearly turned — wages appear to have passed their cyclical peak.
Full-time workers earned $2,129 per week as at November 2025, equivalent to $109,517 per year — annual earnings rose 4.2% over the year and weekly earnings 4.0%. CPI data is not provided in this dataset, so a precise real wage figure cannot be stated; however, at 4.0% nominal earnings growth, workers achieve positive real purchasing power gains whenever inflation runs below this level. Economists have noted that current wage growth, if supported by productivity recovery, is broadly compatible with the RBA's inflation framework — suggesting the wage-inflation dynamic is normalising.
On WPI growth, ACT (+3.7%), WA (+3.6%) and QLD (+3.4%) outpaced the national 3.2%, while NT (+2.3%), TAS (+2.9%) and SA (+3.1%) recorded softer growth. Notably, TAS holds the highest WPI index level at 164.1 despite ranking second-slowest for growth — its cumulative gains were concentrated in earlier cycles. On earnings, WA commands the highest weekly pay at $2,304 versus TAS at $1,890. Earnings growth rankings diverge sharply from WPI: NSW led earnings at +4.7% while WA — the top earner by level — grew just 2.6%, revealing structural divergence across wage measures between states.
Scroll to load chart
Recent Posts
Household Consumption
Household spending hits $382.9bn as power costs surge 7.6pp above trend
Australian household consumption totalled $382.9bn in Mar-26, rising 5.6% over the year. Per capita spending of $13,771 sits 20.9% above its 10-year average of $11,392. Power costs are the standout essential, growing 7.6 percentage points above long-run trend while transport spending runs 14.6pp below average. Queensland and Western Australia lead state consumption growth; Victoria trails on a per capita basis.
Household consumption expenditure totalled $382.9bn in the March quarter 2026, up 5.6% over the year. Per capita consumption reached $13,771, growing 4.0% annually and sitting 20.9% above its 10-year average of $11,392. The elevated per capita level relative to the long-run average reflects cumulative price pressures and a structural lift in spending, with aggregate consumption maintaining a pace well above historical norms.
Among essentials, food expenditure reached $36.1bn, rising 4.2% over the year. Power costs are the standout essential, with growth of 12.0% running 7.6 percentage points above the 10-year average of 4.4%, reflecting persistent energy price pressures. By contrast, transport spending grew just 4.8%—14.6 percentage points below its 10-year average of 19.4%—suggesting households are curtailing mobility-related expenditure. The divergence between surging utility costs and suppressed transport spending signals a budget squeeze consolidating around non-discretionary essentials.
Queensland and Western Australia led household consumption growth at 3.1% each, while Tasmania recorded the weakest expansion at 1.8% and NSW and Victoria both grew at 2.2%. On a per capita basis, the Northern Territory recorded the highest spending at $14,079, compared to Tasmania's $11,823. Per capita growth was fastest in Queensland (+1.5%) and slowest in Victoria (+0.5%), with Western Australia's per capita gain of +0.9% notably trailing its headline growth rate—reflecting strong population intake absorbing a disproportionate share of consumption gains.
Scroll to load chart
Recent Posts
Household Spending
Spending holds above trend, but alcohol crashes and eastern states lag
Australian household spending totalled $232.0bn in September 2025, up 5.1% year-on-year, with per capita spending of $33,362 running 20.9% above the 10-year average of $27,600. Alcohol collapsed 18.0% against a near-flat long-run trend—the widest category miss at 18.2pp below average. NT, WA, and QLD are driving the fastest state growth; NSW, VIC, and ACT lag materially.
Household spending in Australia totalled $232.0bn in September 2025, up 5.1% compared to a year ago. Per capita annual spending reached $33,362—20.9% above the 10-year average of $27,600—reflecting both population-driven volume growth and elevated price levels. The quarterly per capita equivalent of $8,369 similarly sits 20.8% above the historical norm of $6,928, confirming that aggregate household expenditure remains structurally elevated relative to long-run trend.
Essential spending showed a mixed picture: food grew 6.4% and health rose 8.1%—2.0 percentage points above its 10-year average of 6.1%—while transport underperformed at 4.1% against a long-run norm of 7.0%. Among discretionary categories, recreation (+7.5%, 2.4pp above its 5.1% average) and miscellaneous (+8.7%, 3.4pp above 5.3%) suggest pockets of consumer confidence. The starkest divergence is alcohol, down 18.0% against a 10-year average of +0.2%—an 18.2pp shortfall—while hotels and restaurants (+6.1%) and clothing (+3.3%) also trail their respective long-run norms.
At the state level, NT (+7.8%), WA (+7.1%) and QLD (+6.9%) are leading household spending growth, while NSW (+4.4%), VIC (+3.7%) and the ACT (+3.4%) are the slowest-growing jurisdictions—a pattern consistent with differing labour market conditions and uneven mortgage stress exposure. National per capita spending of $33,362 sits well above its long-run average, though the persistent underperformance in clothing and hospitality points to selective consumer pullback in higher-cost discretionary categories as savings buffers continue to erode.
Scroll to load chart
Recent Posts
Inflation & Cost of Living
CPI eases to 4.0% in May but housing at 6.5% stays well above RBA target
Australian CPI rose 4.0% in the year to May 2026 (index: 102.1), remaining above the RBA's 2–3% target band. Housing led inflation at 6.5% and food at 3.3%, with multiple categories sitting 8–9% above their 10-year average price levels. The annual rate eased in May, continuing the disinflation trend. Tasmania (+5.0%) and South Australia (+4.4%) lead state growth; Victoria (+3.5%) is the softest.
Inflation in Australia was 4.0% in the year to May 2026 (CPI All Groups index: 102.1). Inflation remains above the RBA's 2–3% target band, running at twice the upper bound. The annual rate eased in May, consistent with a gradual disinflation trend since the post-pandemic peak. Housing costs rose 6.5% and food 3.3%, the dominant contributors. While the direction of travel is toward target, sticky services and housing pressures mean a return within the RBA's band is not yet in sight.
Housing inflation of 6.5% is the standout pressure, with its index at 103.8 — 8.0% above its 10-year average of 96.1. The most elevated CPI category carries an index of 104.6 against a 10-year average of 95.7, sitting 9.3% above its historical norm. Two further categories are 8.4% and 7.7% above their long-run average levels respectively, confirming cost pressures are entrenched across services. Food at 3.3% (index: 102.6) provides relative relief. The breadth of above-average categories confirms this inflation cycle has been structural and broad-based rather than concentrated.
South Australia recorded the highest CPI All Groups index (102.7, +4.4%) and Victoria the lowest (101.6, +3.5%) — a 0.9 percentage point spread. Tasmania led all states at +5.0%, 1.0 point above the national 4.0%. Housing shows sharper state divergences: Tasmania (+9.8%), South Australia (+7.9%), and Queensland (+7.2%) face the most acute housing cost pressures, while Victoria (+5.3%), WA (+5.6%), and NT (+5.7%) are comparatively contained. Wage growth data is not available in this dataset; states with inflation above 4.5% — Tasmania and South Australia — face the greatest real wage erosion risk.
Scroll to load chart
Recent Posts
Equities & Superannuation
ASX capital growth trails decade average as super performance index surges
The ASX 200 closed at 8,731 points as at May 2026, delivering 3.5% capital growth over the year — 2.0pp below the 10-year average of 5.5%. Total market capitalisation reached $3.3 trillion, also growing below its long-run pace of 7.5%. The superannuation performance index at $375.4bn stands 39.8% above its 10-year average of $268.6bn, the clear standout. Markets edged modestly higher into late June 2026.
The ASX 200 closed at 8,731 points as at May 2026, with the All Ordinaries reaching 8,965 points — both recording 3.5% capital growth over the year. These are price indices measuring capital appreciation only and exclude dividend distributions. At 2.0 percentage points below the 10-year average capital growth of 5.5%, momentum is below historical pace. Total market capitalisation stood at $3.3 trillion, up 5.5% year-on-year, also trailing its long-run average of 7.5%. As at the week ending 27 June 2026, the ASX 200 edged to 8,764, with the All Ordinaries at 8,964, indicating markets remain near recent highs.
Australia's superannuation performance index recorded $375.4 billion as at May 2026, running 39.8% above its 10-year average of $268.6 billion — the most significant standout in this period's data. This reflects the compounding strength of Australia's mandatory retirement savings system, where sustained contribution flows underpin asset accumulation through equity market cycles. With the financial year drawing to a close, the sector enters FY2027 from a position of structural depth, supported by strong global equity exposure through balanced and growth fund allocations. The retirement savings pool remains one of the largest per-capita accumulations globally.
Despite capital growth tracking below its historical average, the ASX remains near multi-year highs, with major bank stocks providing a defensive, yield-anchored stabilising force for the index. Softer domestic inflation dynamics and easing global price pressures provided a constructive late-period backdrop, supporting risk appetite into the final weeks of FY2026. The below-average capital growth rate in part reflects a returns mix tilted toward dividends over price appreciation — total returns inclusive of distributions remain more competitive than headline index movements suggest. The near-term outlook for equities is contingent on the pace of domestic interest rate adjustment and the durability of global growth conditions.
Scroll to load chart
Recent Posts