


Australian GDP rose 0.1% in the March quarter 2024 and 1.1% over the year. This is the lowest through the year growth since December 1992, excluding the pandemic period.
Market Overview
June 2026 Economic Summary
The Population Propeller: Australia’s Aggregate Growth Masks Per Capita Inertia
Australia’s economy is performing a delicate high-wire act, where the safety net of robust population growth prevents a headline fall while individual prosperity teeters. As of mid-2026, the nation presents a study in contrasts: a property market defying gravity through an investor resurgence, even as households tighten belts on everything but the essentials. It is an economy growing by volume, if not by velocity, where the aggregate $2.76 trillion output masks a growing sense of per capita inertia among the 27.7 million Australians.
Download Reports
Coming Soon
Integrate seamlessly with your workflows and communicate the latest market drivers to clients.
.svg)
0.7132
AUD/USD
.svg)
4.8279
AUD/CNY
.svg)
0.5307
AUD/GBP
Key Economic Indicators
Click to navigate| Indicator | As At | Units | Latest | -1yr | -2yr | -3yr | -4yr | -5yr |
|---|---|---|---|---|---|---|---|---|
| GDP | 2026-Mar | $m | 695,945 (+2.5%) | 678,840 (+1.3%) | 670,388 (+1.1%) | 663,102 (+2.8%) | 645,027 (+3.6%) | 622,355 |
| CPI | 2026-Apr | Index | 102.80 (+4.2%) | 98.68 (+2.4%) | 96.40 (+4.1%) | 92.60 (+6.7%) | 86.79 (+5.4%) | 82.31 |
| Population | 2025-Sep | Persons | 27,724,744 (+1.6%) | 27,301,149 (+1.8%) | 26,831,131 (+2.5%) | 26,169,314 (+1.8%) | 25,704,774 (+0.3%) | 25,633,341 |
| Employment | 2026-Mar | Persons ('000) | 14,768 (+1.8%) | 14,509 (+1.9%) | 14,238 (+2.2%) | 13,935 (+4.1%) | 13,392 (+3.4%) | 12,954 |
| Unemployment | 2026-Mar | % | 4.25 (+19bps) | 4.06 (+18bps) | 3.88 (+30bps) | 3.58 (-39bps) | 3.97 (-170bps) | 5.67 |
| Job Ads | 2026-Apr | No | 641,127 (+0.2%) | 639,926 (-12.7%) | 733,273 (-14.0%) | 852,493 (+0.3%) | 850,294 (+29.2%) | 658,362 |
| Household Spending | 2025-Sep | $m | 232,015 (+5.1%) | 220,838 (+2.8%) | 214,921 (+6.6%) | 201,614 (+28.4%) | 156,982 (-0.4%) | 157,628 |
| House Prices | 2025-Dec | $000s | 1,094 (+8.4%) | 1,009 (+5.5%) | 956 (+7.2%) | 892 (-5.1%) | 940 (+27.9%) | 735 |
| Attached Prices | 2025-Dec | $000s | 741.00 (+8.7%) | 682.00 (+4.6%) | 652.00 (+6.7%) | 611.00 (-5.1%) | 644.00 (+7.2%) | 601.00 |
| Dwelling Approvals | 2026-Apr | No | 201,248 (+9.9%) | 183,174 (+10.1%) | 166,327 (-8.3%) | 181,418 (-13.4%) | 209,519 (+0.9%) | 207,575 |
| Superannuation | 2025-Sep | $bn | 4,466 (+9.4%) | 4,082 (+13.4%) | 3,599 (+9.7%) | 3,281 (-4.4%) | 3,434 (+18.5%) | 2,897 |
| ASX All Ords | 2026-May | Index | 8,965 (+3.5%) | 8,660 (+8.6%) | 7,971 (+9.6%) | 7,273 (-2.4%) | 7,455 (+0.6%) | 7,407 |
Infrastructure & Major Projects
Transforming Australia's future
Sample 16 Active
 Denotes AI-based impression for illustrative purposes only, not to be taken as definitive under any circumstances. Developers and project owners wishing us to use original imagery please Contact Us and we will do so.
 WA
WA
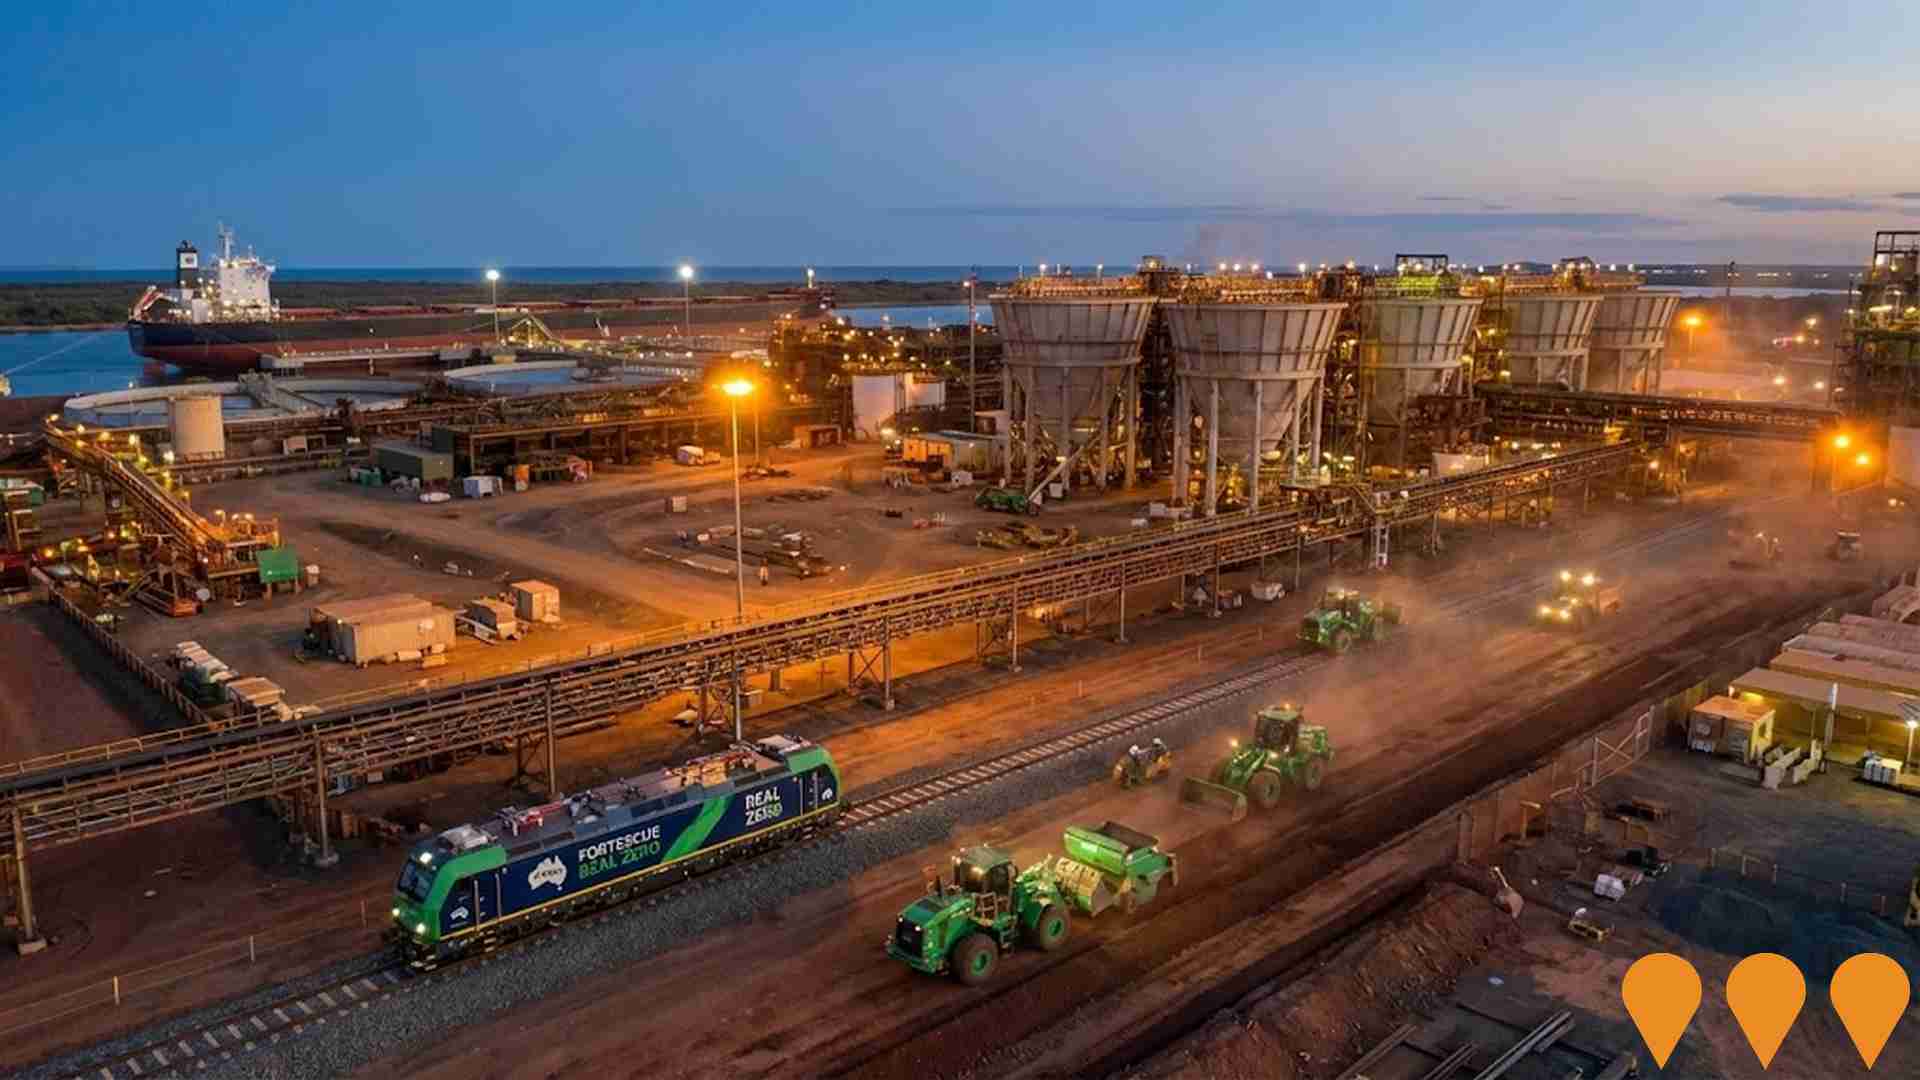
Fortescue Port Hedland Operations Decarbonisation and Modernisation
Comprehensive decarbonisation and modernisation of Fortescue's Port Hedland facilities as part of its Real Zero terrestrial emissions target by 2030. The Herb Elliott Port at Ander
View Port Hedland
 QLD
QLD
Queensland Energy Roadmap 2025
A statewide five-year energy transformation program released by the Crisafulli Government on 10 October 2025, replacing the former Labor government's 2022 Energy and Jobs Plan. The
View Dalrymple
 SA
SA
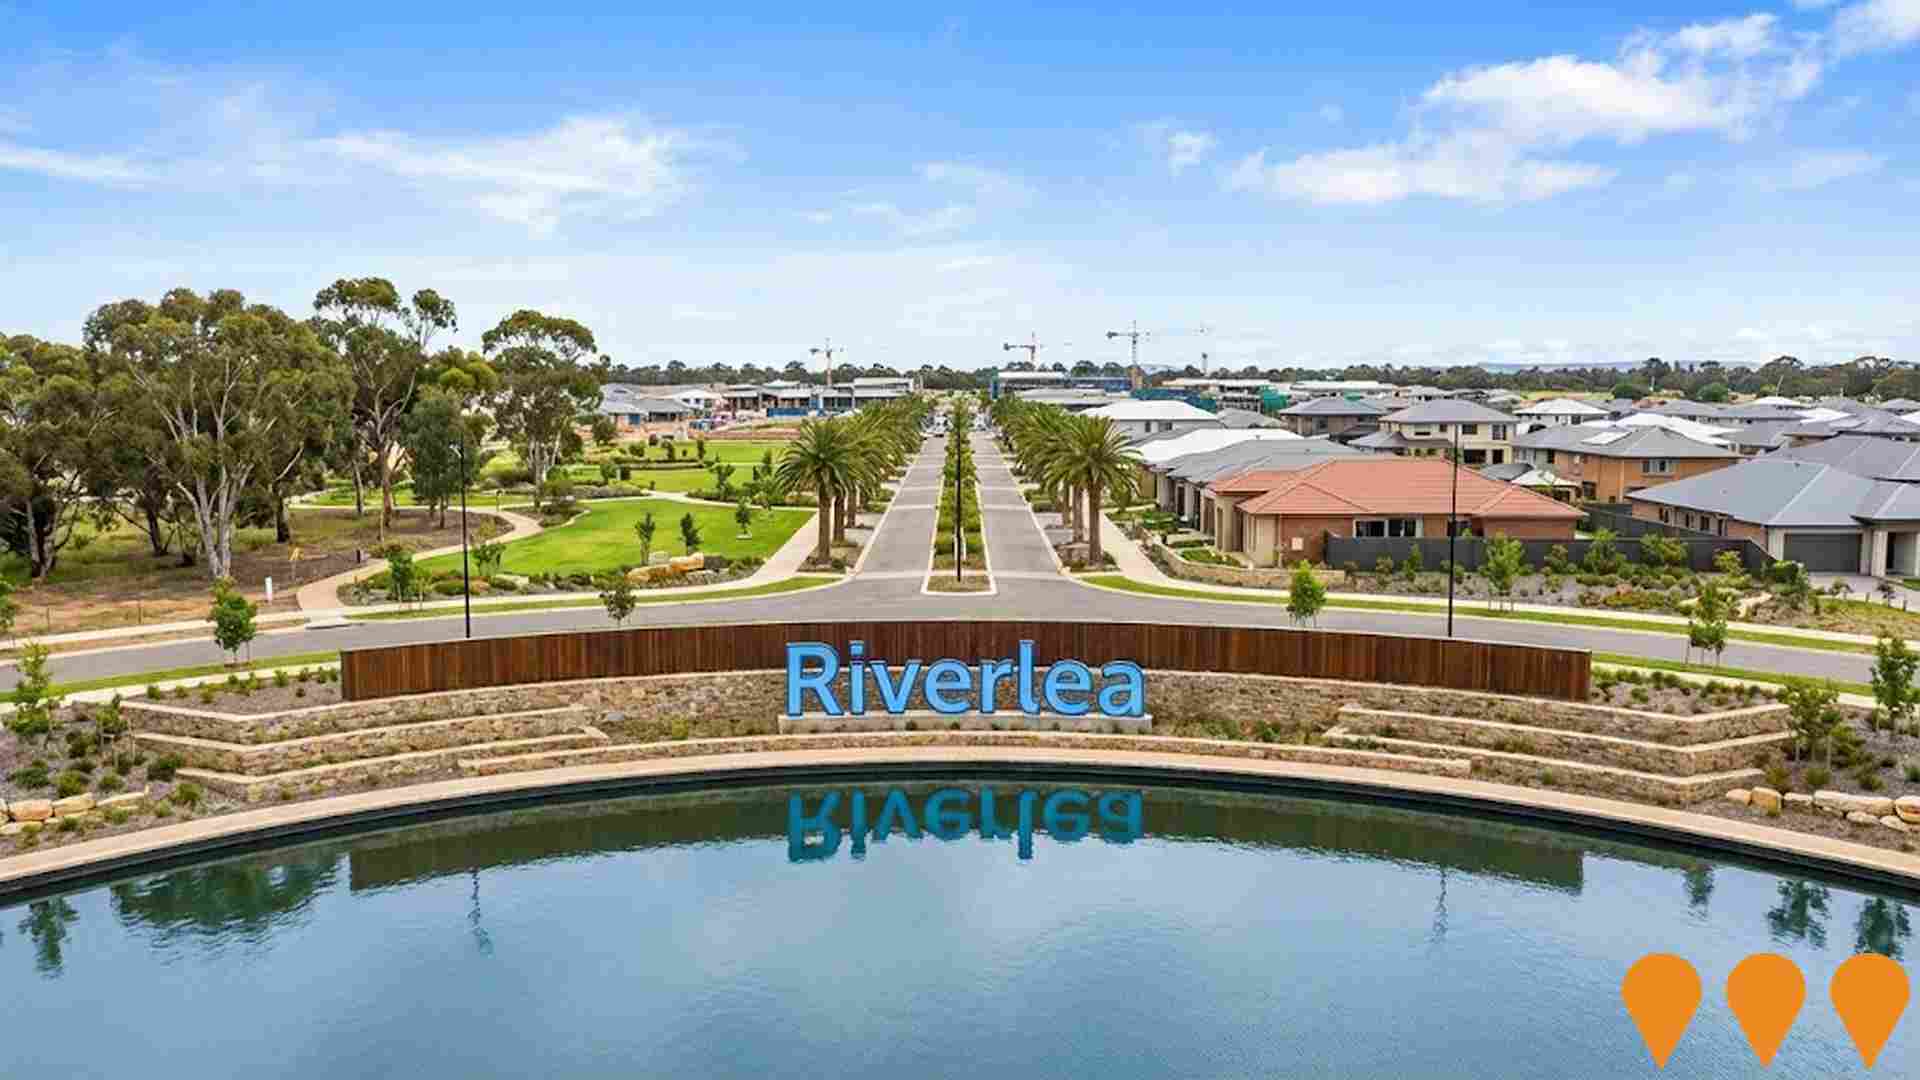
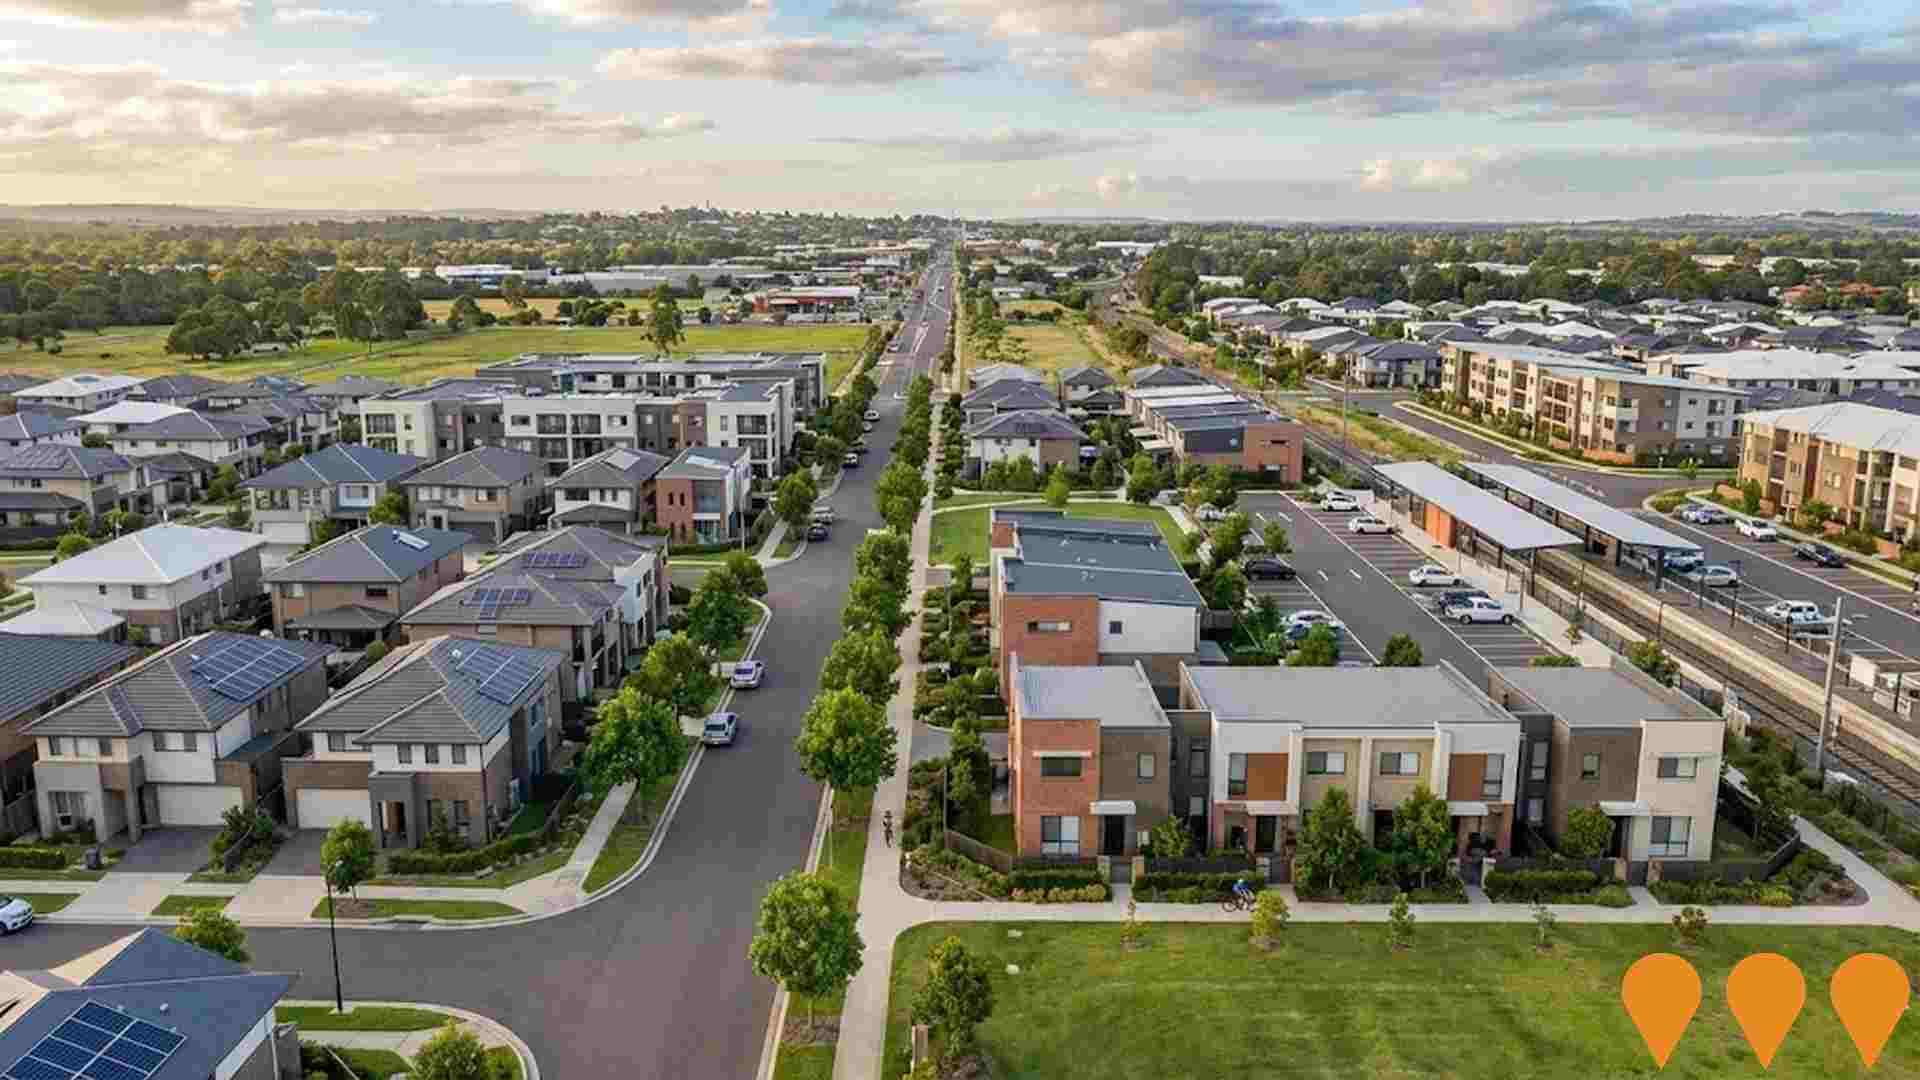
Riverlea Estate (Buckland Park Township)
South Australia's largest master-planned community, covering 1,340ha and planned to deliver 12,000 homes for over 40,000 residents. As of May 2026, The Palms Shopping Village is in
View Virginia - Waterloo Corner
 VIC
VIC
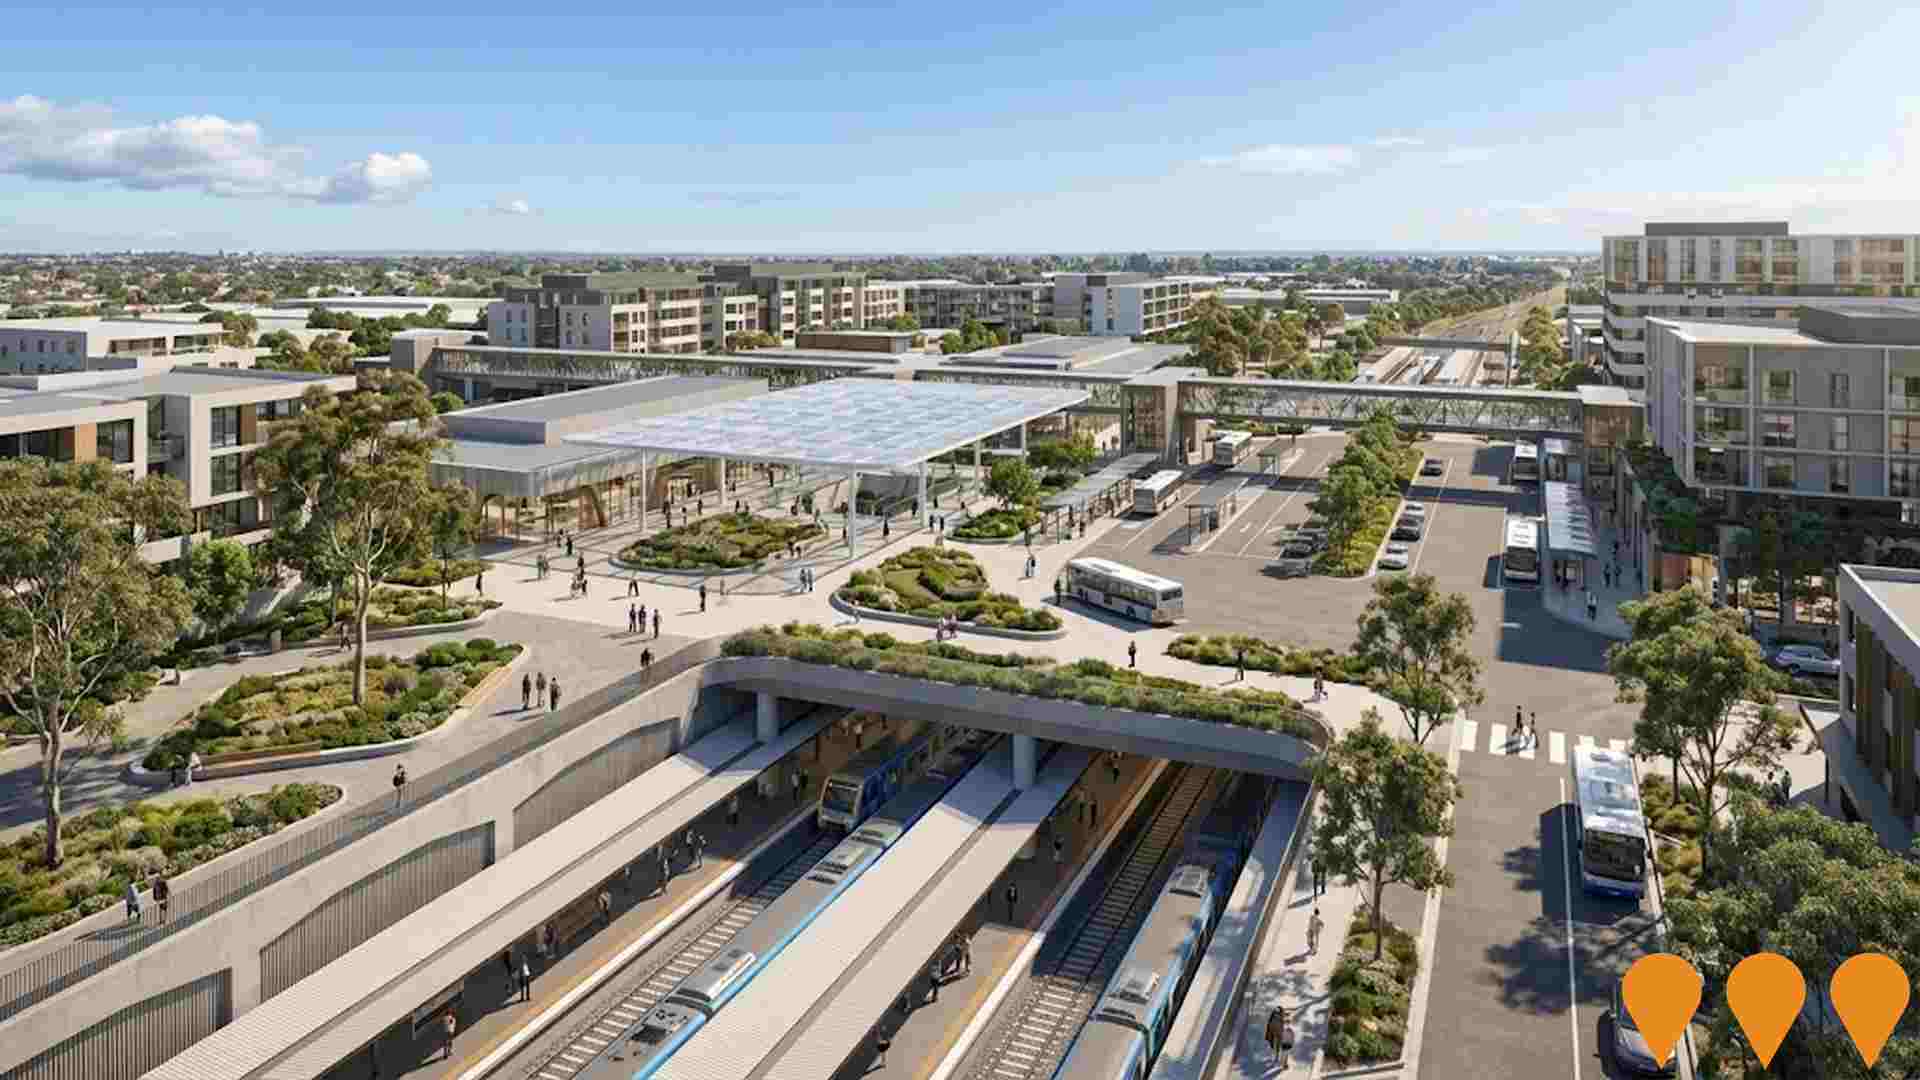
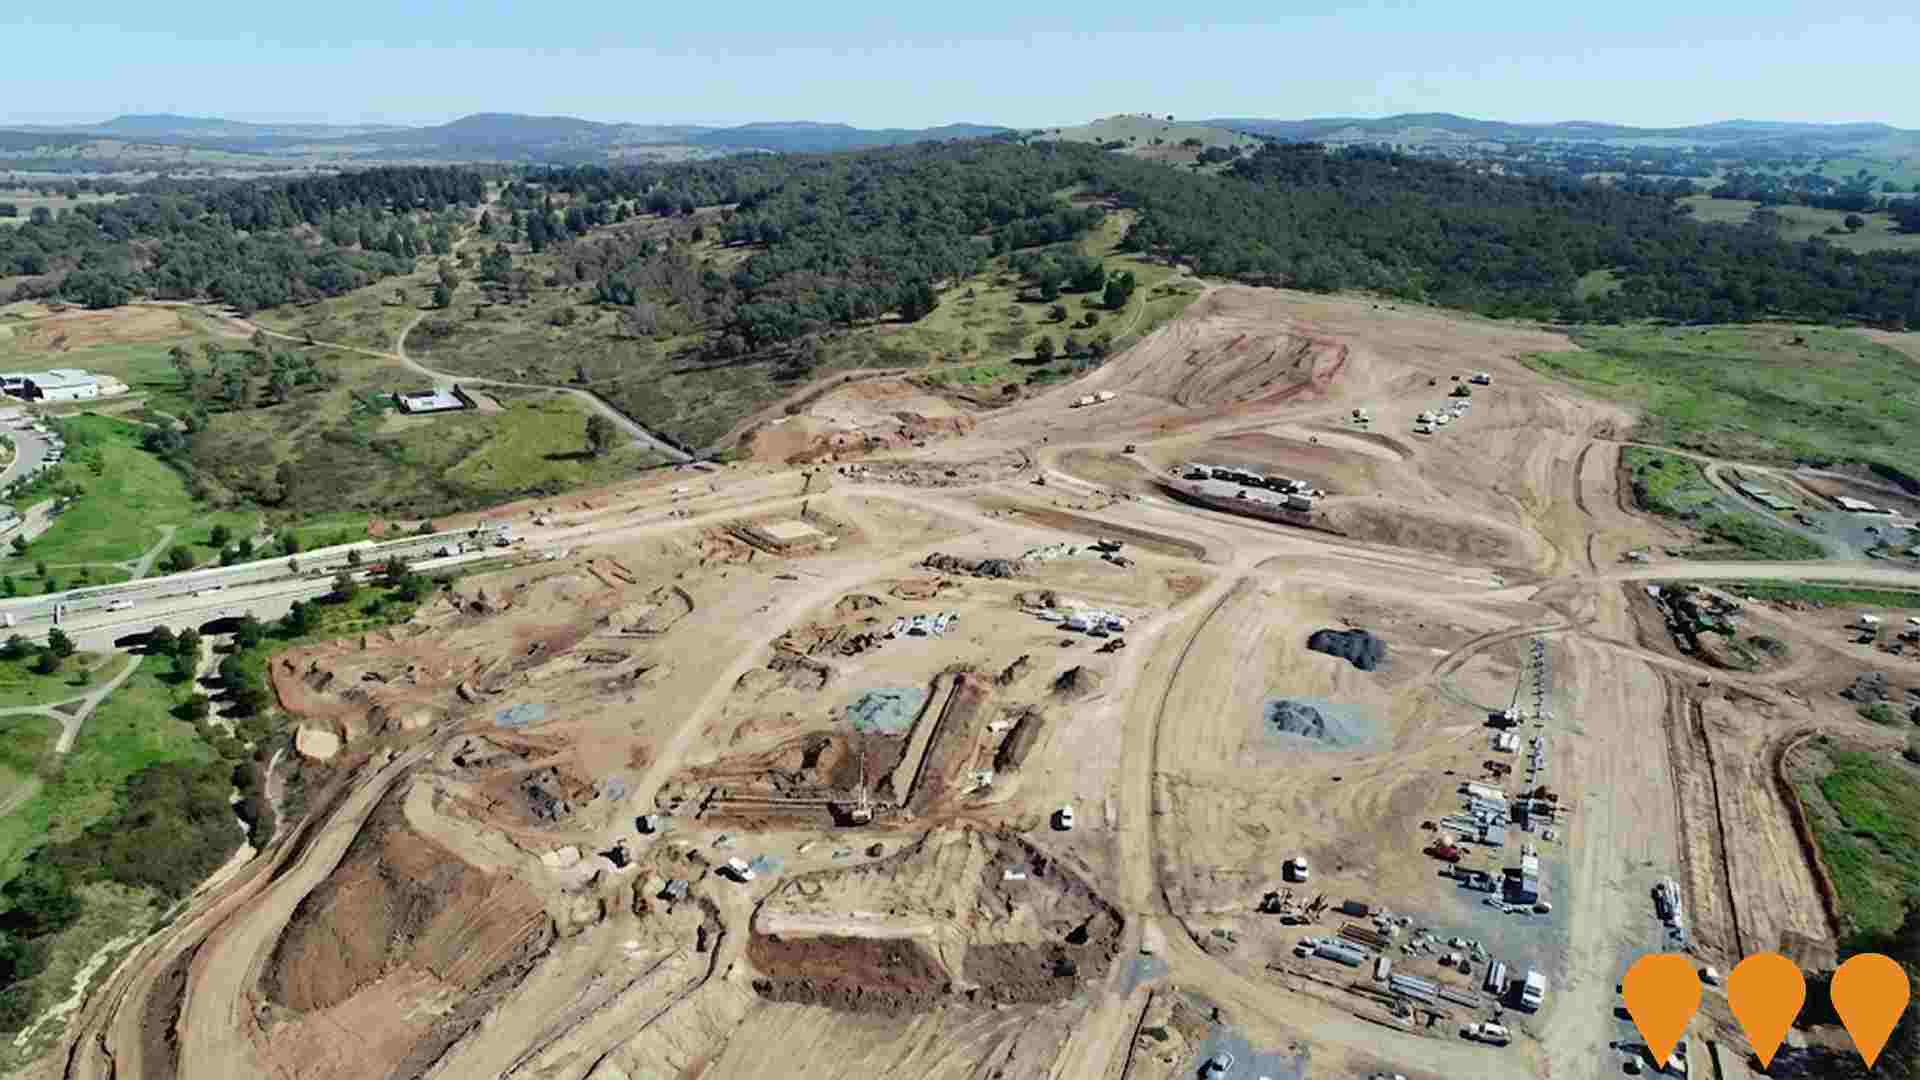
Suburban Rail Loop North - Broadmeadows Station
A new underground transport super hub at Broadmeadows, part of the Suburban Rail Loop (SRL) North segment. The station will serve as a major northern interchange, connecting the Cr
View Broadmeadows
 VIC
VIC
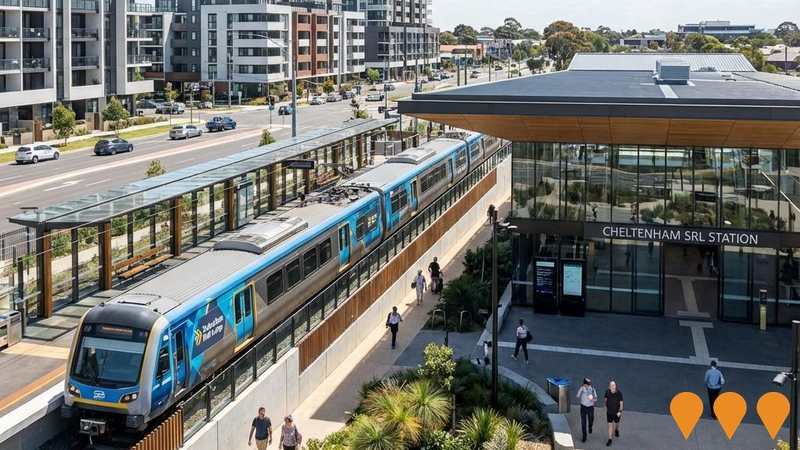
Suburban Rail Loop East
SRL East is the first stage of the Suburban Rail Loop, delivering 26km of twin underground tunnels and six new underground stations at Cheltenham, Clayton, Monash, Glen Waverley, B
View Oakleigh - Huntingdale
 QLD
QLD
Cairns Marine Precinct Common User Facility
Ports North is leading delivery of the Cairns Marine Precinct Common User Facility at Cook Street and Fearnley Street, Portsmith. The project will expand the precinct as a northern
View Gordonvale - Trinity
 NSW
NSW
Westmead Health Precinct Redevelopment
A multibillion-dollar transformation of the Westmead Health Precinct into a global hub for healthcare, research, and education. As of April 2026, the $659 million Children's Hospit
View Pendle Hill - Girraween
 NSW
NSW
Maitland Local Housing Strategy 2041
The Maitland Local Housing Strategy 2041 is a comprehensive framework adopted by Council in June 2023 and endorsed by the NSW Government in September 2024. It manages residential g
View Maitland
 WA
WA
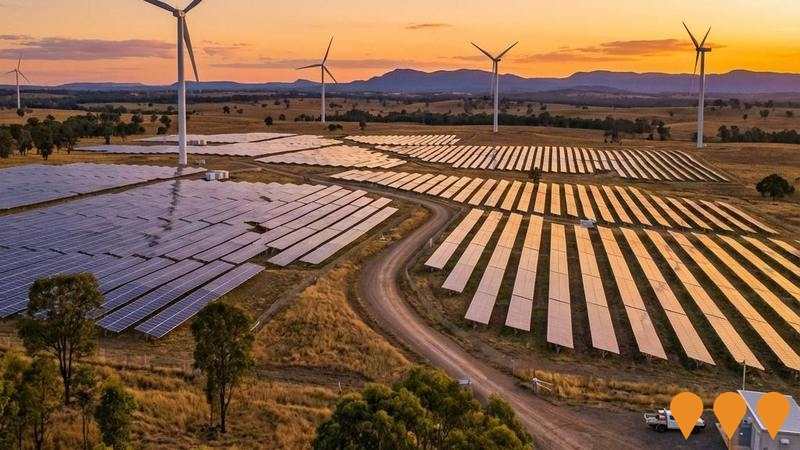
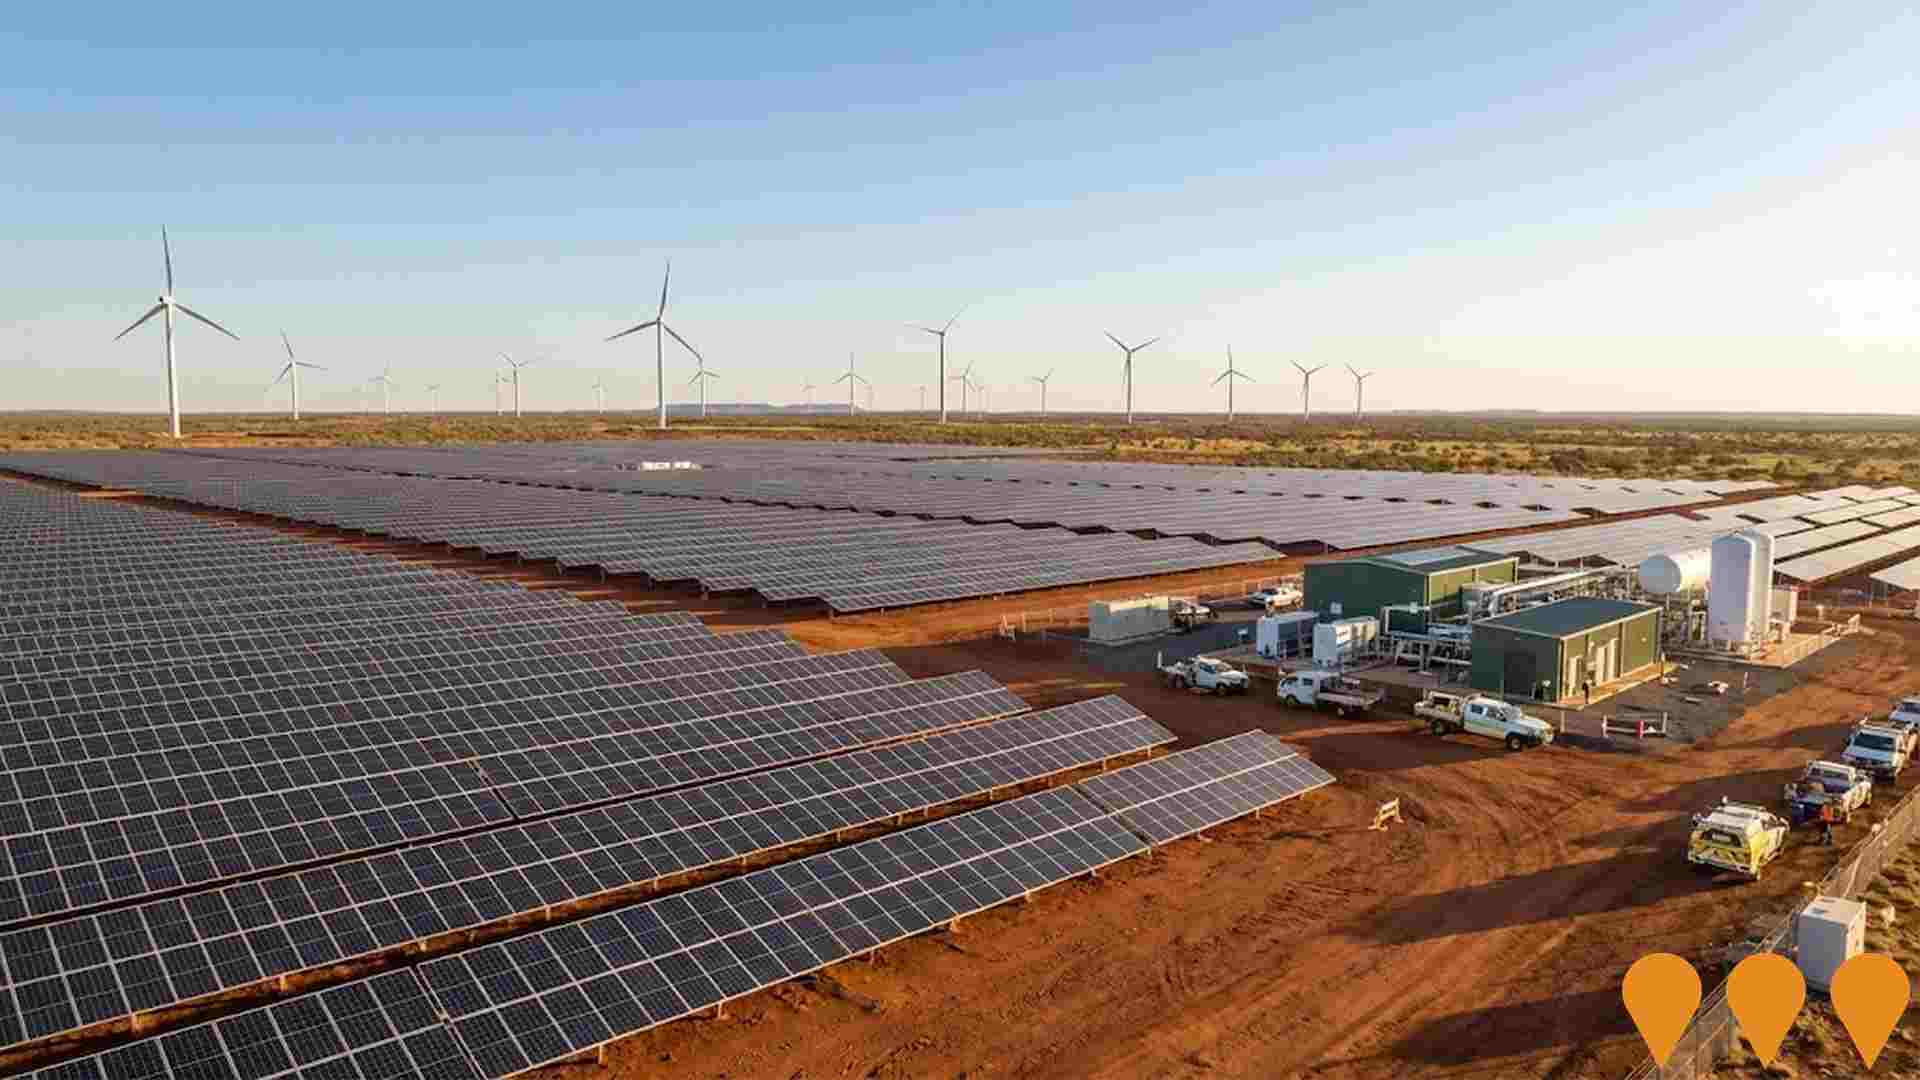
Australian Renewable Energy Hub (AREH)
The Australian Renewable Energy Hub (AREH) is a giga-scale renewable energy project in the East Pilbara region. Spanning over 6,500 km2, it intends to deliver 26 GW of combined sol
View East Pilbara
 NT
NT
Middle Arm Sustainable Development Precinct
A 1,500-hectare industrial hub designed for low-carbon industries including green hydrogen, carbon capture and storage (CCS), and critical minerals processing. The precinct serves
View Migratory - Offshore - Shipping (NT)
 SA
SA
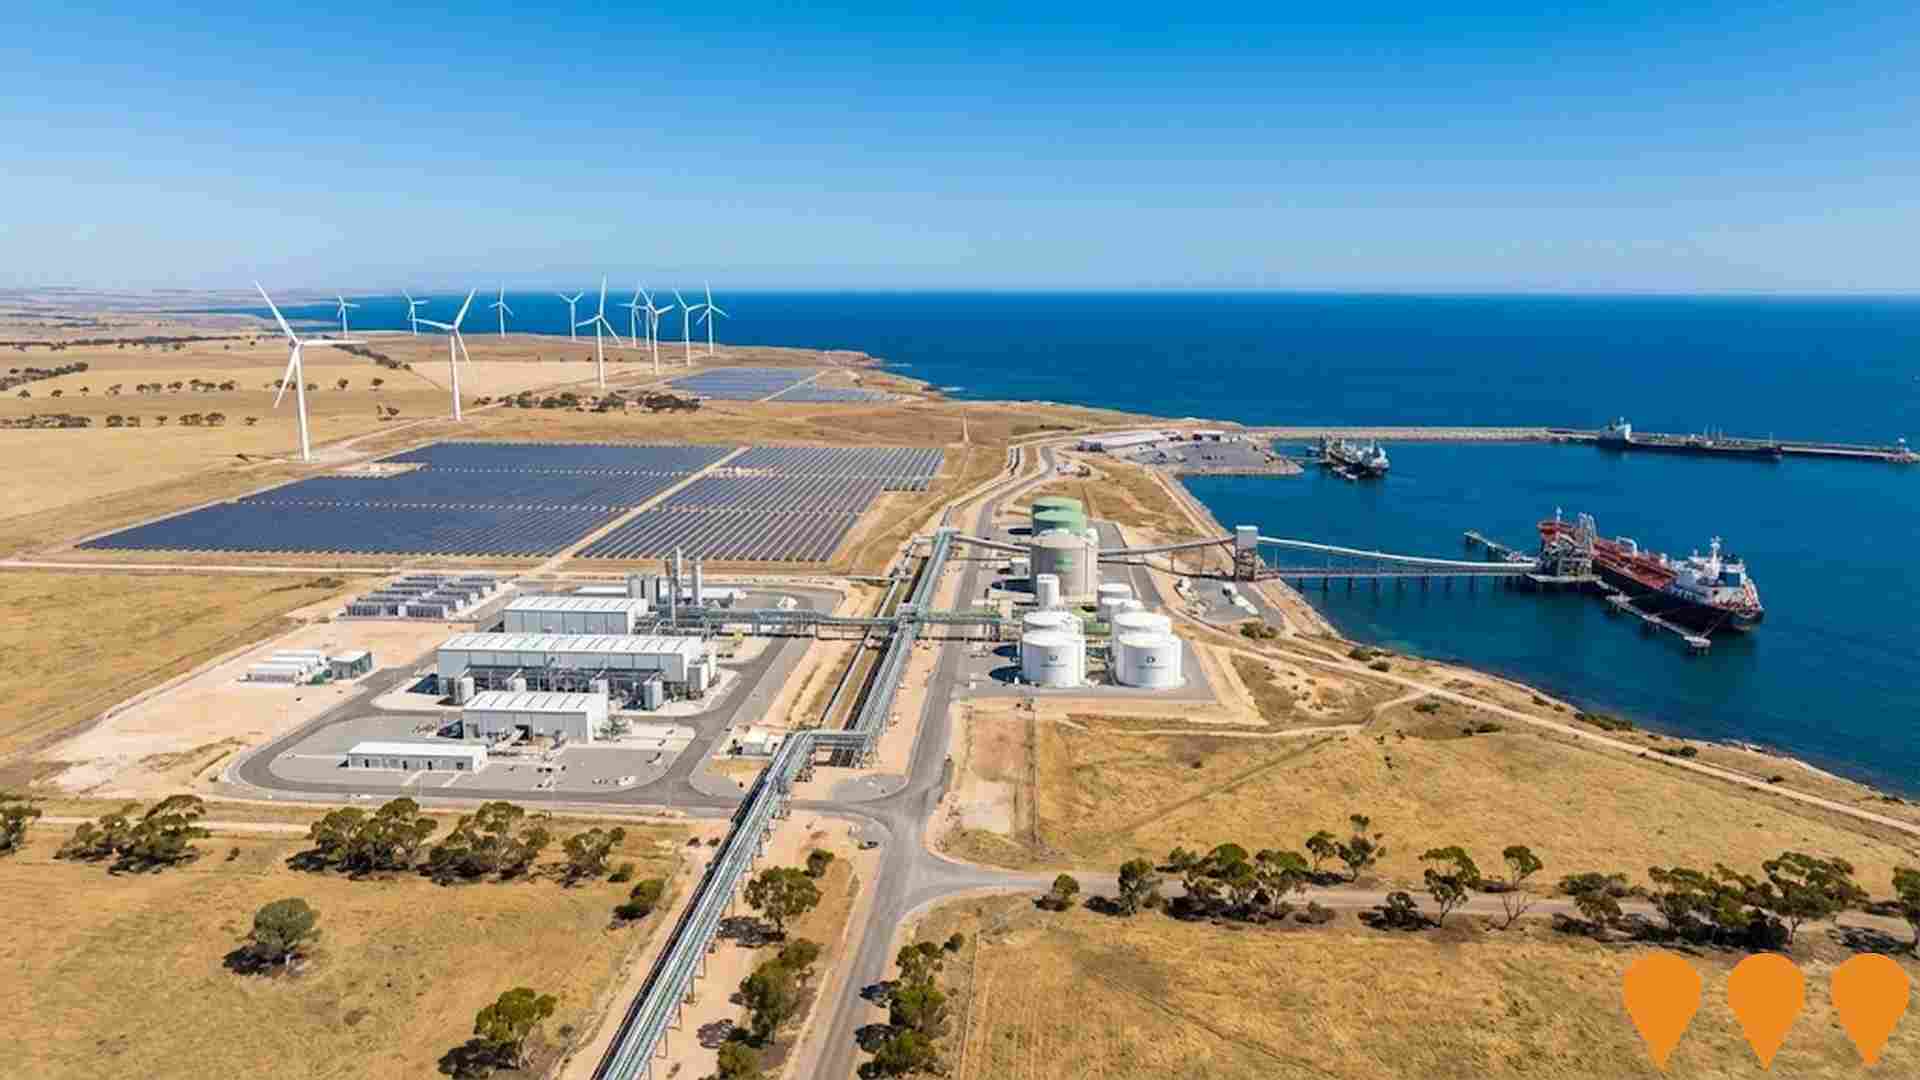
Cape Hardy Advanced Fuels Precinct
The Cape Hardy Advanced Fuels Precinct is a large-scale green hydrogen and ammonia production hub. The project aims to develop up to 10 GW of electrolyser capacity to produce over
View Eyre Peninsula
 ACT
ACT
Molonglo Town Centre
Molonglo Town Centre is Canberra's sixth town centre, designed as a 97-hectare precinct to serve as the commercial and community heart of the Molonglo Valley. As of early 2026, the
View Arboretum
 VIC
VIC
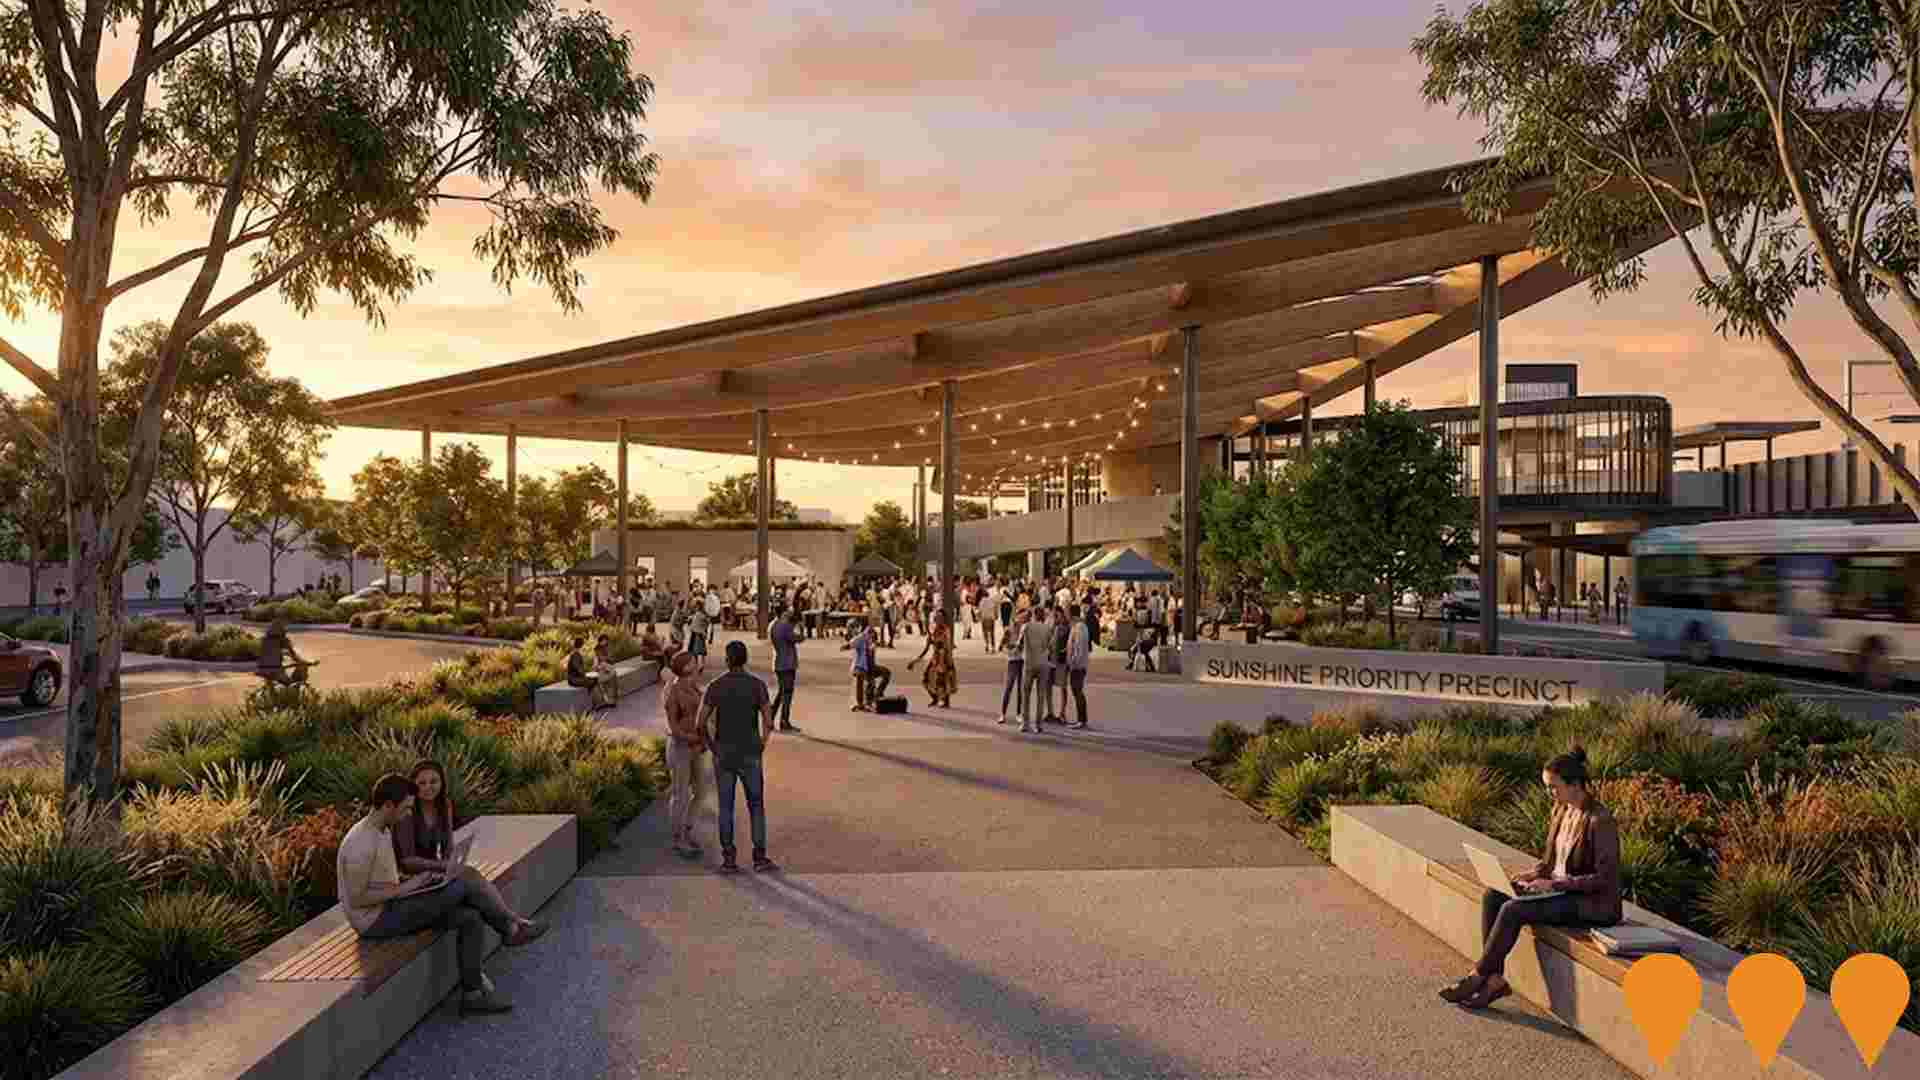
Sunshine Priority Precinct Vision 2050
The Sunshine Priority Precinct Vision 2050 is a 30-year urban renewal strategy to establish Sunshine as the capital of Melbourne's west. It leverages over $20 billion in broader in
View Sunshine
 QLD
QLD
Woree Social and Affordable Housing Precinct
Queensland's largest social and affordable housing precinct, delivering 490 modern, energy-efficient apartments specifically for seniors over 55 and people living with disability.
View Woree
 VIC
VIC
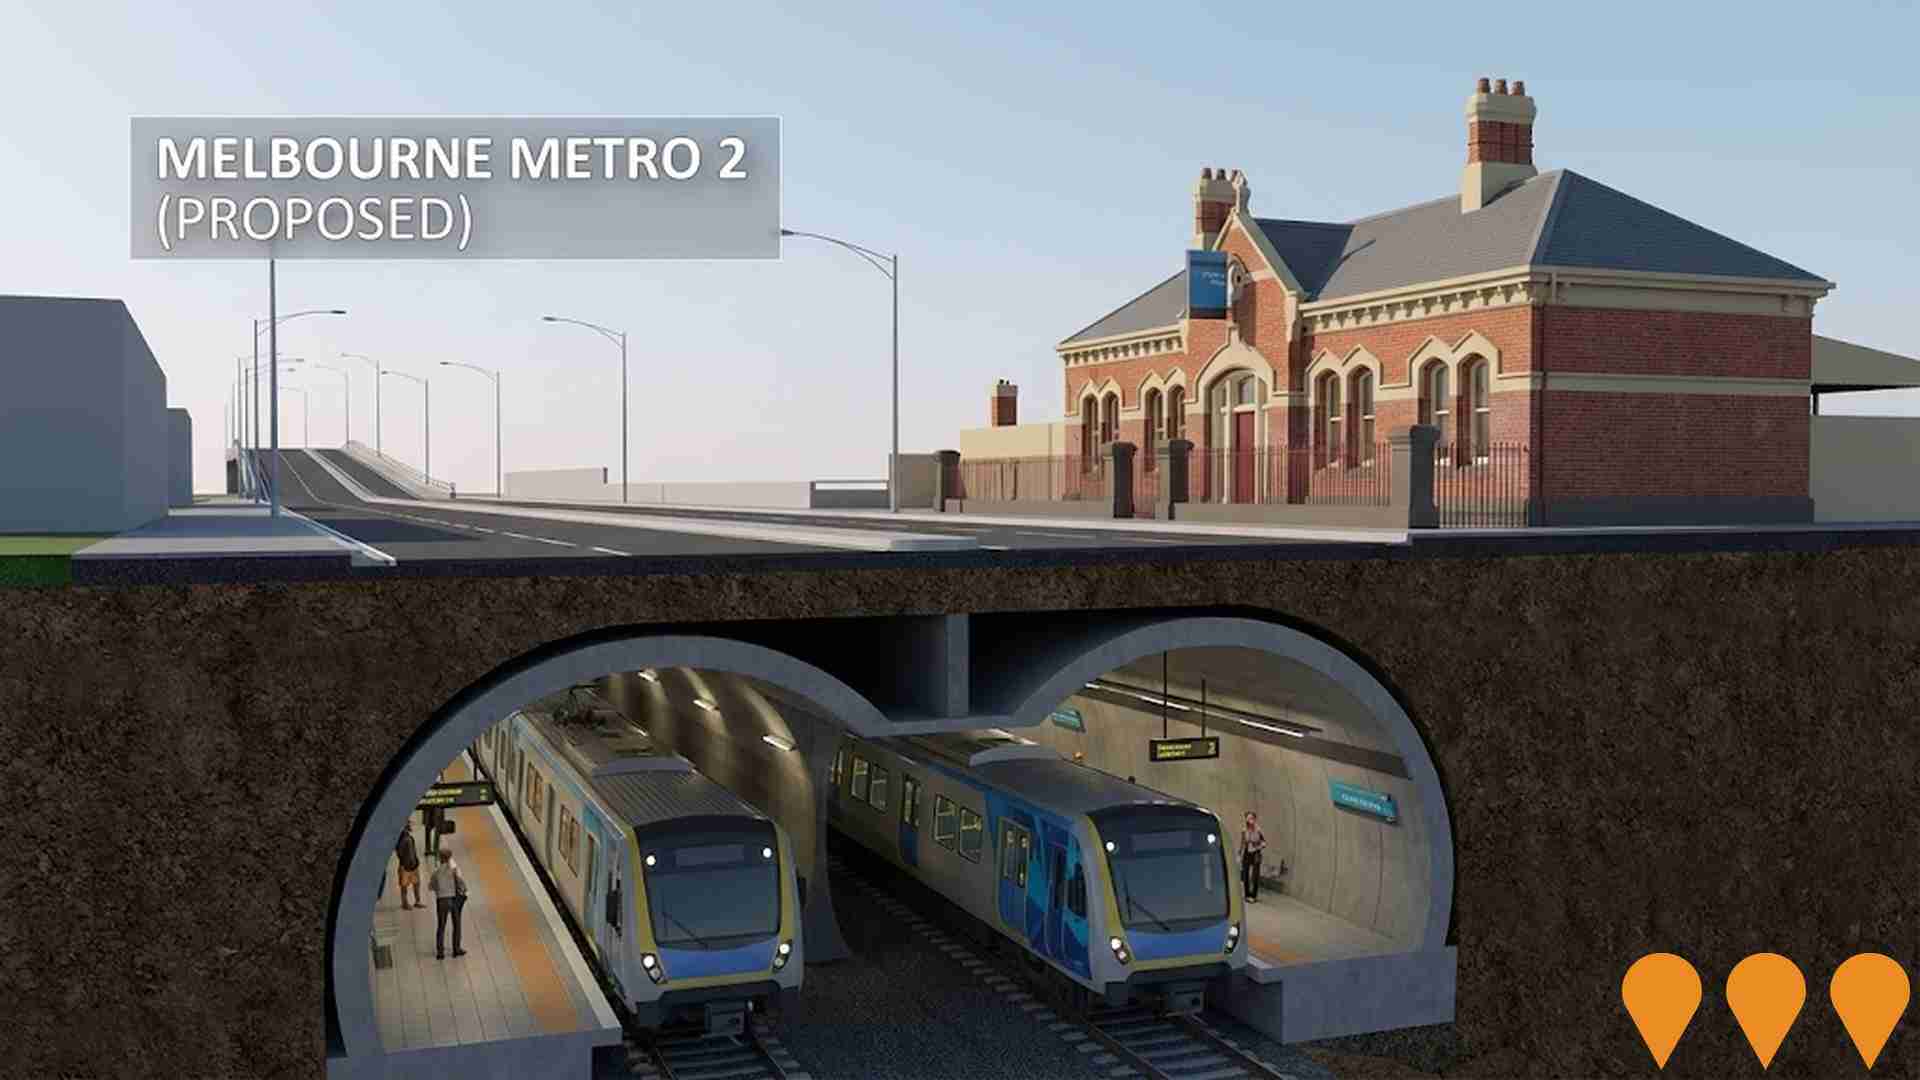
Melbourne Metro 2
Melbourne Metro 2 is a proposed cross-city rail tunnel connecting Newport to Clifton Hill, with services from Werribee and Geelong running through Fishermans Bend, Southern Cross,
View Port Melbourne Industrial
 VIC
VIC
Glen Waverley SRL Precinct Development
The Suburban Rail Loop (SRL) East project in Glen Waverley involves the delivery of a new underground station and a comprehensive structure plan for the surrounding precinct. Major
View Glen Waverley - West
GDP & Economic Output
Economic growth remains positive but subdued as per capita output lags aggregate expansion.
Australian GDP totalled $695.9bn in the March 2026 quarter, with annual output reaching $2.76t. Headline year-on-year growth of 2.5% remains positive but subdued. Per capita GDP grew just 1.0%, meaning population growth is driving the majority of aggregate economic expansion. Sector performance is divergent, with Financial Services leading while Agriculture drags.
Australian GDP totalled $695.9bn in the March Quarter of 2026, reaching a combined $2.76t over the rolling year. Year-on-year, the national economy expanded by 2.5% compared to the same quarter last year. This headline growth indicates that economic momentum remains positive but subdued, reflecting a broader slowdown in activity. The current trajectory points to moderating growth, supported largely by aggregate demand rather than productivity, highlighting structural sluggishness.
The headline expansion masks a softer reality for individual prosperity, with GDP per capita sitting at $25,101 for the quarter. While headline GDP grew 2.5%, per capita GDP grew just 1.0%, as estimated population growth of 1.5% diluted the overall gains per person. This ongoing divergence reflects a 'per capita recession' environment, illustrating that population inflows, rather than genuine improvements in individual wealth, are the primary drivers of the nation's economic expansion.
Underlying industry performance reveals a highly uneven economic landscape. Financial Services output grew 4.9%, well above its 10-year average of 2.5%, while Manufacturing expanded 3.2% against a typical historical growth rate of just 0.4%. In contrast, Agriculture contracted 0.7%, significantly underperforming its 10-year average of 4.0%, and Health sector growth slowed to 2.2%, trailing its typical 5.1% expansion rate.
Scroll to load chart
Recent Posts
Population & Migration
Australia's population hits 27.7 million as migration levels moderate.
Australia's population reached 27.72 million in September 2025, an annual increase of 423,600 persons (1.6%). This growth rate is slightly above the 10-year average of 1.5% but reflects a moderation from the 1.8% recorded a year prior. Net overseas migration remains the primary driver at 311,000 persons, though natural increase has emerged as a relative standout performer.
Australia's population reached 27.7 million as at September 2025, an increase of 423,600 persons (1.6%) over the year. This 1.6% growth is above the 10-year average of 1.5%, though it marks a slowing trajectory from the 1.8% growth rate seen twelve months ago. Growth is normalising from the post-COVID surge as migration intake stabilizes. The data suggests that while population expansion remains robust, it has peaked and is now returning toward historical norms as policy tightening in certain visa categories takes effect.
Total growth is comprised of 311,000 persons from net overseas migration and 114,600 persons from natural increase (births minus deaths), while net interstate migration for the nation is zero. While overseas migration remains significantly elevated relative to its historical baseline, it has declined 14.9% over the year. Natural increase is the standout component; its 8.9% growth rate sits 11.4 percentage points above its 10-year average of -2.5%. This indicates that domestic natural increase is providing a robust floor to national growth even as migration levels temper.
Western Australia leads the states with 2.2% population growth, followed by Victoria and Queensland at 1.7% each, while Tasmania (+0.3%) and South Australia (+1.1%) lag. Interstate migration patterns continue to favour Queensland and South Australia as net gainers, with New South Wales and Victoria recording net losses to other states. This internal redistribution is exacerbating the housing shortage and adding to service-sector inflation in high-growth regions, a trend the RBA is watching closely as it balances demand-side pressures against national infrastructure capacity.
Scroll to load chart
Recent Posts
Development Activity
Approvals and commencements rebound strongly, but falling completions highlight a severe delivery bottleneck.
Australia's housing pipeline shows a severe bottleneck, with dwelling approvals recovering 9.9% to reach 201,200 in the year to Apr-26. While dwelling commencements surged 16.1% to 196,000 (Dec-25), dwelling completions contracted 2.7% to 172,200, exposing major industry capacity constraints. The ACT and Queensland led the approvals recovery, but delivery delays remain the critical hurdle.
201,200 dwellings were approved in Australia in the year to Apr-26. On a per capita basis, this equates to 7.0 approvals per 1,000 persons, which remains 6.1% below the 10-year average of 8.0. Despite tracking below historical per capita levels, the total pipeline has troughed and is now actively recovering, with annual approvals recording strong 9.9% year-on-year growth. This marks a significant outperformance against the 10-year average trajectory of a 1.2% decline, signalling early momentum in the housing supply pipeline.
Evaluating the three stages of the pipeline reveals a stark disconnect. While approvals reached 201,200 (up 9.9%) and commencements followed strongly at 196,000 in the year to Dec-25 (up 16.1% vs a 10-year average of -0.5%), completions dragged at just 172,200 (down 2.7%). This indicates a severe conversion bottleneck where builders are struggling to finalize construction. The front-end pipeline recovery was overwhelmingly driven by attached dwellings, which surged 17.5% year-on-year, easily outstripping house approval growth of 4.9%.
Across the states, the ACT (+93.5%) and Queensland (+19.4%) drove the national acceleration in approvals growth, while Victoria's pipeline continued to contract (-1.5%). Beyond residential housing, the commercial development sector showed divergent performance. Retail building development values proved resilient with 9.9% growth, easily exceeding its 3.8% historical average. Conversely, industrial building growth slowed to 8.3%, and office development values contracted sharply by 5.4%, reflecting shifting investor preferences.
Scroll to load chart
Recent Posts
Housing Market
Regional house prices surge 11.2% as national capital values reach $1.09 million
The national median house price reached $1,090,000 in December 2025, up 8.4% annually. Regional markets outperformed with 11.2% growth, well above the 6.9% decade average. While capital city attached affordability improved to 6.69x income, regional house multiples are straining at 6.64x. Northern Territory and Queensland lead growth, while Victoria and New South Wales see significant moderation.
The median house price across Australian capital cities reached $1,090,000 in December 2025, up 8.4% over the year. This growth remains elevated compared to historical norms, such as the 3.1% decade average seen in the attached sector, though momentum is becoming increasingly fragmented. Regional house prices reached $735,000, up 11.2% annually, significantly outpacing the 10-year average growth of 6.9%. While headline values remain at record highs, the trajectory suggests a shift toward regional hubs as the premium capital city bull run begins to moderate from previous peaks.
Regional houses are currently priced at 6.64x annual household income, which is 6.6% above the 10-year average of 6.23x, placing them in the seriously unaffordable category. Conversely, capital city attached dwellings at 6.69x income offer improved affordability compared to their long-term average of 7.63x, a 12.3% improvement. Regional attached dwellings at 6.18x income also remain 8.9% above their 5.67x historical average. These figures highlight significant strain on regional household budgets, even as urban apartments show relative value compared to historical long-term norms.
Sales volumes for capital city attached dwellings fell 0.2% over the year, trailing the 2.5% decade average. Price growth is strongest in the Northern Territory (+27.0%), Queensland (+17.6%), and Western Australia (+16.0%), while Victoria (+2.9%) and the ACT (+4.2%) are the slowest growing markets. Affordability is most strained in New South Wales, where capital city houses average $1.51 million. The national market is increasingly two-speed; high demand drives double-digit growth in secondary capitals, while the largest markets face headwinds from high entry costs and buyer fatigue.
Scroll to load chart
Recent Posts
Housing Finance
Investor activity surges as national housing finance reaches $112.4bn
Housing finance commitments totalled $112.4bn in March 2026, rising 8.7% YoY. This growth is 5.3pp above the 10-year average, propelled by a 25.0% surge in investor lending. While owner-occupier growth is more modest at 2.3%, the market is recovering strongly from previous lows. The ACT leads national growth (+14.6%), while the NT faces a -6.8% decline in total commitments.
Housing finance commitments totalled $112.4bn in March 2026, up 8.7% compared to a year ago. Lending volumes are 5.3% above the 10-year average growth rate of 3.4%, indicating a robust recovery in credit demand. Housing finance has recovered from cyclical lows seen in 2024, supported by high levels of refinancing activity as households navigate the tail end of the 'mortgage cliff'. Despite elevated interest rates, the total lending trajectory remains upward, although the pace of expansion varies significantly between different loan segments.
Owner-occupier lending reached $75.8bn (67.4% of total), while investor lending rose to $36.7bn (32.7% of total). Growth rates diverged sharply; owner-occupier lending grew 2.3% while investor lending surged 25.0%, significantly exceeding its 10-year average of 12.6%. Investors now account for 32.7% of new lending, above historical averages. This indicates that investment yields and capital growth expectations are currently the primary drivers of credit expansion as owner-occupiers face continued affordability constraints and high debt-to-income hurdles.
Lending growth shows strong geographic divergence, with ACT (+14.6%), TAS (+11.6%), and NSW (+11.5%) recording the fastest total growth. In contrast, WA (+2.8%) and NT (-6.8%) recorded the weakest performances. Owner-occupier demand was strongest in ACT (+13.7%) but contracted in NT (-11.3%) and WA (-5.7%). This variance reflects local housing price trends and the impact of interest rates on borrowing capacity. High investor participation in the eastern states continues to underpin credit growth despite broader economic headwinds and monitoring of arrears.
Scroll to load chart
Recent Posts
Monetary & Financial Conditions
Restrictive cash rate maintains high borrowing costs amid robust bond yields.
The RBA cash rate stands at 4.35% as at May-26, maintaining a highly restrictive monetary policy stance. Borrowing costs remain substantially elevated, with variable mortgage rates at 6.55% and 3-year fixed rates rising 13.3% year-on-year. Bond yields are significantly outpacing historical norms, though a positive yield curve signals underlying market confidence. The trajectory remains on hold, even as easing themes emerge.
The RBA cash rate stands at 4.35% as at May-26. This is significantly above the historical 10-year average. The cash rate has been on hold for 30 months following 425 basis points of hikes. This accounts for a cumulative 425bp of tightening since May 2022. The extended pause signals a continued hawkish bias from the central bank, as inflation takes longer than expected to return to the target range. However, market sentiment suggests the path to monetary easing is slowly opening for late 2026.
Policy transmission to borrowers remains robust. The owner-occupier variable housing rate is 6.55% as at Apr-26, reflecting a 2.20% spread over the cash rate. The 3-year fixed owner-occupier rate sits higher at 6.73%. Small business loan rates have reached 8.75%, far exceeding their 6.86% long-term norm. Mortgage holders face rates significantly higher than the 10-year average, with variable rates running 145bp above their historical baseline of 5.10%, enforcing tighter household financial conditions.
Bond market signals reflect a restrictive but stable outlook. The 2-year government bond yield sits at 4.66%, while the 10-year bond yield has reached 4.97%. The resulting 31bp positive yield curve suggests markets expect underlying economic growth to continue despite tight monetary conditions. Both short and long-term yields remain sharply above their 10-year averages of 2.17% and 2.84% respectively, indicating a structurally higher rate environment even as long-term easing prospects begin to crystallize.
Scroll to load chart
Recent Posts
FX Rates & Commodities
Australian dollar remains elevated despite moderating mining commodity growth.
The Australian dollar averaged US$0.7200 in May 2026, sitting 9.1% above its 10-year average. Annual growth of 12.5% was supported by a 16.2% surge in rural commodity prices, although mining commodity growth moderated to 4.7%. The AUD/JPY cross is the primary standout, trading 15.7% above historical norms. While levels remain high, the currency's trajectory shows signs of peaking.
The Australian dollar is trading at US$0.7132 as at 4 June 2026. The trade-weighted index stands at 66.60. The AUD is 9.1% above its 10-year average of US$0.6600, while the TWI is 8.1% above its 10-year average of 61.61. The currency rose 12.5% over the year to May 2026 against the USD and 11.7% on a trade-weighted basis. While the AUD remains elevated relative to historical norms, recent spot rates suggest a slight softening from the May peaks as global sentiment shifts.
Performance across major crosses remains robust, with the AUD/JPY reaching 114.14, a significant 15.7% above its 10-year average of 98.63. The currency has also strengthened against the Euro, trading at 0.6200 in May 2026, up 8.8% over the year. Weekly spot rates as at 4 June 2026 show the AUD trading at 0.5307 against the British Pound and 4.8279 against the Chinese Yuan. The sustained strength against the Yen and Euro highlights a broader trend of AUD resilience in key export markets outside of North America.
The Commodity Price Index grew 6.1% over the year to May 2026, below the 10-year average growth of 8.9%. This was driven by a divergence between sectors; rural commodities surged 16.2%, well above the 6.1% average, while mining commodity growth moderated to 4.7% (vs 9.3% average). High rural prices and strong gold spot values ($6,275/oz) continue to support the terms of trade. However, the decelerating growth in mining prices suggests that commodity-driven support for the AUD may be shifting toward rural exports.
Scroll to load chart
Recent Posts
Employment
Labour market softens as unemployment edges to 4.3% despite resilient full-time job growth.
Australia's unemployment rate rose to 4.3% in March 2026, now exceeding the 10-year average of 4.0%. While annual employment growth of 1.8% remains resilient, a 7.0% surge in unemployed persons marks a significant shift in trajectory. South Australia leads state growth at 2.6%, while Victoria’s 4.8% unemployment rate highlights emerging regional weakness as the national market moderates.
The unemployment rate in Australia stands at 4.3% as at March 2026. This is above the 10-year average of 4.0%, marking a transition away from the historic lows seen in recent years. The rate has risen from a trough in early 2025, up 0.3 percentage points as the labour market begins to soften in response to broader economic cooling. While still low by long-term standards, the upward trajectory indicates that the period of extreme tightness has concluded, with the market now shifting towards a more balanced, albeit softening, state.
Total employment reached 14.8 million persons, up 1.8% over the year. This growth is supported by full-time positions, which rose 1.9% to 10.2 million, indicating a relatively high quality of job creation. However, the 7.0% increase in the number of unemployed persons is significantly above the 10-year average growth of -0.1%, suggesting that while businesses are largely retaining existing staff through labor hoarding, new entrants are finding fewer opportunities. Full-time roles accounted for the majority of gains, reflecting a preference for permanent staff.
State-level data reveals a growing divergence between jurisdictions. Queensland maintains the lowest unemployment rate at 3.7%, whereas Victoria recorded the highest rate at 4.8%. Employment growth is strongest in South Australia (+2.6%) and Queensland (+2.3%), while Tasmania recorded a contraction of 0.6%. These figures highlight a clear split, with the resource-heavy and northern states continuing to absorb labour effectively, while the south-eastern states experience more pronounced softening in their respective job markets.
Scroll to load chart
Recent Posts
Job Advertisements
Job ads plateau above long-term averages as industrial demand leads the market
Australian job advertisements totalled 641,127 in April 2026, remaining 2.5% above the 10-year average despite a 24.8% decline from the April 2023 peak. Annual growth has moderated to just 0.2%, significantly below the 6.1% historical average. While industrial roles show resilience, the broader cooling signals a shift toward a more balanced labour market, with lead times suggesting future employment growth will remain subdued.
Job advertisements in Australia totalled 641,127 in April 2026. This is 2.5% above the 10-year average of 625,521. Job ads remain 2.5% above the 10-year average, despite falling 24.8% from the peak of 852,493 in April 2023. Year-on-year growth has slowed to 0.2% compared to a year ago, a sharp deceleration from historical trends. As a leading indicator, this plateauing of hiring intent suggests that while the labour market remains historically tight, the period of rapid expansion has concluded, signalling more modest employment gains in the months ahead.
Compositional data reveals varied demand across sectors. Professional ads totalled 185,932, remaining 3.3% above its 10-year average, while Sales ads reached 31,731, or 3.1% above historical norms. The clear standout is Industrial and Trades ads, which at 131,299 remain 10.6% above the 10-year average. This persistent strength in industrial demand, which grew 3.3% year-on-year, contrasts with the broader cooling and suggests that skills shortages remain acute in technical and trade-exposed sectors even as professional services demand moderates.
State performance highlights a widening divergence in hiring activity. South Australia (+5.4%) and Western Australia (+3.7%) recorded the fastest annual growth, with Western Australia benefiting from sustained resource-sector demand. Conversely, Victoria (-1.3%), the Northern Territory (-3.5%), and the ACT (-11.4%) saw declines in job volumes, with the sharp contraction in the ACT reflecting broader public sector caution. These trends suggest that while the national market is cooling, resource-exposed and smaller states are leading the current cycle, providing a buffer to national employment levels.
Scroll to load chart
Recent Posts
Wages & Earnings
Real wage gains return as growth remains above long-term averages
Wages grew 3.2% annually to March 2026, with the Wage Price Index of 160.3 sitting 15.3% above its 10-year average level. Full-time earnings reached $2,129 per week (+4.0% YoY), delivering a 1.1% gain in real purchasing power as inflation cooled to 2.1%. ACT and WA led growth rankings, while NSW saw the fastest earnings increase at 4.7%.
Wages grew 3.2% over the year to March 2026, as measured by the Wage Price Index (WPI). This is above the 10-year average wage growth of 2.6%, though the pace has moderated from the 4.1% recorded a year ago. The current index level of 160.3 is significantly elevated, standing 15.3% above the long-term average level of 139.1. While the labor market remains resilient, the moderation in growth suggests that wage pressures have likely peaked, transitioning from a period of rapid acceleration to a more sustainable, albeit still robust, trajectory.
Average weekly full-time earnings reached $2,129 per week in November 2025, annualising to $109,517 for full-time workers. With headline inflation at 2.1%, real wage growth was positive at 1.1% over the year. This represents a gain in purchasing power of 1.1% for workers, outperforming the 10-year average real wage growth of 0.2%. This marks a critical turning point as pay increases finally outpace the cost of living after several years of real income erosion, providing households with genuine income growth as price pressures subside faster than nominal pay increases.
State comparisons show the ACT (+3.7%) and Western Australia (+3.6%) leading WPI growth, while the Northern Territory (+2.3%) and South Australia (+3.1%) saw more modest gains. Western Australia maintains the highest earnings level at $2,304 per week, though its 2.6% earnings growth was the slowest nationally. In contrast, NSW recorded the fastest earnings growth at 4.7%, pushing its weekly pay higher relative to the national average. Tasmania remains the lowest-earning state at $1,890 per week, though its WPI level of 164.1 is currently the highest in the federation.
Scroll to load chart
Recent Posts
Household Consumption
Household consumption reached $382.9bn as essential spending pressures forced cutbacks in discretionary categories.
Household consumption reached $382.9bn in Mar-26, up 5.6% over the year. Per capita spending hit $13,809, rising 4.0% annually to sit well above historical averages. Essential spending heavily outpaced discretionary, highlighted by a 12.0% surge in power costs. Queensland and WA led total growth, though consumer momentum is broadly moderating under persistent cost of living pressures.
Household consumption expenditure totalled $382.9bn in Mar-26, up 5.6% over the year. Per capita consumption reached $13,809, recording a 4.0% annual increase and tracking sharply above its 10-year average of $11,435. This comprehensive quarterly National Accounts data underscores continued spending momentum at a headline level, though underlying per capita metrics suggest households are navigating significant financial headwinds.
Spending patterns reveal a stark divide between essential needs and discretionary pullbacks. Power consumption surged by 12.0% annually, heavily outpacing its 4.4% 10-year average, while food spending grew 4.2% to $36.1bn. Conversely, transport growth lagged at just 4.8%, trailing its 19.4% historical average by a steep 14.6 percentage points. This dynamic confirms households are prioritising non-negotiable expenses like rent and health, forcing a real pullback in discretionary areas such as recreation, clothing, and dining out.
Nationally, consumption growth displayed notable divergence. Queensland and Western Australia led the country with total expenditure accelerating by 3.1% year-on-year, while Tasmania recorded the slowest momentum at 1.8%, closely followed by New South Wales and Victoria at 2.2%. On a per capita basis, Tasmania recorded the strongest annual growth at 1.5%, contrasting with softer individual spending growth in Victoria at just 0.4% and Western Australia at 0.9%, highlighting the varied impacts of localized economic conditions.
Scroll to load chart
Recent Posts
Household Spending
Discretionary spending retreats as households pivot to essentials and healthcare
Australian household spending reached $232.0bn in Sep-25, a 5.1% YoY increase. While total expenditure remains historically high—with per capita annual spending at $33,358—growth is moderating. Essential categories like Health (+8.1%) are outperforming, whereas discretionary areas like Alcohol (-18.0%) are in sharp decline. WA and NT lead growth (+7.1%), while NSW (+3.8%) lags.
Household spending in Australia totalled $232.0bn in September 2025, up 5.1% compared to a year ago. While nominal spending remains elevated, this growth rate is moderating compared to recent peaks. On a per capita basis, Australians are spending $8,368 monthly, equating to $33,358 per person annually. This per capita level sits 20.9% above the long-term average of $27,600, reflecting the sustained impact of price inflation on total transaction values despite a noticeable cooling in consumption volume across most discretionary categories.
The spending breakdown highlights a growing divide between essential and discretionary items. Essential categories like Health (+8.1%) and Miscellaneous (+8.7%) are growing significantly faster than their respective 10-year averages of 6.1% and 5.3%. Conversely, signs of consumer stress are evident in discretionary pullbacks; Alcohol spending fell a staggering 18.0% against a typical 0.2% growth average, while Hotels and Restaurants (+6.1%) and Clothing (+3.3%) both lagged their historical averages of 8.2% and 5.4%, indicating a sharp reshuffle in the family budget.
State comparisons reveal a two-speed consumption landscape. Western Australia and the Northern Territory lead the nation with 7.1% annual growth, significantly outperforming the national average. In contrast, slower growth is observed in New South Wales (+3.8%), Victoria (+3.4%), and the ACT (+3.4%), where higher debt servicing costs and cost-of-living pressures are most acute. This regional divergence suggests that while resource-linked economies remain resilient, households in major metropolitan centers are increasingly prioritizing essentials over discretionary lifestyle spending.
Scroll to load chart
Recent Posts
Inflation & Cost of Living
Inflation cools to 4.2% as fuel excise cuts provide temporary cost-of-living relief.
Australian inflation moderated to 4.2% in April 2026, down from 4.6% in March, primarily driven by easing transport costs. While headline figures are cooling, underlying pressures remain as the monthly pace of 0.4% annualises to 4.8%, well above the RBA's target. Tasmania leads the nation with 5.0% growth, while Victoria and WA recorded the slowest pace at 3.9%.
Inflation in Australia was 4.2% in the year to April 2026, remaining above the 10-year average of 2.9% and the RBA's 2-3% target band. The annual rate fell from 4.6% in March, though the April month alone added 0.4% to prices. If this pace continued for a year, inflation would run at 4.8%, suggesting underlying pressures remain inconsistent with the RBA's target. While headline inflation has fallen from a peak of 7.8% in December 2022, recent monthly momentum indicates a slow normalisation towards the target band as broad-based price pressures persist.
Category analysis identifies housing and transport as primary drivers. Housing costs rose 6.3%, driven by a 22.5% spike in electricity as rebates ended, while transport costs rose 6.6% despite a fall in fuel prices. These sectors remain well above their 10-year averages. Conversely, some relief was found in food prices, which rose 2.8%, and discretionary areas like furnishings (+1.2%) and communications (+1.5%). These categories are running significantly below historical averages, partially offsetting the impact of elevated essential services and insurance costs.
State-level data shows Tasmania experiencing the fastest price growth at 5.0%, with Queensland and South Australia following at 4.6%. In contrast, Victoria and Western Australia recorded the slowest pace at 3.9%. This regional divergence underscores varying pressures in the rental and services markets. Critically, with national wage growth at 3.3% in the year to March 2026, Australian workers experienced negative real wage growth of 0.9%. This loss in purchasing power continues to weigh on household budgets as the cost of living outpaces earnings.
Scroll to load chart
Recent Posts
Equities & Superannuation
Australian equities deliver 3.5% capital growth as market capitalisation reaches $3.28 trillion.
As at May 2026, the ASX 200 closed at 8,731 points, reflecting a 3.5% year-on-year capital growth. Total market capitalisation expanded by 5.5% to reach $3.28 trillion, though this growth rate tracks 2.0 percentage points below the 10-year average. The superannuation performance index stood out significantly, tracking 39.8% above its historical average to highlight the ongoing resilience of Australia's retirement savings pool.
The ASX 200 closed at 8,731 points as at May 2026. The All Ordinaries reached 8,965 points, recording up 3.5% capital growth over the year. This compares to average annual capital growth of 5.5%. Total market capitalisation of $3.28 trillion was recorded, representing a 5.5% annual increase but trailing the 10-year average of 7.5%. The market is showing a stabilising trajectory into early June, finding support near highs. Importantly, these are price indices measuring capital growth only and do not include dividend distributions.
The superannuation performance index recorded $375.4 billion, reflecting substantial momentum across the sector. This is up 39.8% over the year compared to its long-term historical average of $268.6 billion. This exceptional growth rate demonstrates the resilience and sheer scale of Australia's retirement savings pool. Superannuation funds remain on track for another solid year, with performance supported by structural contribution inflows and vital diversification into global assets.
Market performance continues to navigate global banking sector risks and evolving technology trends. Domestically, the materials sector has acted as a persistent drag on broader index momentum, though this has been effectively offset by vital support from the banking and healthcare sectors. The outlook for Australian equities relies heavily on ongoing sector rotation, as domestic capital growth normalises slightly below its decade-long historical averages.
Scroll to load chart
Recent Posts