On this page
General information only — not financial, investment, legal, or tax advice. Verify all data independently and seek professional advice before making investment decisions. Full disclaimer.
A High Physical Support apartment built in the wrong catchment can look outstanding on paper and still sit empty for years because the participants who need that design category are not in the area. Specialist Disability Accommodation returns hinge on matching the build to documented local demand before committing capital, not on the headline payment.
Specialist Disability Accommodation (SDA) is purpose-built housing under the National Disability Insurance Scheme for participants with extreme functional impairment or very high support needs. It is a small, specialised slice of the housing system for NDIS participants — the private residential market, social, and family housing provide for the vast majority of needs. Funding is per-participant, paid through the participant's NDIS plan, and every dwelling is enrolled by design category and building type.
Unlike aged care or retirement living, SDA demand is not governed by an age threshold. It is plan-driven, following NDIS participants with SDA funding or assessed SDA need, while population and demographic trends help indicate where future demand may emerge. The design categories, pricing framework, and supply benchmarks therefore need to be read differently from other age-led social-infrastructure asset classes (child care, aged care and retirement living, hospital, medical, pharmacy).
Why one metric is never enough: Total NDIS participant density is only a starting measure. A catchment can show a high number of participants and still be the wrong place for a new High Physical Support build if local SDA demand is concentrated in other design categories and/or enrolled HPS capacity is already high. Assess participant counts relative to total population and SDA dwellings. Check capacity by design category, vacancies, and whether the local participant base is forecast to grow. Worked example →
Nationally, Australia has {NDIS_PARTICIPANTS_NATIONAL} NDIS participants at {NDIS_DENSITY_NATIONAL} per 10,000 population, served by {SDA_CAPACITY_NATIONAL} SDA spaces across {SDA_DWELLINGS_NATIONAL} enrolled SDA dwellings. High Physical Support currently accounts for {SDA_PCT_HPS_NATIONAL} of that capacity. The five SA3 regions with the highest NDIS participant density are below — with enrolled capacity set against the number of participants actually assessed as needing SDA.
Top 5 areas by NDIS participants per 10,000 population
- {TOP_NDIS_DENSITY_AREA_1} — {TOP_NDIS_DENSITY_PER10K_1} per 10k, {TOP_NDIS_DENSITY_PARTICIPANTS_1} participants, {TOP_NDIS_DENSITY_SDA_CAPACITY_1} SDA spaces, {TOP_NDIS_DENSITY_GAP_1} space {TOP_NDIS_DENSITY_GAPWORD_1}
- {TOP_NDIS_DENSITY_AREA_2} — {TOP_NDIS_DENSITY_PER10K_2} per 10k, {TOP_NDIS_DENSITY_PARTICIPANTS_2} participants, {TOP_NDIS_DENSITY_SDA_CAPACITY_2} SDA spaces, {TOP_NDIS_DENSITY_GAP_2} space {TOP_NDIS_DENSITY_GAPWORD_2}
- {TOP_NDIS_DENSITY_AREA_3} — {TOP_NDIS_DENSITY_PER10K_3} per 10k, {TOP_NDIS_DENSITY_PARTICIPANTS_3} participants, {TOP_NDIS_DENSITY_SDA_CAPACITY_3} SDA spaces, {TOP_NDIS_DENSITY_GAP_3} space {TOP_NDIS_DENSITY_GAPWORD_3}
- {TOP_NDIS_DENSITY_AREA_4} — {TOP_NDIS_DENSITY_PER10K_4} per 10k, {TOP_NDIS_DENSITY_PARTICIPANTS_4} participants, {TOP_NDIS_DENSITY_SDA_CAPACITY_4} SDA spaces, {TOP_NDIS_DENSITY_GAP_4} space {TOP_NDIS_DENSITY_GAPWORD_4}
- {TOP_NDIS_DENSITY_AREA_5} — {TOP_NDIS_DENSITY_PER10K_5} per 10k, {TOP_NDIS_DENSITY_PARTICIPANTS_5} participants, {TOP_NDIS_DENSITY_SDA_CAPACITY_5} SDA spaces, {TOP_NDIS_DENSITY_GAP_5} space {TOP_NDIS_DENSITY_GAPWORD_5}
High participant density does not mean unmet SDA demand — {TOP_NDIS_DENSITY_SURPLUS_PHRASE} already {TOP_NDIS_DENSITY_SURPLUS_VERB} more enrolled capacity than participants assessed as needing it.
01The opportunity right now
Getting the strategy right in a niche, government-backed asset class
SDA is a small, specialised and fragmented market with {SDA_DWELLINGS_NATIONAL} enrolled SDA dwellings nationally run by {SDA_PROVIDERS_NATIONAL} providers. Across that stock AreaSearch tracks {SDA_CAPACITY_NATIONAL} SDA spaces of enrolled resident capacity against {SDA_NEED_NATIONAL} participants assessed as needing accommodation.
The sector differs from mainstream residential and commercial property because demand, revenue, and regulation are driven by the NDIS rather than by market rent or an age-based entitlement.
- Plan-funded demand. It is not an age-based entitlement; SDA demand arises when an individual participant's NDIS plan includes SDA funding, following an assessment of their disability-related housing and support needs.
- A growing participant base — but a narrow SDA cohort. The NDIS has {NDIS_PARTICIPANTS_NATIONAL} participants, expected by AreaSearch to grow by {NDIS_PARTICIPANT_GROWTH_FORECAST} from {POP_GROWTH_BASE_YEAR} to {FORECAST_YEAR}. SDA is far narrower: it reaches only participants with extreme functional impairment or very high support needs. Nationally {SDA_ELIGIBLE_SHARE} — {SDA_NEED_NATIONAL} people in all, and {SDA_ELIGIBLE_NOT_USING_NATIONAL} of them are still waiting on a home that suits them.
- Not market rent, different review risk. Provider revenue combines an SDA payment made through the participant's NDIS plan under the {NDIS_PRICING_GUIDE_NAME} with a capped rent contribution paid directly by the participant, called the Reasonable Rent Contribution (explained in section 04). SDA payments are indexed annually on 1 July ({SDA_PRICING_ANNUAL_INDEXATION}) and reset at each Pricing Arrangements review. That insulates SDA from the rental cycle but exposes long-hold returns to indexation-methodology and price-guide review risk — a risk conventional property does not carry.
Getting the mix right
On headline supply and demand, participants appear well catered for, yet the category splits tell a different story: nationally, enrolled capacity exceeds assessed need in {SDA_CATEGORIES_SURPLUS}, while {SDA_CATEGORIES_SHORT} are short. High Physical Support alone has {SDA_CAPACITY_VS_NEED_HPS_MULT} the capacity of assessed need.
High Physical Support commands the highest payment per participant, and the market has responded. That is what happens when a build decision follows the payment rather than the cohort. Two developers can look at the same catchment and reach opposite conclusions, because the design category, the local eligible cohort and the existing stock are different for each. Building HPS into a catchment whose need sits elsewhere creates an asset that struggles to fill however attractive the headline payment looks.
National SDA resident capacity by design category
Share of enrolled SDA resident capacity by design category (national). Local mix varies — build to the local cohort, not this average.
What's changing right now
- The SDA Design Standard and the NDIS reform agenda.New SDA enrolments must comply with the {SDA_DESIGN_STANDARD}, which sets the four design categories and a {SDA_LHA_MINIMUM}. Provider registration with the {NDIS_REGULATOR_QUALITY} is mandatory. The Scheme itself is administered by the {NDIS_AGENCY} — a separate body from the quality regulator. For investors, the live tension is scheme sustainability. The participant base is forecast to grow by {NDIS_PARTICIPANT_GROWTH_FORECAST} from {POP_GROWTH_BASE_YEAR} to {FORECAST_YEAR} while the government is pursuing lower growth in total NDIS expenditure, making future pricing and indexation settings material to long-hold SDA returns. The current reform package does, however, exclude SDA from plan-budget reductions.
- Annual pricing indexation. SDA base prices are indexed to CPI each 1 July ({SDA_PRICING_ANNUAL_INDEXATION}); the Reasonable Rent Contribution moves separately, with the Disability Support Pension and Commonwealth Rent Assistance. Each reset changes operator revenue per dwelling — model it, do not assume flat.
- Enrolled stock is growing fast off a small base. Enrolled SDA dwellings have been rising year-on-year ({SDA_DWELLINGS_NATIONAL} now enrolled). New supply concentrated in the wrong category or catchment is the main lease-up risk.
- Tax treatment is changing. SDA payments are {GST_SDA}. {NEGATIVE_GEARING_SDA}
NDIS active participants (000s), financial year end
The NDIS participant base is the demand engine behind SDA — now {NDIS_PARTICIPANTS_NATIONAL} nationally, of which only {SDA_ELIGIBLE_SHARE} hold SDA funding.
02Using AreaSearch for SDA site selection
Two starting points — one tool kit
AreaSearch's disability-housing analysis tools work for two different situations:
Searching for opportunities
- No specific site — scanning nationally for participant-dense, SDA-undersupplied catchments
- Goal: shortlist markets where the participant base and existing SDA supply warrant a closer look
- Use the heatmap to identify participant-dense areas and the broad SDA supply picture
- Use Target Search to turn that scan into a national shortlist
- Use the shortlist to select candidate sites for closer testing
- Run a custom catchment around candidate sites to test the local need-and-capacity position
Evaluating a specific site
- A specific address is under consideration
- Priority: confirm that local participant demand and existing SDA stock justify the build
- Use the area profile for broad demographic and amenity context
- Run a custom catchment around the address for site-level participant, assessed-need, capacity, and vacancy numbers.
- Compare the custom-catchment result against the relevant state and regional benchmarks
- Confirm the site fit — verify the proposed SDA use can work on this site before progressing
For most users, the area profile is the right starting point — free, covers any area in Australia, and gives you demographic context in seconds. For SDA supply analysis, Professional tools are the next step.
The heatmap — broad scan
The homepage heatmap provides a national overview. Use it to identify places where the participant base and existing SDA supply justify further investigation. Assess:
- NDIS participants relative to total resident population.
- Enrolled SDA resident capacity and dwellings.
- Needs vs supply by SDA category.
- Demographic, amenity and local economic layers to sanity-check before shortlisting.
Area and suburb profiles — context only
Open any suburb or SA2 area profile for broad demographic and amenity context.
- Demographic context. Under-65 population and household structure — the SDA participant base skews young, with most diagnoses provided early in life.
- Amenities. Access to hospitals, GPs, transport, and everyday amenity — SDA participants and their support workers need connectivity as much as any resident.
- Next step. Step beyond rigid boundaries with custom catchment analysis for SDA participant, assessed-need, capacity, and category comparison.
Target Search — multi-criteria national shortlist
Target Search is reverse-engineered location analysis. You set thresholds across metrics — participant density, enrolled SDA capacity, forecast growth, population, and the need-and-capacity position for a design category — and the platform returns a ranked list of areas matching all of them, anywhere in Australia. Use it to narrow the broad scan; the category comparison then tells you what the shortlisted market may need. Pro tier.
Custom catchment — the site-level decision tool
Pro tier. Draw a catchment around any address — radius, polygon, or drive-time — to assess the local participant base, assessed need, enrolled SDA capacity, and vacancy position around the proposed site. The map also carries lot-level planning layers — statutory zoning, development controls such as building height and minimum lot size, and heritage items.
The heatmap helps identify where to investigate. The custom catchment helps assess whether a particular site is suitable for the proposed SDA use.
03The signals that matter
How to read participant need, enrolled capacity by design category, and forecast growth
Local supply & demand profile
An SDA feasibility hinges on two questions: are the participants who need this type of dwelling living in this area, and are they already adequately served? Answer them by comparing assessed need, enrolled capacity, and vacancy by design category.
Local SDA capacity by design category
Bars show the local rate against the national rate — a full bar is 1.5× national.
Participants. The headline count is the plan-driven demand base of which its relative density is a strong initial indicator.
Need and capacity. Assessed need is the subset of participants the NDIA has determined require SDA — the most direct indication of which design category may be needed, published for every {SDA_DEMAND_GEOGRAPHY} region in the country and estimated by AreaSearch at custom catchment level. Enrolled capacity by design category is the supply benchmark (SDA locations provided at suburb as opposed to street level for privacy purposes). Read against each other they give a per-category surplus or shortfall.
Vacancy. An SDA dwelling fills by participant-matching — someone with that funded design category has to choose to move in — so lease-up is slower and less controllable than a rental. Not all vacancies are advertised, however, so read as the floor.
National SDA need against enrolled capacity
National totals, summed across {SDA_DEMAND_SA3_COUNT} SA3 regions. Need is participants assessed as requiring SDA; capacity is enrolled SDA resident places. The categories are not interchangeable — a surplus in one does not serve need in another.
National mix is not local mix. The mix of enrolled stock nationally is skewed toward the higher-support categories — but local stock can vary widely from the national average. The calculator derives weighted build cost from a category-mix input, so you can model the actual local mix, not the national one.
The NDIA cannot extract a design category for {SDA_NEED_UNCATEGORISED} participants — {SDA_NEED_UNCATEGORISED_PCT} of assessed need nationally, though the share varies by region. Their need is confirmed and counted in the total; only which category it falls into is unknown, so the four figures above carry uncertainty in both directions rather than being uniformly understated. This warrants careful consideration at the local level.
Forward growth. How fast the local base is expected to expand or contract, based on changes in total population within each participation band. Note: projections based on local projections and participation rates by age. They do not account for future changes in NDIS service eligibility and provision.
Projected NDIS participation
Compare growth against a {NDIS_PARTICIPANT_GROWTH_FORECAST} national forecast. Illustrative catchment.
Property market impact
Revenue does not follow land value. The SDA payment comes off a national schedule, adjusted by an SA4 location factor that resets at a pricing review, and the Reasonable Rent Contribution is pegged to the pension rather than market rent — {SDA_MRRC_FORMULA}. Within one SA4 every site earns the same factor while land prices across it differ several-fold.
So the property market is a constraint on where a site can work, not a line item in the return. Above a certain land price the numbers stop working at any design category, and the enrolled stock reflects it — across the capitals, existing SDA sits overwhelmingly in the cheaper suburbs of its own SA4. Since every site in an SA4 earns the same location factor, land cost is what separates them.
Median weekly rent by suburb
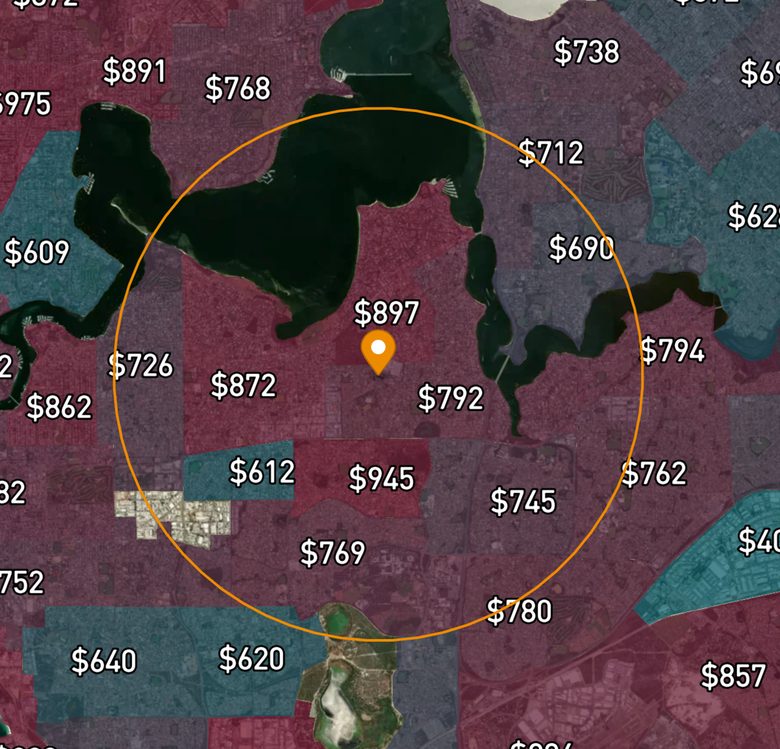
Suburb medians across an illustrative catchment. The spread inside a single ring is wide — and every site in it earns the same SDA location factor.
Residential and land values — the catchment against the SA4 it sits inside
Shading marks where each figure sits against all areas nationally.
04The site fit
What the build earns and what it costs — SDA payments, location factors, rent contribution, build costs, regulation and tax
You have found a catchment with assessed SDA need its enrolled capacity does not cover. Where the signals in section 03 are properties of the catchment, what a dwelling there earns is a property of the dwelling — set by the NDIA rather than the local market, and turning on design category, building type, resident count and the SA4 the site sits in.
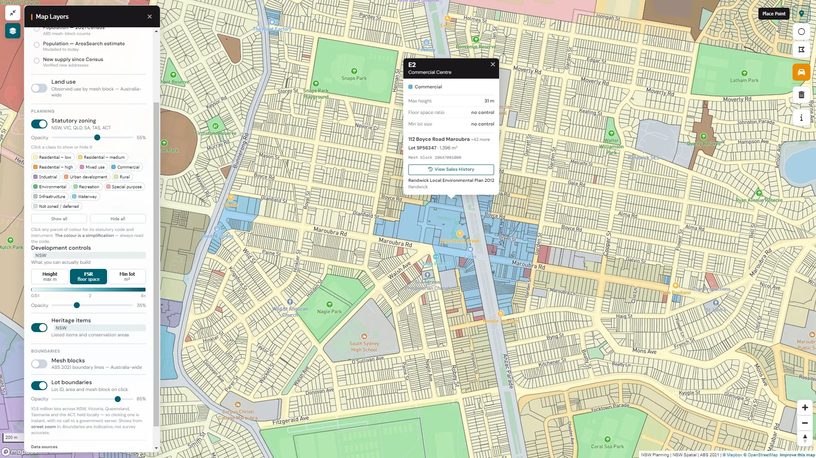
Statutory zoning, development controls and lot boundaries on the map — click any lot for its zoning code and controls.
SDA payments
Price limits depend on design category, building type, new build versus existing stock, the number of residents, and an SA4 location factor. The per-place limit falls as resident count rises, and building type moves price as much as design category does. The chart shows each category across all building types; the table below separates them.
Note: payments reset at each Pricing Arrangements review, so model the reset across a hold when calculating returns rather than a flat payment.
Median SDA payment per resident place per year, by design category
The dot is the typical payment for that category; the line covers most enrolled dwellings, leaving off the cheapest and dearest tenth. Pricing is reported for {SDA_PRICE_COVERAGE}. Basic and Legacy Stock are shown for context only — no new build can enter either.
Median payment per resident place — every design category by building type
Columns run from the highest-paying building type to the lowest. Cells with fewer than {SDA_PRICE_MATRIX_MIN_N} enrolled dwellings are left blank rather than shown as a number. Basic is closed to new builds, and is kept out of the first row so its much lower prices do not distort it. Legacy Stock is excluded — those register rows carry no resident count, so they cannot be put on the same basis.
{SDA_BASIC_CATEGORY_STATUS} — yet it holds {SDA_PCT_BASIC_NATIONAL} of national resident capacity. High Physical Support earns roughly {SDA_PRICE_BASIC_VS_HPS_MULTIPLE} the payment per resident place that Basic does.
The Legacy Stock median is stated on a {SDA_PRICE_BASIS_LEGACY} basis. {SDA_LEGACY_STOCK_DEFINITION}. Legacy SDA payments cease ten years after the property transitioned into the Scheme.
How location changes the payment
The base price is the national rate for a dwelling configuration and design category, published per participant per year before location is applied. The location component is {SDA_LOCATION_FACTOR_METHOD}.
How far it moves depends on building type: {SDA_LOCATION_FACTOR_RANGE}. Land-intensive forms are compensated for expensive locations; single-resident apartments, the most-built new product, are barely compensated at all.
Within one city the steps are abrupt: {SDA_LOCATION_FACTOR_EXAMPLE}.
Every site inside an SA4 earns the same factor while land prices across it differ several-fold (section 03), so read a candidate against the land cost of the alternatives inside its own SA4, not against the metro average.
Annual base price per participant — full published table
Multiply any figure here by its SA4 location factor, below, to get the actual price limit for a dwelling. The variant selector carries the sprinkler allowance, and the lower limit that applies to new builds enrolled from 1 July 2023 where the provider could claim GST input tax credits. A dash means that design category is not priced for that configuration. Legacy Stock is published separately and is not shown — no new build can enter it.
How far the location factor moves, by building type
Each row covers all {SDA_LOCATION_FACTOR_BOX_N} metropolitan SA4 regions (New Builds, Appendix E). The solid block is where half of them sit, and the tick marks the middle one. The thin line runs out to the lowest and highest. Remote SA4s are excluded — they carry a separate build-cost loading that would obscure the comparison.
Every SA4 location factor — full published table
The first row is the median capital city reference, which sits at 1.00 for every building type. A factor below 1.00 means the SDA price limit for that dwelling is lower than the national reference.
Reasonable Rent Contribution (RRC)
RRC is the participant rent contribution: {SDA_MRRC_FORMULA}. Typical maximum RRC is {SDA_RRC_TYPICAL}. The provider may charge no more than this. RRC sits on top of SDA payments to form total operator revenue per dwelling.
Use the Returns Calculator to model SDA payments, RRC, occupancy and build cost together at your own category mix.
Design specifications & build costs
SDA dwellings are built under different National Construction Code classifications depending on building type: {NCC_SDA_CLASSIFICATION}. Build cost is driven by the design category and the building type together, so a category premium quoted without a building type cannot be costed. The table below gives each category's range across all eleven dwelling configurations the NDIA prices.
| Design category | Build cost per dwelling, across building types | Premium driver |
|---|---|---|
| Basic B | — | No SDA-specific features — the reference point the others are premiums over. |
| Improved Liveability IL | — | Lowest premium — natural light, reduced sensory overload. |
| Fully Accessible FA | — | Wider doors, accessible bathrooms, level access. |
| Robust RB | — | Reinforced fixtures, impact-resistant surfaces. Not priced for apartments. |
| High Physical Support HPS | — | Ceiling hoists, structural ceiling, emergency power, climate control. |
Quantity-surveyed benchmarks against the NDIA's architect reference designs, costed at 2023-24. They exclude land, GST and fire sprinklers, and include a 15% contingency, preliminaries, builder's margin and professional fees. The low end of each range is a one-resident villa and the high end a five-resident group home. Costs are three years older than the price schedule they earn against, so escalate them — and always verify with a current quantity-surveyor estimate for the specific design category, building type and location.
Design category is the decision, not the payment. HPS carries the highest per-participant payment and the highest build cost, but the return depends on whether documented HPS-eligible participants live in the catchment and what is already enrolled there.
The regulatory framework
| Element | Body / instrument | What it governs |
|---|---|---|
| Scheme administration | {NDIS_AGENCY} | Funding, participant eligibility, planning, SDA payments. |
| Provider regulation | {NDIS_REGULATOR_QUALITY} | Mandatory provider registration for SDA; quality and safeguards. |
| Design | {SDA_DESIGN_STANDARD} | Four design categories + {SDA_LHA_MINIMUM}. |
| Legal instrument | {SDA_RULES_REFERENCE} | Defines design categories, building types, eligibility, and payments. |
| Eligibility | {SDA_ELIGIBILITY} | The restrictive test that limits SDA to a small share of participants. |
| Pricing | {NDIS_PRICING_GUIDE_NAME} | Annual price guide (separate SDA document); sets payments by category, building type, location, residents. |
Tax treatment
| Item | Treatment | Why |
|---|---|---|
| GST on SDA payments | {GST_SDA} | SDA supplied to an NDIS participant under an approved plan is GST-free where the NDIA conditions are met. |
| Negative gearing | {NEGATIVE_GEARING_SDA} | SDA payments are treated as rental income; the dwelling can be held as a private investment property. |
How the calculator works
The calculator models SDA operator and investor scenarios. Pick the SA4 region at the top — it sets the location factor that scales the SDA payment, and supplies the residential rent the exit is valued on. Then build the dwelling mix: each row's design category and configuration look up their own NDIA base price and their own quantity-surveyed build cost, so a one-bedroom apartment and a five-resident group home are priced and costed differently. Participant occupancy derives from the NDIA's stabilised vacancy research for the same mix. Every derived figure is a slider — drag to override, Reset to restore. Hover any dotted label for a tooltip explaining the input. The Cash Flow Projection panel below carries the hold, ramp-up, escalation and exit assumptions; the hold defaults to the 20 years an SDA enrolment is priced over. Set the inputs for your project and request your cash flow model — we email you the full model (revenue, EBITDA, returns and a year-by-year cash flow) built from your settings. Indicative only — SDA payments reset at each NDIS price-guide review, and the benchmark build costs are 2023-24.
SDA Returns Calculator
The dwelling mix ("Project scale", above the toggle) is also part of the site settings.
This calculator is a financial modelling tool provided by AreaSearch for indicative analysis only — not investment, tax, or legal advice. Excludes land, GST, fire sprinklers, tax, financing and project-specific factors. SDA prices reset at each NDIA pricing review and the build-cost benchmarks predate the price schedule they earn against — verify current prices with the NDIS, confirm provider-registration obligations with the NDIS Quality and Safeguards Commission, and obtain a current quantity-surveyor estimate. The terminal value assumes the dwellings can be sold as ordinary housing at prevailing rents and yields, which is not guaranteed. Speak to a qualified accountant, an NDIS/SDA-specialist advisor, and a lawyer before committing capital.
05Worked example
{WE_SA4_NAME} — an SA4 that reads well supplied in total, and is short in the categories that matter.
{WE_SA4_NAME} holds {WE_SA4_CAPACITY} enrolled SDA resident places against {WE_SA4_NEED} participants assessed as needing SDA — need is {WE_SA4_NEED_RATIO} of capacity, a {WE_SA4_SURPLUS_PLACES}-place surplus across {WE_SA4_PARTICIPANTS} NDIS participants. On that number alone many would end their assessment.
The {WE_SURPLUS_PLACES} {WE_SURPLUS_CAT} places do not offset the {WE_SHORT_PLACES}-place {WE_SHORT_CAT} shortfall, however. A participant approved for {WE_SHORT_CAT} could physically live in a {WE_SURPLUS_CAT} dwelling, but the provider would be letting a dearer build at the lower category's payment, while in the other direction the required features simply are not there.
| Design category | Assessed need | Enrolled places | Shortfall | Need ÷ capacity |
|---|---|---|---|---|
| {WE_CAT1_NAME} | {WE_CAT1_NEED} | {WE_CAT1_CAP} | {WE_CAT1_GAP} | {WE_CAT1_RATIO} |
| {WE_CAT2_NAME} | {WE_CAT2_NEED} | {WE_CAT2_CAP} | {WE_CAT2_GAP} | {WE_CAT2_RATIO} |
| {WE_CAT3_NAME} | {WE_CAT3_NEED} | {WE_CAT3_CAP} | {WE_CAT3_GAP} | {WE_CAT3_RATIO} |
| {WE_CAT4_NAME} | {WE_CAT4_NEED} | {WE_CAT4_CAP} | {WE_CAT4_GAP} | {WE_CAT4_RATIO} |
Positive shortfall means assessed need exceeds enrolled places. Ordered by shortfall.
{WE_SURPLUS_CAT} carries the highest payment per resident place and the highest build cost — and here it is the one category already in surplus.
The same split runs one level down. Inside {WE_SA4_NAME}, {WE_SA3_SUPPLIED_NAME} reads {WE_SA3_SUPPLIED_NEED_RATIO} — better supplied again than the SA4 containing it — while {WE_SA3_SHORT_NAME} reads {WE_SA3_SHORT_NEED_RATIO}. Yet {WE_SA3_SUPPLIED_NAME} is {WE_SA3_SUPPLIED_WORSTCAT_PLACES} places short of {WE_SA3_SUPPLIED_WORSTCAT}, and {WE_SA3_SHORT_NAME} holds {WE_SA3_SHORT_WORSTCAT_CAP} enrolled {WE_SA3_SHORT_WORSTCAT} places against {WE_SA3_SHORT_WORSTCAT_NEED} assessed participants. Then things can change even further at the site level.
{SITE_A_LABEL}
Site in {WE_SA3_SUPPLIED_NAME} · {SITE_A_GEO}
| {WE_SA3_SUPPLIED_NAME} | Catchment | |
| Resident population | {WE_SA3_SUPPLIED_POP} | {SITE_A_POP} |
| NDIS participants | {WE_SA3_SUPPLIED_PARTICIPANTS} | {SITE_A_PARTICIPANTS} |
| Participant density (per 10k) | {WE_SA3_SUPPLIED_DENSITY} | {SITE_A_NDIS_DENSITY} |
| Enrolled SDA places | {WE_SA3_SUPPLIED_CAPACITY} | {SITE_A_SDA_CAPACITY_EXISTING} |
| Spaces per 1,000 participants | {WE_SA3_SUPPLIED_SPACES_PER_1K} | {SITE_A_SPACES_PER_1K_PART} |
| {WE_SA3_SUPPLIED_WORSTCAT} — assessed need (participants) | {WE_SA3_SUPPLIED_WORSTCAT_NEED} | {SITE_A_SHORTCAT_NEED} |
| {WE_SA3_SUPPLIED_WORSTCAT} — enrolled places (spaces) | {WE_SA3_SUPPLIED_WORSTCAT_CAP} | {SITE_A_SHORTCAT_CAP} |
{SITE_A_VERDICT}
{SITE_B_LABEL}
Site in {WE_SA3_SHORT_NAME} · {SITE_B_GEO}
| {WE_SA3_SHORT_NAME} | Catchment | |
| Resident population | {WE_SA3_SHORT_POP} | {SITE_B_POP} |
| NDIS participants | {WE_SA3_SHORT_PARTICIPANTS} | {SITE_B_PARTICIPANTS} |
| Participant density (per 10k) | {WE_SA3_SHORT_DENSITY} | {SITE_B_NDIS_DENSITY} |
| Enrolled SDA places | {WE_SA3_SHORT_CAPACITY} | {SITE_B_SDA_CAPACITY_EXISTING} |
| Spaces per 1,000 participants | {WE_SA3_SHORT_SPACES_PER_1K} | {SITE_B_SPACES_PER_1K_PART} |
| {WE_SA3_SHORT_WORSTCAT} — assessed need (participants) | {WE_SA3_SHORT_WORSTCAT_NEED} | {SITE_B_SHORTCAT_NEED} |
| {WE_SA3_SHORT_WORSTCAT} — enrolled places (spaces) | {WE_SA3_SHORT_WORSTCAT_CAP} | {SITE_B_SHORTCAT_CAP} |
{SITE_B_VERDICT}
The takeaway
The SA4 ratio said {WE_SA4_NAME} was oversupplied; the category split says it is {WE_SHORT_PLACES} places short in {WE_SHORT_CAT}. A level down, variation increases — the catchment inside the SA3 with higher dwelling stock overall is the one carrying the gap, and the catchment inside the short SA3 holds stock that SA3 never counted, because a catchment crosses boundaries and a figure for a predefined area cannot. The regional figure tells you where to look; the catchment tells you whether the opportunity is there. Run a custom catchment for the site-level decision.
Sources: ABS · RBA · National Disability Insurance Agency (NDIA) · NDIS Quality and Safeguards Commission · NDIS Data and Insights · NDIS Pricing Arrangements and Price Limits · NDIS (SDA) Rules 2020 · NDIA SDA Pricing Review 2022-23 technical reports (EY) · National Construction Code · ATO (GST and the NDIS) · AreaSearch. Updated {LATEST_REFRESH_DATE}. This article is a preliminary scoping resource. Make your own enquiries and seek independent professional advice before acting on any information here.