Chart Color Schemes
This analysis uses ABS Statistical Areas Level 2 (SA2) boundaries, which can materially differ from Suburbs and Localities (SAL) even when sharing similar names.
SA2 boundaries are defined by the Australian Bureau of Statistics and are designed to represent communities for statistical reporting (e.g., census and ERP).
Suburbs and Localities (SAL) represent commonly-used suburb/locality names (postal-style areas) and may use different geographic boundaries. For comprehensive analysis, consider reviewing both boundary types if available.
est. as @ -- *
ABS ERP | -- people | --
2021 Census | -- people
Sales Activity
Curious about local property values? Filter the chart to assess the volume and appreciation (including resales) trends and regional comparisons, or scroll to the map below view this information at an individual property level.
Find a Recent Sale
Sales Detail
Population
An assessment of population growth drivers in Yangebup reveals an overall ranking slightly below national averages considering recent, and medium term trends
Yangebup's population was approximately 8,230 as of November 2025. This figure reflects an increase of 599 people since the 2021 Census, which reported a population of 7,631. The change is inferred from ABS data showing an estimated resident population of 8,223 in June 2024 and an additional 59 validated new addresses since the Census date. This equates to a density ratio of 1,367 persons per square kilometer, above the average seen across national locations assessed by AreaSearch. Yangebup's growth rate of 7.8% since the census is within 1.1 percentage points of the national average (8.9%). Population growth was primarily driven by natural growth contributing approximately 63.3% of overall population gains during recent periods.
AreaSearch adopts ABS/Geoscience Australia projections for each SA2 area, released in 2024 with a base year of 2022. For areas not covered, AreaSearch uses ABS Greater Capital Region projections released in 2023 based on 2022 data. Considering projected demographic shifts, above median population growth is expected by 2041, with the area projected to grow by 1,281 persons, reflecting a total increase of 15.5% over the 17 years.
Frequently Asked Questions - Population
Development
Recent residential development output has been above average within Yangebup when compared nationally
Yangebup has averaged approximately 27 new dwelling approvals annually over the past five financial years, totalling 135 homes. As of FY-26, 6 approvals have been recorded. On average, 4.2 people have moved to the area per year for each dwelling built between FY-21 and FY-25, indicating significant demand outpacing supply. New properties are constructed at an average expected cost of $254,000.
In FY-26, $9.4 million in commercial development approvals have been recorded. Compared to Greater Perth, Yangebup shows substantially reduced construction, with 64.0% below the regional average per person. New development consists of 95.0% detached dwellings and 5.0% medium and high-density housing, preserving the area's suburban nature. With around 265 people per dwelling approval, Yangebup shows a developing market. According to AreaSearch's latest quarterly estimate, Yangebup is expected to grow by 1,274 residents through to 2041.
If current development rates continue, housing supply may not keep pace with population growth, potentially increasing competition among buyers and supporting stronger price growth.
Frequently Asked Questions - Development
Infrastructure
Yangebup has moderate levels of nearby infrastructure activity, ranking in the 40thth percentile nationally
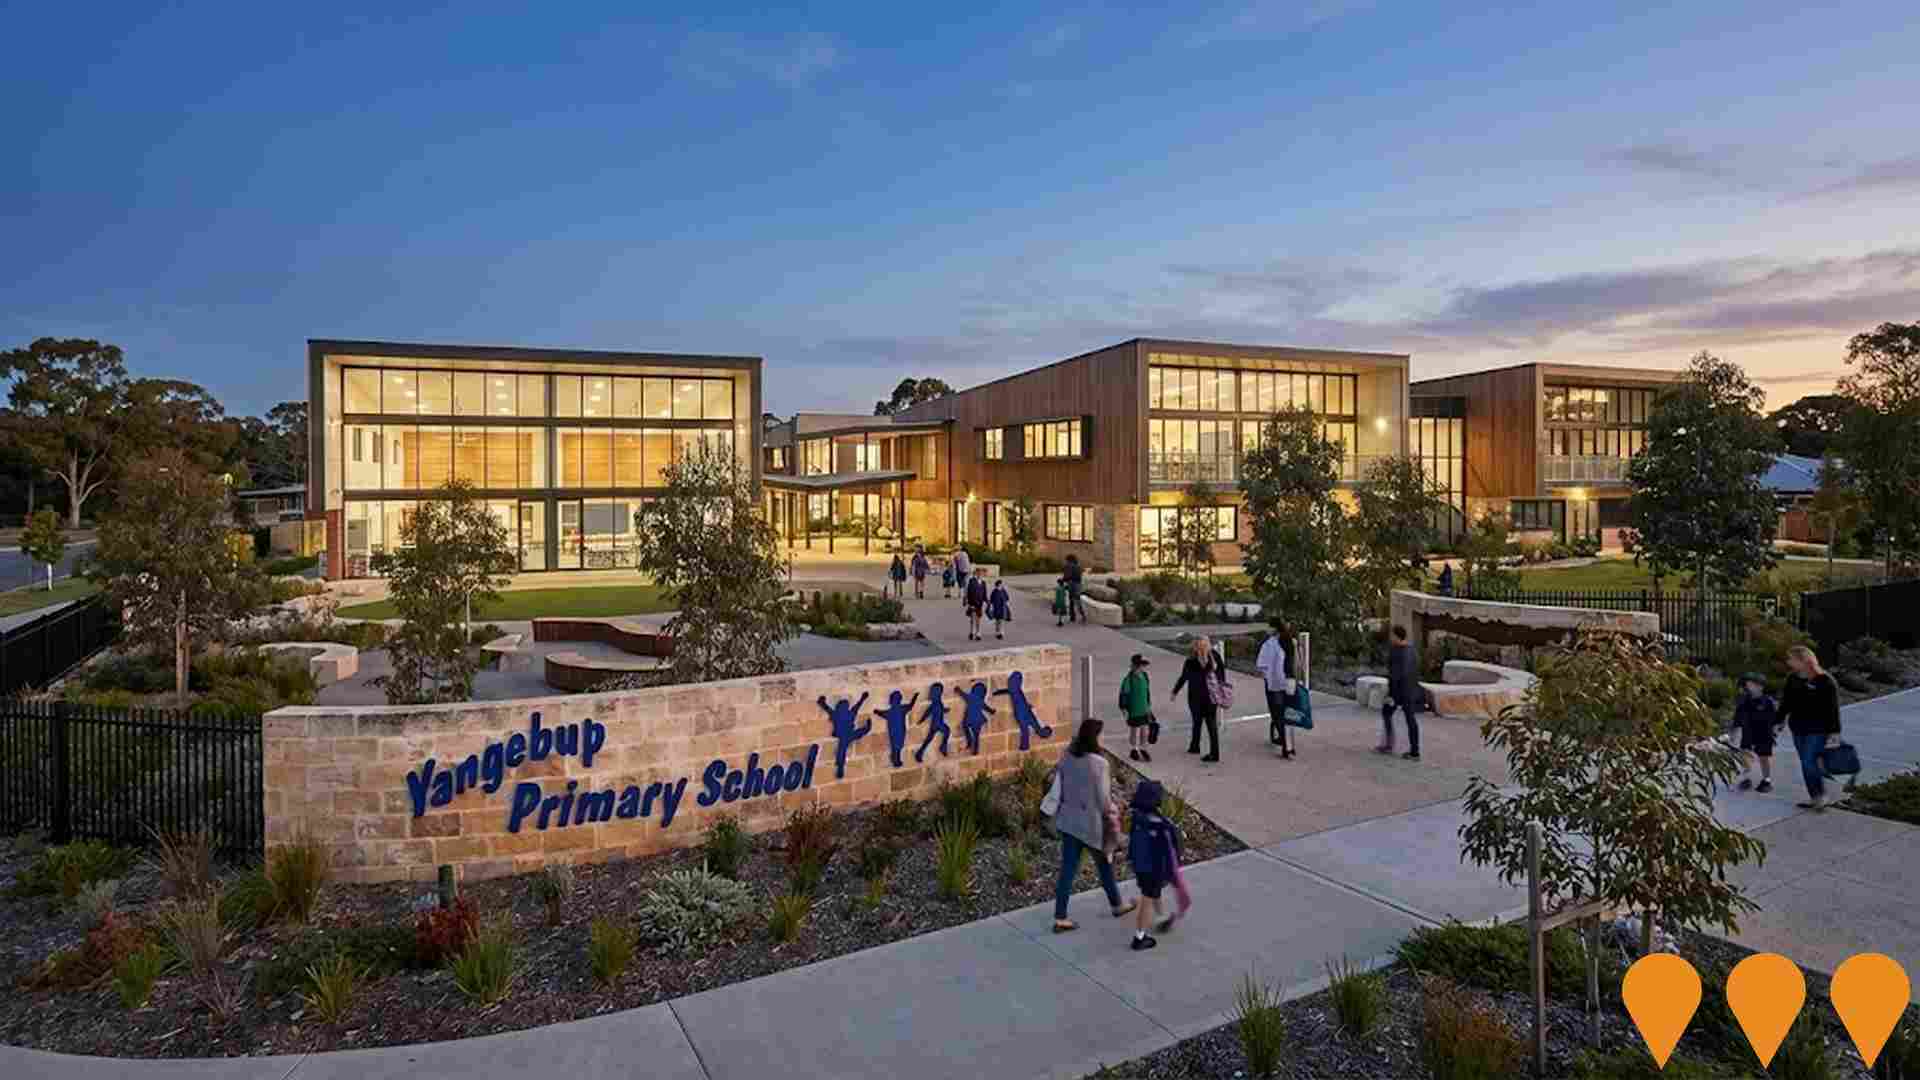
Changes to local infrastructure significantly impact an area's performance. AreaSearch identified 26 projects that could affect the area. Notable projects include Yangebup Village, Yangebup Primary School Expansion and Modernisation, Beeliar Reserve & Community Centre Redevelopment, and another project with the same name. The following list details those most relevant.
Professional plan users can use the search below to filter and access additional projects.
INFRASTRUCTURE SEARCH
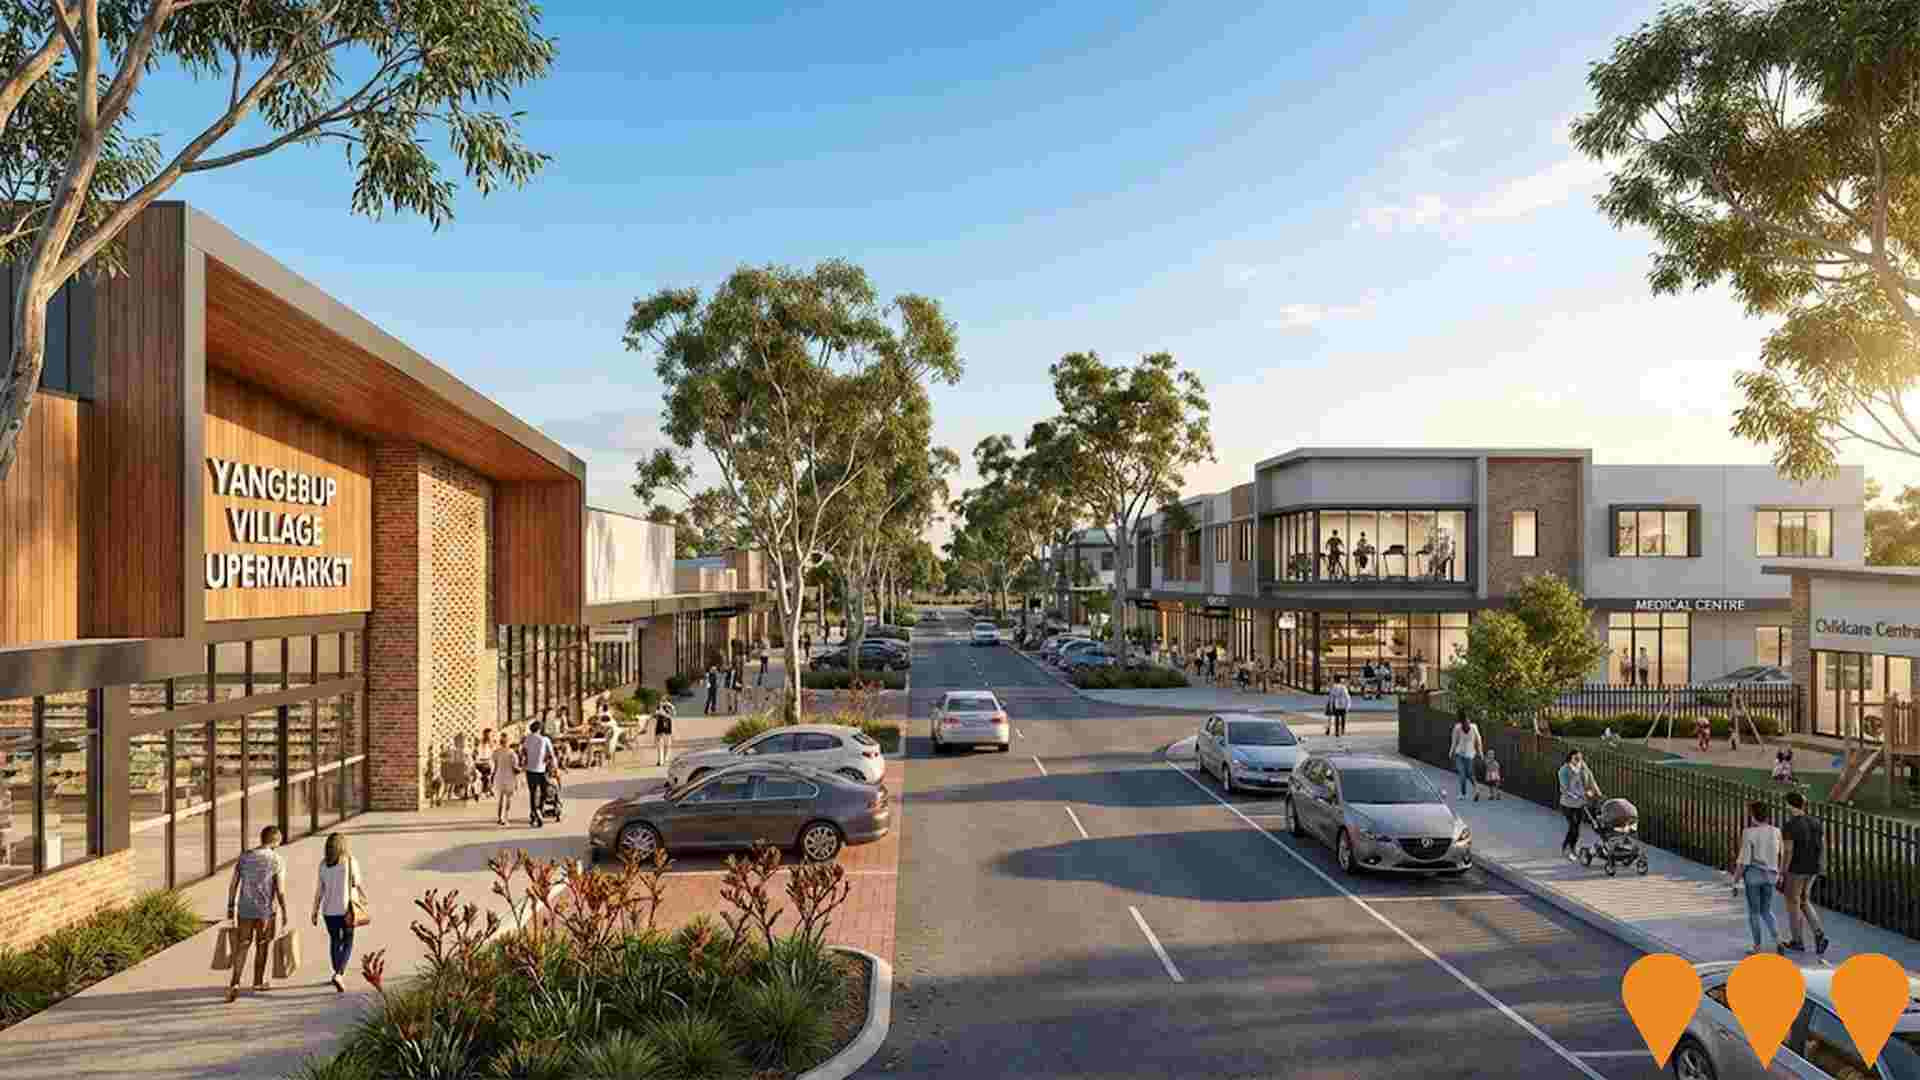
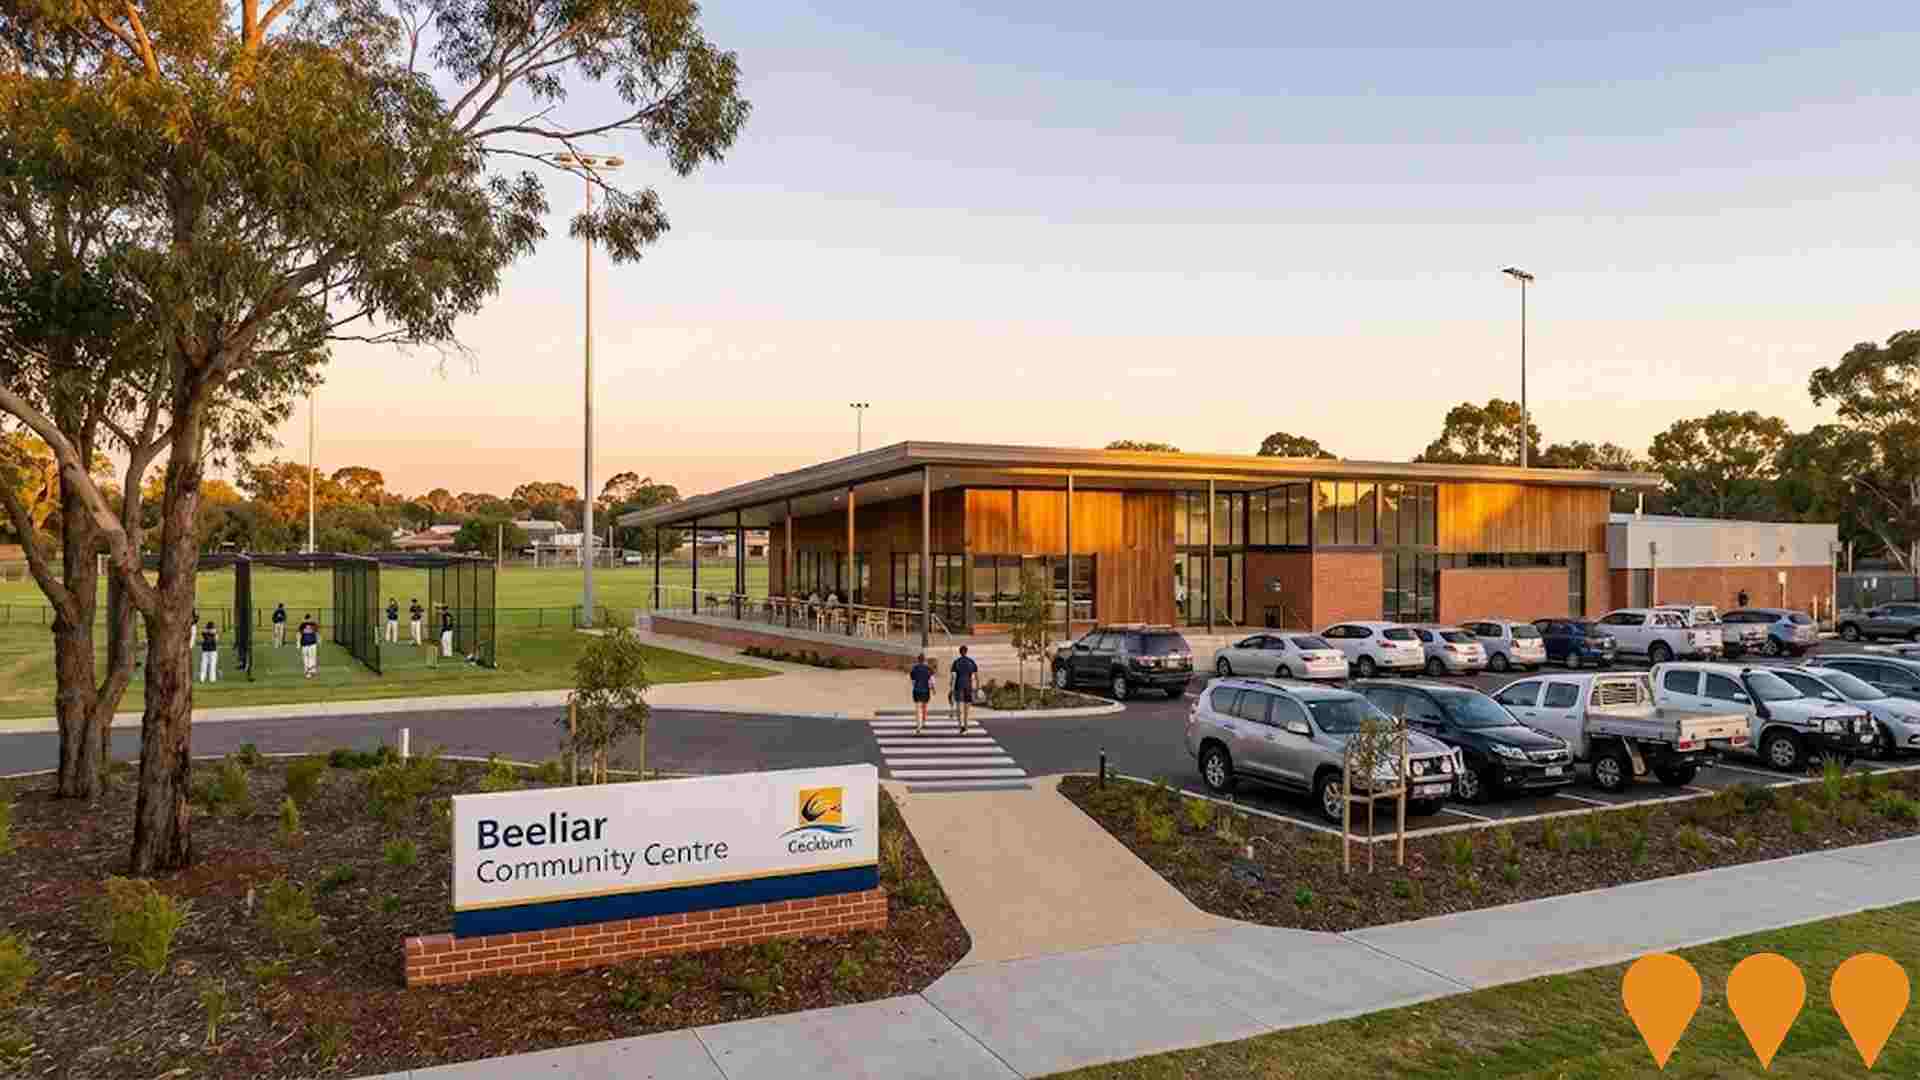
 Denotes AI-based impression for illustrative purposes only, not to be taken as definitive under any circumstances. Please follow links and conduct other investigations from the project's source for actual imagery. Developers and project owners wishing us to use original imagery please Contact Us and we will do so.
Frequently Asked Questions - Infrastructure
Yangebup Village
A mixed-use town centre redevelopment on the current Yangebup Shopping Centre site, proposed to deliver a new full line supermarket, specialty retail, medical and allied health services, childcare, gym, food and beverage and flexible community spaces to create a modern local main street style centre for Yangebup and nearby suburbs.

Beeliar Reserve & Community Centre Redevelopment
The City of Cockburn has identified Beeliar Reserve and Community Centre for comprehensive redevelopment as part of its Community Infrastructure Plan 2024-2041. The project includes new changerooms, modernized community centre layout, upgraded floodlights, additional cricket nets, increased shade areas, extra water fountains, and expanded veranda facilities. The reserve serves as home to Beeliar Spirit Association Football Club in winter and Phoenix Beeliar Junior Cricket Club in summer. The Phoenix Cricket Club plans to formally relocate from Tempest Park to Beeliar Reserve following completion of the upgrades. Community feedback is currently being sought on the draft concept plan through July 2025.

Employment
Employment conditions in Yangebup remain below the national average according to AreaSearch analysis
Yangebup's skilled workforce is notable, particularly in the construction sector. Its unemployment rate was 4.8% as of September 2025, with an estimated employment growth of 4.1% over the past year.
There were 4,826 residents employed at this time, while the unemployment rate was 0.9% higher than Greater Perth's rate of 4.0%. Workforce participation in Yangebup was 69.0%, slightly higher than Greater Perth's 65.2%. The dominant employment sectors among residents were health care & social assistance, construction, and retail trade, with construction being particularly concentrated at 1.3 times the regional average. However, professional & technical services were under-represented, comprising only 5.3% of Yangebup's workforce compared to Greater Perth's 8.2%.
Over the year to September 2025, employment increased by 4.1%, while labour force grew by 4.3%, causing unemployment to rise by 0.2 percentage points. In comparison, Greater Perth recorded employment growth of 2.9% and a marginal increase in unemployment. State-level data from 25-Nov shows WA employment contracted by 0.27%, with the state unemployment rate at 4.6%. National employment forecasts suggest an expansion of 6.6% over five years and 13.7% over ten years, but growth rates vary significantly between industry sectors. Applying these projections to Yangebup's employment mix indicates local employment should increase by 6.1% over five years and 12.9% over ten years.
Frequently Asked Questions - Employment
Income
The economic profile demonstrates above-average performance, with income metrics exceeding national benchmarks based on AreaSearch comparative assessment
The Yangebup SA2 had a median taxpayer income of $53,382 and an average income of $63,717 in the financial year 2022, according to postcode level ATO data aggregated by AreaSearch. This is slightly below the national average, with Greater Perth having a median income of $58,380 and an average income of $78,020 during the same period. Based on Wage Price Index growth of 14.2% since financial year 2022, estimated incomes for September 2025 would be approximately $60,962 (median) and $72,765 (average). As per 2021 Census figures, incomes in Yangebup cluster around the 61st percentile nationally. The income bracket of $1,500 - 2,999 captures 37.9% of the community (3,119 individuals), which is consistent with broader trends across regional levels showing 32.0% in the same category. After housing costs, 85.2% of income remains for other expenses. The area's SEIFA income ranking places it in the 5th decile.
Frequently Asked Questions - Income
Housing
Yangebup is characterized by a predominantly suburban housing profile, with above-average rates of outright home ownership
Yangebup's dwelling structure, as per the latest Census, consisted of 90.1% houses and 9.9% other dwellings (semi-detached, apartments, 'other' dwellings). This compares to Perth metro's 81.2% houses and 18.8% other dwellings. Home ownership in Yangebup was at 26.6%, with the rest being mortgaged (52.9%) or rented (20.5%). The median monthly mortgage repayment was $1,733, below Perth metro's average of $1,950. Median weekly rent stood at $350, compared to Perth metro's $370. Nationally, Yangebup's mortgage repayments were lower than the Australian average of $1,863, and rents were less than the national figure of $375.
Frequently Asked Questions - Housing
Household Composition
Yangebup has a typical household mix, with a fairly typical median household size
Family households account for 75.4% of all households, consisting of 36.1% couples with children, 25.7% couples without children, and 12.6% single parent families. Non-family households comprise the remaining 24.6%, with lone person households at 22.3% and group households making up 2.3%. The median household size is 2.6 people, aligning with the Greater Perth average.
Frequently Asked Questions - Households
Local Schools & Education
Educational attainment in Yangebup aligns closely with national averages, showing typical qualification patterns and performance metrics
Yangebup trail residents aged 15+ with university degrees comprise 20.6%, compared to Australia's 30.4%. Bachelor degrees are most common at 15.3%, followed by postgraduate qualifications (3.3%) and graduate diplomas (2.0%). Vocational credentials are held by 40.1% of residents, including advanced diplomas (10.0%) and certificates (30.1%). Current educational participation stands at 28.8%, with 10.5% in primary, 7.2% in secondary, and 4.7% in tertiary education.
Educational participation is notably high, with 28.8% of residents currently enrolled in formal education. This includes 10.5% in primary education, 7.2% in secondary education, and 4.7% pursuing tertiary education.
Frequently Asked Questions - Education
Schools Detail
Nearby Services & Amenities
Transport
Transport servicing is moderate compared to other areas nationally based on assessment of service frequency, route connectivity and accessibility
Transport analysis shows 44 active transport stops in Yangebup, offering a mix of bus services. These stops are served by 5 distinct routes, collectively facilitating 1,086 weekly passenger trips. Transport accessibility is rated excellent, with residents typically located 196 meters from the nearest stop.
Service frequency averages 155 trips per day across all routes, equating to approximately 24 weekly trips per individual stop.
Frequently Asked Questions - Transport
Transport Stops Detail
Health
The level of general health in Yangebup is notably higher than the national average with prevalence of common health conditions low among the general population though higher than the nation's average across older, at risk cohorts
Yangebup shows superior health outcomes with a lower prevalence of common health conditions among its general population compared to national averages, despite higher rates in older, at-risk cohorts. Approximately 51% (~4,213 people) have private health cover, slightly lower than the average SA2 area's 56.4%.
Mental health issues and asthma are the most prevalent medical conditions, affecting 8.2 and 7.4% of residents respectively. 71.2% declare themselves completely clear of medical ailments, compared to Greater Perth's 72.9%. The area has 14.2% (1,165 people) of residents aged 65 and over, requiring more attention than the broader population.
Frequently Asked Questions - Health
Cultural Diversity
The level of cultural diversity witnessed in Yangebup was found to be above average when compared nationally for a number of language and cultural background related metrics
Yangebup was found to be more culturally diverse than most local markets, with 18.3% of its population speaking a language other than English at home and 29.5% born overseas. Christianity is the main religion in Yangebup, comprising 50.9% of people, compared to 48.5% across Greater Perth. The top three ancestry groups are English (27.2%), Australian (23.2%), and Other (9.9%).
Notably, Croatian (2.7%) is overrepresented in Yangebup compared to the regional figure of 2.3%. Similarly, Serbian (1.1%) and Italian (7.2%) also have higher representations than their respective regional figures of 0.7% and 6.6%.
Frequently Asked Questions - Diversity
Age
Yangebup's population is slightly younger than the national pattern
Yangebup's median age is 37, matching Greater Perth's figure and closely resembling Australia's median age of 38. The 55-64 age group constitutes 12.3% of Yangebup's population, higher than Greater Perth's percentage, while the 15-24 cohort makes up 10.6%. Between 2021 and present, the 65-74 age group has increased from 7.7% to 8.9%, while the 45-54 cohort has decreased from 13.6% to 12.6%. By 2041, demographic projections indicate significant shifts in Yangebup's age structure. Notably, the 75-84 group is projected to grow by 112%, reaching 654 people from its current 308. The aging population trend is evident, with those aged 65 and above accounting for 56% of the projected growth. Conversely, the 5-14 and 35-44 age groups are expected to experience population declines.
