Chart Color Schemes
This analysis uses ABS Statistical Areas Level 2 (SA2) boundaries, which can materially differ from Suburbs and Localities (SAL) even when sharing similar names.
SA2 boundaries are defined by the Australian Bureau of Statistics and are designed to represent communities for statistical reporting (e.g., census and ERP).
Suburbs and Localities (SAL) represent commonly-used suburb/locality names (postal-style areas) and may use different geographic boundaries. For comprehensive analysis, consider reviewing both boundary types if available.
est. as @ -- *
ABS ERP | -- people | --
2021 Census | -- people
Sales Activity
Curious about local property values? Filter the chart to assess the volume and appreciation (including resales) trends and regional comparisons, or scroll to the map below view this information at an individual property level.
Find a Recent Sale
Sales Detail
Population
Jandakot has shown very soft population growth performance across periods assessed by AreaSearch
Based on AreaSearch's analysis, Jandakot's population is around 3078 as of Nov 2025. This reflects an increase of 632 people (25.8%) since the 2021 Census, which reported a population of 2446 people. The change is inferred from the estimated resident population of 2636 from the ABS as of June 2024 and an additional 176 validated new addresses since the Census date. This level of population equates to a density ratio of 196 persons per square kilometer, providing significant space per person and potential room for further development. Jandakot's 25.8% growth since the 2021 census exceeded the national average (8.9%), along with the state, marking it as a growth leader in the region. Population growth for the area was primarily driven by overseas migration that contributed approximately 74.1% of overall population gains during recent periods.
AreaSearch is adopting ABS/Geoscience Australia projections for each SA2 area, as released in 2024 with 2022 as the base year. For any SA2 areas not covered by this data, and to estimate growth across all areas in the years post-2032, AreaSearch is utilising the growth rates by age cohort provided by the ABS in its latest Greater Capital Region projections (released in 2023, based on 2022 data). Looking at population projections moving forward, a population increase just below the median of statistical areas across the nation is expected, with the area expected to grow by 224 persons to 2041 based on the latest annual ERP population numbers, reflecting a reduction of 7.1% in total over the 17 years.
Frequently Asked Questions - Population
Development
AreaSearch analysis of residential development drivers sees Jandakot recording a relatively average level of approval activity when compared to local markets analysed countrywide
Jandakot has seen approximately 9 new homes approved annually. Over the past five financial years, from FY-21 to FY-25, around 45 homes were approved. In FY-26, up until now, about 47 homes have been approved.
This results in an average of 1.6 people moving to the area per dwelling built over these five years. This balance between supply and demand supports stable market conditions. The average construction cost value for new properties is approximately $530,000, indicating a focus on premium developments. In FY-26 alone, around $37.2 million in commercial approvals have been registered, suggesting robust local business investment. Compared to Greater Perth, Jandakot has significantly less development activity, with 64.0% below the regional average per person.
This scarcity typically strengthens demand and prices for existing properties, though recent periods have seen an increase in development activity. However, this activity remains lower than nationally, reflecting market maturity and possible development constraints. All new construction in Jandakot has been detached houses, maintaining its traditional low density character with a focus on family homes. The estimated population per dwelling approval is around 1323 people, reflecting the area's quiet, low activity development environment. With stable or declining population forecasts, Jandakot may experience less housing pressure, creating favourable conditions for buyers.
Frequently Asked Questions - Development
Infrastructure
Jandakot has emerging levels of nearby infrastructure activity, ranking in the 32ndth percentile nationally
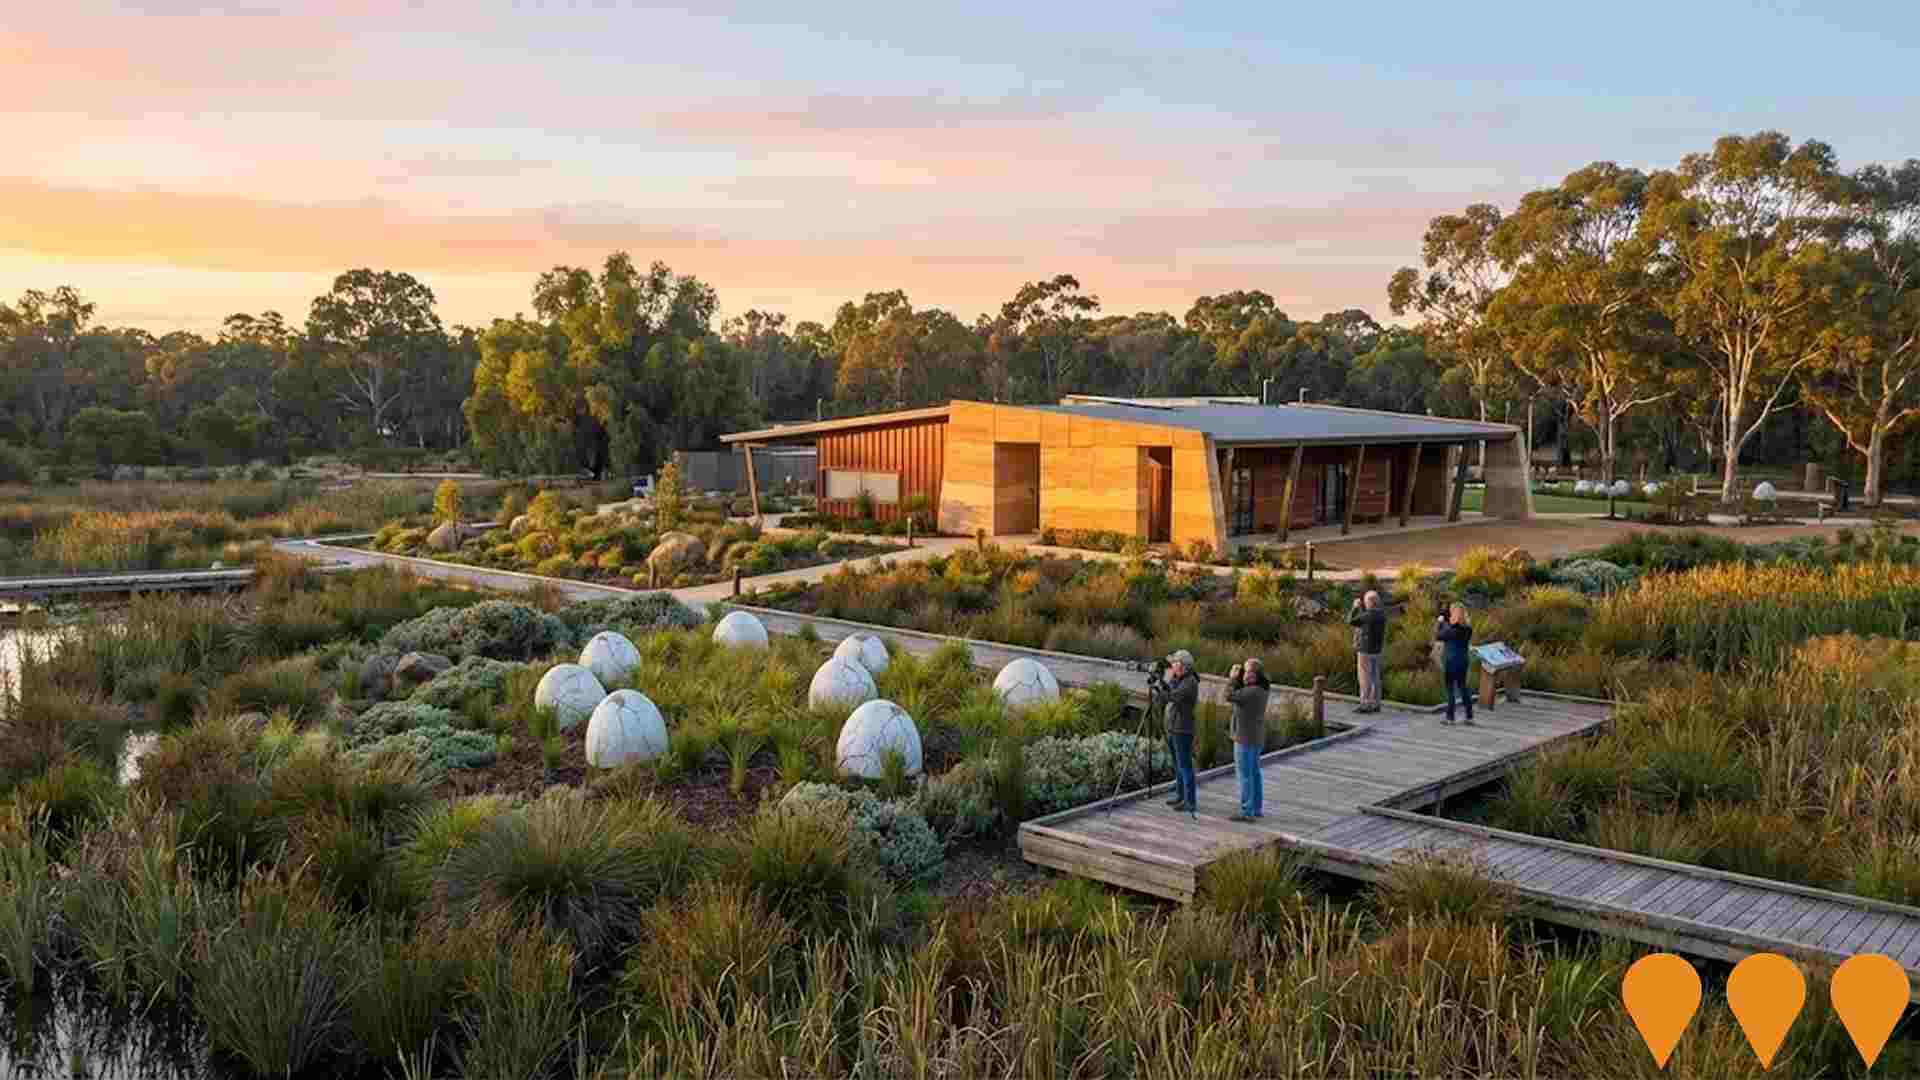
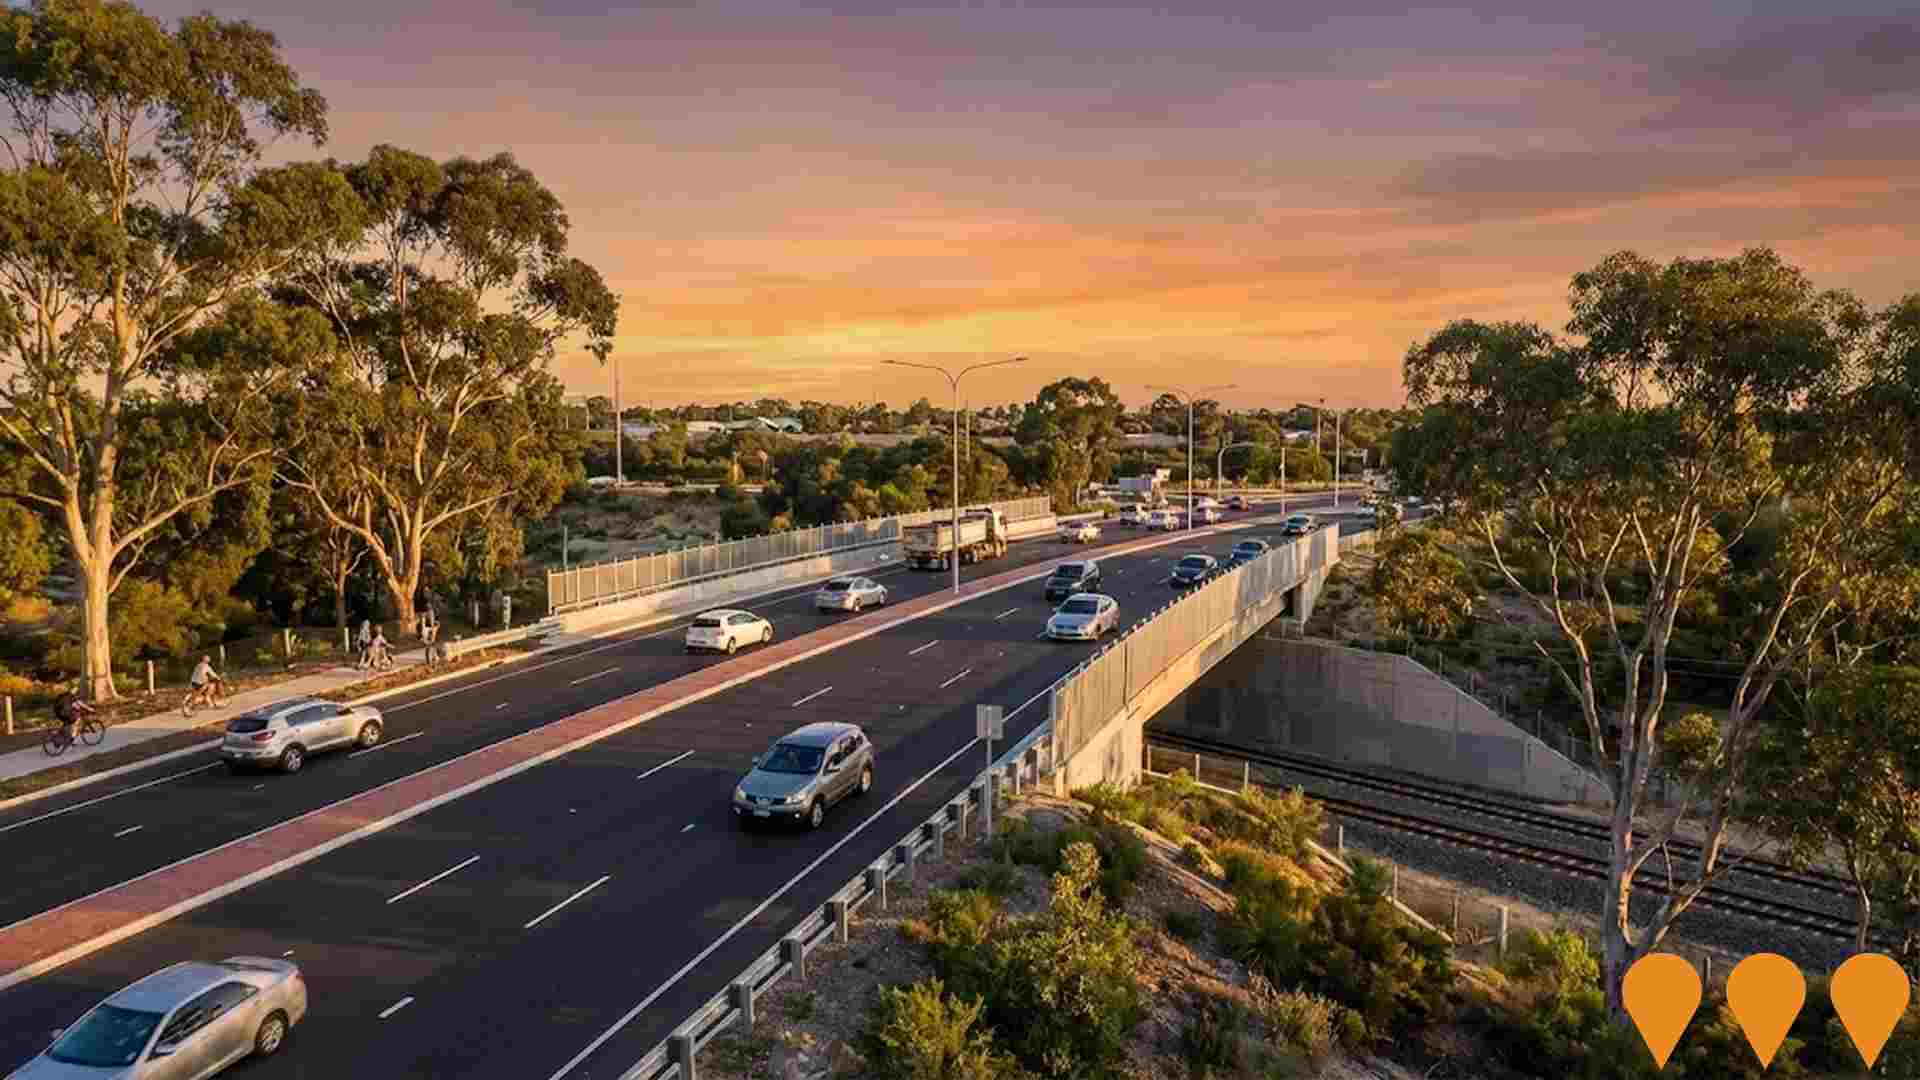
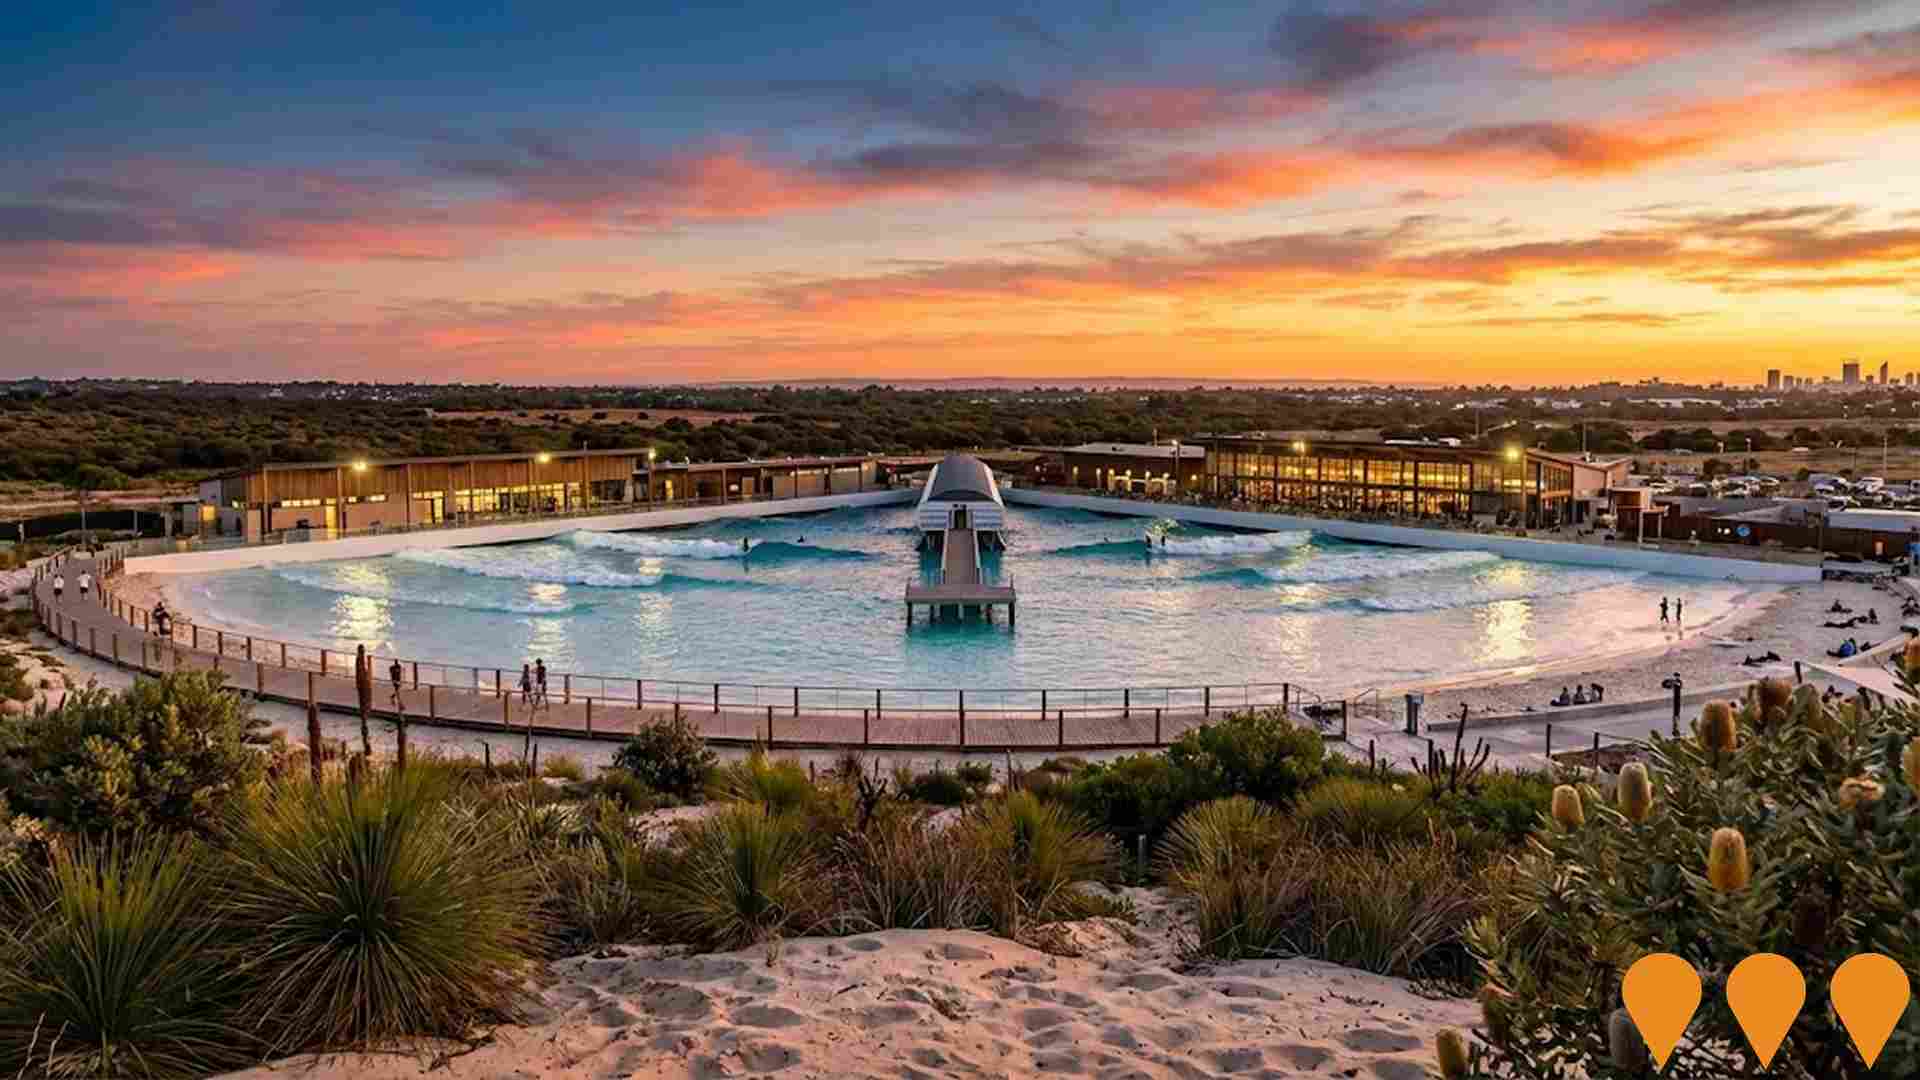
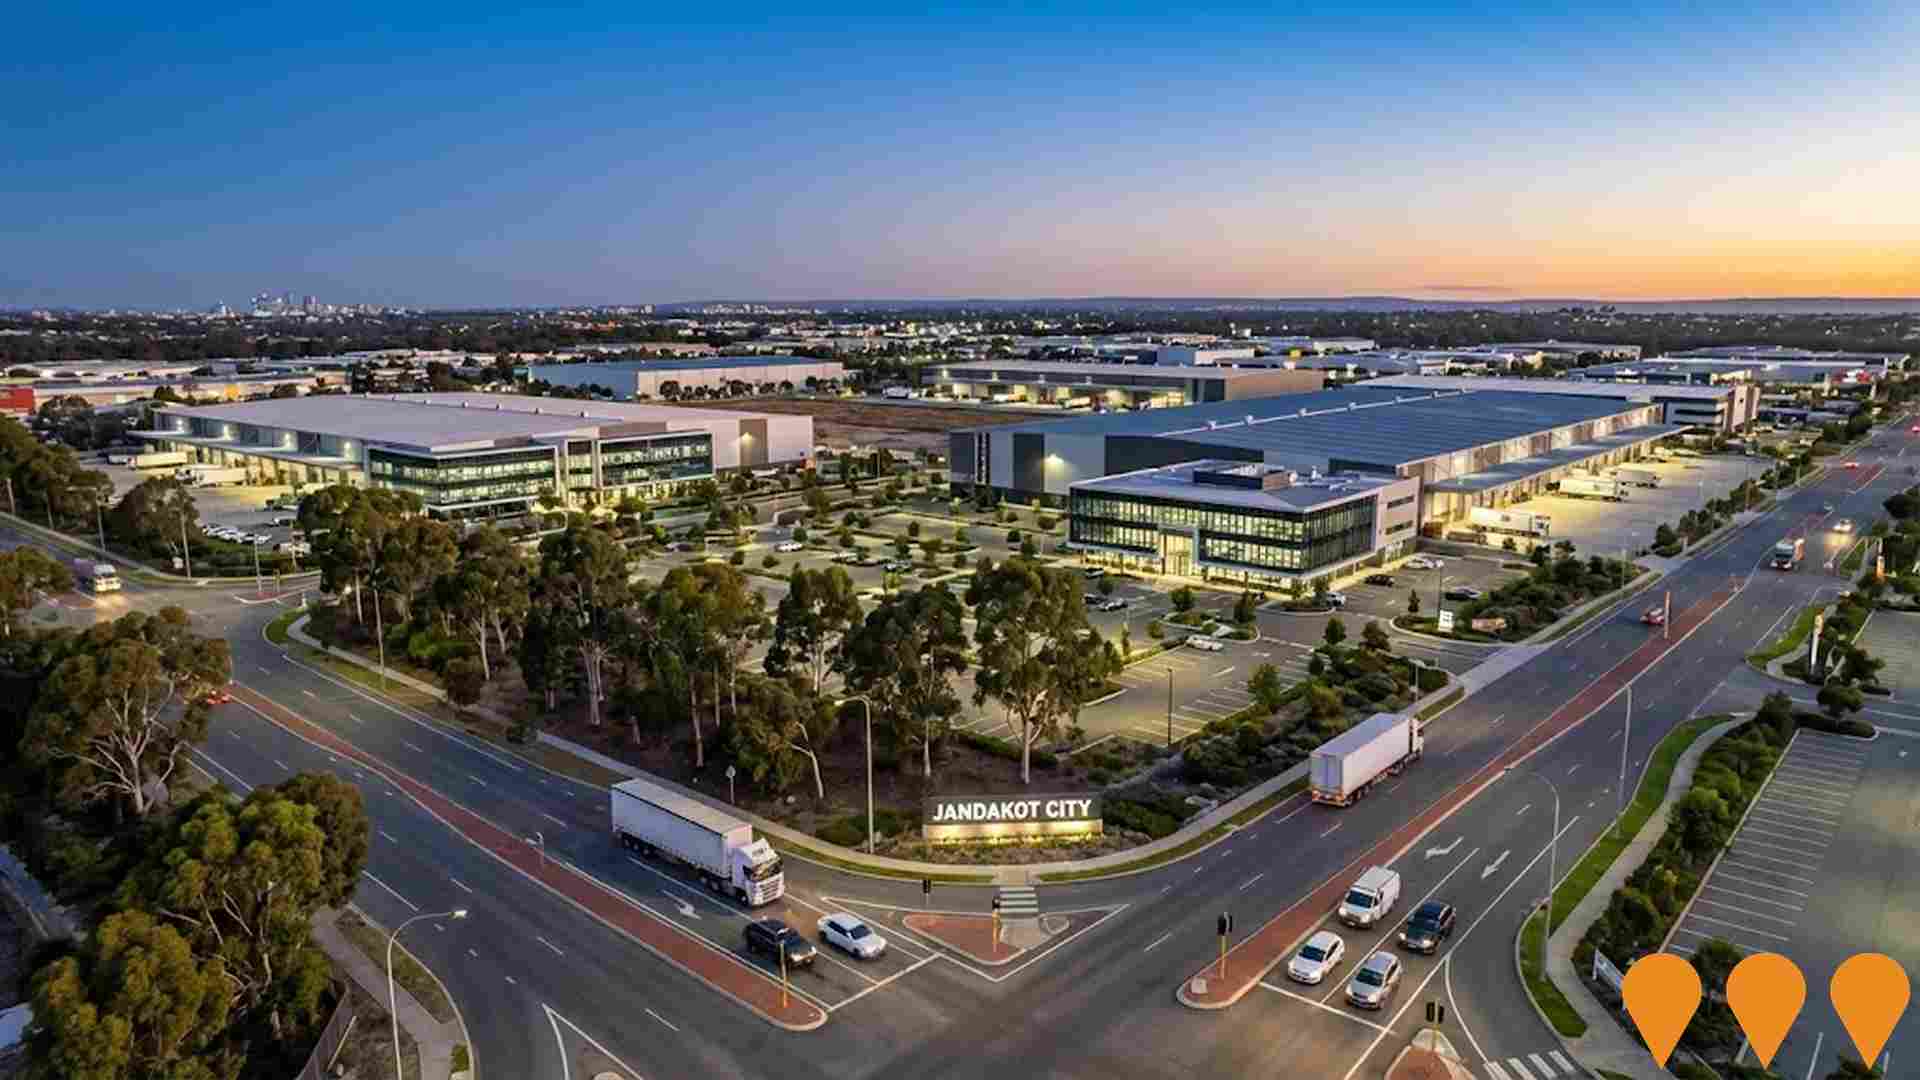
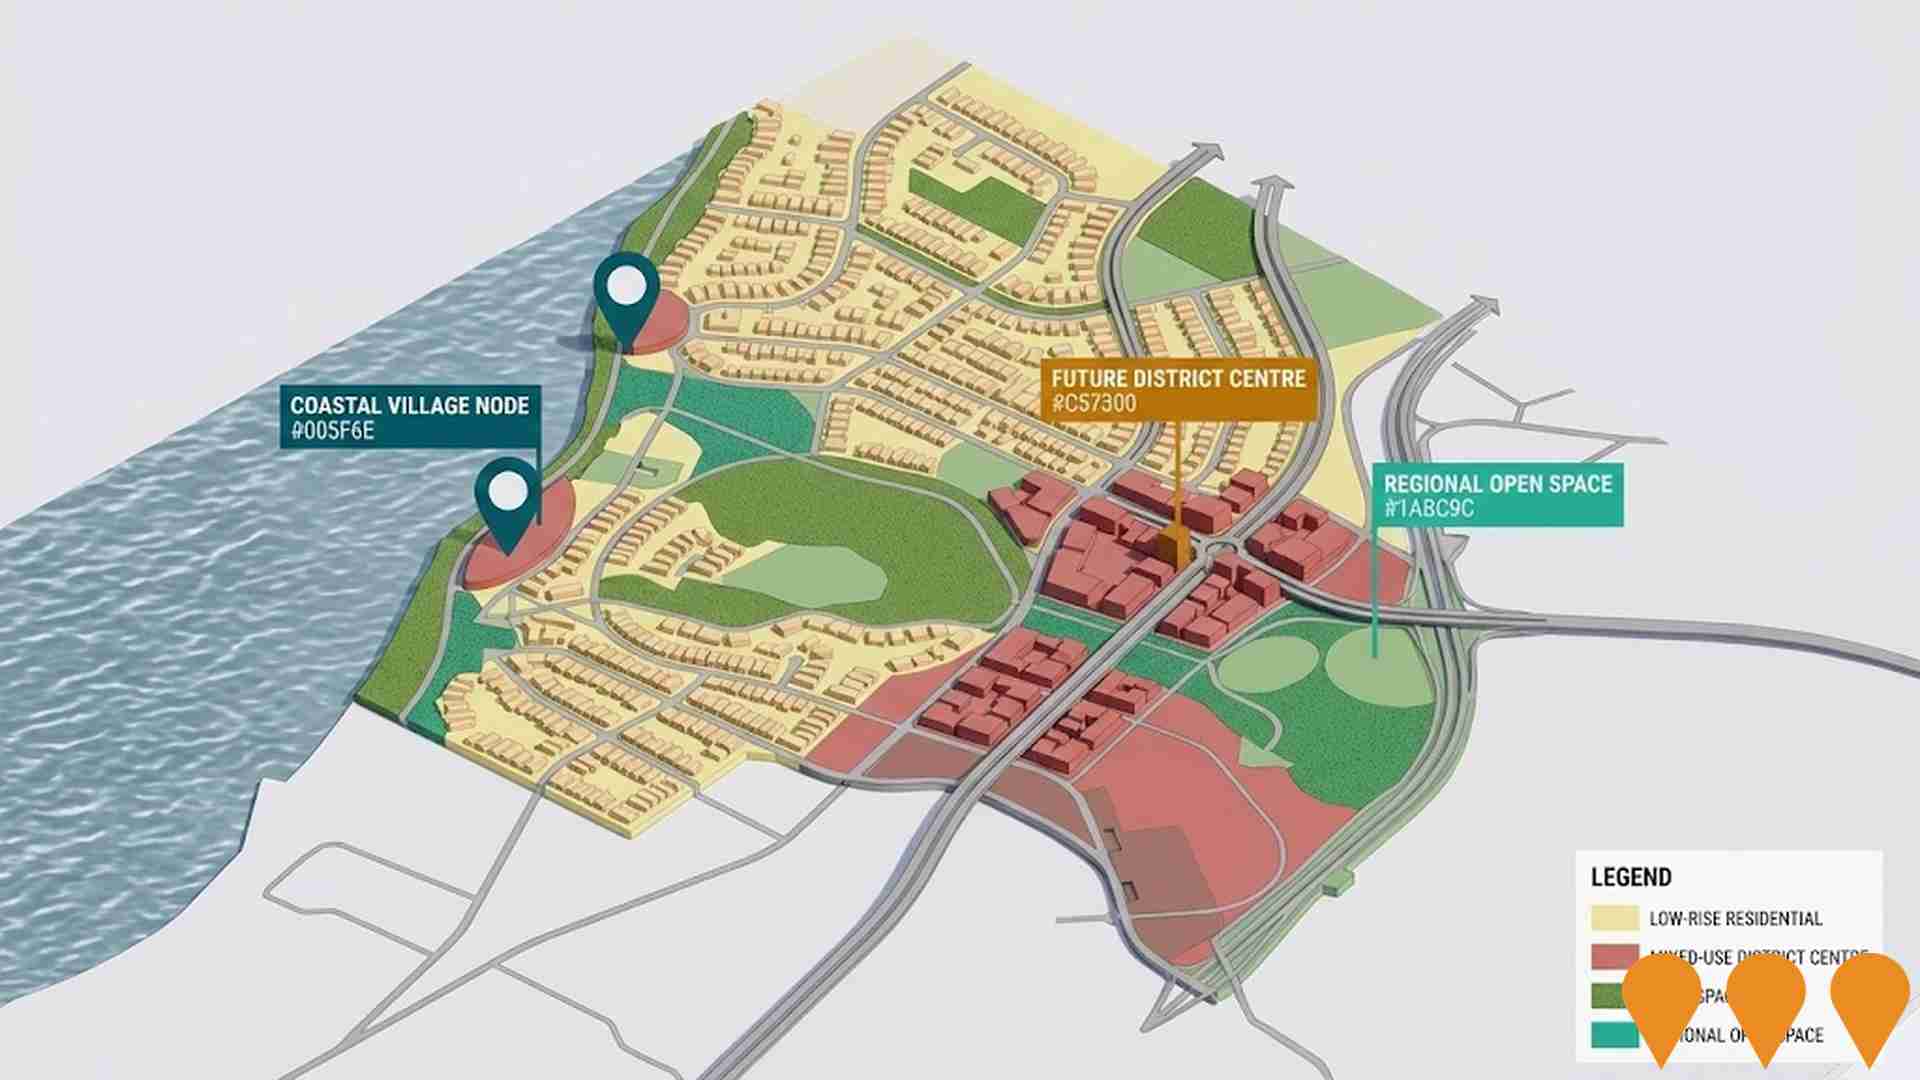
Changes to local infrastructure significantly influence an area's performance. AreaSearch identified 37 projects likely impacting the region. Notable projects include ASCEND Industrial Estate at Jandakot Airport, Cockburn Wetlands Precinct Redevelopment, Perth Surf Park, and Jandakot City. The following list details those most relevant.
Professional plan users can use the search below to filter and access additional projects.
INFRASTRUCTURE SEARCH
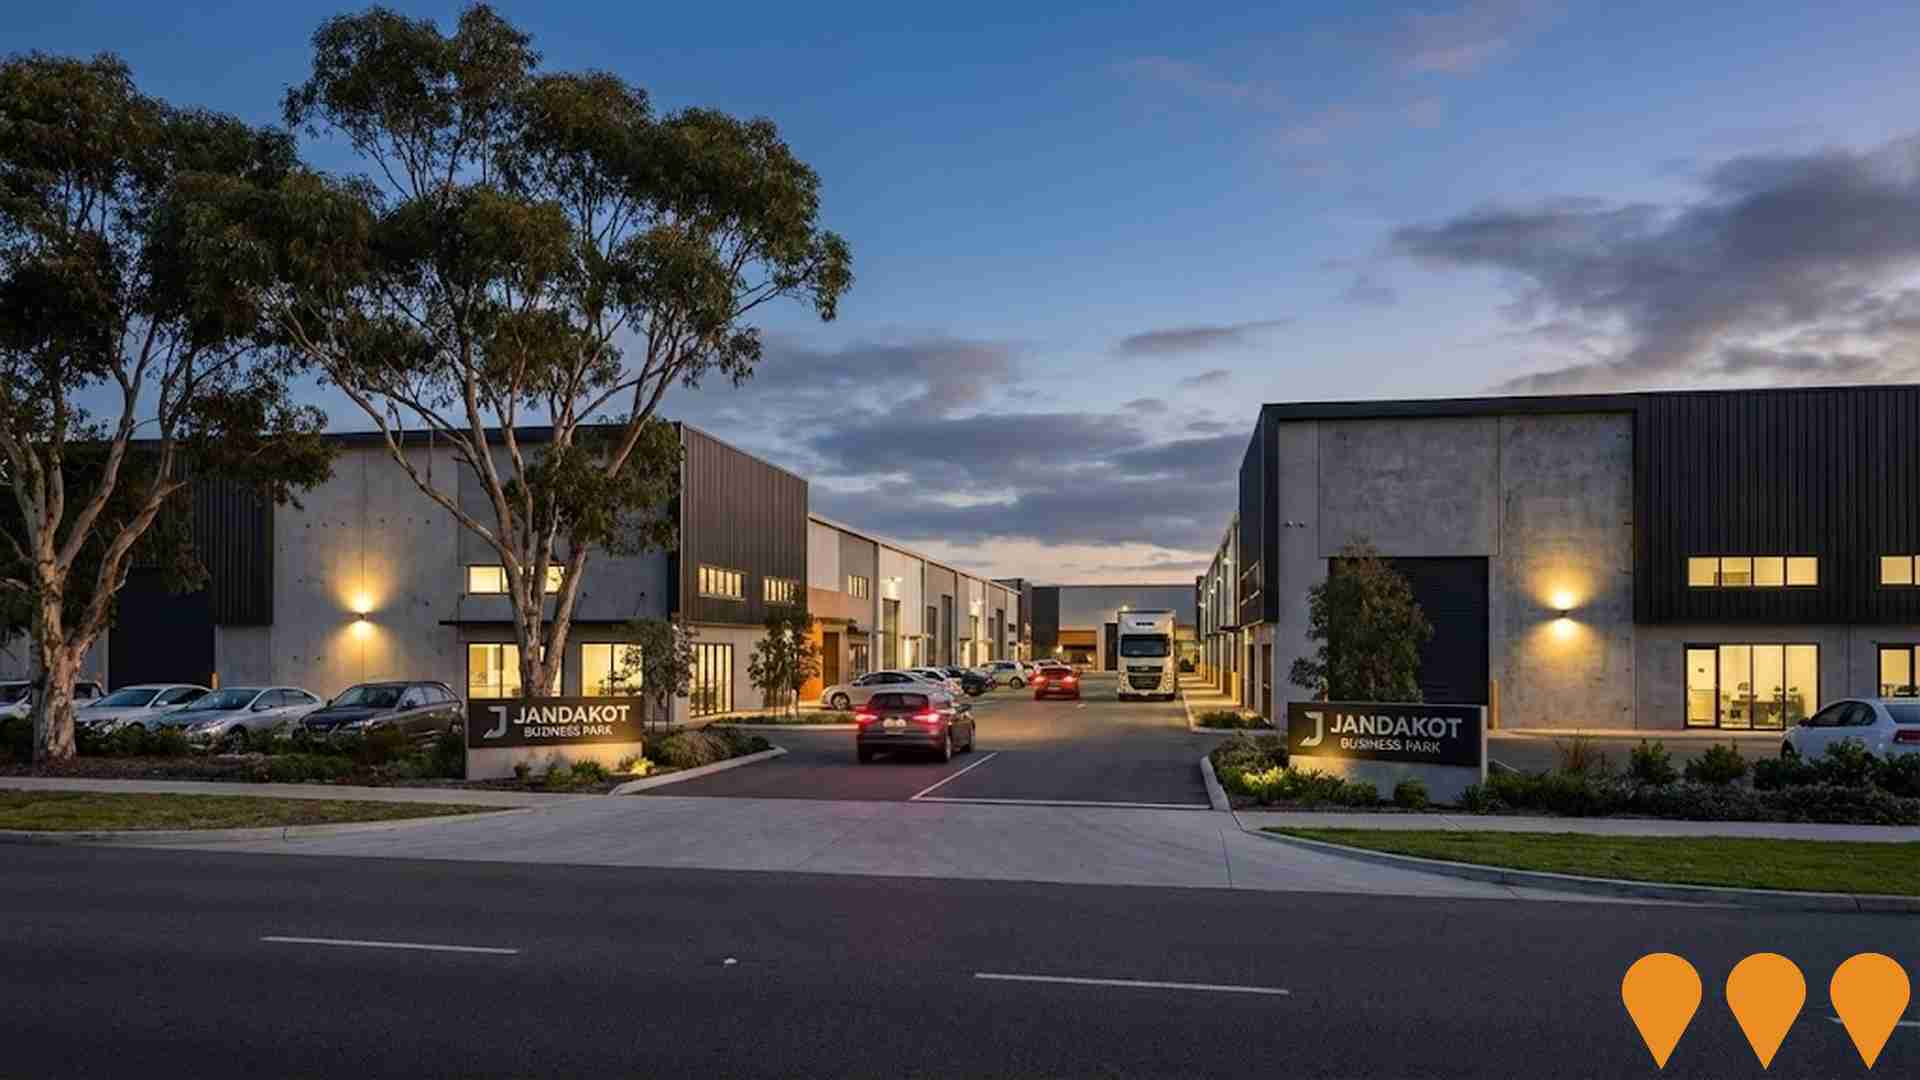
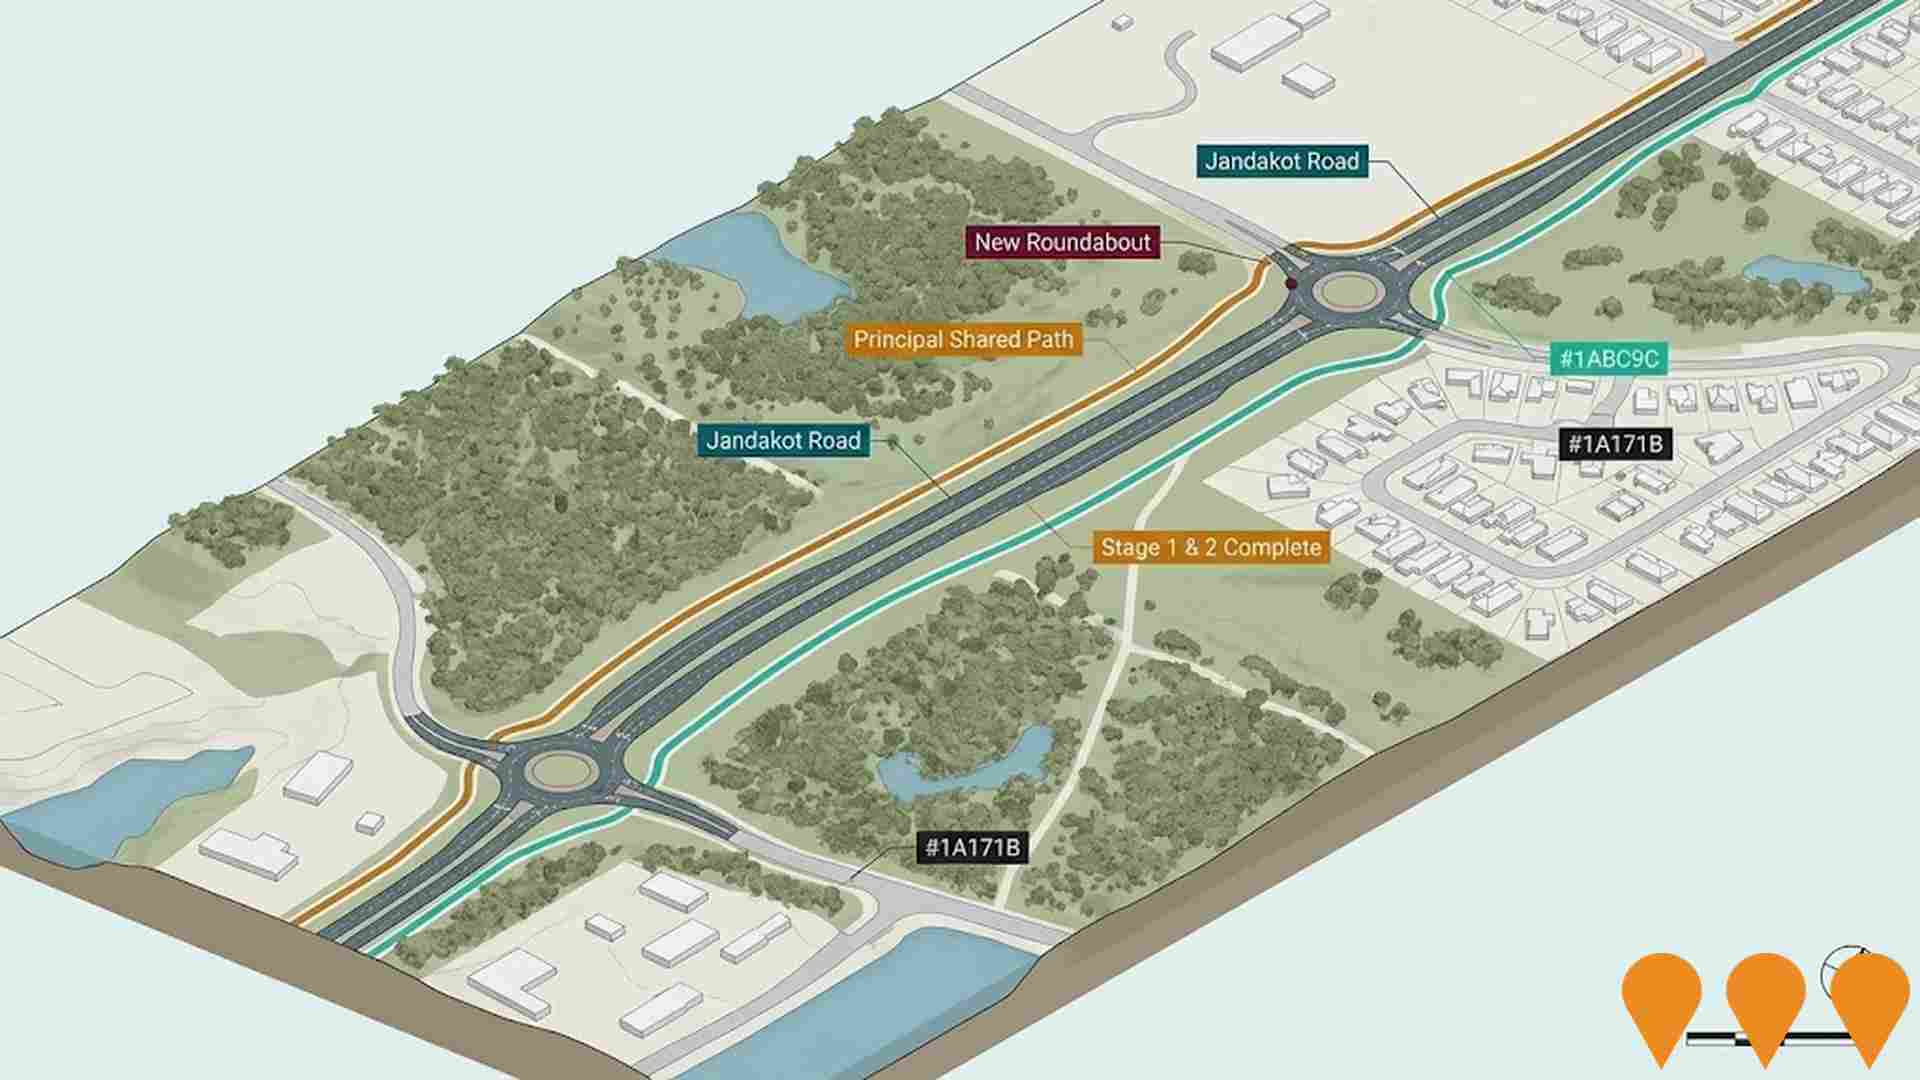
 Denotes AI-based impression for illustrative purposes only, not to be taken as definitive under any circumstances. Please follow links and conduct other investigations from the project's source for actual imagery. Developers and project owners wishing us to use original imagery please Contact Us and we will do so.
Frequently Asked Questions - Infrastructure
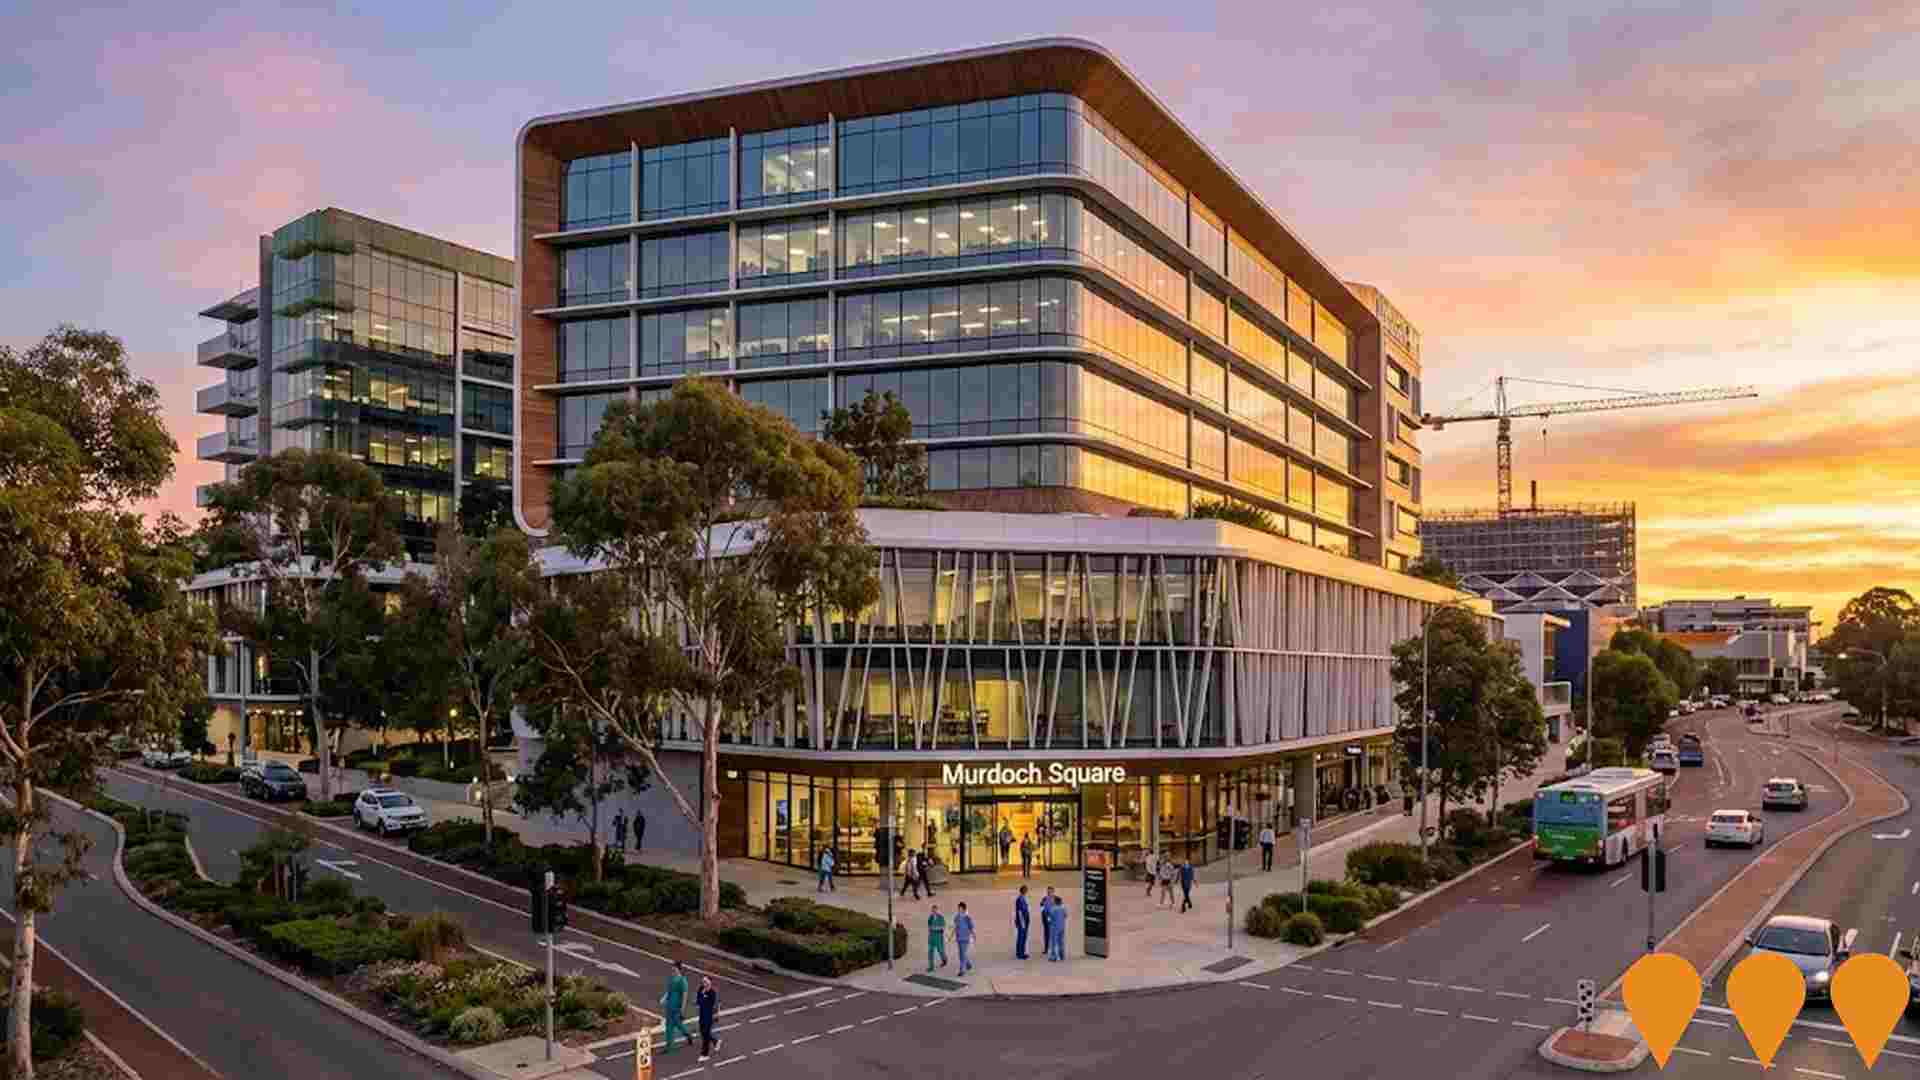
Murdoch Health and Knowledge Precinct
A 9.6 hectare mixed use health, research and education precinct within the Murdoch Activity Centre anchored by the Stage 1 delivery of Murdoch Square. Murdoch Square, a $450 million mixed use healthcare precinct, opened in 2024 with five buildings above a shared three level basement, including aged care, specialist medical suites, a private hospital, WA's first Medihotel, a Courtyard by Marriott hotel, childcare, commercial offices and retail. Subsequent stages within the wider precinct are progressing, with development applications approved for additional medical facilities, a 24 storey social and affordable build to rent tower of 216 dwellings and further commercial uses, and future land releases subject to relocation of the Murdoch Station park and ride facility and associated infrastructure upgrades.
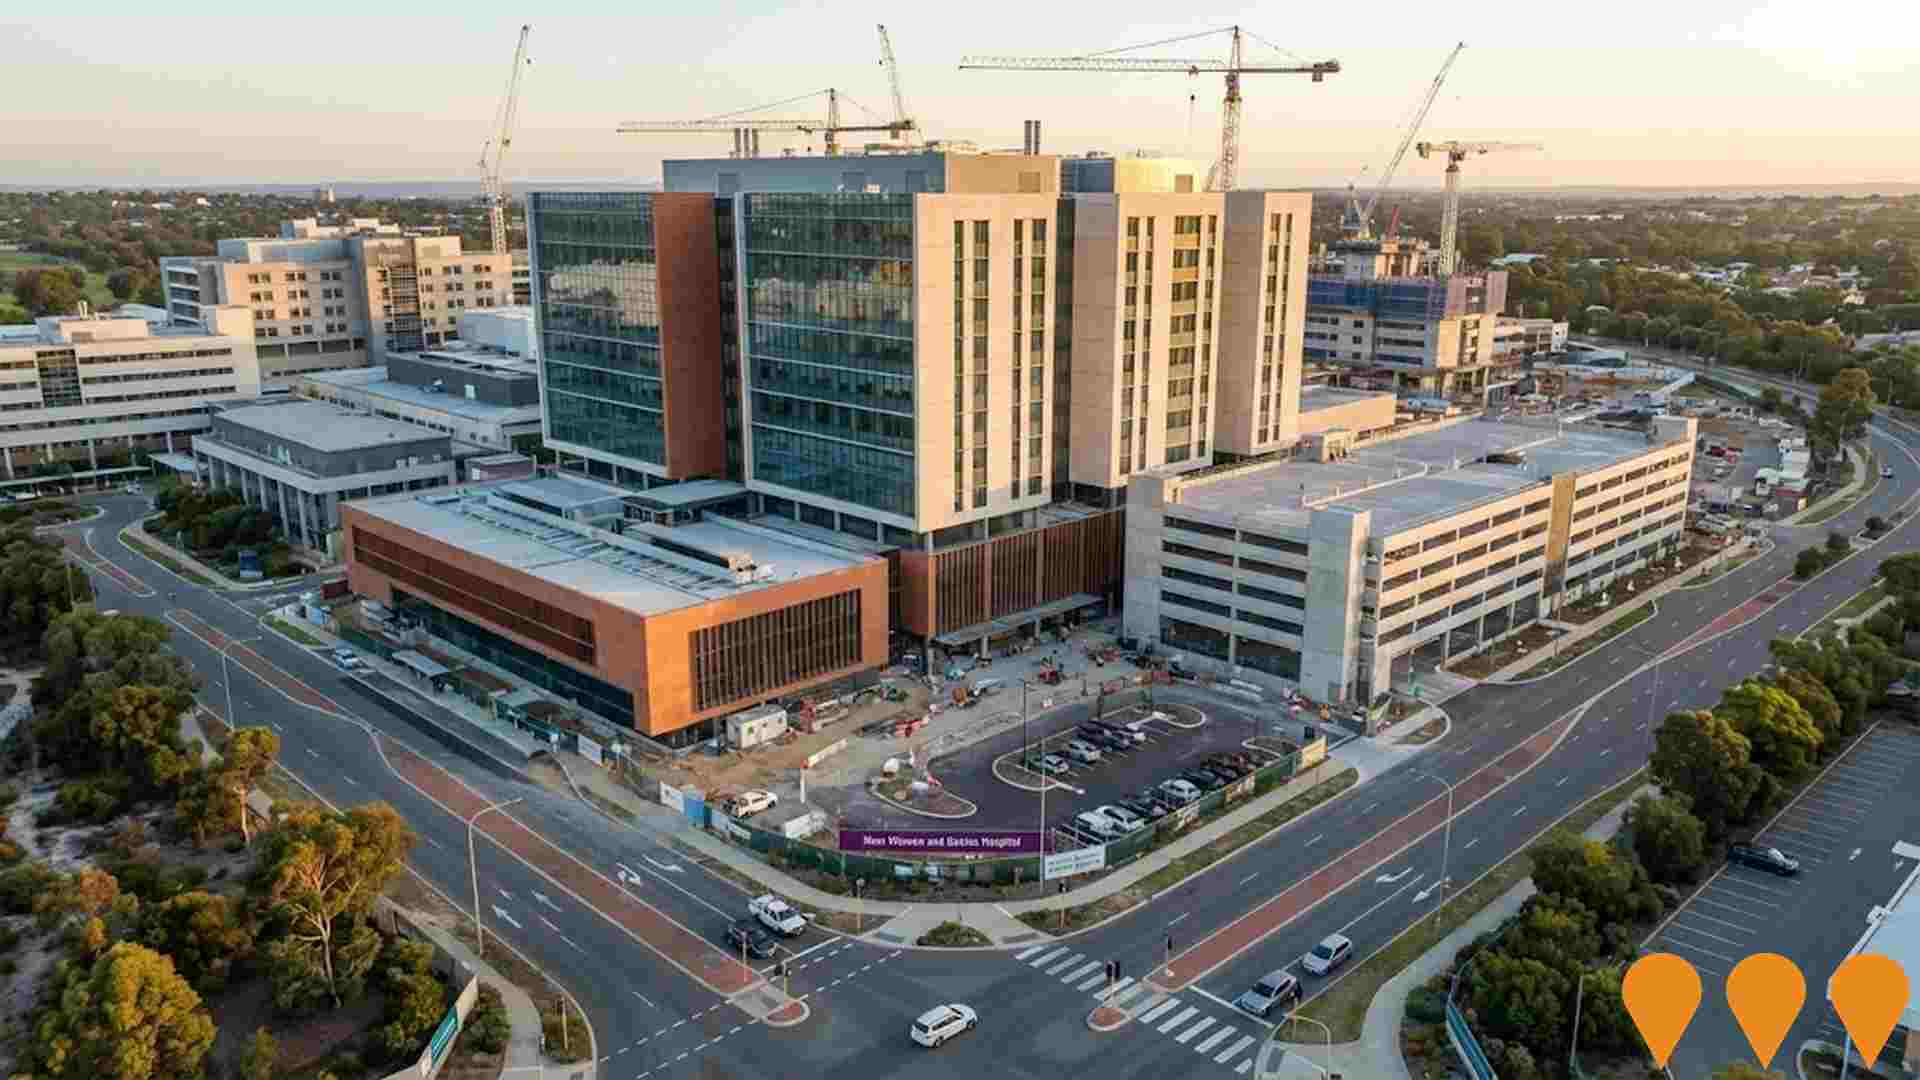
New Women and Babies Hospital
A 1.8 billion Western Australian Government project delivering a new 12 storey, 274 bed Women and Babies Hospital within the Fiona Stanley Hospital precinct at Murdoch, together with expansions to Osborne Park Hospital and Perth Children's Hospital. The new hospital will replace King Edward Memorial Hospital and provide inpatient maternity and gynaecology services, a neonatology unit, operating theatres, a family birth centre and outpatient clinics. The project also includes two new multi deck car parks and associated road and parking upgrades within the precinct. Construction is now underway, led by Webuild as managing contractor alongside the Office of Major Infrastructure Delivery, with completion targeted for 2029 and more than 1,400 jobs during construction.
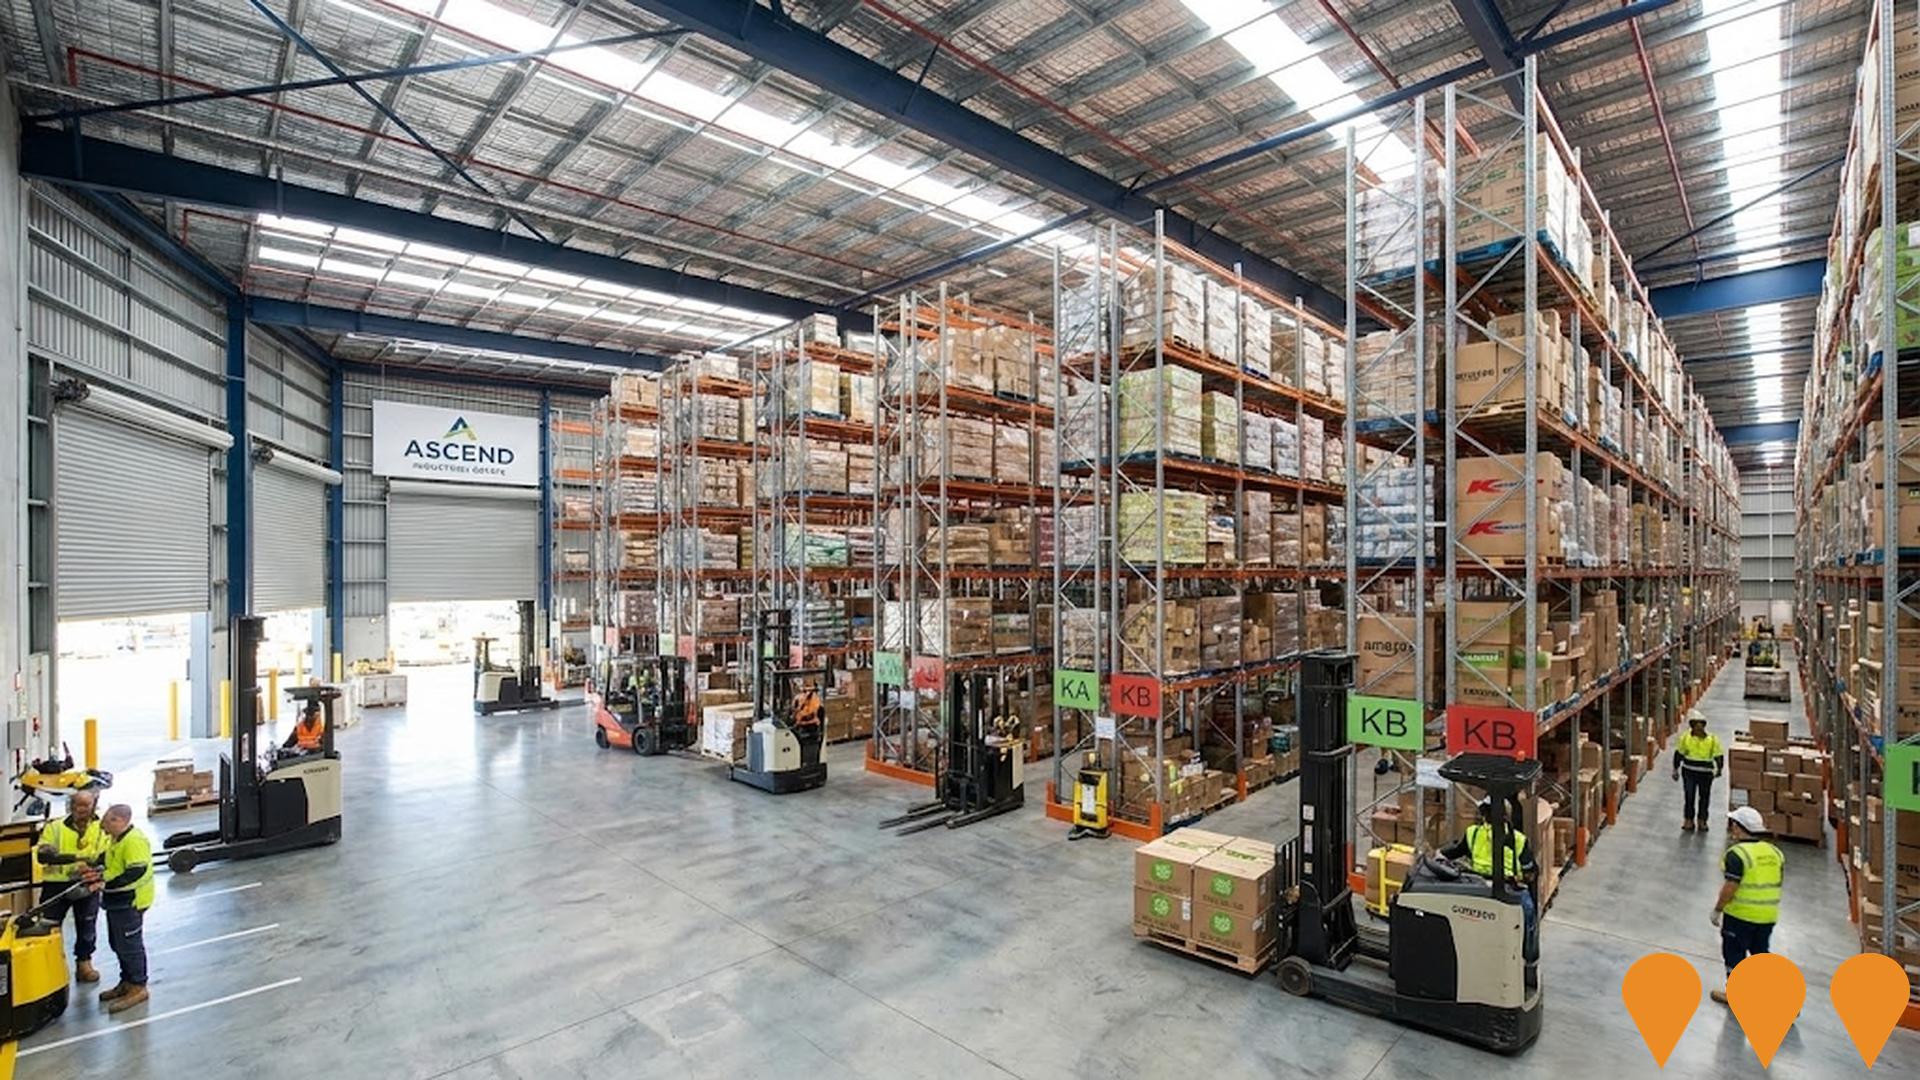
ASCEND Industrial Estate at Jandakot Airport
A major 62-hectare industrial and logistics precinct located within Jandakot Airport, offering unrivalled connectivity to Roe Highway and Kwinana Freeway. The estate features flexible lot sizes, custom warehousing solutions, and 5-star Green Star rated facilities with significant solar and battery storage integration. Key tenants include Amazon, Kmart, Aldi, HelloFresh, and Marley Spoon.
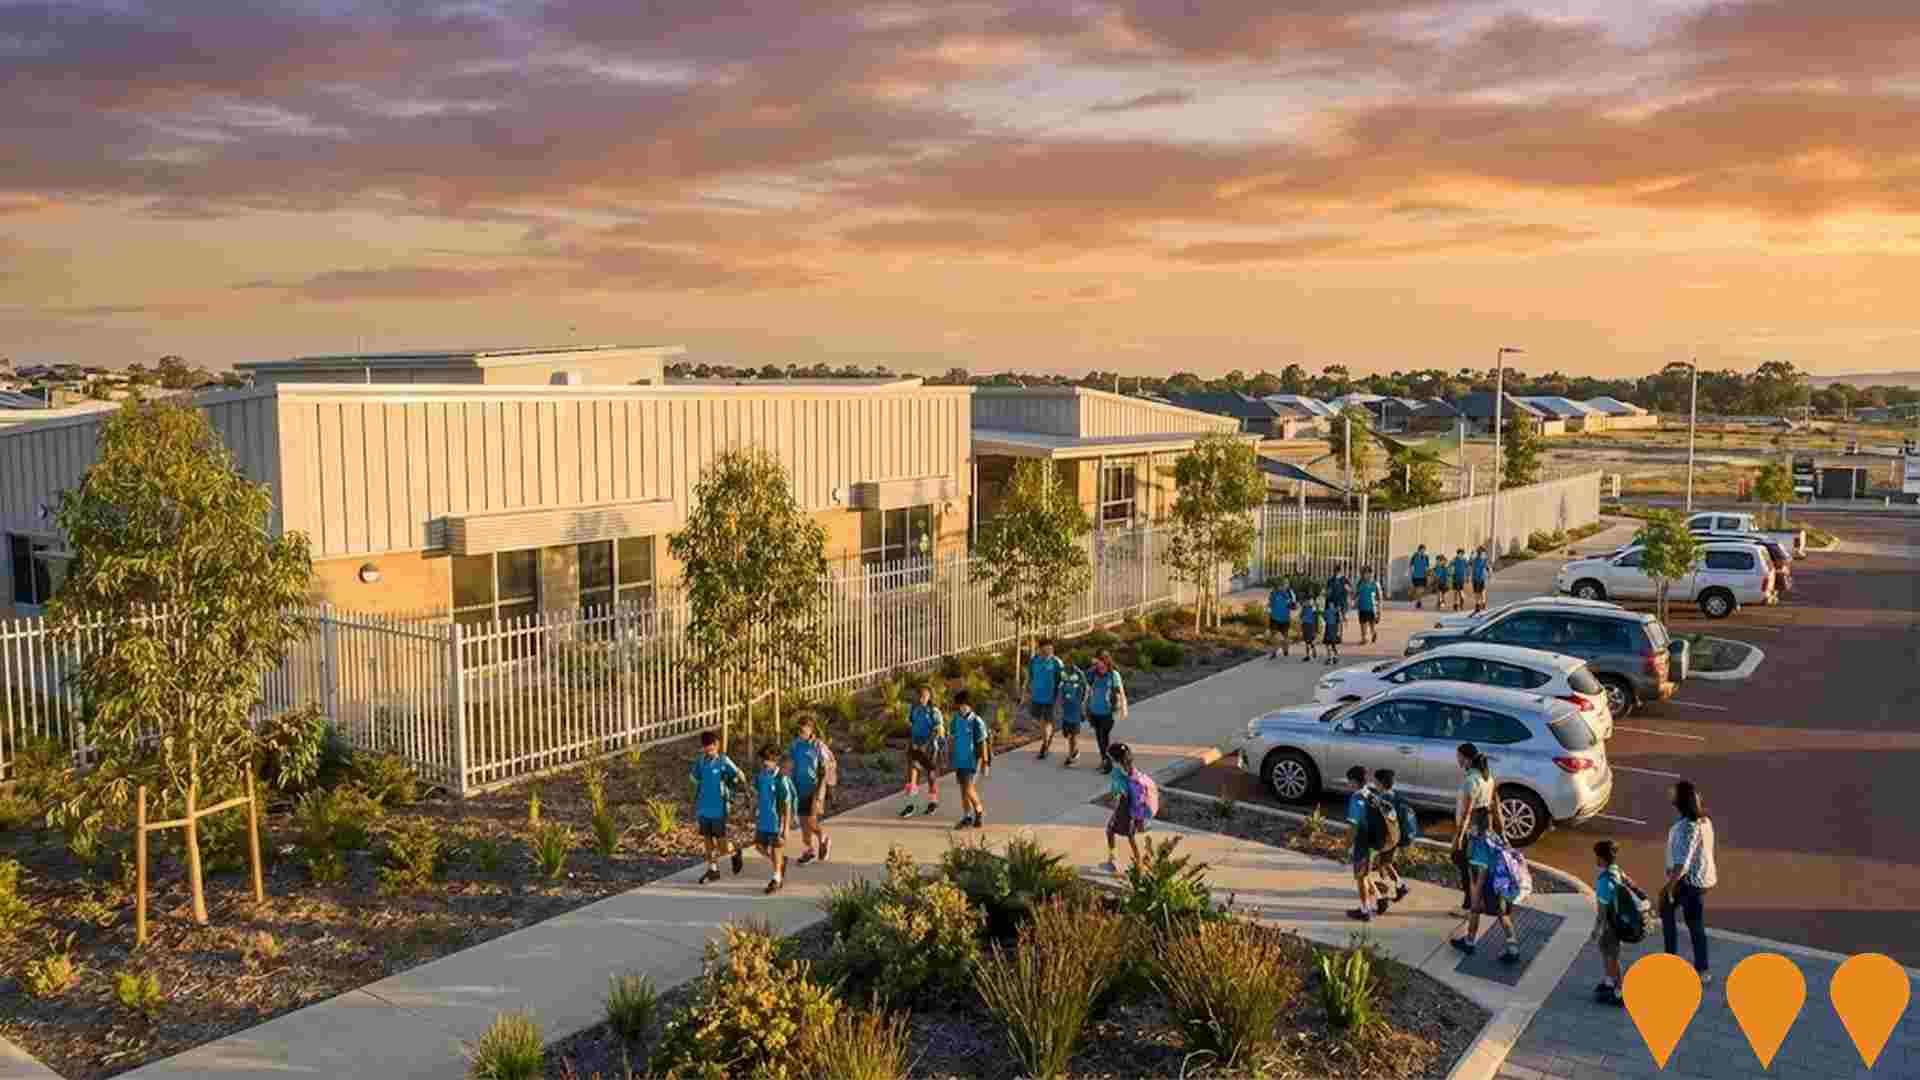
Treeby Primary School (Future)
Planned public primary school within Calleya Estate to serve the growing Treeby and surrounding community.
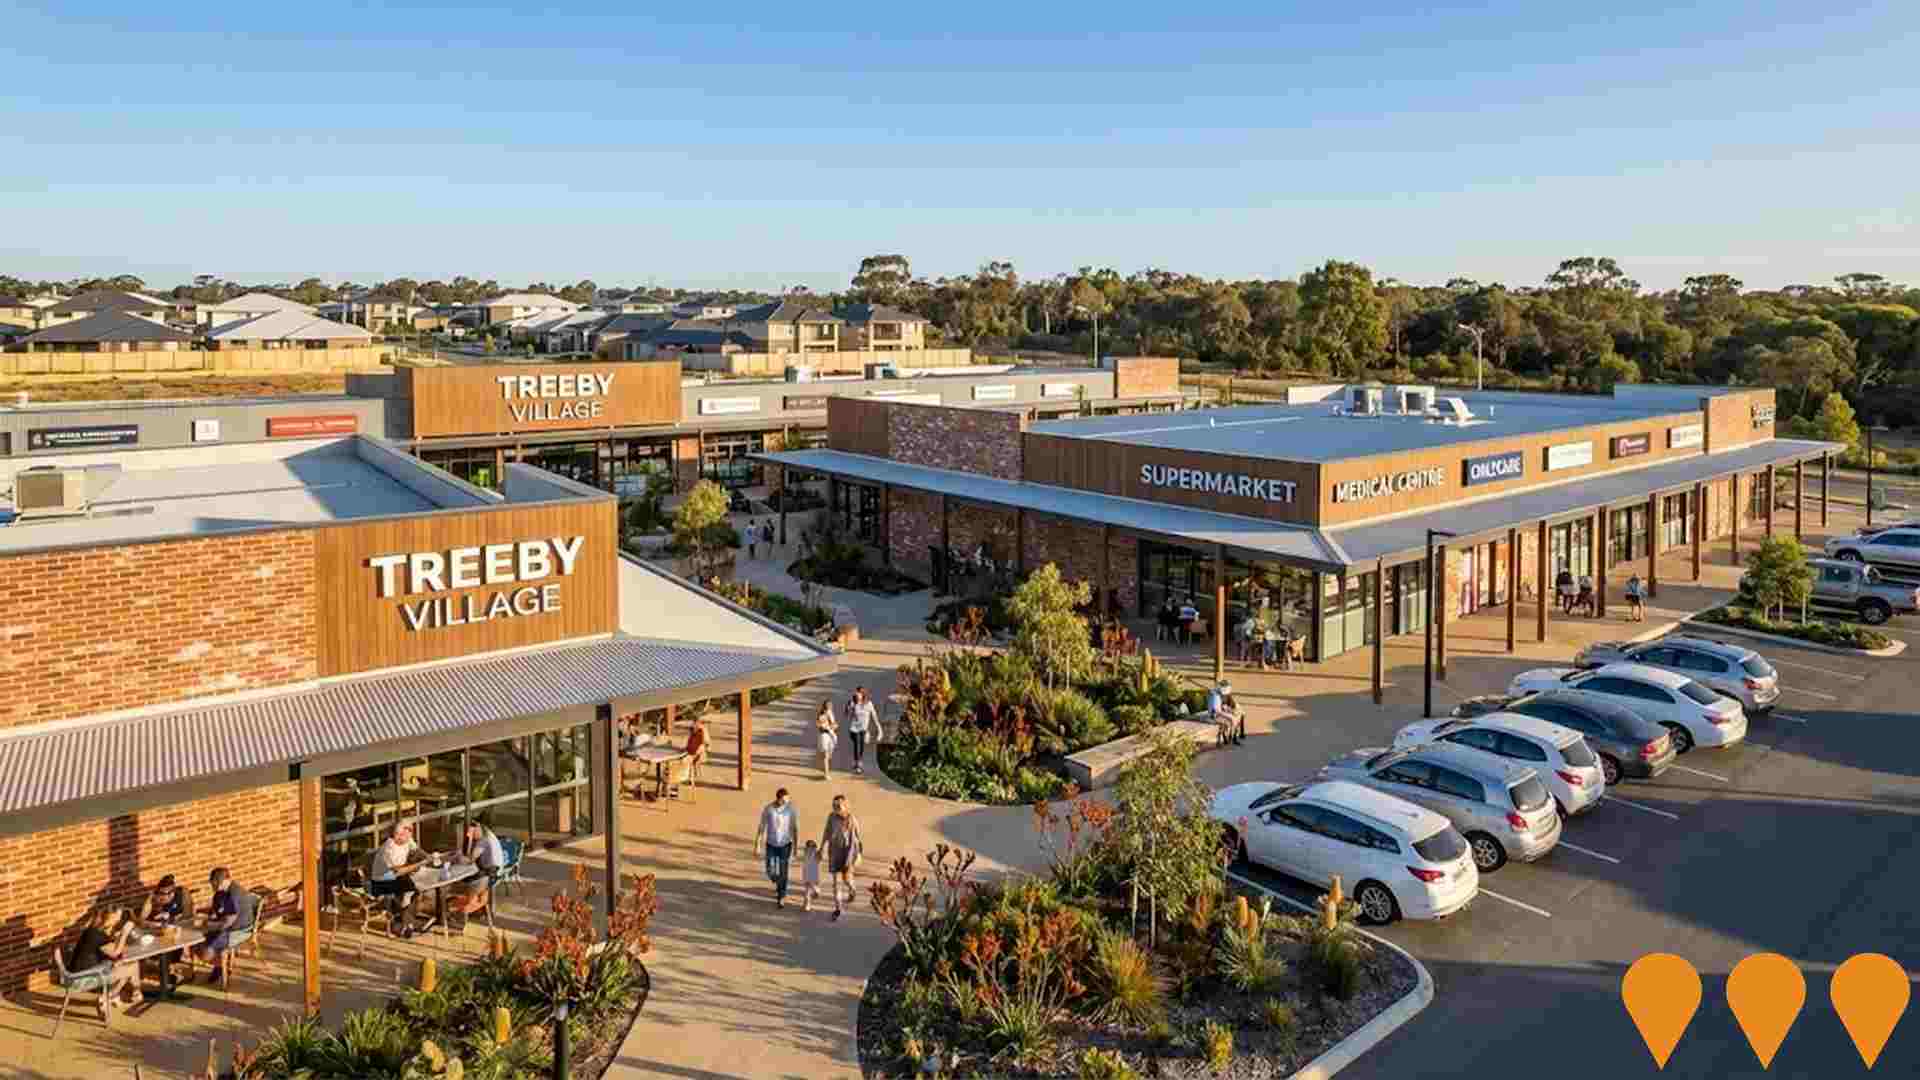
Treeby Village
Future neighbourhood retail centre within Calleya Estate including supermarket, specialty stores, medical centre, and childcare facility.
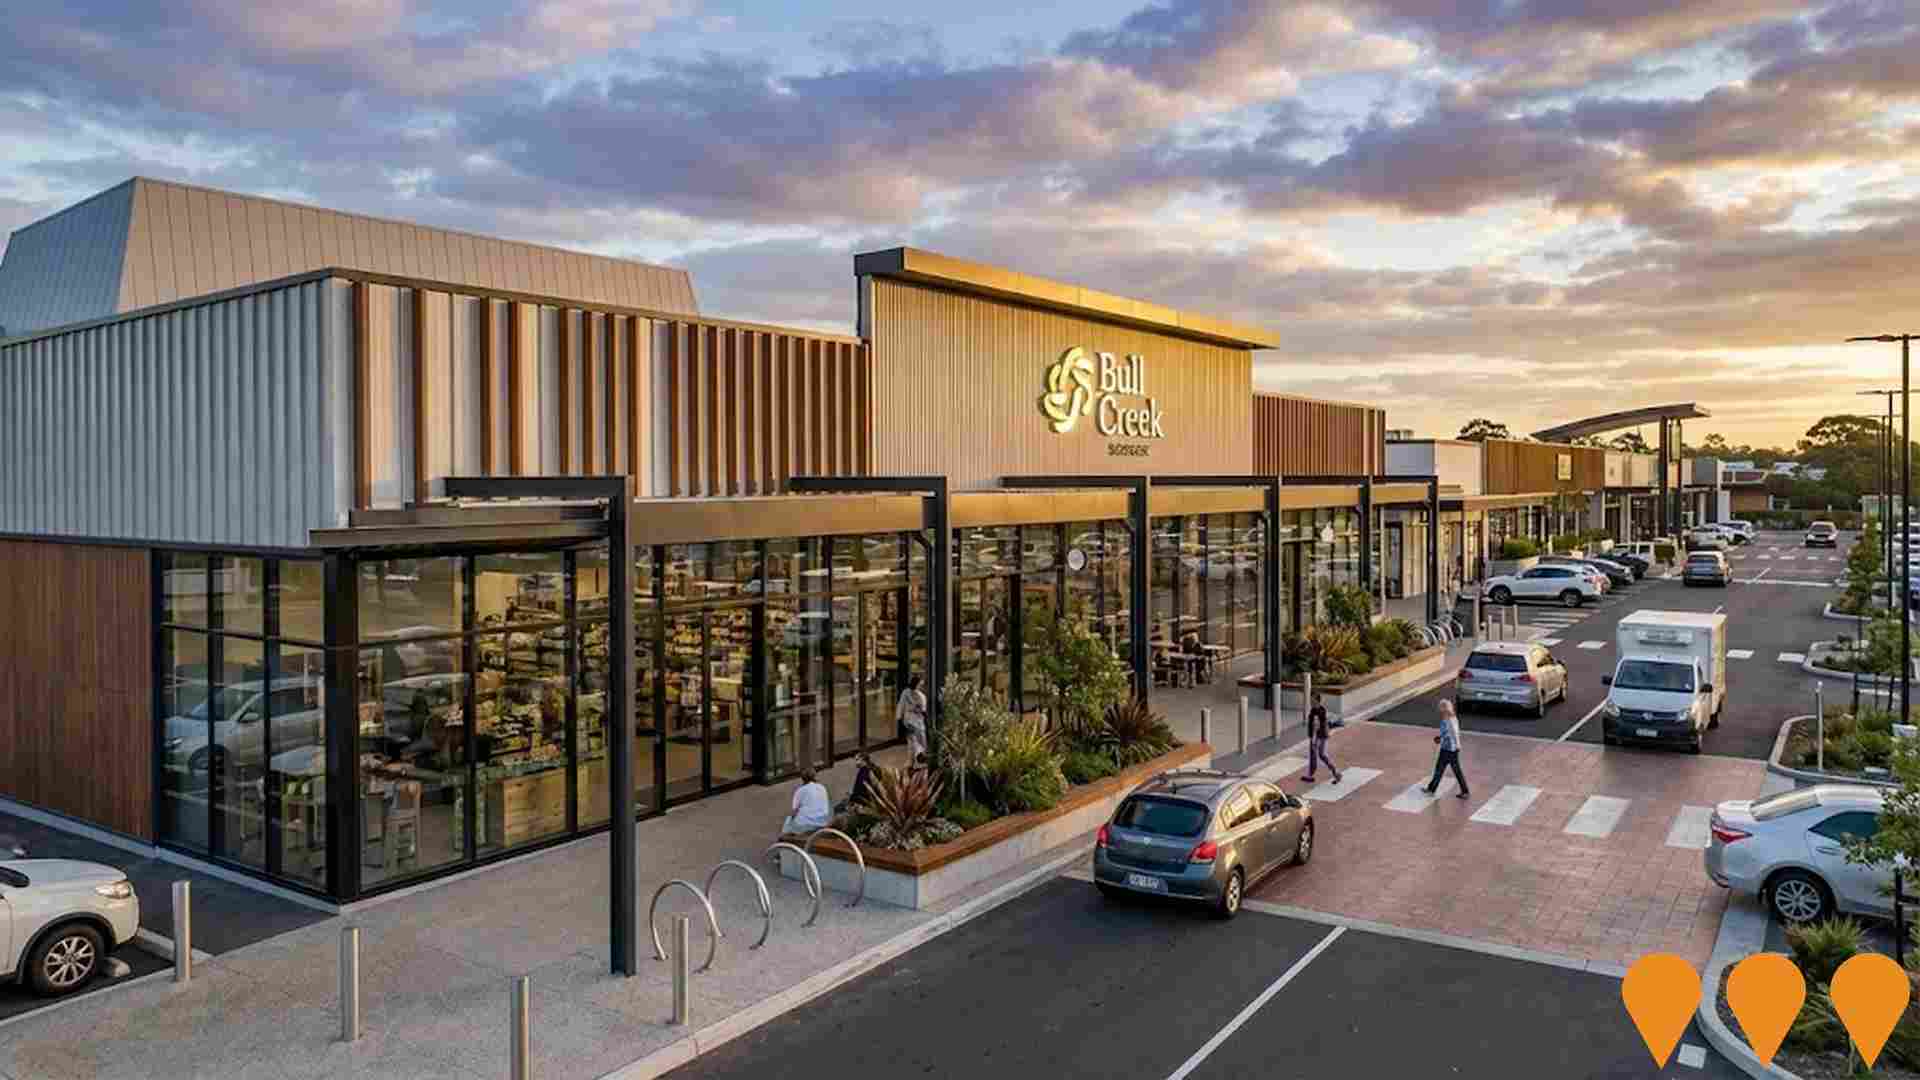
Stockland Bull Creek Shopping Centre Upgrade
Major upgrade and expansion of Bull Creek Shopping Centre (sold by Stockland to Silverleaf Investments in 2022 for $78 million). Includes new retail spaces, dining options, improved accessibility and modernized facilities.
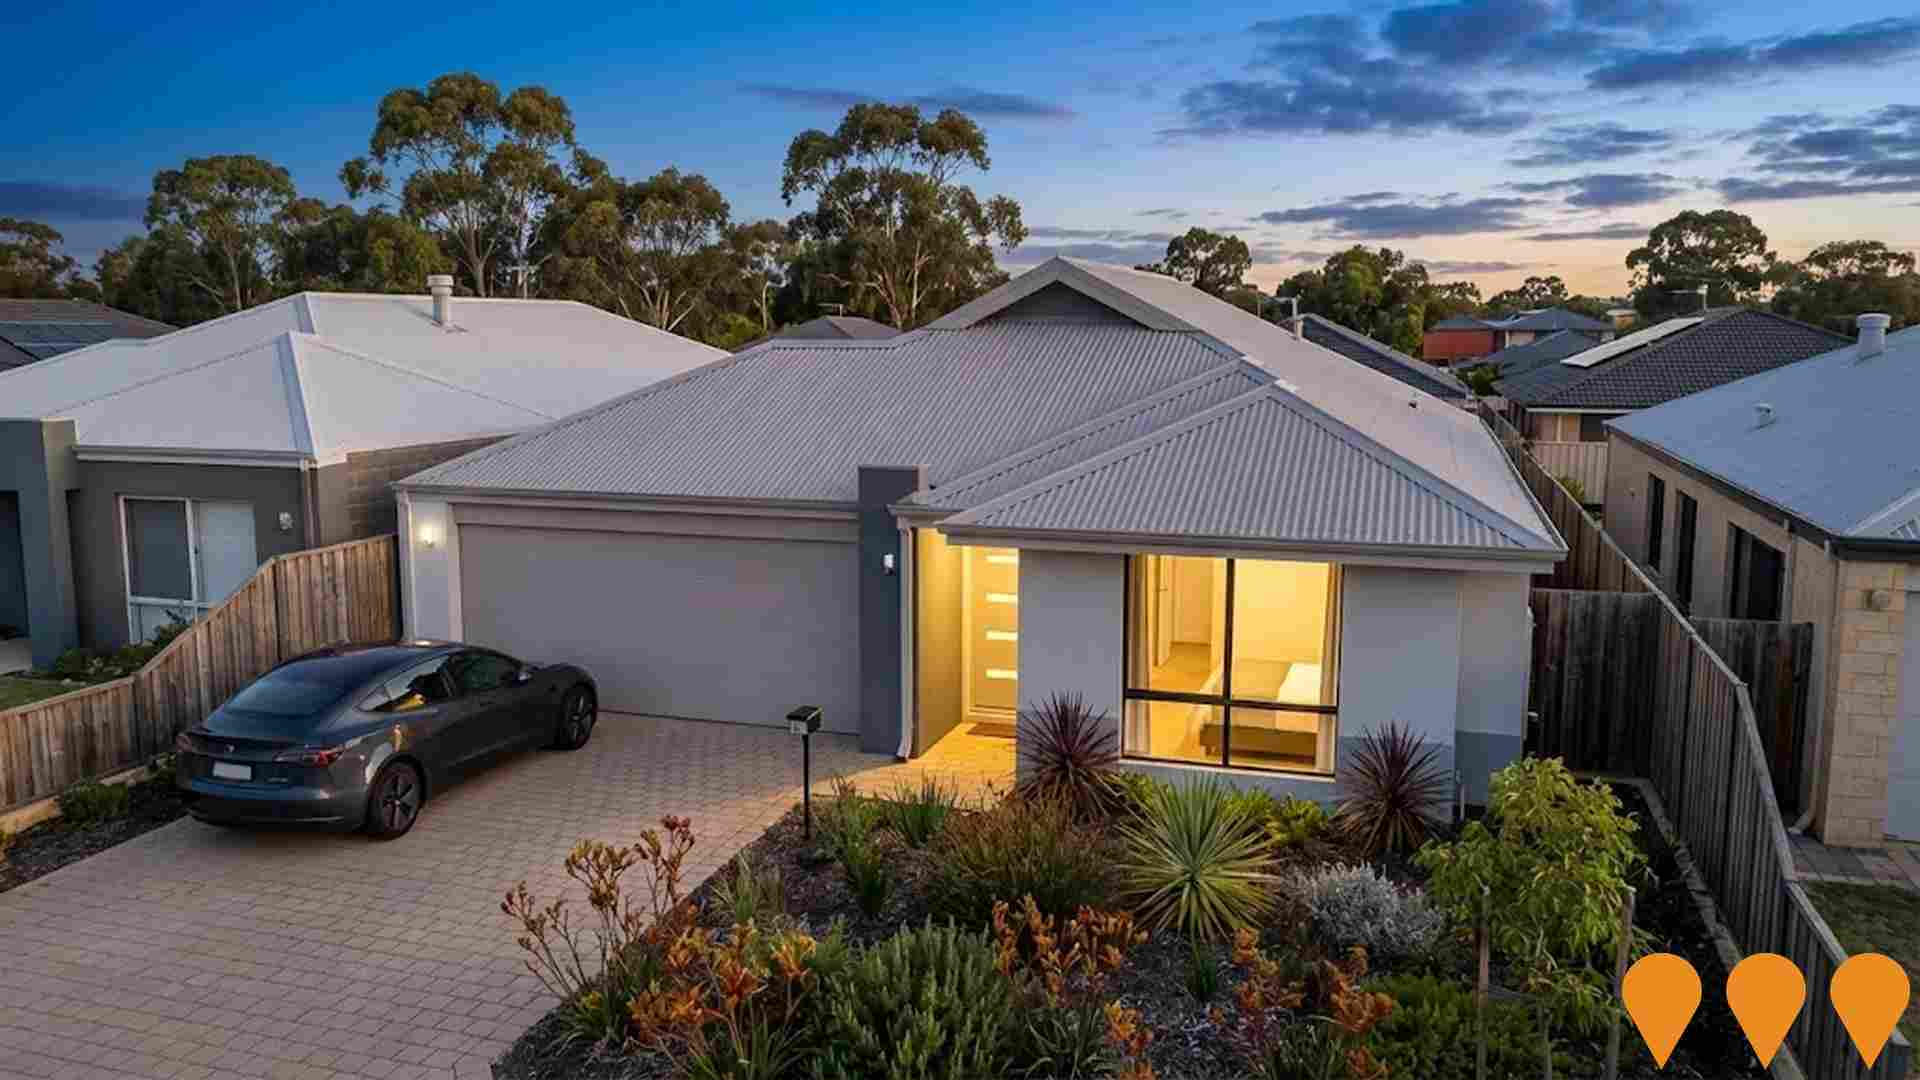
Provence Estate
Premium residential estate in Treeby featuring large lots, landscaped parks, and proximity to future amenities within the growing Treeby community.
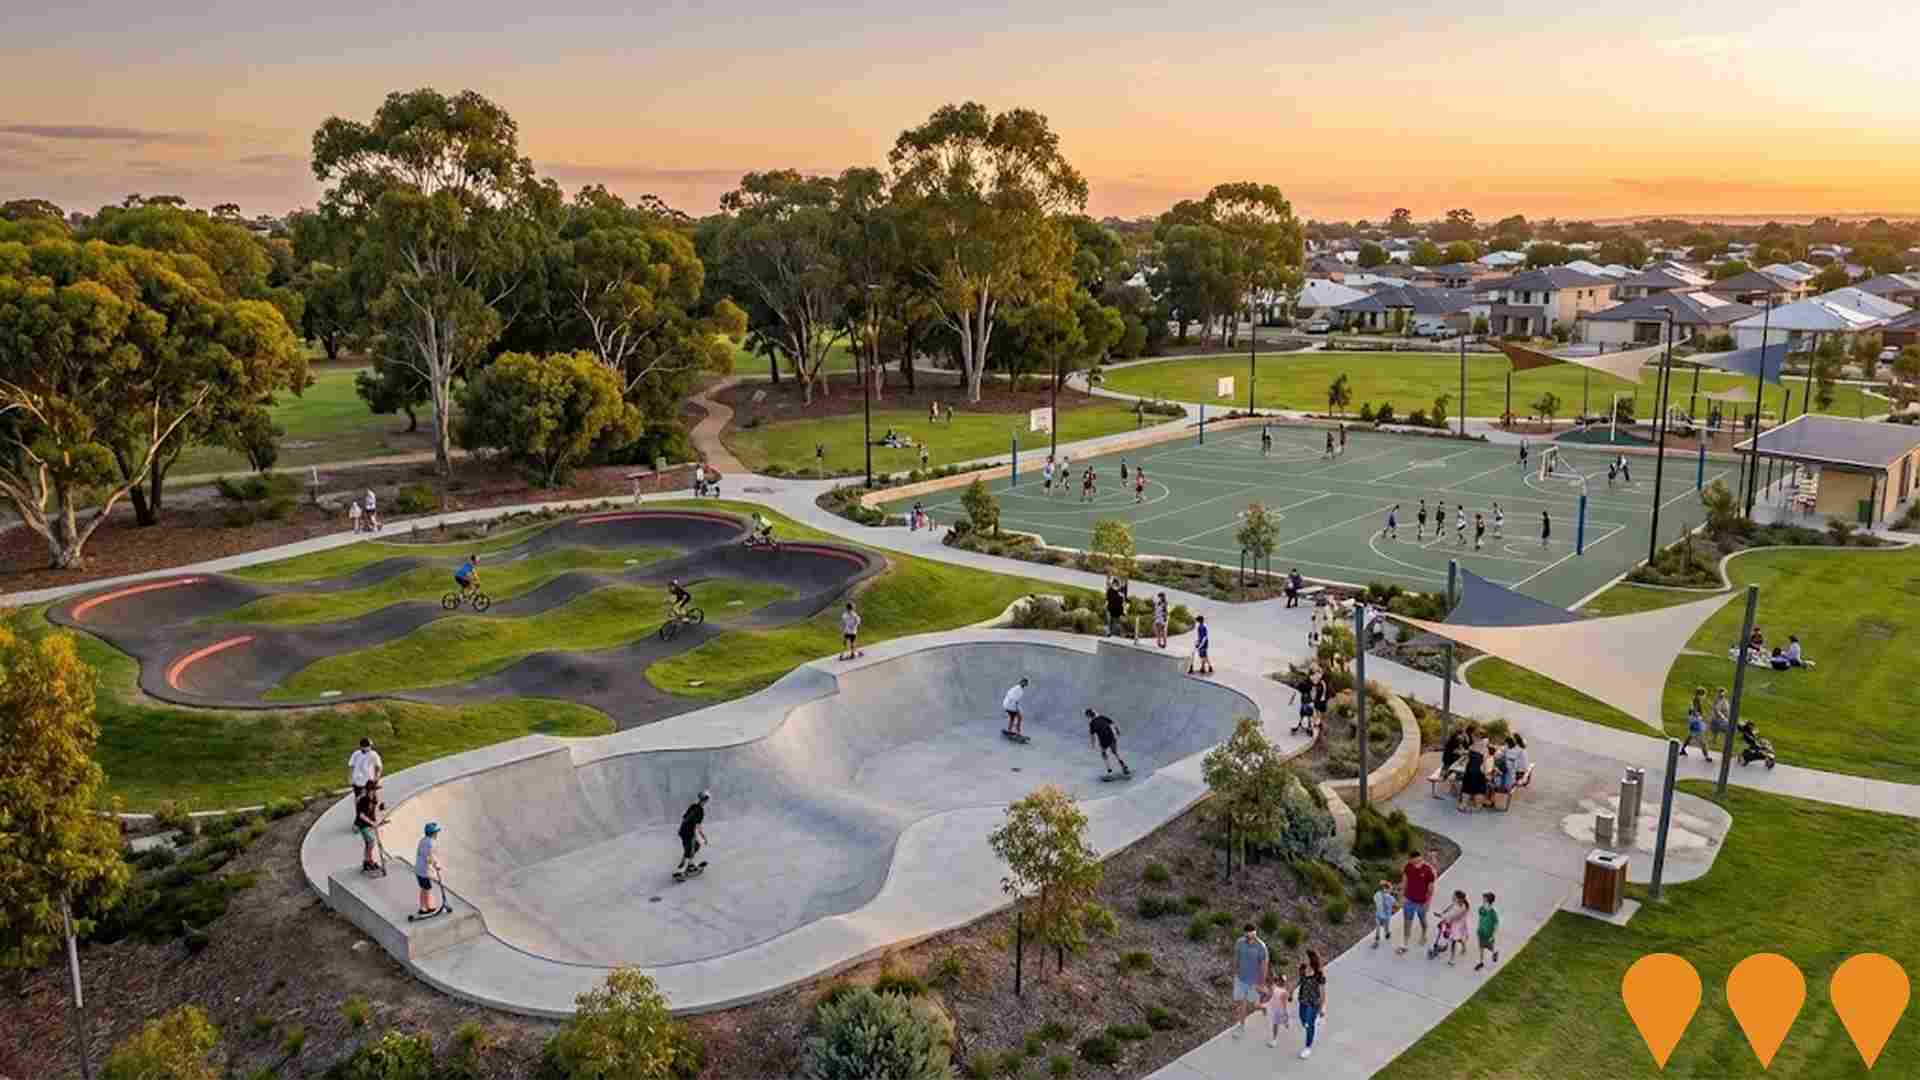
Prinsep Park Development
Redevelopment of Prinsep Park on the former Glen Iris Golf Course site to provide active open space and recreation infrastructure such as a skate park, pump track, and outdoor courts. This is identified as an infrastructure proposal in the City of Cockburn's adopted Community Infrastructure Plan 2024-2041, to address population growth from nearby residential expansions.
Employment
AreaSearch analysis of employment trends sees Jandakot performing better than 85% of local markets assessed across Australia
Jandakot has a skilled workforce with essential services sectors well represented. The unemployment rate was 2.3% in the past year, with an estimated employment growth of 3.8%.
As of September 2025, 1,661 residents are employed, with an unemployment rate of 1.7%, below Greater Perth's rate of 4.0%. Workforce participation is at 68.7%, compared to Greater Perth's 65.2%. Leading employment industries include health care & social assistance, education & training, and retail trade. Education & training has a notable concentration with employment levels at 1.3 times the regional average.
Accommodation & food services have limited presence at 4.5%, compared to the regional average of 6.8%. There are 3.7 workers for every resident, indicating that Jandakot functions as an employment hub hosting more jobs than residents and attracting workers from surrounding areas. Between September 2024 and September 2025, employment increased by 3.8% while labour force increased by 4.3%, causing the unemployment rate to rise by 0.5 percentage points. In comparison, Greater Perth saw employment grow by 2.9%. State-level data as of 25-Nov-25 shows WA employment contracted by 0.27%, with a state unemployment rate of 4.6% compared to the national rate of 4.3%. National employment forecasts from May-25 suggest that while national employment is projected to expand by 6.6% over five years and 13.7% over ten years, growth rates differ significantly between industry sectors. Applying these projections to Jandakot's employment mix suggests local employment should increase by 6.3% over five years and 13.4% over ten years.
Frequently Asked Questions - Employment
Income
Income metrics indicate excellent economic conditions, with the area achieving higher performance than 75% of national locations assessed by AreaSearch
Jandakot SA2's median income among taxpayers was $62,060 and average income stood at $74,075 in financial year 2022. These figures were higher than Greater Perth's median of $58,380 and average of $78,020. By September 2025, estimates suggest the median income would be approximately $70,873 and average income $84,594, based on a 14.2% Wage Price Index growth since financial year 2022. According to the 2021 Census, household incomes ranked at the 84th percentile with $2,323 weekly. Income analysis showed that 32.9% of the population (1,012 individuals) fell within the $1,500 - $2,999 income range, consistent with broader trends across the region where 32.0% were in the same category. Notably, 37.2% earned above $3,000 weekly, indicating prosperity pockets driving local economic activity. After housing costs, residents retained 87.7% of their income, reflecting strong purchasing power. The area's SEIFA income ranking placed it in the 8th decile.
Frequently Asked Questions - Income
Housing
Jandakot is characterized by a predominantly suburban housing profile, with above-average rates of outright home ownership
In Jandakot, as per the latest Census evaluation, 98.6% of dwellings were houses, with the remaining 1.5% being semi-detached, apartments, or other types. This contrasts with Perth metro's figures of 81.2% houses and 18.8% other dwellings. Home ownership in Jandakot stood at 41.3%, with mortgaged dwellings at 45.9% and rented ones at 12.8%. The median monthly mortgage repayment in the area was $2,167, higher than Perth metro's average of $1,950. The median weekly rent figure in Jandakot was $443, compared to Perth metro's $370. Nationally, Jandakot's mortgage repayments were significantly higher at $2,167 versus the Australian average of $1,863, and rents were substantially above the national figure of $375.
Frequently Asked Questions - Housing
Household Composition
Jandakot features high concentrations of family households, with a higher-than-average median household size
Family households constitute 85.3% of all households, including 41.7% couples with children, 32.9% couples without children, and 8.9% single parent families. Non-family households account for the remaining 14.7%, with lone person households at 14.1% and group households comprising 1.3%. The median household size is 2.8 people, which is larger than the Greater Perth average of 2.6.
Frequently Asked Questions - Households
Local Schools & Education
Jandakot performs slightly above the national average for education, showing competitive qualification levels and steady academic outcomes
University qualification levels in Jandakot stand at 28.0%, slightly below the Australian average of 30.4%. Bachelor degrees are most common at 19.1%, followed by postgraduate qualifications (5.4%) and graduate diplomas (3.5%). Vocational credentials, including advanced diplomas (12.9%) and certificates (23.8%), are held by 36.7% of residents aged 15 and above.
Educational participation is high, with 25.8% of residents currently enrolled in formal education. This includes 8.7% in secondary education, 7.9% in primary education, and 5.8% pursuing tertiary education.
Frequently Asked Questions - Education
Schools Detail
Nearby Services & Amenities
Transport
Transport servicing is good compared to other areas nationally based on assessment of service frequency, route connectivity and accessibility
Transport analysis indicates 14 active transport stops in Jandakot, served by a mix of bus routes. These stops are covered by 6 individual routes, offering a total of 1,048 weekly passenger trips. Residents have moderate access to public transport, with an average distance of 490 meters to the nearest stop.
Service frequency averages 149 trips per day across all routes, translating to approximately 74 weekly trips per stop.
Frequently Asked Questions - Transport
Transport Stops Detail
Health
Jandakot's residents are extremely healthy with both young and old age cohorts seeing low prevalence of common health conditions
Analysis of health metrics shows strong performance throughout Jandakot.
Both young and old age cohorts experience low prevalence of common health conditions. The rate of private health cover is very high at approximately 56% of the total population (~1,739 people). The most common medical conditions are arthritis and mental health issues, impacting 6.7 and 6.2% of residents respectively. Seventy-one point seven percent declare themselves completely clear of medical ailments, compared to 72.9% across Greater Perth. Twenty point eight percent of residents are aged 65 and over (639 people), which is higher than the 14.8% in Greater Perth. Health outcomes among seniors perform even better than the general population in health metrics.
Frequently Asked Questions - Health
Cultural Diversity
The level of cultural diversity witnessed in Jandakot was found to be above average when compared nationally for a number of language and cultural background related metrics
Jandakot's population showed higher linguistic diversity, with 15.7% speaking a language other than English at home, compared to the regional average of around 3%. Born overseas, 37.5% of Jandakot residents were born outside Australia, compared to approximately 28% in Greater Perth. Christianity was the dominant religion in Jandakot, with 57.7%, slightly higher than the Greater Perth average of 48.5%.
The top three ancestry groups were English (28.7%), Australian (21.7%), and Other (9.7%). Notably, South African ancestry was overrepresented at 2.8% in Jandakot compared to 1.1% regionally, Polish at 1.1% versus 0.7%, and Italian at 5.2% versus 6.6%.
Frequently Asked Questions - Diversity
Age
Jandakot hosts a notably older demographic compared to the national average
Jandakot has a median age of 44, which exceeds Greater Perth's figure of 37 and the national norm of 38. The 65-74 age group is strongly represented at 12.1% compared to Greater Perth, while the 35-44 cohort is less prevalent at 12.3%. Following the Census on 10 August 2021, younger residents have shifted Jandakot's median age down by 1.3 years to 44. Specifically, the 25 to 34 age group grew from 10.3% to 12.7%, and the 75 to 84 cohort increased from 5.1% to 6.9%. Conversely, the 55 to 64 cohort declined from 15.5% to 12.8%, and the 45 to 54 group dropped from 14.7% to 12.7%. By 2041, Jandakot is expected to see significant shifts in its age composition. The 85+ cohort shows the strongest projected growth at 123%, adding 67 residents to reach 123. The aging population dynamic is clear, with those aged 65 and above comprising all of the projected growth. In contrast, both the 0 to 4 and 5 to 14 age groups will see reduced numbers.
