You are viewing the free Snapshot. Dashboard puts rankings, rents, projects and services on one screen, and Full adds every chapter with charts and maps. Dashboard and Full are included with AreaSearch Operator and Pro, or unlocked by the area's Area Expert. You need to log in to open them.
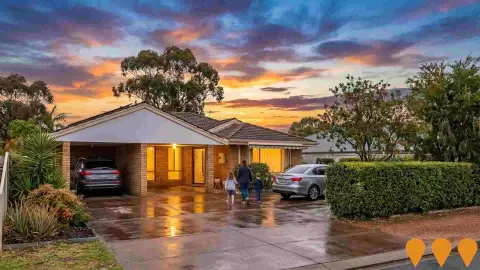
The suburb of Kardinya is located 13 kilometres south-southwest from Perth CBD. Based on AreaSearch's analysis of aggregated SA2-level ERP counts, released yearly, and national address file data updated each quarter, its population is estimated at around 10,499 as of Aug 2026. This is an increase of 1,362 people (14.9%) since the 2021 Census, when the population was 9,137 people. ERP means Estimated Resident Population.
The area has a high proportion of residents born overseas, a notable mining employment base and elevated education employment. Its residents are somewhat older than the typical Australian area, with a median age of 42, and the area is comprised largely of group households. Population growth is moderate. Murdoch-Kardinya in Western Australia is known for its vibrant community atmosphere, lush green spaces and high-quality educational institutions. The suburban area offers residential and retail spaces, local amenities, recreational facilities and a bustling shopping precinct.
Read the analysisShow less
Download a free snapshot of Kardinya or order the area report
Free with an AreaSearch account. Pro is not needed.Free. Built in your browser.
The analysis, national rankings and who lives there.
About Kardinya
The suburb of Kardinya is located 13 kilometres south-southwest from Perth CBD. Based on AreaSearch's analysis of aggregated SA2-level ERP counts, released yearly, and national address file data updated each quarter, its population is estimated at around 10,499 as of Aug 2026. This is an increase of 1,362 people (14.9%) since the 2021 Census, when the population was 9,137 people. ERP means Estimated Resident Population.
The area has a high proportion of residents born overseas, a notable mining employment base and elevated education employment. Its residents are somewhat older than the typical Australian area, with a median age of 42, and the area is comprised largely of group households. Population growth is moderate. Murdoch-Kardinya in Western Australia is known for its vibrant community atmosphere, lush green spaces and high-quality educational institutions. The suburban area offers residential and retail spaces, local amenities, recreational facilities and a bustling shopping precinct.
Read the analysisShow less
Estimated resident population by year (ABS, not Census counts): 9,271 in 2006 and 10,495 in 2025. The dashed segment ends at the AreaSearch estimate for Aug 2026: 10,499 (ABS June 2025 base).
Each bar and spoke is a national percentile; the dashed ring is the typical area. 99th = higher than 99 in every 100 neighbourhood-sized areas across Australia (ABS SA2 areas). Higher means more of the measure, not necessarily better. Orange marks the top three measures where a higher percentile is better; not Age, Housing or Housing Cost.
An assessment of population growth drivers in Kardinya reveals an overall ranking slightly below national averages considering recent, and medium term trends.
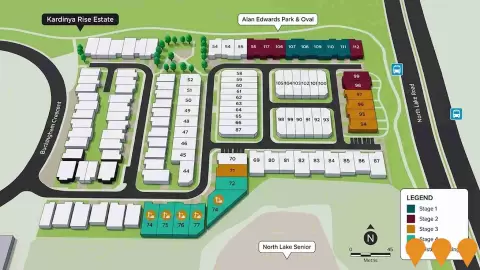
Boutique house and land estate by Yolk Property Group overlooking Alan Edwards Park and near Frank Cann parkland. Civil works and home builds are underway with most lots sold and a small number of park front survey strata lots and turnkey homes still available. Close to Murdoch University, Fiona Stanley Hospital and the Kardinya Park shopping precinct.
Est. value $2M · completion 2026 · Transport & Logistics
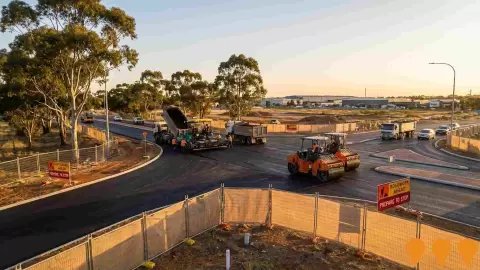
Installation of new traffic signals, on-road bicycle lanes, pedestrian path and crossing facilities to improve safety at the boundary intersection jointly managed by the Cities of Melville and Cockburn.
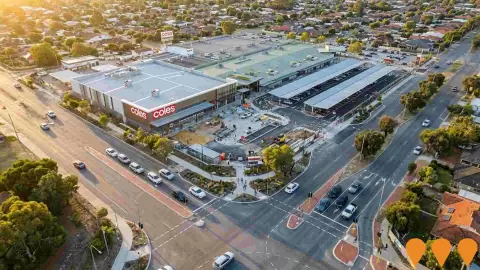
Stage 2 of the $65 million redevelopment was completed in December 2025, transforming the site into a modern mixed-use precinct. Improvements include an expanded 3,790sqm Coles, a new fresh food market, a three-level 550-bay car park, and a major medical and wellness hub. A new signalised intersection on South Street is scheduled to open by March 2026.
Est. value $1.8B · completion 2029 · Health & Medical
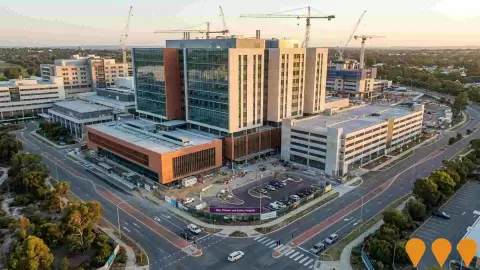
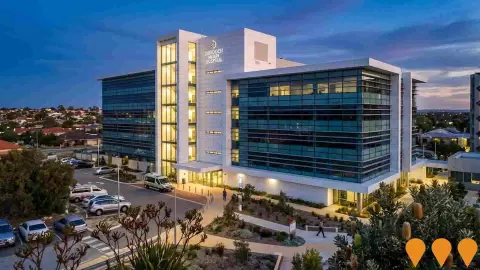
A $1.8 billion WA Government project delivering a new 274-bed Women and Babies Hospital at 11 Robin Warren Drive, Murdoch, within the Fiona Stanley Hospital precinct. It will replace King Edward Memorial Hospital and provide maternity, gynaecology and neonatal services.
Construction
Hug Homes
Est. completion 2027 · Residential Development
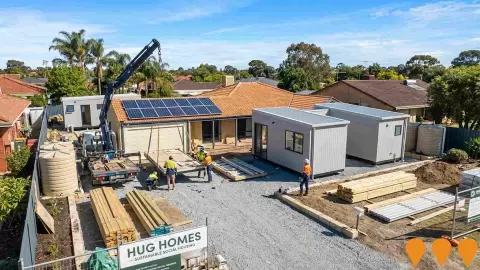
Modular transportable homes designed for social and affordable housing with minimal environmental impact, complemented by skills training programs for unemployed and vulnerable individuals. The project is coordinated from the headquarters in Booragoon, WA.
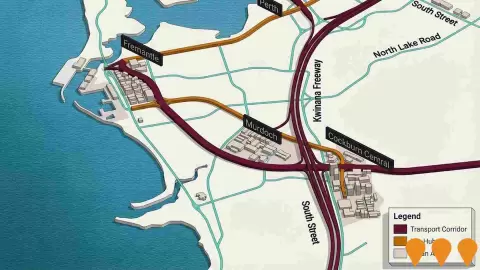
The proposal focuses on improving transport capacity and modal options along corridors connecting Murdoch and Cockburn Central to Fremantle to address growing congestion from population growth and high car-dependency.
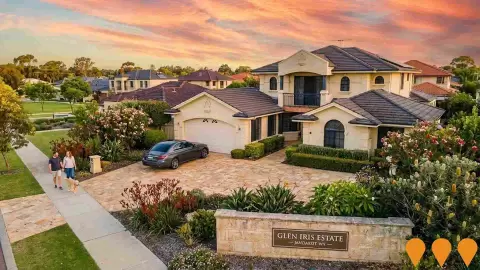
Glen Iris Estate is a new master-planned residential neighbourhood in Jandakot, developed on the former Glen Iris golf course by Eastcourt Property Group. The estate features around 500 planned residential dwellings, leafy streetscapes, and abundant green spaces covering 25% of the total site.
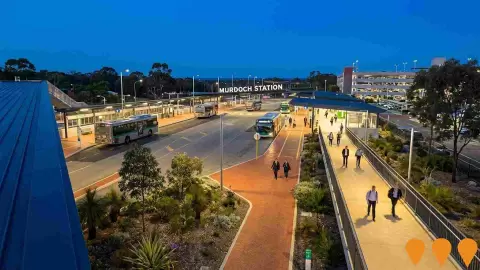
A major infrastructure planning initiative to upgrade Perth's busiest suburban train station outside the CBD to accommodate rapid growth within the Murdoch Specialised Activity Centre.
Est. value $85M · Completed 2023 · Education & Training
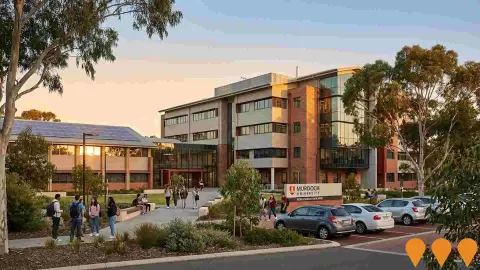
Boola Katitjin is Murdoch University's completed academic building and the largest mass-engineered timber project in Western Australia. It accommodates 60 percent of the university's teaching requirements and achieved a 6-star Green Star rating, featuring 21 large teaching spaces and immersive technology-enabled labs.
Est. value $85M · completion 2027 · Residential Development
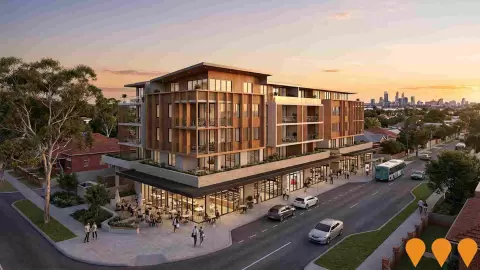
Proposed mixed use development on the former Palmyra Bowling Club site, comprising 98 apartments above ground floor commercial tenancies, delivering new housing and local shops close to Fremantle in partnership between 10 Development and DevelopmentWA.
Est. value $180M · Completed 2023 · Residential Development
A completed masterplanned residential community by Cedar Woods featuring a mix of apartments, townhouses and house-and-land packages immediately adjacent to Palmyra town centre.:contentReference[oaicite:0]{index=0}
Projects around Kardinya
Images marked AI impression are illustrative only and not photographs of the project; follow the project links for actual imagery. Original imagery? Contact us.
Estimated completion year of the 9 projects in and around the area that are not yet completed and have one: 2026 2, 2027 2, 2028 1, 2029 1, 2030 0, 2031 2, 2032 0, 2033 0, 2034 0, 2035 1. 1 have no completion year.
Development applications
AreaSearch has tracked 39 substantial development applications lodged in and around Kardinya over the period covered (about 4.3 years), 9 in the last 12 months; 2 are recorded as under assessment. Coverage varies by council.
Tracked applications by year
Applications per year (dashed: part year): 2022 (part year) 4, 2023 5, 2024 13, 2025 8, 2026 (to Oct) 9.
Tracked by AreaSearch, in and around the area, period covered (about 4.3 years)
Tracked, last 12 months
9
Tracked by AreaSearch, in and around the area
ABS building approvals
6.3 per 1,000 people
ABS building approvals
71st percentile nationally
Average approvals a year
63
ABS building approvals
66th percentile nationally
Applications approved
35
Tracked by AreaSearch, in and around the area, period covered (about 4.3 years)
Applications under assessment
2
Tracked by AreaSearch, in and around the area, period covered (about 4.3 years)
Questions about infrastructure in Kardinya
What are some of the major infrastructure and planning changes likely to influence the suburb of Kardinya?
Key infrastructure and planning changes likely to influence the suburb of Kardinya include: Kardinya Rise Estate (Construction); North Lake Road - Winterfold Road Intersection Upgrade (Construction); Kardinya District Centre Precinct Structure Plan (Approved); Orthonova Orthopaedic Hospital (Construction); and New Women and Babies Hospital (Fiona Stanley Hospital Precinct) (Construction). These projects represent significant developments that will shape the area's future infrastructure landscape.
What types of infrastructure projects are impacting the suburb of Kardinya?
Infrastructure development impacting the suburb of Kardinya spans multiple sectors including Transport & Logistics, Health & Medical, and Sports & Recreation, among others.
What is the outlook for infrastructure in Kardinya?
The long-run outlook for infrastructure is part of AreaSearch Operator and Pro. Log in to see the forecast detail in Full.
Development in Kardinya
AreaSearch's development drivers ranking positions Kardinya among the top 11% of areas assessed nationwide.
Questions about development in Kardinya
How many dwelling approvals have occurred in the suburb of Kardinya recently?
Dwelling approval activity in the suburb of Kardinya area has seen 197 residential approvals over the past two financial years, based on AreaSearch's SA2 aggregation method. The suburb of Kardinya's current population of 10,499 has been supported by 63 approvals on average over recent years.
How does the suburb of Kardinya's development activity compare to Greater Perth?
The suburb of Kardinya has seen 6.3 approvals per 1,000 people in recent years, compared to 7.4 approvals in Greater Perth. This means that one dwelling has been approved for every 105 people in the suburb of Kardinya, compared to one for every 118 in Greater Perth.
What is the outlook for development in Kardinya?
The long-run outlook for development is part of AreaSearch Operator and Pro. Log in to see the forecast detail in Full.
Show all 5 questionsShow fewerWhat has been the trend in development approvals over the past five years in the suburb of Kardinya?
Looking at development activity over the past five years, the suburb of Kardinya's approval levels have been consistent with the yearly average of 63, showing stable development patterns.
How does recent development compare to population growth in the suburb of Kardinya?
Over the past five years, the population in the suburb of Kardinya has grown by approximately 1,046 people, while 313 residential approvals were recorded. This equates to a ratio of 3.3 people added for each new dwelling approval. This high ratio suggests strong population growth relative to housing supply, potentially indicating unmet housing demand.
03People
Population, age, income, work, education and more.
99th = higher than 99 in every 100 neighbourhood-sized areas across Australia (ABS SA2 areas). Higher means more of the measure, not necessarily better.
Population in Kardinya
Data: Aug 2026 estimate, from the ABS June 2025 base
An assessment of population growth drivers in Kardinya reveals an overall ranking slightly below national averages considering recent, and medium term trends.
Population in Kardinya: key figures
Measure
Value
Source and date
National percentile
Population
10,499
AreaSearch estimate, Aug 2026, from the ABS June 2025 base
Growth since 2021 Census
+14.9%
AreaSearch estimate, Aug 2026, against the 2021 Census
82nd percentile nationally
Population density
2,395 per km²
AreaSearch estimate, Aug 2026, from the ABS June 2025 base
76th percentile nationally
Average yearly growth, 2020 to 2025
+2.1%
ABS estimated resident population series to June 2025
Average yearly growth, 2015 to 2025
+1.2%
ABS estimated resident population series to June 2025
Show 5 more population figuresShow fewer
Population in Kardinya: key figures, continued
Measure
Value
Source and date
National percentile
Population at the 2021 Census
9,137
2021 Census
Residents added since the 2021 Census
1,362
AreaSearch estimate, Aug 2026, against the 2021 Census
Average yearly growth, 2022 to 2025
+3.6%
ABS estimated resident population series to June 2025
Population growth, 2024 to 2025
+2.1%
ABS estimated resident population series to June 2025
Land area
4.38 km²
AreaSearch boundary analysis
Questions about population in Kardinya
What is the latest population estimate for the suburb of Kardinya?
Total population for the suburb of Kardinya was estimated to be approximately 10,499 as at Aug 2026. This is based upon an estimated resident population of 10,495 from the ABS up to June 2025.
How has the population in the suburb of Kardinya changed since 2021?
The suburb of Kardinya has added approximately 1,362 people and shown a 14.91% increase from the 9,137 people recorded at the 2021 Census period.
What is the population density in the suburb of Kardinya?
The population density in the suburb of Kardinya is estimated at 2,397 persons per square kilometre based on the latest population estimate.
Show all 5 questionsShow fewerHow much has the population grown over the past 10 years in the suburb of Kardinya?
Over the past 10 years, the population in the suburb of Kardinya has shown a compound annual growth rate of 1.2% per annum.
What are the main drivers of population growth in the suburb of Kardinya?
Population growth in the suburb of Kardinya is driven by: Overseas migration (95.0%), Natural increase (5.0%), Interstate migration (0.0%). The primary driver is Overseas migration, contributing 95.0% of overall population gains.
Age in Kardinya
Data: Aug 2026 estimate, from the ABS June 2025 base
Kardinya's median age exceeds the national pattern.
Age in Kardinya: key figures
Measure
Value
Source and date
National percentile
Median age
41 years
ABS estimated resident population age profile (June 2025), scaled to the Aug 2026 AreaSearch estimate
67th percentile nationally
Aged 65 and over
20.0%
ABS estimated resident population age profile (June 2025), scaled to the Aug 2026 AreaSearch estimate
Children under 15
13.9%
ABS estimated resident population age profile (June 2025), scaled to the Aug 2026 AreaSearch estimate
Aged 15 to 34
30.2%
ABS estimated resident population age profile (June 2025), scaled to the Aug 2026 AreaSearch estimate
Aged 25 to 64
52.5%
ABS estimated resident population age profile (June 2025), scaled to the Aug 2026 AreaSearch estimate
Show 11 more age figuresShow fewer
Age in Kardinya: key figures, continued
Measure
Value
Source and date
National percentile
Median age at the 2021 Census
42 years
2021 Census
Aged 0 to 4
4.5%
ABS estimated resident population age profile (June 2025), scaled to the Aug 2026 AreaSearch estimate
Aged 5 to 14
9.4%
ABS estimated resident population age profile (June 2025), scaled to the Aug 2026 AreaSearch estimate
Aged 15 to 24
13.8%
ABS estimated resident population age profile (June 2025), scaled to the Aug 2026 AreaSearch estimate
Aged 25 to 34
16.4%
ABS estimated resident population age profile (June 2025), scaled to the Aug 2026 AreaSearch estimate
Aged 35 to 44
13.4%
ABS estimated resident population age profile (June 2025), scaled to the Aug 2026 AreaSearch estimate
Aged 45 to 54
11.1%
ABS estimated resident population age profile (June 2025), scaled to the Aug 2026 AreaSearch estimate
Aged 55 to 64
11.6%
ABS estimated resident population age profile (June 2025), scaled to the Aug 2026 AreaSearch estimate
Aged 65 to 74
11.1%
ABS estimated resident population age profile (June 2025), scaled to the Aug 2026 AreaSearch estimate
Aged 75 to 84
6.9%
ABS estimated resident population age profile (June 2025), scaled to the Aug 2026 AreaSearch estimate
Aged 85 and over
2.0%
ABS estimated resident population age profile (June 2025), scaled to the Aug 2026 AreaSearch estimate
Questions about age in Kardinya
What is the median age in the suburb of Kardinya?
AreaSearch estimates the median age in the suburb of Kardinya at 41 years as at August 2026. That is down from the 2021 Census figure of 42 years, with AreaSearch updating the age profile for population change recorded since the Census.
How does the suburb of Kardinya's median age compare to Greater Perth and Australia?
At an estimated 41 years as at August 2026, Kardinya is 4 years older than the Greater Perth 2021 Census average (37 years) and 3 years older than the national Census average (38 years).
What age groups are over-represented in the suburb of Kardinya?
On AreaSearch estimates updated to August 2026, the most over-represented age group in the suburb of Kardinya compared to the Greater Perth region is the 65 - 74 group, making up 11.1% of the population.
Show all 7 questionsShow fewerWhat age groups are under-represented in the suburb of Kardinya?
On AreaSearch estimates updated to August 2026, the most under-represented age group in the suburb of Kardinya compared to the Greater Perth region is the 5 - 14 group, making up 9.4% of the population.
Are there age groups with notable population variances?
No, the age distribution in the suburb of Kardinya is broadly in line with Greater Perth.
What is the percentage of children (0-14 years) in the suburb of Kardinya?
AreaSearch estimates children aged 0-14 years at 13.9% of the population in the suburb of Kardinya as at August 2026.
What is the percentage of older people (65+ years) in the suburb of Kardinya?
AreaSearch estimates people aged 65 and over at 20.0% of the population in the suburb of Kardinya as at August 2026.
Income in Kardinya
Data: ATO FY 2024 and 2021 Census
The area exhibits notably strong income performance, ranking higher than 73% of areas assessed nationally through AreaSearch analysis.
Income in Kardinya: key figures from ATO taxation data (annual)
Measure
Value
Source and date
National percentile
Median taxable income (ATO)
$65,966 a year
ATO FY-24, annual
74th percentile nationally
Average taxable income
$86,458 a year
ATO FY-24, annual
Income in Kardinya: key figures from the 2021 Census (weekly income)
Measure
Value
Source and date
National percentile
Census household income / week
$1,927
2021 Census, weekly
61st percentile nationally
Census personal income / week
$808
2021 Census, weekly
51st percentile nationally
High-income households
29.1%
2021 Census
Census family income / week
$2,255
2021 Census, weekly
Low-income households
21.4%
2021 Census
Questions about income in Kardinya
What is the median taxable income in the suburb of Kardinya?
Based on Wage Price Index adjustments to June 2026, the estimated median taxable income in the suburb of Kardinya is approximately $70,610. The official ATO data from FY-24 recorded a median of $65,966.
What is the average taxable income in the suburb of Kardinya?
Based on Wage Price Index adjustments to June 2026, the estimated average taxable income in the suburb of Kardinya is approximately $92,545. The official ATO data from FY-24 recorded an average of $86,458.
How does the median taxable income in the suburb of Kardinya compare to Greater Perth?
Based on Wage Price Index adjustments to June 2026, the estimated median taxable income in the suburb of Kardinya is approximately $70,610 compared to $68,556 in Greater Perth. The official ATO data from FY-24 shows $65,966 and $64,047 respectively.
Show all 12 questionsShow fewerHow does the average taxable income in the suburb of Kardinya compare to Greater Perth?
Based on Wage Price Index adjustments to June 2026, the estimated average taxable income in the suburb of Kardinya is approximately $92,545 compared to $90,565 in Greater Perth. The official ATO data from FY-24 shows $86,458 and $84,609 respectively.
What are the main income cohorts in the suburb of Kardinya according to the 2021 Census?
As per the 2021 Census, the weekly household income bracket containing the largest proportion of the suburb of Kardinya's households (~30.2% / 1,045 households) is the $1,500 - 2,999 cohort.
How do the main income cohorts in the suburb of Kardinya compare to Greater Perth?
The largest weekly household income cohort in the suburb of Kardinya is the $1,500 - 2,999 group, representing about 30.2% of households. In comparison, Greater Perth's largest household income cohort is the $1,500 - 2,999 group, representing 32.0% of its households, according to the 2021 Census.
What is the median household income in the suburb of Kardinya according to the 2021 Census?
The 2021 Census data indicates that the median household income in the suburb of Kardinya is $1,927/wk.
What is the median family income in the suburb of Kardinya according to the 2021 Census?
According to the 2021 Census, the median family income in the suburb of Kardinya is $2,255/wk.
What is the median personal income in the suburb of Kardinya according to the 2021 Census?
The 2021 Census shows that the median personal income in the suburb of Kardinya is $808/wk.
How does the suburb of Kardinya's income rank nationally?
According to AreaSearch's aggregation of the latest postcode level ATO data released for FY-24, the suburb of Kardinya had a median income among taxpayers of $65,966 with the average level standing at $86,458. This is extremely high nationally and compares to levels of $64,047 and $84,609 across Greater Perth respectively. Based on Wage Price Index growth of 7.04% since FY-24, current estimates would be approximately $70,610 (median) and $92,545 (average) as of June 2026.
What is the disposable income in the suburb of Kardinya?
The estimated disposable income in the suburb of Kardinya is $7,298 per year according to AreaSearch analysis.
How does the suburb of Kardinya's disposable income compare to Greater Perth?
The suburb of Kardinya's disposable income is $7,298 compared to $6,842 for Greater Perth, based on AreaSearch analysis.
Employment in Kardinya
The exceptional employment performance in Kardinya places it among Australia's strongest labour markets.
Employment in Kardinya: key figures
Measure
Value
Source and date
National percentile
Unemployment rate
1.2%
ABS and DEWR labour data, compiled by AreaSearch
Workforce participation
68.3%
ABS and DEWR labour data, compiled by AreaSearch
Employed residents
6,111
ABS and DEWR labour data, compiled by AreaSearch
Daytime population
8,685
AreaSearch estimate of residents and workers present on a weekday
Labour force
6,184
ABS and DEWR labour data, compiled by AreaSearch
Questions about employment in Kardinya
What is the employment situation in the suburb of Kardinya?
As of March 2026, the suburb of Kardinya has approximately 6,111 employed residents with an unemployment rate of 1.2%. This very low unemployment rate indicates a tight labour market with strong demand for workers. The area ranks in the top 25% nationally for employment performance, indicating a robust job market.
How does the suburb of Kardinya's unemployment rate compare to Greater Perth?
As of March 2026, the unemployment rate in the suburb of Kardinya stands at 1.2%, which is 3.0 percentage points below Greater Perth's rate of 4.2%. This lower unemployment rate suggests stronger local employment conditions. For comparison, the national unemployment rate is 4.2%.
What are the major employment sectors in the suburb of Kardinya?
The employment landscape in the suburb of Kardinya is dominated by several key sectors. The largest employers are health care & social assistance (15.7% of employment), education & training (11.5%), and professional & technical (9.7%). Other significant employers include retail trade and construction.
Show all 8 questionsShow fewerHow has employment changed recently in the suburb of Kardinya?
Over the past year to March 2026, the suburb of Kardinya has experienced a decline in employment, with total jobs decreasing while the labour force decreased. As a result, the unemployment rate has fallen. By comparison, Greater Perth saw employment increased and its unemployment rate rose.
What is the workforce participation rate in the suburb of Kardinya?
The workforce participation rate in the suburb of Kardinya is 68.3%, which represents the proportion of working-age residents who are either employed or actively seeking work. This healthy participation rate reflects good employment opportunities and workforce engagement. The local rate trailing the Greater Perth average of 69.9%, showing similar workforce dynamics to Greater Perth.
Which industries are over-represented in the suburb of Kardinya's employment market?
The suburb of Kardinya shows notable specialisation in education & training, which employs 11.5% of the local workforce compared to 9.2% across Greater Perth. This moderate specialisation indicates some local strength in the sector.
What is the outlook for employment in Kardinya?
The long-run outlook for employment is part of AreaSearch Operator and Pro. Log in to see the forecast detail in Full.
How does the job market in the suburb of Kardinya compare nationally?
The suburb of Kardinya's employment market shows strong performance nationally, ranking in the top 25% of areas assessed by AreaSearch. This indicates robust employment conditions and economic vitality compared to other regions. Recent job advertisement trends show the broader employment region experienced 4.5% growth, ranking 12th out of 37 regions nationally.
Education in Kardinya
Data: 2021 Census
The educational profile of Kardinya ranks above average relative to locations nationally, based on AreaSearch's ranking of qualification and academic performance metrics.
Education in Kardinya: key figures
Measure
Value
Source and date
National percentile
Bachelor qualifications
23.8%
2021 Census
72nd percentile nationally
Postgraduate qualifications
8.1%
2021 Census
69th percentile nationally
University qualifications
35.5%
2021 Census
Vocational qualifications
19.4%
2021 Census
33rd percentile nationally
Graduate diploma or certificate
3.6%
2021 Census
78th percentile nationally
Show 6 more education figuresShow fewer
Education in Kardinya: key figures, continued
Measure
Value
Source and date
National percentile
Advanced diploma or diploma
11.1%
2021 Census
61st percentile nationally
No post-school qualification
34.0%
2021 Census
Residents attending an educational institution
26.8%
2021 Census
Residents attending university or other higher education
8.6%
2021 Census
89th percentile nationally
Residents attending primary school
6.3%
2021 Census
8th percentile nationally
Residents attending secondary school
6.8%
2021 Census
25th percentile nationally
Questions about education in Kardinya
What percentage of people in the suburb of Kardinya have university qualifications?
35.5% of people aged 15 and over in the suburb of Kardinya have university qualifications, compared to 30.1% in Greater Perth.
What percentage of people in the suburb of Kardinya have no formal qualifications?
34.0% of people aged 15 and over in the suburb of Kardinya have no formal qualifications, compared to 35.6% in Greater Perth.
How does the suburb of Kardinya's education level compare to national averages?
The suburb of Kardinya ranks in the 67th percentile nationally for education based on AreaSearch's analysis of qualification and performance metrics.
Show all 8 questionsShow fewerWhat types of qualifications are most common in the suburb of Kardinya?
The most common qualifications in the suburb of Kardinya are: Bachelor Degree (23.8%), Certificate (19.4%), Advanced Diploma (11.1%).
What proportion of the suburb of Kardinya's population is currently attending educational institutions?
26.8% of the population in the suburb of Kardinya is currently engaged in formal education, including 6.3% in primary school, 6.8% in secondary school, 8.6% at university (all shares of total residents).
What is the ICSEA score for schools in the suburb of Kardinya?
The average ICSEA (Index of Community Socio-Educational Advantage) score for schools in the suburb of Kardinya is 1052, indicating average socio-educational advantage (national average is 1000).
How many schools are located within the suburb of Kardinya?
There are 2 schools within the suburb of Kardinya, with a combined enrollment of approximately 740 students.
What types of schools are available in the suburb of Kardinya?
The suburb of Kardinya includes 1 primary school, 1 secondary school.
Households in Kardinya
Data: 2021 Census
Kardinya features high concentrations of group households and couples without children but relatively few lone person households, with an average household size in line with Greater Perth.
Households in Kardinya: key figures
Measure
Value
Source and date
National percentile
Median household size
2.6 people
2021 Census
63rd percentile nationally
Lone-person households
20.3%
2021 Census
30th percentile nationally
Couples with children
32.2%
2021 Census
57th percentile nationally
Couples without children
31.2%
2021 Census
76th percentile nationally
One-parent families
9.7%
2021 Census
40th percentile nationally
Show 5 more households figuresShow fewer
Households in Kardinya: key figures, continued
Measure
Value
Source and date
National percentile
Group households
4.9%
2021 Census
82nd percentile nationally
Households at the 2021 Census
3,459
2021 Census
Estimated households
3,975
AreaSearch estimate, Aug 2026
Family households
74.6%
2021 Census
63rd percentile nationally
Average children per family
1.5 per family
2021 Census
32nd percentile nationally
Questions about households in Kardinya
How many households are in the suburb of Kardinya?
As of the 2021 Census, the suburb of Kardinya had 3,459 households. Based on population growth patterns, this has grown by approximately 14.9% to an estimated 3,975 households today.
What is the typical household size?
The average household size in the suburb of Kardinya is 2.6 people. This compares to 2.6 in Greater Perth and reflects the area's household composition mix.
What types of households are most common?
Family households dominate at 74.6% of all households. Non-family households consist of lone person households (20.3%), group households (4.9%), and other household types (0.0%).
Show all 9 questionsShow fewerHow are families structured in the area?
Of the 2,580 family households, couples with children account for 32.2% of all households, couples without children at home 31.2%, and single parent families 9.7%. This mix shapes local demand for schools, family services, and housing types.
How does the suburb of Kardinya compare to household patterns in Greater Perth?
Compared to Greater Perth, the suburb of Kardinya shows distinct household patterns. This family-oriented profile influences local demand for family homes, schools, and children's services.
What is the average family size?
Families in the suburb of Kardinya have an average of 1.5 children, slightly below the Greater Perth average of 1.6. This influences local demand for child-related services and larger family homes.
What are the marriage patterns in the suburb of Kardinya?
Marriage patterns reveal 52.4% of the adult population are currently married, while 33.7% have never married. This compares to 47.6% married and 36.1% never married across Greater Perth.
How significant are single-person households?
Single-person households represent 20.3% of all households in the suburb of Kardinya, similar to the average for Greater Perth of 24.9%. This affects demand for smaller dwellings and single-person accommodation.
Are shared living arrangements common?
Group households (unrelated people sharing) account for 4.9% of households, above the Greater Perth average of 3.5%. This higher rate points to more student or young professional shared accommodation.
Cultural diversity in Kardinya
Data: 2021 Census
Kardinya was found to be more culturally diverse than the vast majority of local markets in Australia, upon assessment of a range of language and cultural background related metrics.
Cultural diversity in Kardinya: key figures
Measure
Value
Source and date
National percentile
Born overseas
38.2%
2021 Census
78th percentile nationally
Speak another language at home
26.3%
2021 Census
71st percentile nationally
English only at home
73.7%
2021 Census
28th percentile nationally
Australian citizens
84.2%
2021 Census
37th percentile nationally
Born in Australia
61.8%
2021 Census
21st percentile nationally
Aboriginal and Torres Strait Islander residents
0.6%
2021 Census
26th percentile nationally
Questions about cultural diversity in Kardinya
What is the level of cultural diversity in the suburb of Kardinya?
Kardinya scores quite highly on cultural diversity, with 26.3% of its population speaking a language other than English at home and 38.2% born overseas.
What is the most common religion in the suburb of Kardinya?
The main religion in Kardinya was found to be Christianity, which makes up 52.7% of people in Kardinya. However, the most apparent overrepresentation was in Buddhism, which comprises 3.1% of the population, compared to 2.7% across Greater Perth.
What are the top countries of origin in the suburb of Kardinya?
In terms of ancestry (country of birth of parents), the top three represented groups in Kardinya are English, comprising 24.3% of the population, Australian, comprising 19.3% of the population, and Other, comprising 10.8% of the population. Additionally, there are notable divergences in the representation of certain other ethnic groups: Croatian is notably overrepresented at 1.9% of Kardinya (vs 0.8% across Greater Perth), Italian at 7.7% (vs 4.2%) and South African at 1.0% (vs 1.0%).
Show all 7 questionsShow fewerHow does the percentage of people born overseas compare to Greater Perth?
38.2% of the suburb of Kardinya population was born overseas, compared to 37.7% across Greater Perth.
What percentage of the suburb of Kardinya population speaks a language other than English at home?
26.3% of the population in the suburb of Kardinya speaks a language other than English at home, compared to 22.0% in Greater Perth.
How many people in the suburb of Kardinya identify as Australian Aboriginal?
0.6% of the suburb of Kardinya population identifies as Australian Aboriginal, compared to 1.4% in Greater Perth.
What is the citizenship status of the population in the suburb of Kardinya?
84.2% of the suburb of Kardinya population holds citizenship, compared to 83.0% in Greater Perth.
04Place
Housing, health, transport, local services and the reports on them.
Housing in Kardinya
Data: 2021 Census
Kardinya is characterized by a predominantly suburban housing profile, with above-average rates of outright home ownership.
Housing in Kardinya: key figures
Measure
Value
Source and date
National percentile
Rented homes
20.7%
2021 Census
28th percentile nationally
Owned outright
44.1%
2021 Census
80th percentile nationally
Detached houses
86.3%
2021 Census
52nd percentile nationally
Median mortgage repayment
$2,003 a month
2021 Census, monthly
67th percentile nationally
Owned with a mortgage
35.1%
2021 Census
51st percentile nationally
Show 5 more housing figuresShow fewer
Housing in Kardinya: key figures, continued
Measure
Value
Source and date
National percentile
Semi-detached, terrace and townhouses
10.2%
2021 Census
57th percentile nationally
Median weekly rent paid, 2021 Census
$390
2021 Census, weekly
58th percentile nationally
Median rent as a share of median household income
20.2%
2021 Census, ratio calculated by AreaSearch
46th percentile nationally
Median mortgage repayment as a share of household income
24.0%
2021 Census, ratio calculated by AreaSearch
50th percentile nationally
People per bedroom
0.7 per bedroom
2021 Census
23rd percentile nationally
Questions about housing in Kardinya
What percentage of homes are owned vs rented in the suburb of Kardinya?
In the suburb of Kardinya, 44.1% of homes are owned outright, 35.1% are owned with a mortgage, and 20.7% are rented.
What percentage of dwellings in the suburb of Kardinya are houses?
According to the latest data, 86.3% of dwellings in the suburb of Kardinya are houses.
What percentage of dwellings in the suburb of Kardinya are apartments or units?
In the suburb of Kardinya, 3.5% of dwellings are apartments or units, with an additional 10.2% being semi-detached dwellings.
Show all 12 questionsShow fewerWhat is the level of outright home ownership in the suburb of Kardinya?
Outright home ownership in the suburb of Kardinya stands at 44.1%, compared to 29.3% in Greater Perth.
What is the median monthly mortgage repayment in the suburb of Kardinya?
The median monthly mortgage repayment in the suburb of Kardinya is $2,003, compared to $1,907 in Greater Perth.
What is the average monthly housing cost in the suburb of Kardinya?
The aggregate monthly housing cost in the suburb of Kardinya is $1,052, which represents the average monthly cost across all housing types.
What percentage of income do residents spend on housing in the suburb of Kardinya?
In the suburb of Kardinya, households with mortgages typically spend 24.0% of their income on mortgage repayments, while renters spend 20.2% of their income on rent.
How crowded are homes in the suburb of Kardinya?
The average persons per bedroom ratio in the suburb of Kardinya is 0.7, indicating the level of household density.
How does housing affordability in the suburb of Kardinya compare to Greater Perth?
Housing affordability in the suburb of Kardinya shows mortgage holders spending 24.0% of income on repayments (vs 23.6% in Greater Perth), while renters spend 20.2% of income on rent (vs 18.8% in Greater Perth).
What types of dwellings are most common in the suburb of Kardinya?
The dwelling mix in the suburb of Kardinya consists of 86.3% detached houses, 10.2% semi-detached dwellings, 3.5% apartments, and 0.0% other dwelling types.
How affordable is housing in the suburb of Kardinya relative to local incomes?
Housing in Kardinya consumes approximately 12.6% of median household income ($8,344 monthly), indicating costs are highly affordable. The generally accepted benchmark is that housing should not exceed 30% of household income.
How do proposed developments compare to existing housing types in the suburb of Kardinya?
Recent development applications in Kardinya show attached dwellings contributing 82% of approvals compared to 14% of existing stock, while detached houses represent 18% of applications versus 86% of current dwellings. This suggests increasing densification. This area is seeing substantial increases in dwelling density compared to most Australian locations.
Health in Kardinya
Data: ATO FY 2024 and 2021 Census
Kardinya's residents boast exceedingly positive health performance metrics relative to locations nationally with very low prevalence of common health conditions across all age groups.
Health in Kardinya: key figures
Measure
Value
Source and date
National percentile
Private health cover
59.8%
ATO FY 2024, private health cover
79th percentile nationally
No long-term health condition
70.7%
2021 Census
57th percentile nationally
Need help with daily activities
4.4%
2021 Census
32nd percentile nationally
No long-term health condition, under 65
78.6%
2021 Census
66th percentile nationally
Three or more long-term health conditions, under 65
0.8%
2021 Census
24th percentile nationally
Questions about health in Kardinya
How many people in the suburb of Kardinya have private health insurance?
Around 59.8% of people in the suburb of Kardinya are covered by private health insurance, which compares to 59.1% in Greater Perth.
What percentage of the population requires ongoing medical assistance in the suburb of Kardinya?
In the suburb of Kardinya, 4.4% of the population is identified as requiring ongoing medical assistance. By comparison, 4.6% of people in Greater Perth require similar assistance.
How prevalent is asthma in the suburb of Kardinya?
6.3% of people in the suburb of Kardinya are diagnosed with asthma. In comparison, 6.8% of the population across Greater Perth is affected by asthma.
Show all 6 questionsShow fewerWhat percentage of people have diabetes in the suburb of Kardinya?
Diabetes affects 4.7% of the suburb of Kardinya population, while in Greater Perth, 4.0% of people are diagnosed with diabetes.
What is the percentage of people with heart disease in the suburb of Kardinya?
4.0% of people in the suburb of Kardinya have heart disease. Across Greater Perth,3.3% of the population is affected by heart disease.
How does the suburb of Kardinya compare to Greater Perth in terms of overall private health coverage?
In the suburb of Kardinya, 59.8% of the population are estimated to have private health insurance. Comparatively, Greater Perth sees an estimated private health coverage rate of 59.1%.
Transport in Kardinya
Transport servicing is good compared to other areas nationally based on assessment of service frequency, route connectivity and accessibility.
Transport in Kardinya: key figures
Measure
Value
Source and date
National percentile
Transport access
61 out of 100
AreaSearch transport analysis of timetable data
61st percentile nationally
Public transport stops
46
Public transport timetable (GTFS) data, compiled by AreaSearch
39th percentile nationally
Weekly public transport trips
2,246
Public transport timetable (GTFS) data, compiled by AreaSearch
53rd percentile nationally
People per public transport stop
233
Public transport timetable (GTFS) data, compiled by AreaSearch
Public transport routes
13
Public transport timetable (GTFS) data, compiled by AreaSearch
Show 2 more transport figuresShow fewer
Transport in Kardinya: key figures, continued
Measure
Value
Source and date
National percentile
Vehicles per dwelling
1.6 per dwelling
2021 Census
Working residents who worked from home
8.3%
2021 Census, taken during COVID-19 restrictions
Questions about transport in Kardinya
How many public transport stops are in Kardinya?
There are 46 public transport stops within the suburb of Kardinya.
How frequent are the transport services in Kardinya?
The suburb of Kardinya has 2,246 weekly trips across 13 routes, averaging 320 trips per day.
How far are residents from public transport in Kardinya?
On average, residential properties are 190 metres from the nearest transport stop.
Everyday services near Kardinya
From the typical resident, the nearest child care centre is 440 m away and the nearest school 628 m.
61percentile
National percentile for access to everyday services
Child care
440 m
School
628 m
Supermarket
653 m
Pharmacy
664 m
GP
673 m
Distance from the typical resident to the nearest of each service. Every bar starts at 0 m. The nearest is orange.
Public transport 46 stops nearby, 2,246 weekly trips, access rating 61 out of 100.
Amenities in Kardinya: key figures (distances from the typical resident)
Measure
Value
Source and date
National percentile
Amenity score
61 out of 100
AreaSearch proximity analysis
61st percentile nationally
Nearest child care
440 m
AreaSearch proximity analysis, from the typical resident
Nearest school
628 m
AreaSearch proximity analysis, from the typical resident
Nearest supermarket
653 m
AreaSearch proximity analysis, from the typical resident
Nearest pharmacy
664 m
AreaSearch proximity analysis, from the typical resident
Show 7 more amenities figuresShow fewer
Amenities in Kardinya: key figures (distances from the typical resident), continued
Measure
Value
Source and date
National percentile
Nearest GP
673 m
AreaSearch proximity analysis, from the typical resident
Nearest fitness centre
694 m
AreaSearch proximity analysis, from the typical resident
Nearest dentist
709 m
AreaSearch proximity analysis, from the typical resident
Nearest bank
811 m
AreaSearch proximity analysis, from the typical resident
Nearest shopping centre
1.7 km
AreaSearch proximity analysis, from the typical resident
Nearest hospital
3.1 km
AreaSearch proximity analysis, from the typical resident
Nearest government service
6.4 km
AreaSearch proximity analysis, from the typical resident
Sector reports for operators and developers in Kardinya
Sector reports that go deeper on these services: child care, medical, retail, aged care and specialist disability accommodation (SDA). There are 2 long day care centres with 60 places in Kardinya, about 6.7 children aged 0-4 per place.
Child care providers
2
Places
60
Children per place
6.7
Resident children aged 0-4 per long day care place (2021 Census). Australia: 2.1.
Where the figures come from, downloads and nearby areas.
Development
AreaSearch's development drivers ranking positions Kardinya among the top 11% of areas assessed nationwide.
Tracked applications39in and around the area, period covered (about 4.3 years)
Tracked, last 12 months9in and around the area
ABS building approvals6.3per 1,000 people71st
Infrastructure
Kardinya has moderate levels of nearby infrastructure activity, ranking in the 43rd percentile nationally.
No headline figures are reported for this area.
Sales & rents
Median rent in Kardinya is $709 a week, +2.7% over 12 months to Sep 2026.
Median rent$709a week+2.7% over 12 months to Sep 2026
Population
An assessment of population growth drivers in Kardinya reveals an overall ranking slightly below national averages considering recent, and medium term trends.
Population10,499+14.9% since 2021 Census82nd
Average yearly growth, 2020 to 2025+2.1%ABS resident estimates
Population density2,395per km²AreaSearch estimate, Aug 202676th
Age
Kardinya's median age exceeds the national pattern.
Median age41yearsAreaSearch estimate, Aug 202667th
Children under 1513.9%AreaSearch estimate, Aug 2026
Aged 65 and over20.0%AreaSearch estimate, Aug 2026
Income
The area exhibits notably strong income performance, ranking higher than 73% of areas assessed nationally through AreaSearch analysis.
Median taxable income$65,966a yearATO FY-24, annual74th
Census household income / week$1,9272021 Census, weekly61st
High-income households29.1%2021 Census
Employment
The exceptional employment performance in Kardinya places it among Australia's strongest labour markets.
Unemployment rate1.2%Labour force, Mar 2026
Workforce participation68.3%
Employed residents6,111Labour force, Mar 2026
Education
The educational profile of Kardinya ranks above average relative to locations nationally, based on AreaSearch's ranking of qualification and academic performance metrics.
University qualifications35.5%2021 Census
School advantage index (ICSEA)1,05268th
Households
Kardinya features high concentrations of group households and couples without children but relatively few lone person households, with an average household size in line with Greater Perth.
Median household size2.6people2021 Census63rd
Lone-person households20.3%2021 Census30th
Couples with children32.2%2021 Census57th
Cultural diversity
Kardinya was found to be more culturally diverse than the vast majority of local markets in Australia, upon assessment of a range of language and cultural background related metrics.
Born overseas38.2%2021 Census78th
Speak another language at home26.3%2021 Census71st
Housing
Kardinya is characterized by a predominantly suburban housing profile, with above-average rates of outright home ownership.
Rented homes20.7%2021 Census28th
Owned outright44.1%2021 Census80th
Detached houses86.3%2021 Census52nd
Health
Kardinya's residents boast exceedingly positive health performance metrics relative to locations nationally with very low prevalence of common health conditions across all age groups.
Private health cover59.8%ATO FY 202479th
No long-term health condition70.7%2021 Census57th
Need help with daily activities4.4%2021 Census32nd
Transport
Transport servicing is good compared to other areas nationally based on assessment of service frequency, route connectivity and accessibility.
Transport access61out of 10061st
Public transport stops4639th
Weekly public transport trips2,24653rd
Amenities
Amenity provision was found to be above the typical area assessed nationally by AreaSearch, based on counts and proximity analysis.
Amenity score61out of 10061st
Sources and notes
Kardinya has an estimated 10,499 residents, up 14.9% since the 2021 Census, with 17 projects tracked in the area around Kardinya.
Latest estimate as at Aug 2026; other figures from the 2021 Census, ATO FY-24 and AreaSearch estimates where labelled. Updated 14 Oct 2026.
Sources: ABS Census 2021, ABS estimated resident population, ATO taxation statistics, state rental bonds and property sales records where published, and AreaSearch analysis for Kardinya.
Data and method for Kardinya
Data currency
Refreshed . Rents to Sep 2026, population and age estimated to Aug 2026, taxable income FY 2024 and projects to Aug 2026. Housing, households and cultural diversity are from the 2021 Census (next update with the 2026 Census results).
Infrastructure projects and development applications also include sites in the surrounding area, and are labelled as such. Other sections were compiled 15 Oct 2026 from sources that update on their own cycles; "See the evidence" lists each source and its cycle.
3 dated for this area, within 12 months
1 dated for this area, older
3 2021 Census measures
7 compiled with this profile
Suburb boundaryFigures are for the suburb boundary shown (ABS 'Suburbs and Localities'). Some sites report a larger statistical area with the same name.Learn more
SAL boundaries are defined by Australia Post and the Australian Bureau of Statistics to represent commonly-known suburb names used in postal addresses.
Statistical Areas (SA2) are designed for census data collection and may combine multiple suburbs or use different geographic boundaries. For a complete picture, consider both boundary types where available.
See the evidencesources, cycles and method for all 14 sections
Main sources: ABS, Geoscience Australia, GNAF, ATO, State governments, Valuer General, Rental Board and Infrastructure Australia.
Cross-check us. The Census baseline for this boundary is at ABS 2021 Census QuickStats (SAL50725). QuickStats reports 2021 only; the figures on this page are more current wherever the ledger shows a later date.
Common questions about this page
How do Kardinya suburb boundaries differ from Statistical Areas?
This page uses Suburbs and Localities (SAL) boundaries (suburb-style geography). SAL represents commonly-known suburb names used in addresses, while Statistical Areas (SA2) are designed for census and statistical reporting. Even when sharing the same name, SAL and SA2 boundaries often cover different geographic areas with different populations.
Where does the data on this Kardinya page come from?
AreaSearch compiles this page from official and industry sources, including ABS, Geoscience Australia, GNAF, ATO, State governments, Valuer General, Rental Board and Infrastructure Australia, then calculates statistics for the boundary shown, and ranks, growth rates and benchmarks itself. Property sales come from the state valuation authority, rents from state rental bond lodgements, development applications from council and state planning portals, school data from ACARA, and public transport from state transport departments. Infrastructure projects and development applications also include sites in the surrounding area, labelled as such.
Is the Kardinya data on this page just from the 2021 Census?
No. Most of this page is built beyond the Census. Dated for this area: population (Aug 2026), age profile (Aug 2026), infrastructure projects (Aug 2026) and income (FY 2024). Compiled with this profile from sources that publish on their own cycles: development and approvals, property sales and rents, employment, education, transport, health and services and amenities. Only housing, households and cultural diversity remain wholly Census-based, because no more current small-area dataset exists for those measures.
Kardinya statistics: population, income, housing and more
Key demographics and figures for Kardinya from the 2021 Census, ATO taxpayer data and AreaSearch estimates and analysis. Each topic has its own table of key figures beside the section it belongs to, and each row names its source and date. The percentile compares Kardinya with every neighbourhood-sized area across Australia (ABS SA2 areas): a higher percentile means more of that measure than most, not necessarily better.