Chart Color Schemes
This analysis uses ABS Statistical Areas Level 2 (SA2) boundaries, which can materially differ from Suburbs and Localities (SAL) even when sharing similar names.
SA2 boundaries are defined by the Australian Bureau of Statistics and are designed to represent communities for statistical reporting (e.g., census and ERP).
Suburbs and Localities (SAL) represent commonly-used suburb/locality names (postal-style areas) and may use different geographic boundaries. For comprehensive analysis, consider reviewing both boundary types if available.
est. as @ -- *
ABS ERP | -- people | --
2021 Census | -- people
Sales Activity
Curious about local property values? Filter the chart to assess the volume and appreciation (including resales) trends and regional comparisons, or scroll to the map below view this information at an individual property level.
Find a Recent Sale
Sales Detail
Population
Banjup lies within the top 10% of areas nationally in terms of population growth performance according to AreaSearch analysis of short and medium-term trends
Banjup's population, as of November 2025, is approximately 26,376. This figure represents an increase of 4,630 people since the 2021 Census, which recorded a population of 21,746. The growth from June 2024's estimated resident population of 25,803, combined with 867 validated new addresses since the Census date, indicates this increase. Banjup's population density is around 887 persons per square kilometer, similar to averages seen across other locations assessed by AreaSearch. The area's 21.3% growth from 2021 exceeded both national (8.9%) and state averages, positioning it as a regional growth leader. Interstate migration contributed approximately 49.0% of overall population gains during recent periods, with all drivers including overseas migration and natural growth being positive factors.
AreaSearch uses ABS/Geoscience Australia projections for each SA2 area, released in 2024 with a base year of 2022. For areas not covered by this data and post-2032 estimations, AreaSearch employs growth rates by age cohort provided by the ABS in its latest Greater Capital Region projections (released in 2023, based on 2022 data). By 2041, Banjup's population is forecast to increase by 7,215 persons, reflecting a total increase of 25.2% over the 17-year period.
Frequently Asked Questions - Population
Development
The level of residential development activity in Banjup was found to be higher than 90% of real estate markets across the country
Banjup has recorded approximately 274 residential properties granted approval per year over the past five financial years, totalling 1,372 homes. As of FY-26, 93 approvals have been recorded. On average, 3.9 people have moved to the area for each dwelling built between FY-21 and FY-25. This demand significantly outpaces supply, which typically puts upward pressure on prices and increases competition among buyers.
New homes are being built at an average expected construction cost of $246,000, in line with regional trends. In FY-26, $25.0 million in commercial approvals have been registered, indicating moderate levels of commercial development. Compared to Greater Perth, Banjup records elevated construction activity, with 29.0% above the regional average per person over the five-year period. This reflects strong developer confidence in the area while balancing buyer choice and supporting current property values.
Recent development has been entirely comprised of detached dwellings, preserving the area's low density nature and attracting space-seeking buyers. With around 99 people per dwelling approval, Banjup shows characteristics of a growth area. According to AreaSearch quarterly estimates, Banjup is forecasted to gain 6,642 residents by 2041. Based on current development patterns, new housing supply should readily meet demand, offering good conditions for buyers and potentially facilitating population growth beyond current projections.
Frequently Asked Questions - Development
Infrastructure
Banjup has emerging levels of nearby infrastructure activity, ranking in the 31stth percentile nationally
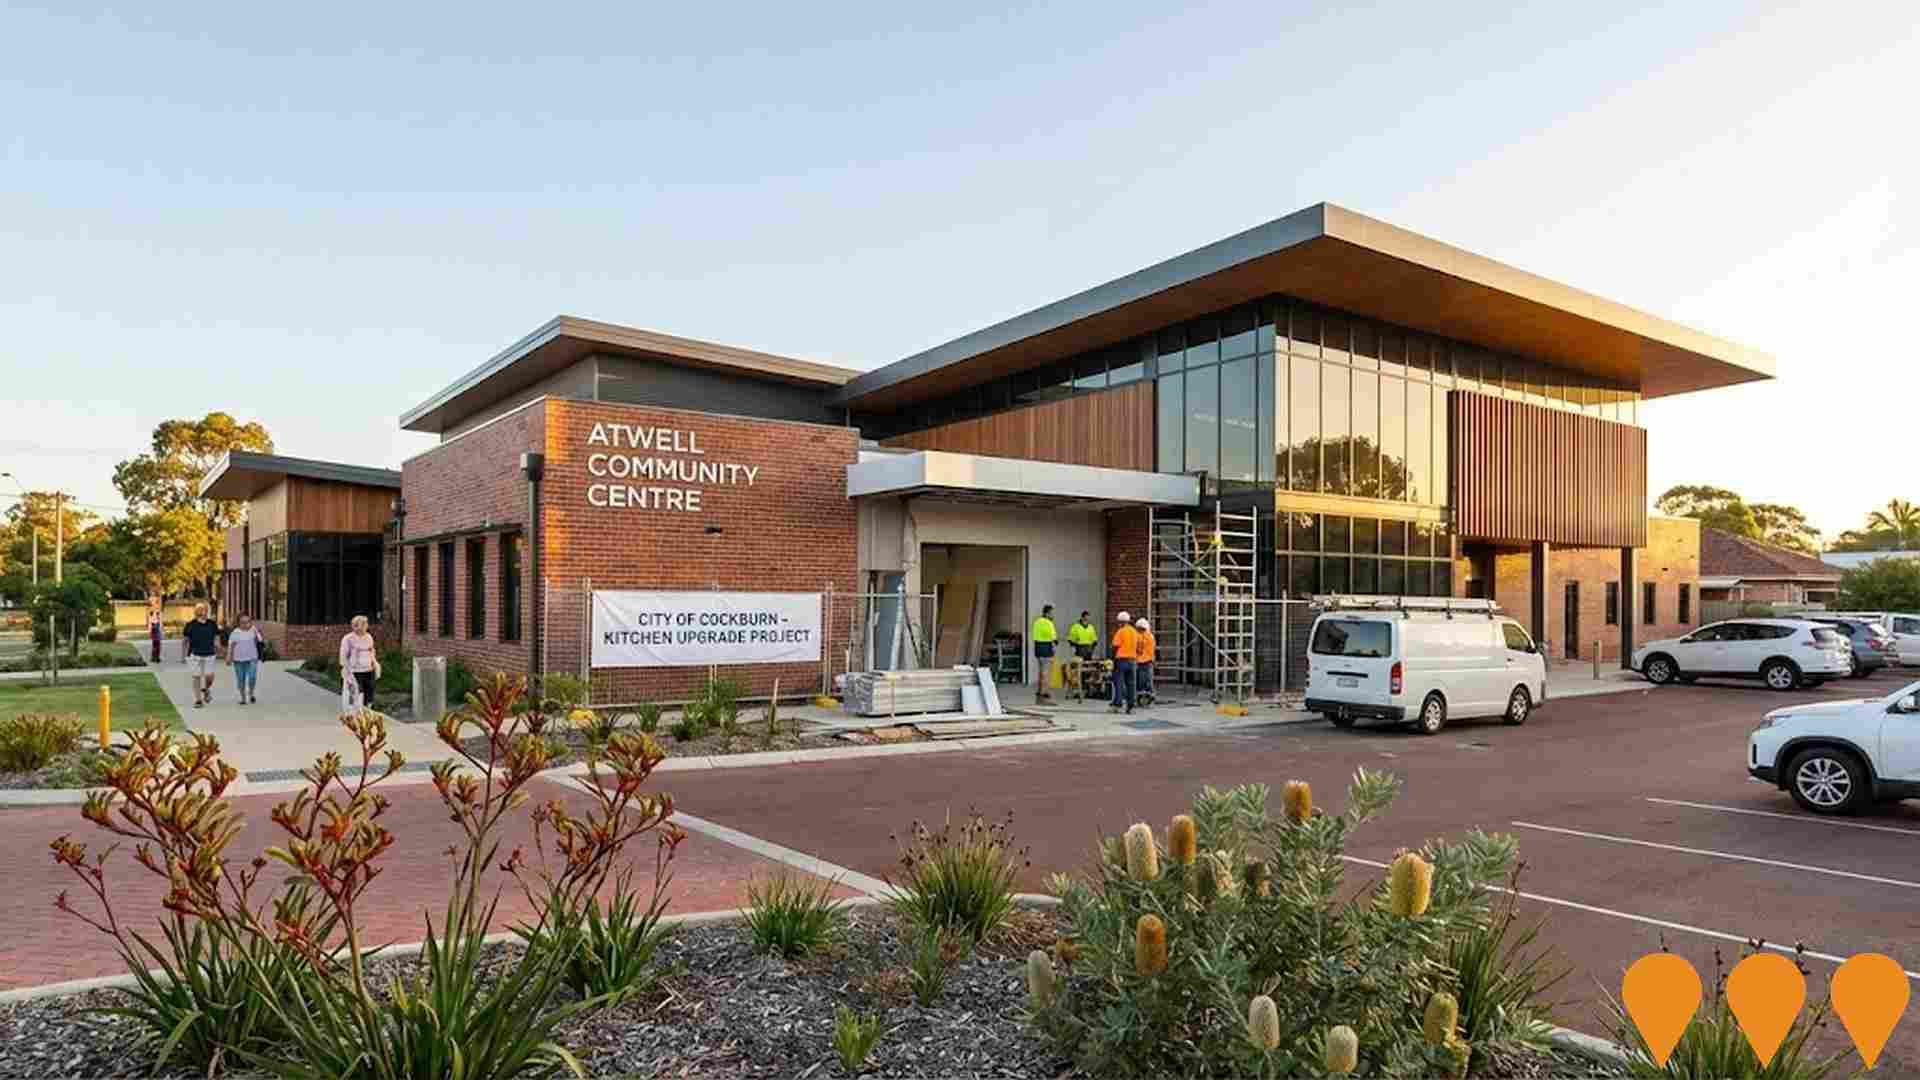
Area infrastructure changes significantly impact performance. AreaSearch identified 64 potential influence projects. Notable ones are Treeby Primary School's future development, Forrestdale Business Park West, Treeby Village, and Atwell Community Centre Kitchen Upgrade. The following details those likely most relevant.
Professional plan users can use the search below to filter and access additional projects.
INFRASTRUCTURE SEARCH
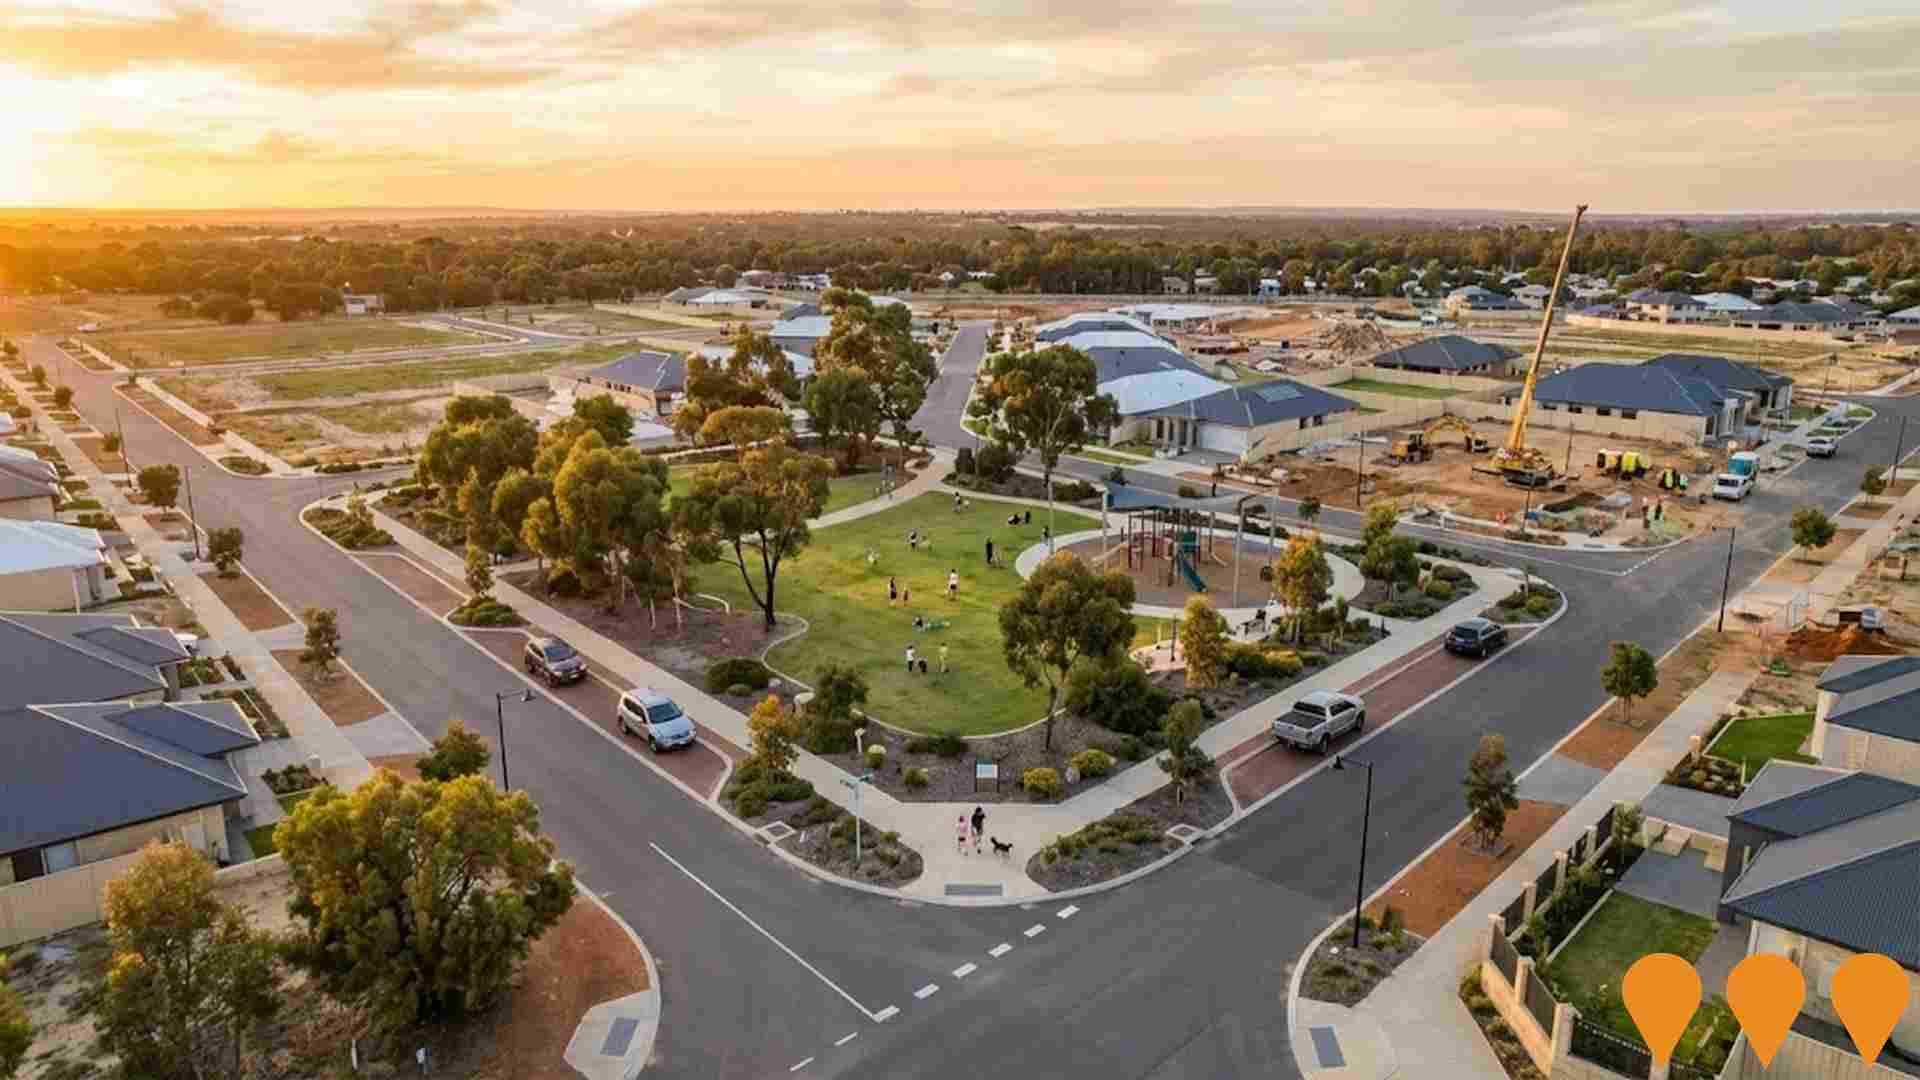
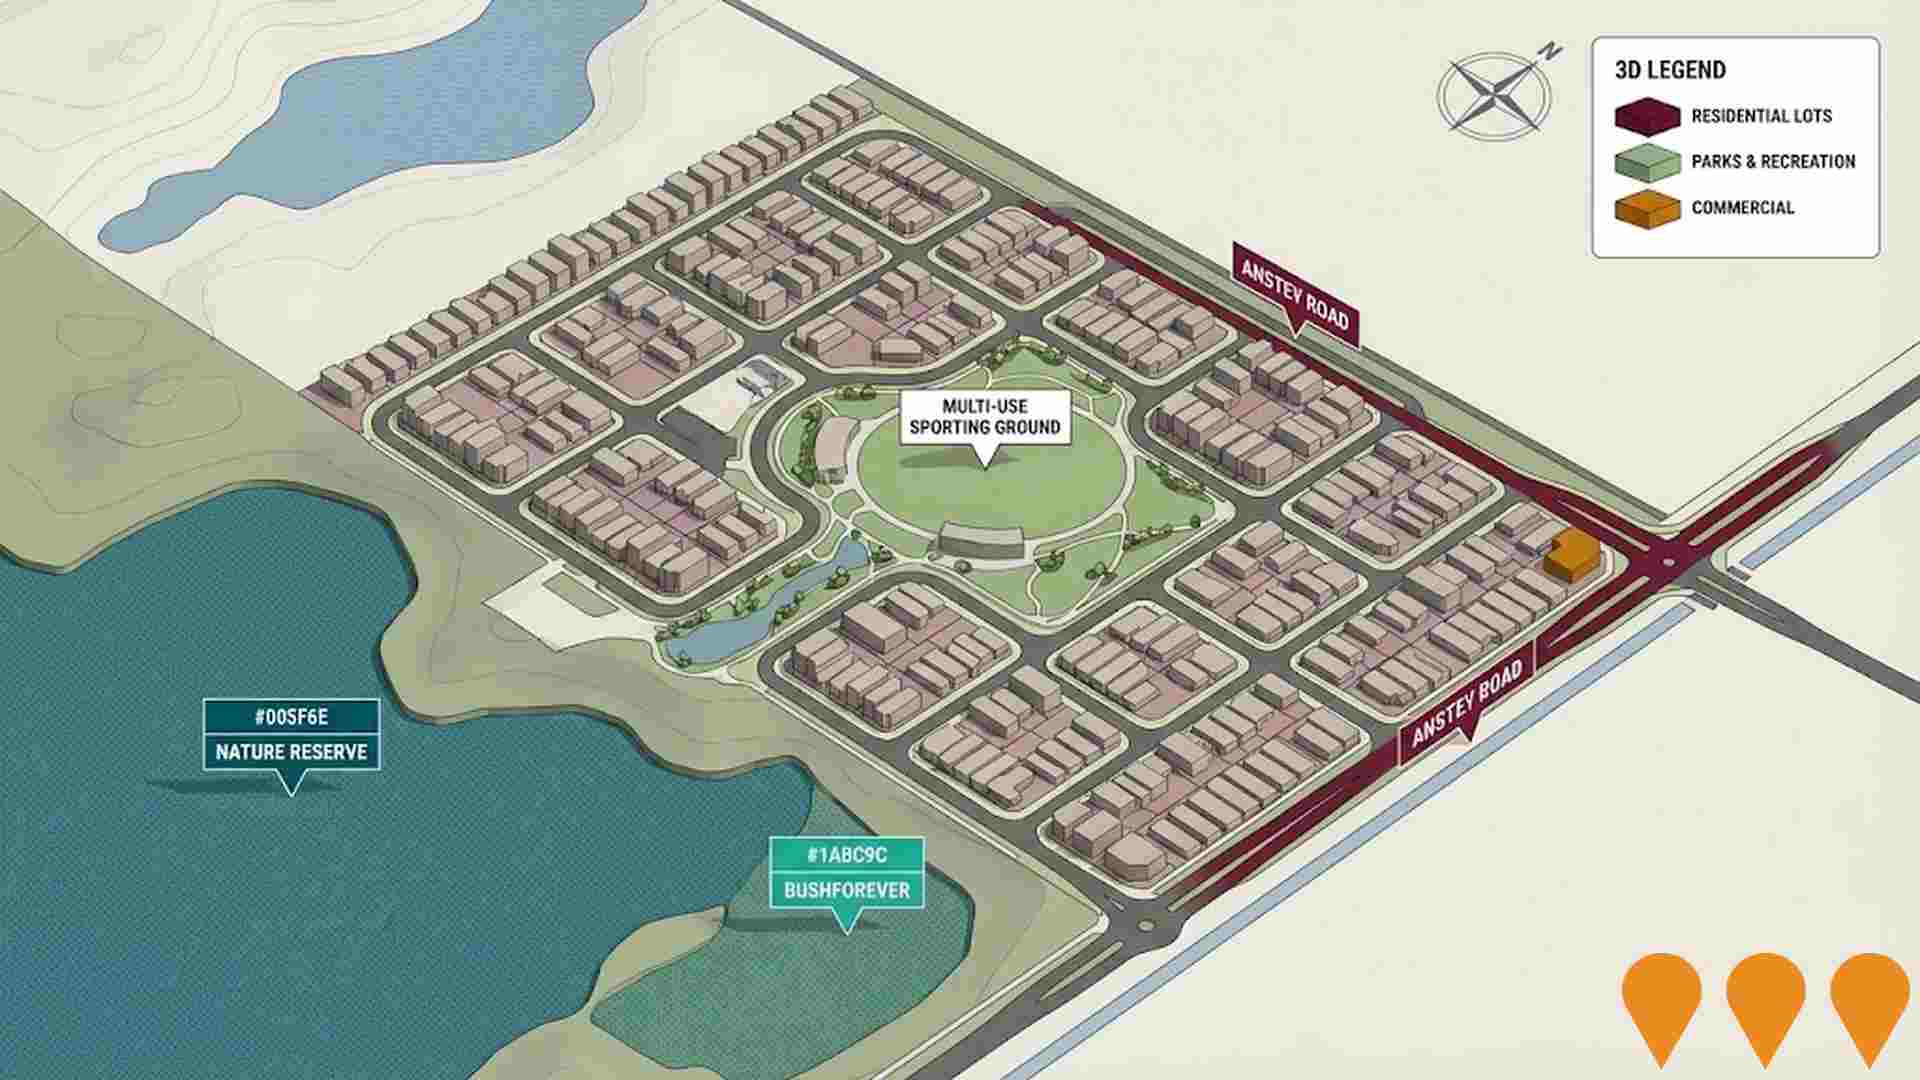
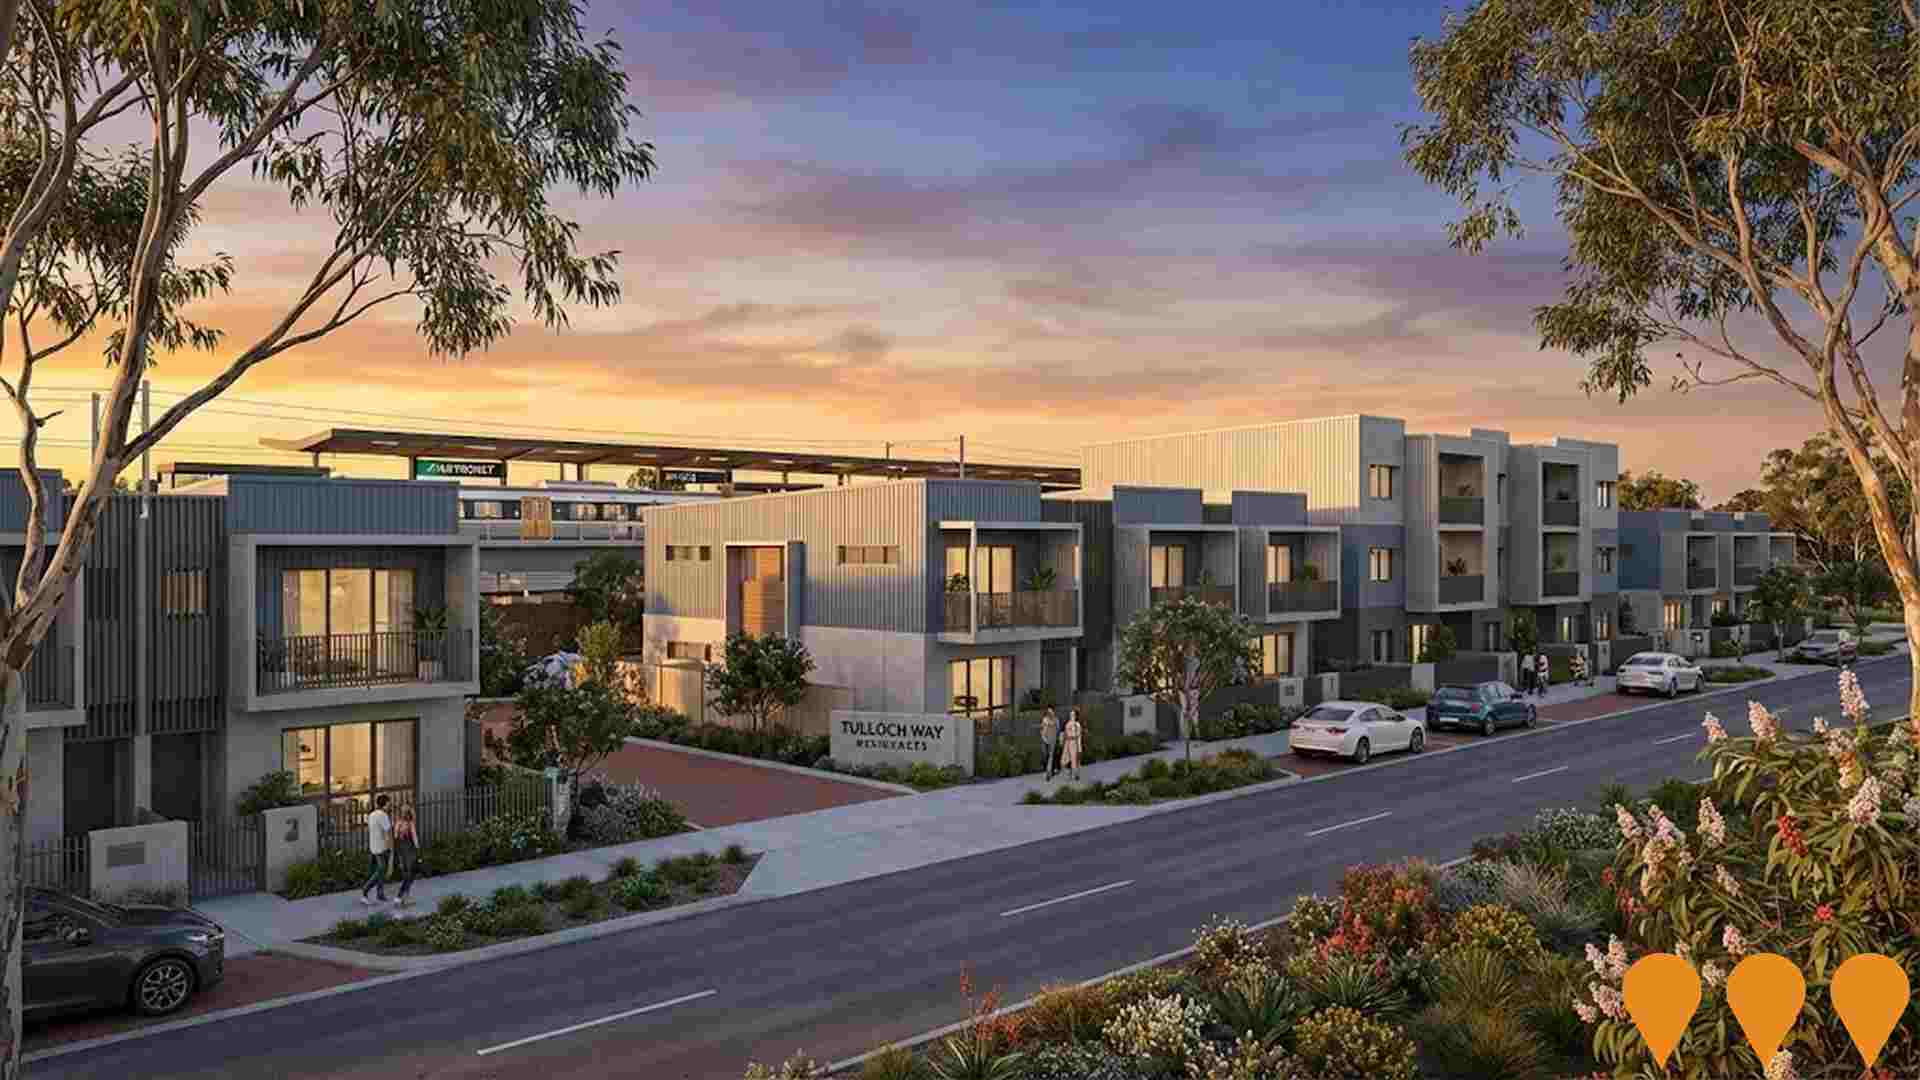
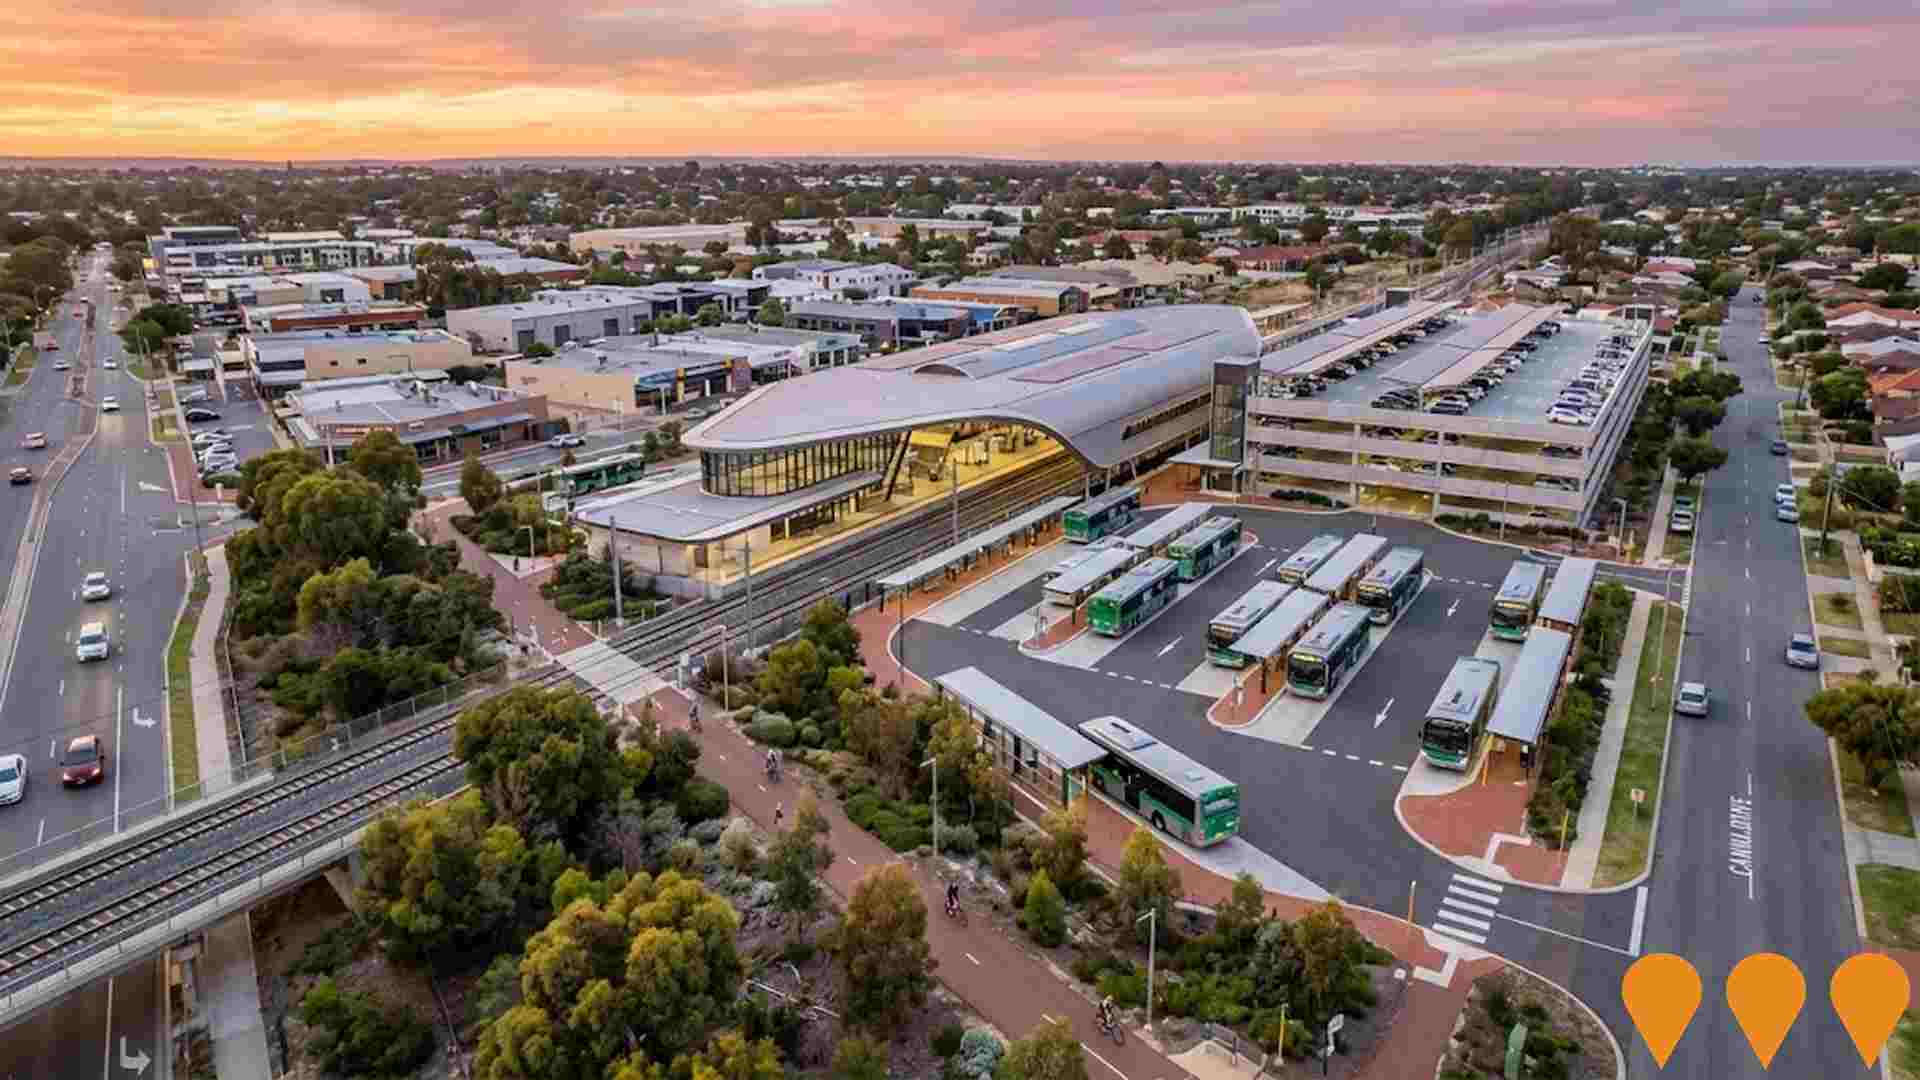
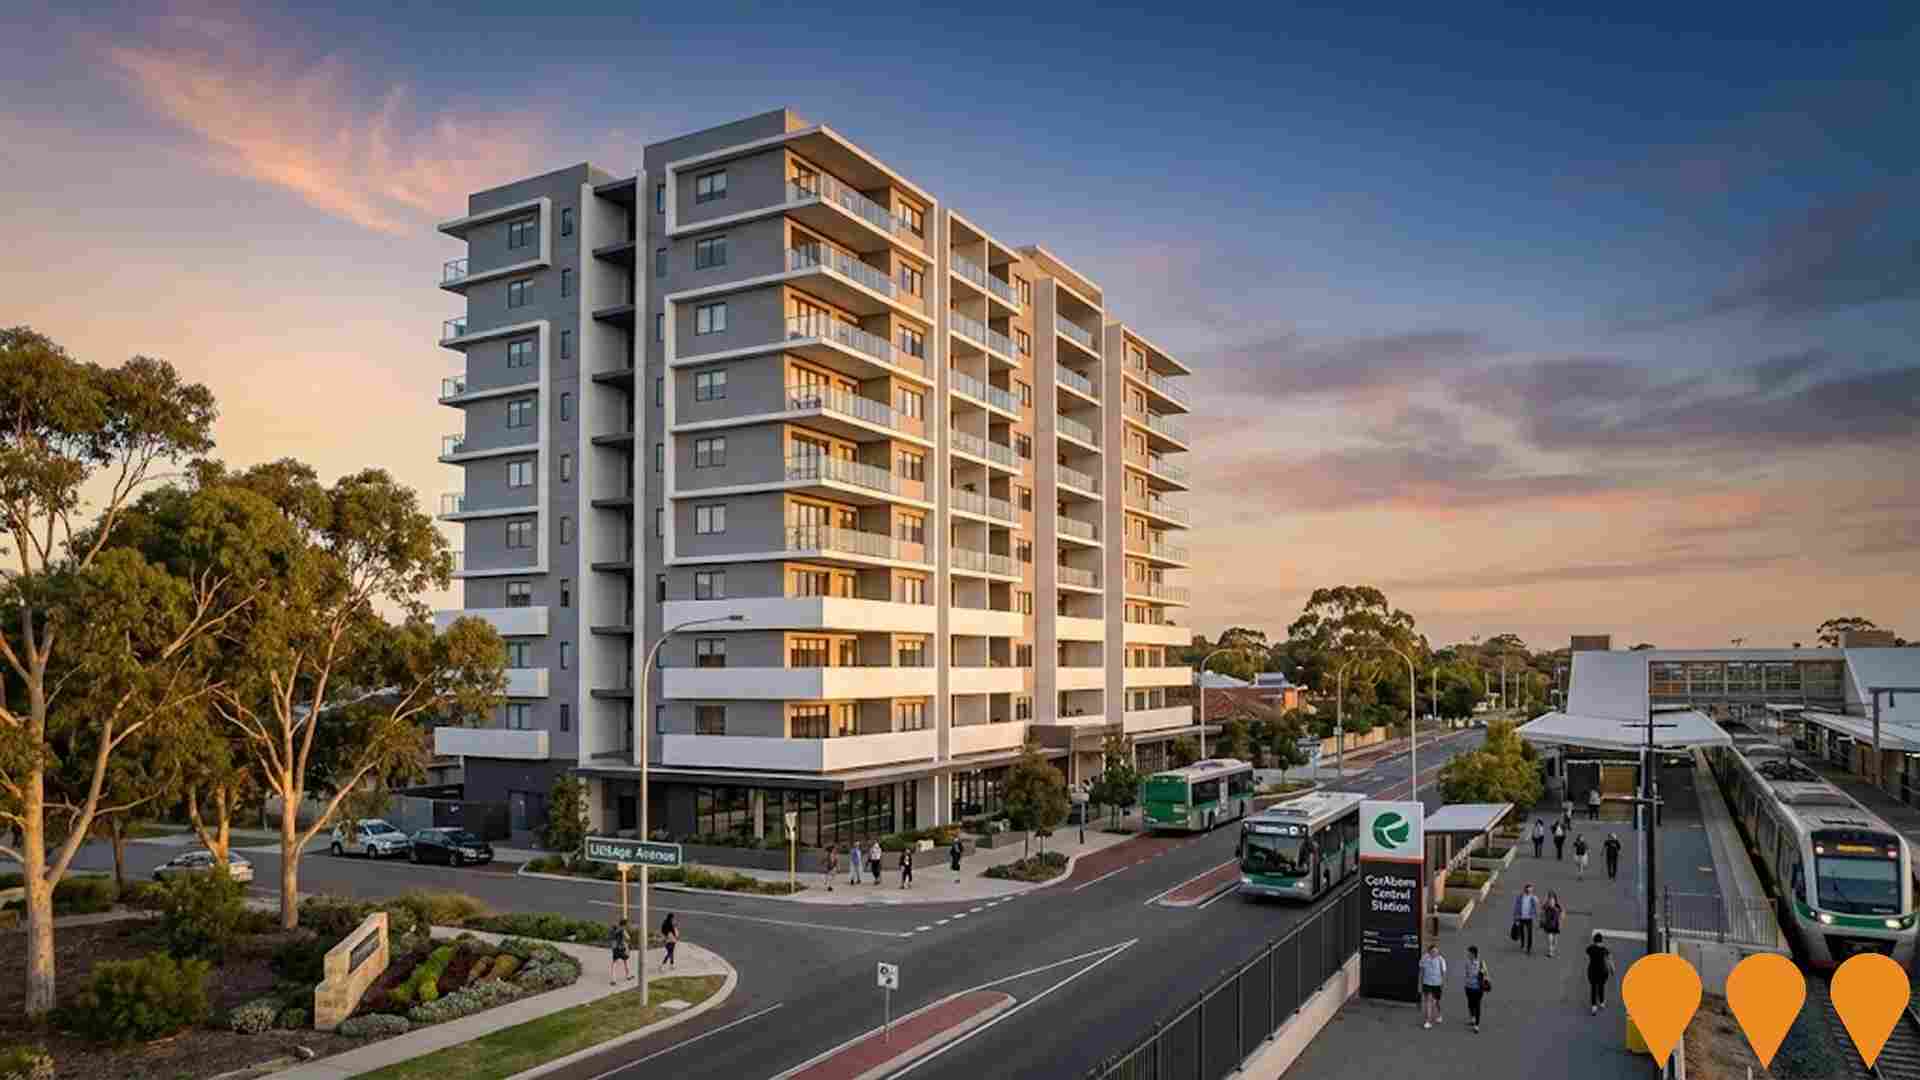
 Denotes AI-based impression for illustrative purposes only, not to be taken as definitive under any circumstances. Please follow links and conduct other investigations from the project's source for actual imagery. Developers and project owners wishing us to use original imagery please Contact Us and we will do so.
Frequently Asked Questions - Infrastructure
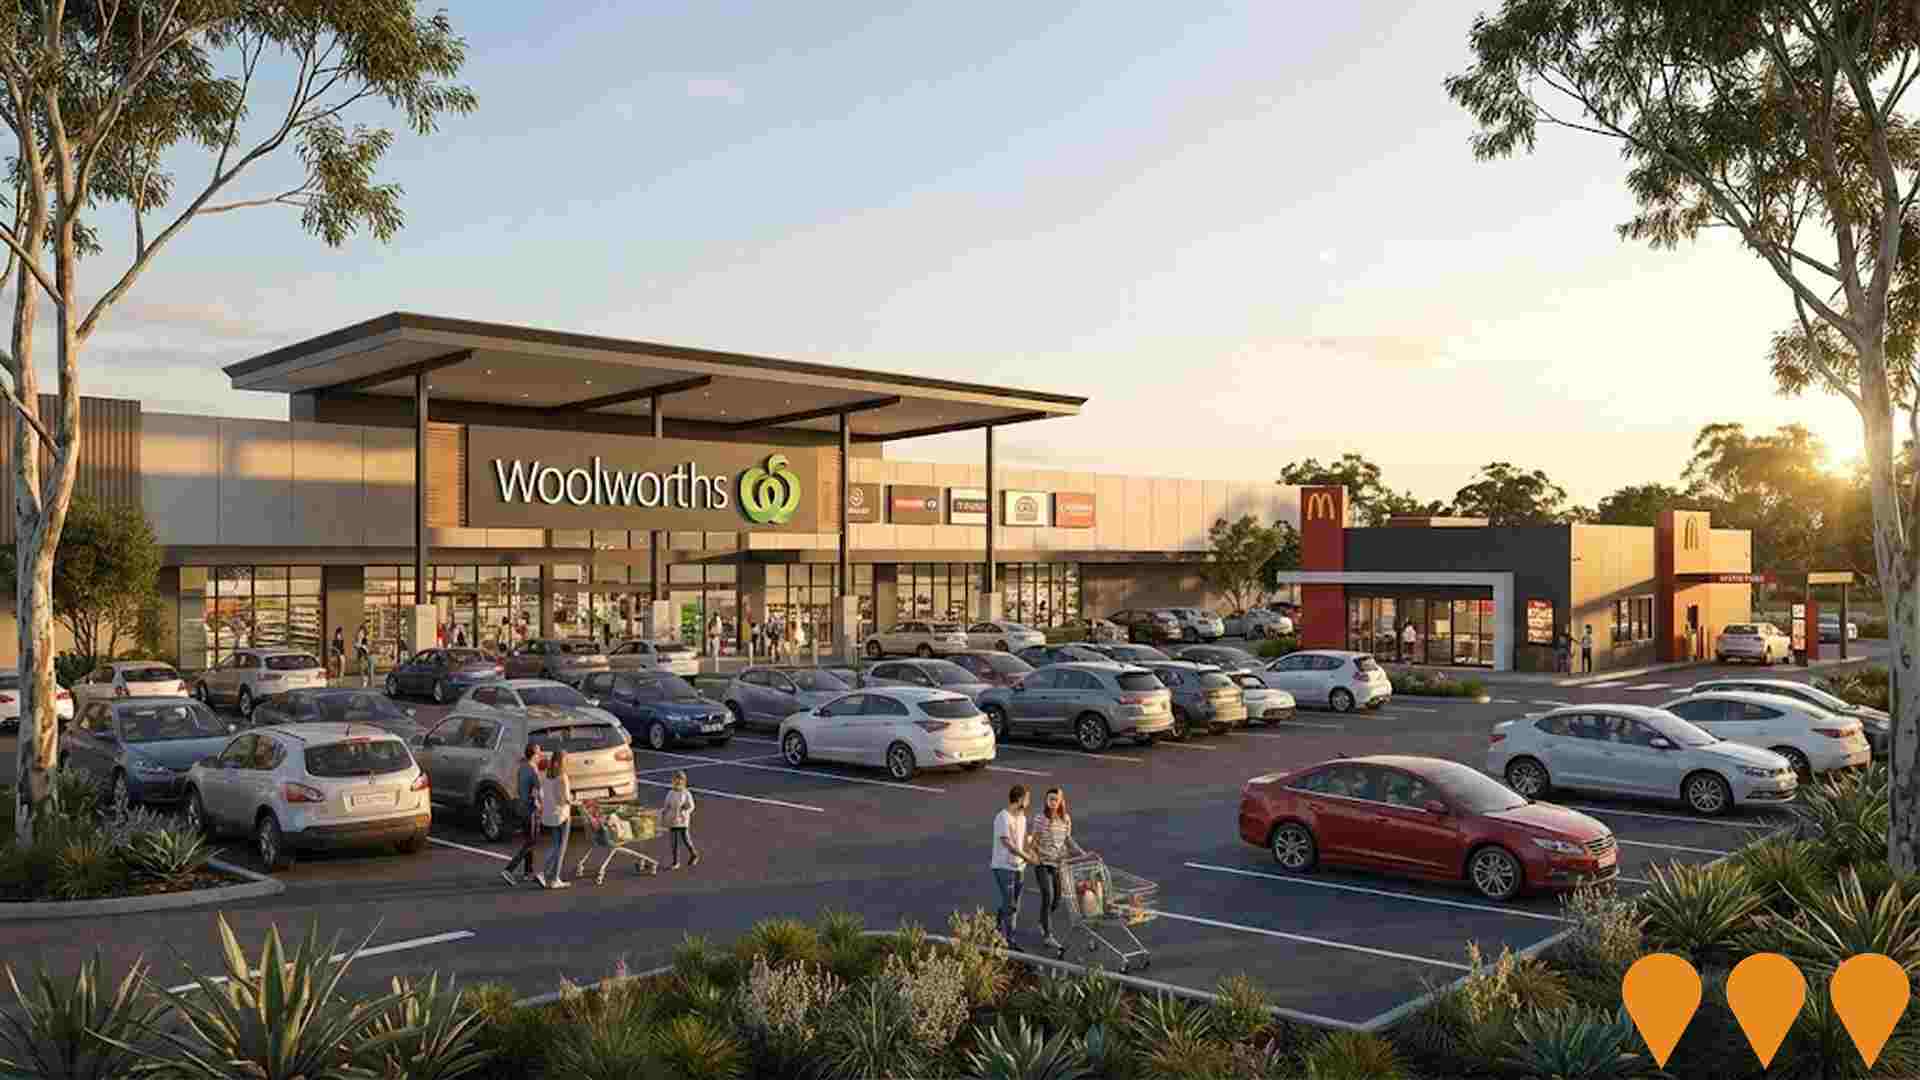
Hammond Park Shopping Centre
Neighbourhood shopping centre in Hammond Park anchored by a full-line Woolworths supermarket, approximately 6,000 mý GLA, 15 specialty tenancies, two standalone quick-service restaurant sites, and 370 on-site parking bays. Construction commenced May 2025 with practical completion targeted for Q3 2026. Developed by Aigle Royal Group with Hoskins Contracting as lead builder.
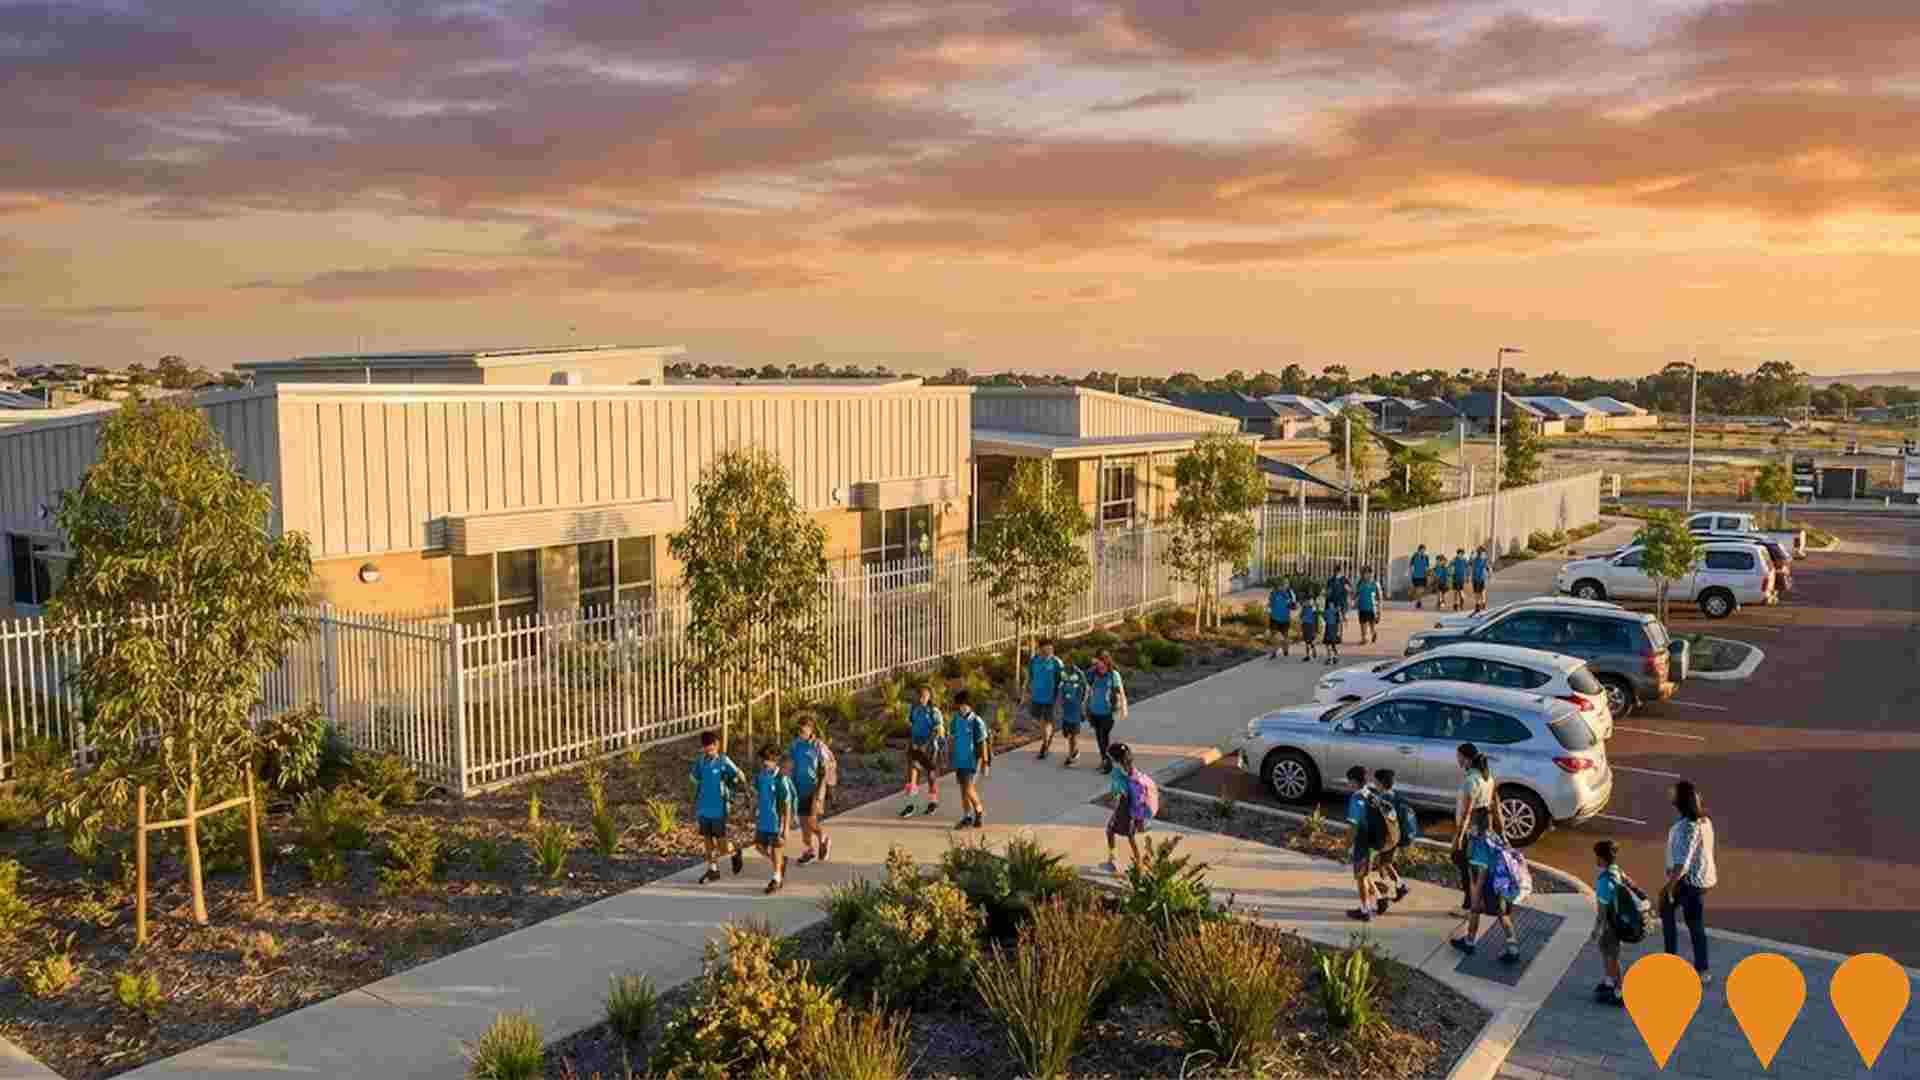
Treeby Primary School (Future)
Planned public primary school within Calleya Estate to serve the growing Treeby and surrounding community.
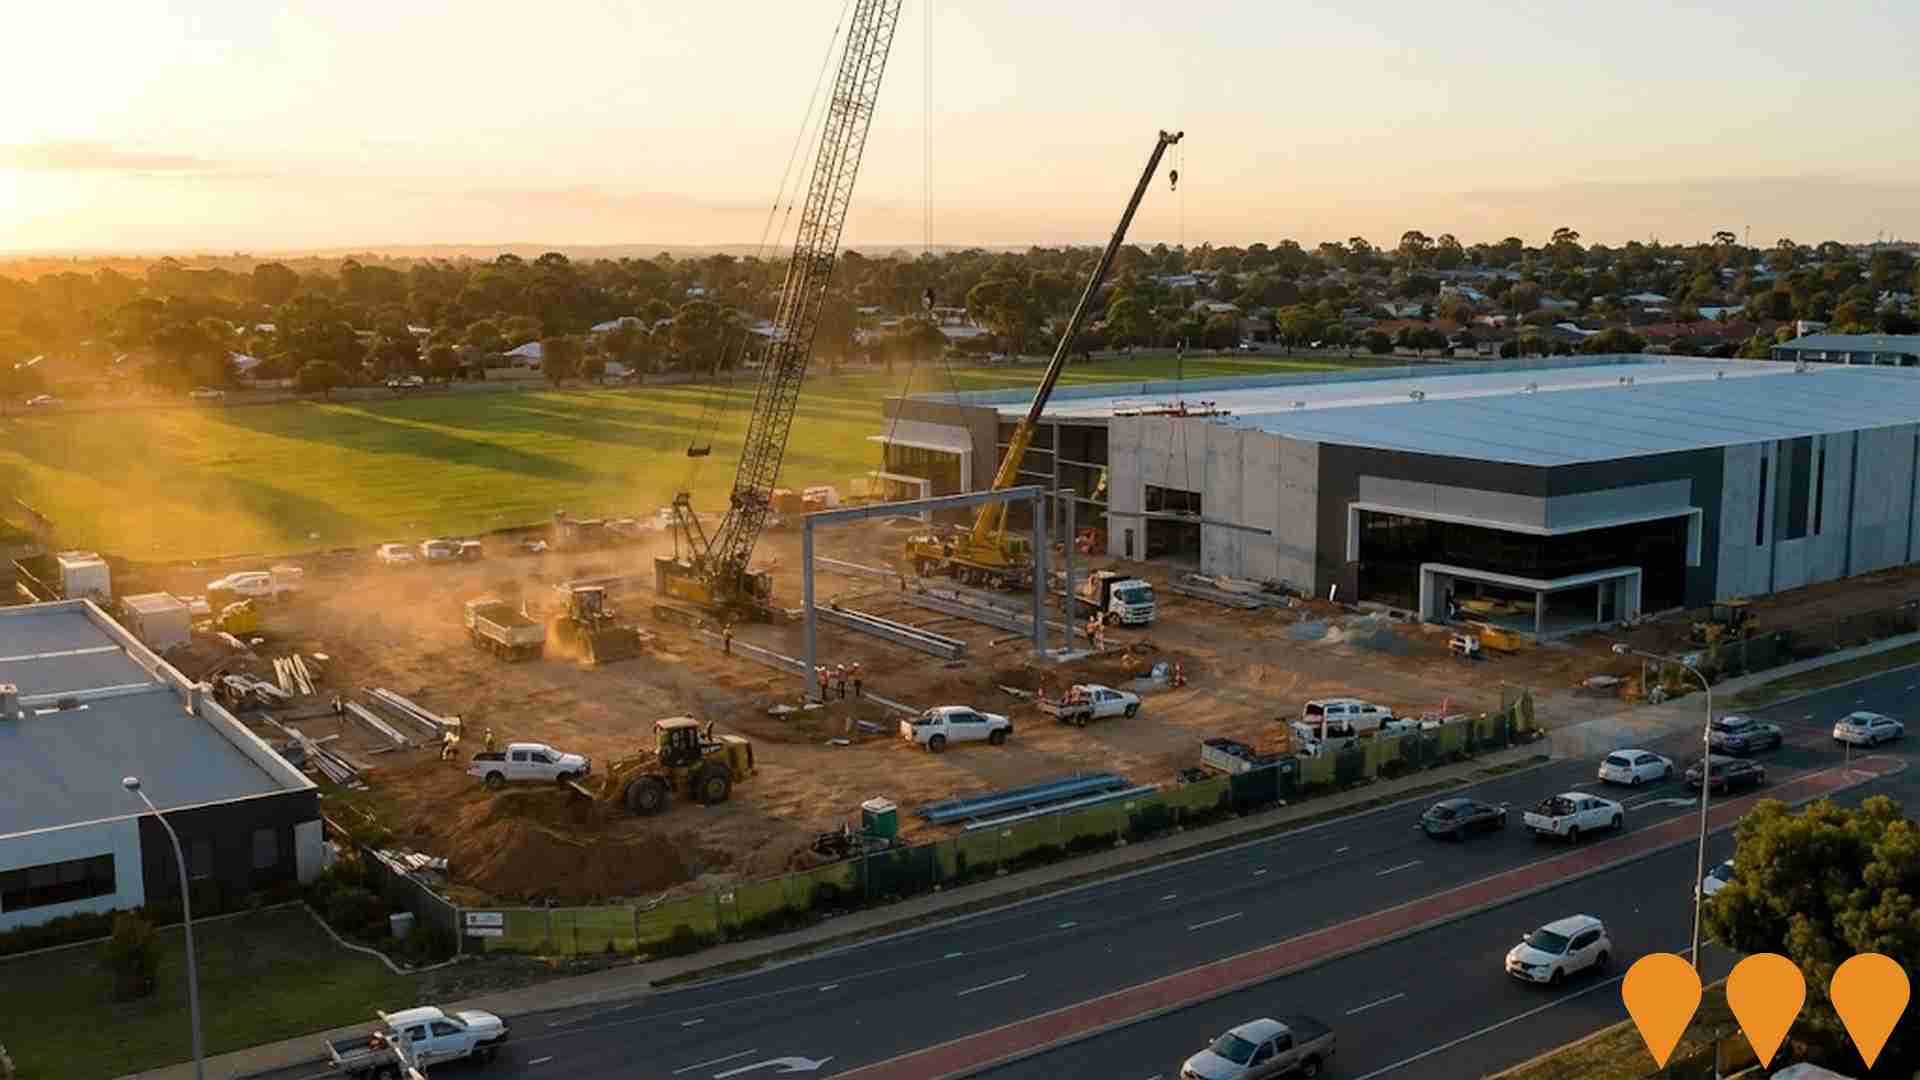
Forrestdale Business Park West
178-hectare master-planned industrial estate featuring light industrial, serviced commercial and general industrial zoned land. Expected to unlock $816 million in private investment, create 4,478 full-time jobs and generate $1.6 billion annual economic activity when fully operational.
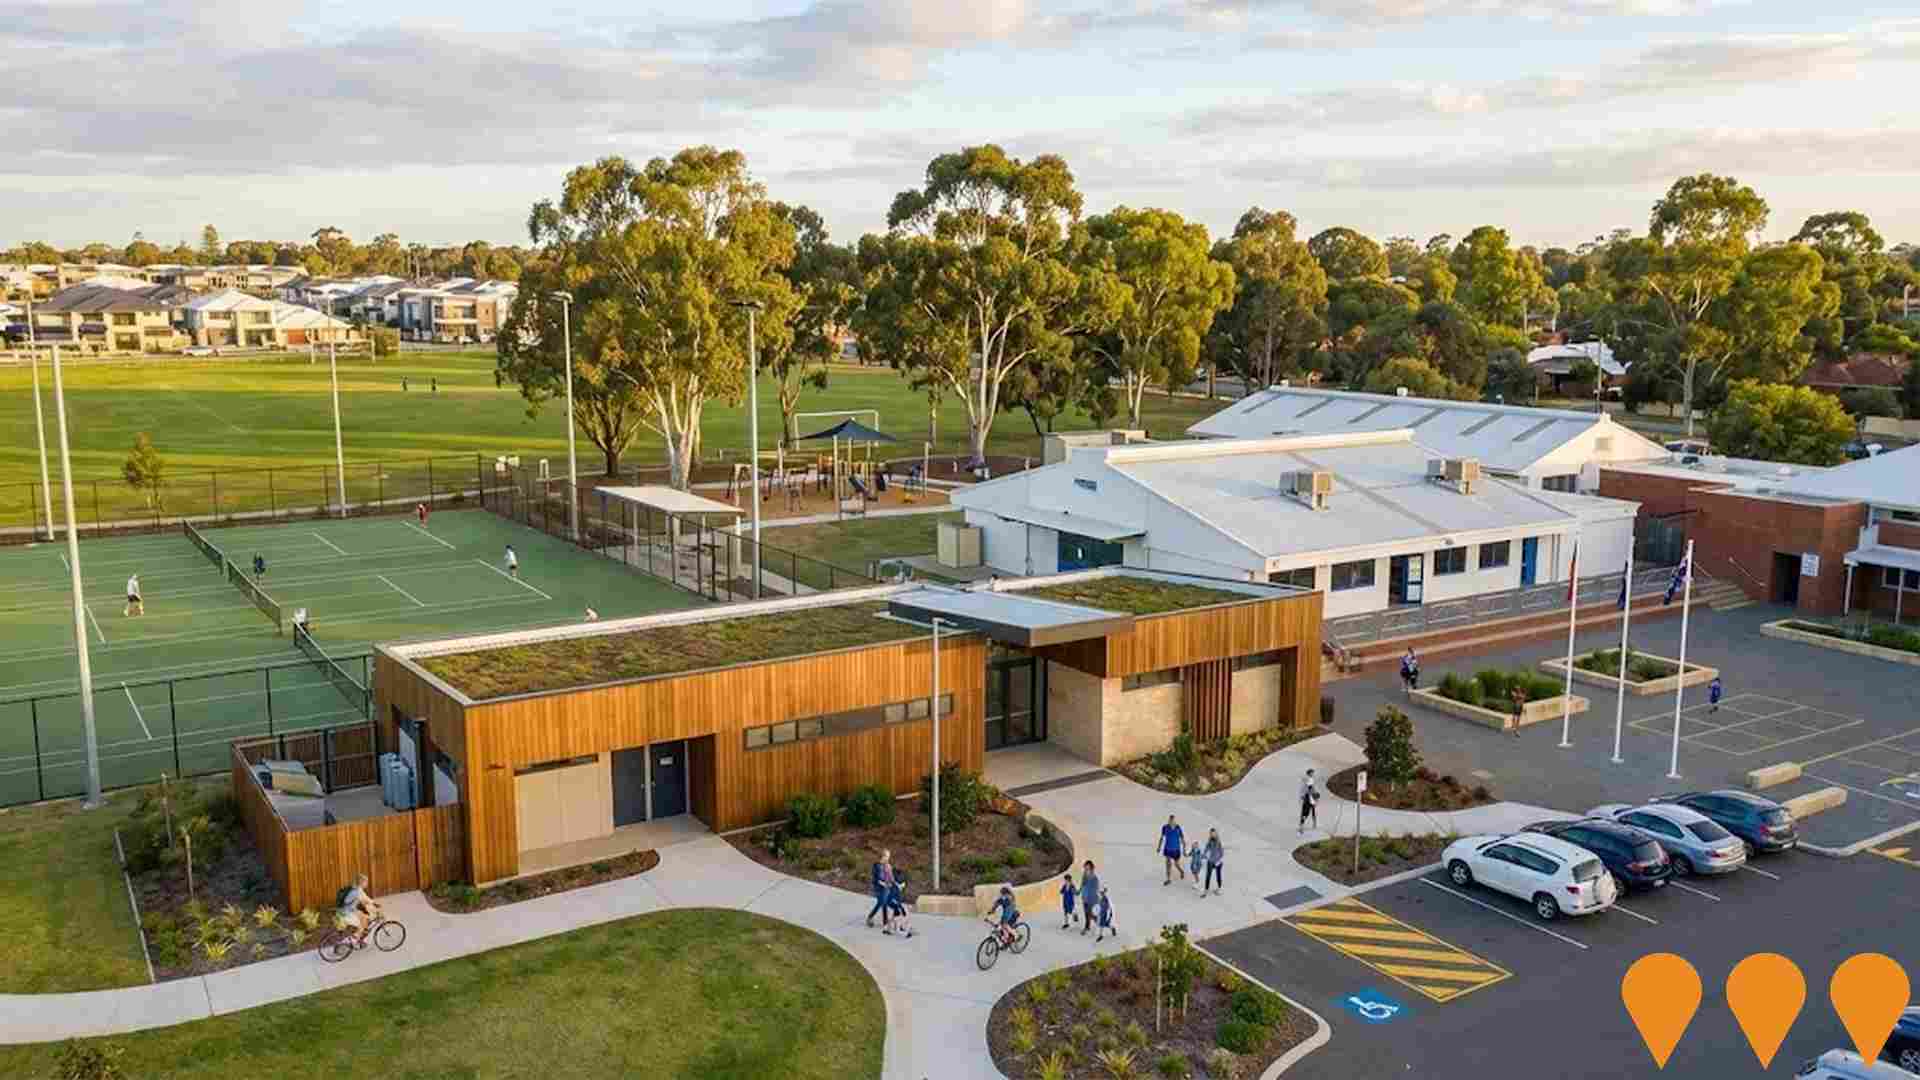
Jandakot Hall, Anning Park and Old Jandakot Primary School Master Plan
Master plan for consolidating sporting and community facilities at Jandakot Hall, Anning Park, and the heritage-protected Old Jandakot Primary School to improve utilisation, add gender-diverse changerooms, storage, and potentially a district-level tennis facility amid high-density growth. The project is listed as one of 26 major infrastructure proposals in the City of Cockburn's adopted Community Infrastructure Plan 2024-2041, which will guide long-term investment. Funding will be sought from internal resources, external grants, and partnerships, with project delivery times to be included in the City's Corporate Business Plan.
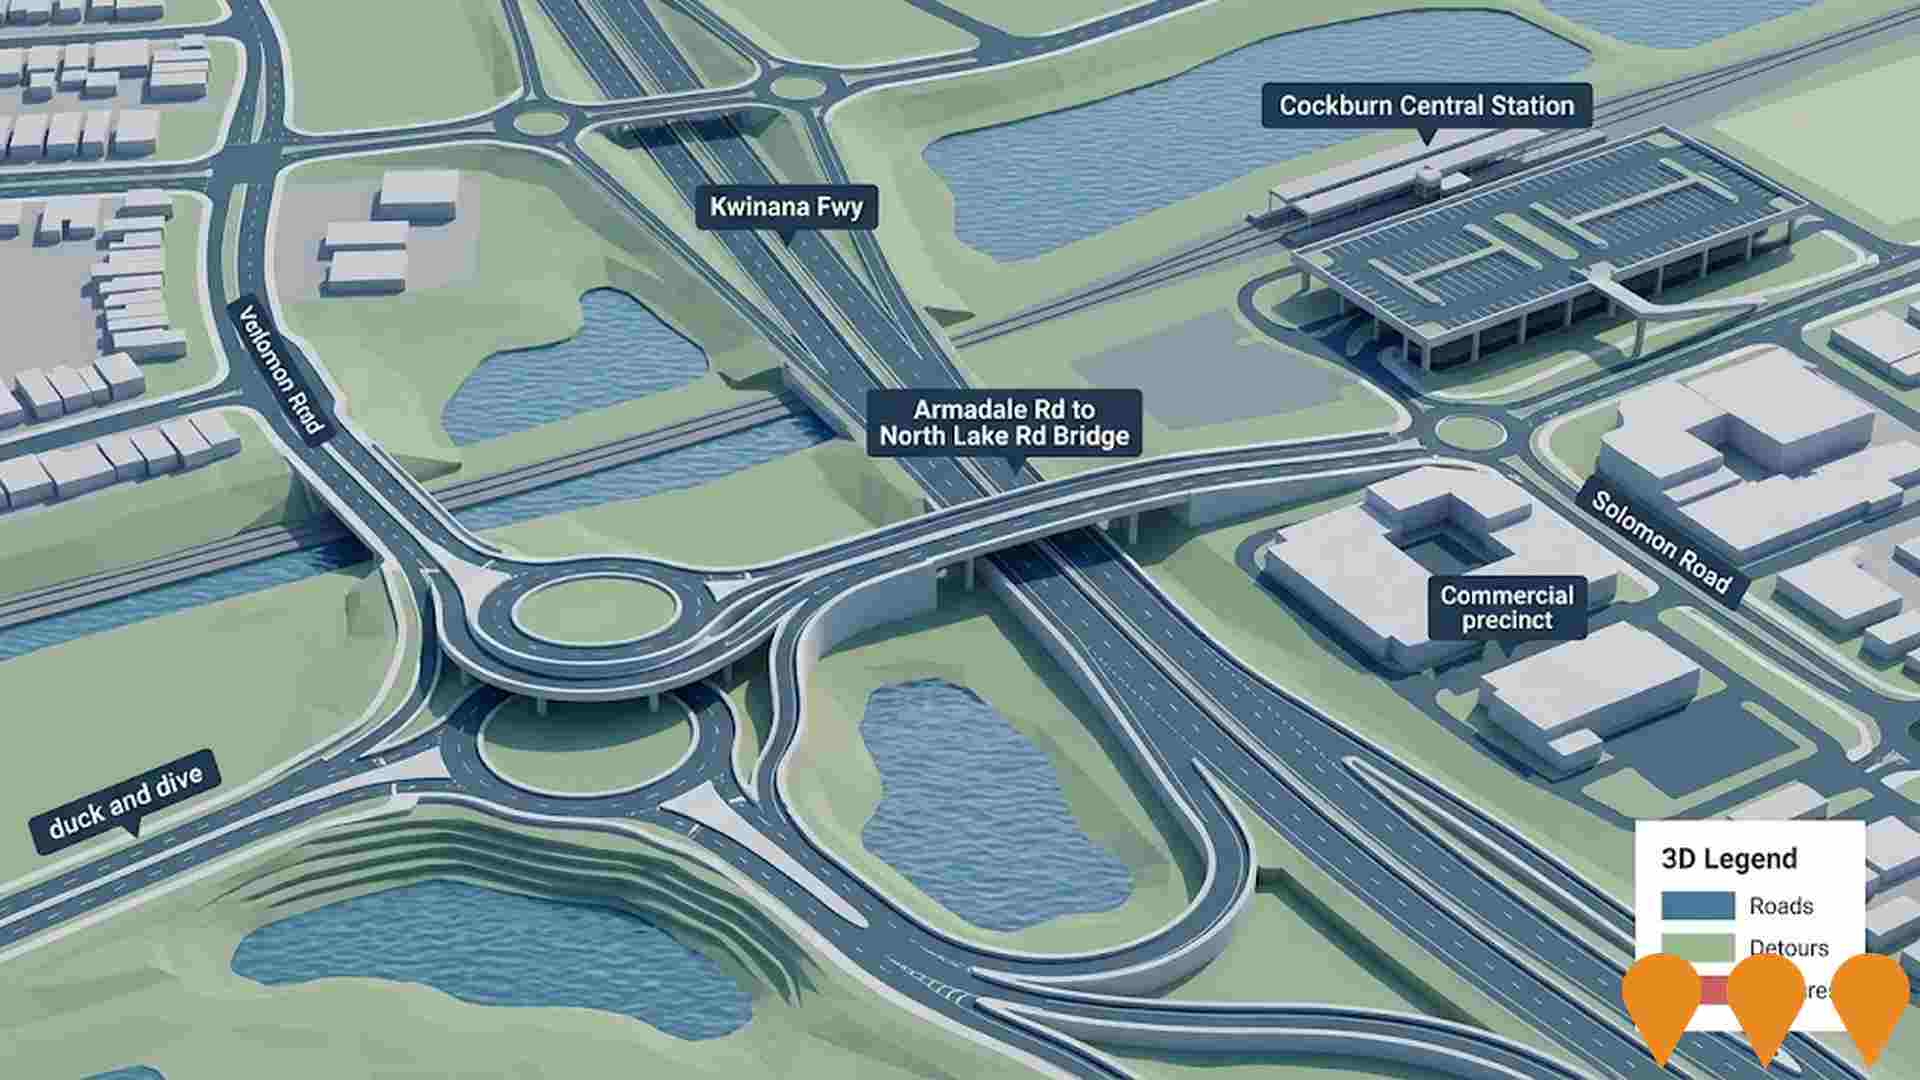
Armadale Road to North Lake Road Bridge
The Armadale Road to North Lake Road Bridge is a major transport infrastructure project built over the Kwinana Freeway to ease congestion and improve access for Cockburn Central visitors and residents. This world-class project opened in 2022 after two years of construction and serves over 50,000 vehicles daily. The project features Western Australia's first 'duck and dive' interchange design, where Armadale Road passes over one roundabout then under another. Works included a new bridge over Kwinana Freeway connecting Armadale Road and North Lake Road, upgrading Armadale Road from Tapper Road to Kwinana Freeway with new grade-separated roundabouts, new north-facing on and off ramps, collector-distributor roads on both sides of the freeway from Berrigan Drive to Armadale Road, and a 1,100-bay car park at Cockburn Central Station with shared paths for cyclists and pedestrians. The project won Best Civil Engineering Works Over $100,000,000 and Construction on a Challenging Site at the Master Builders-Bankwest Excellence in Construction Awards.
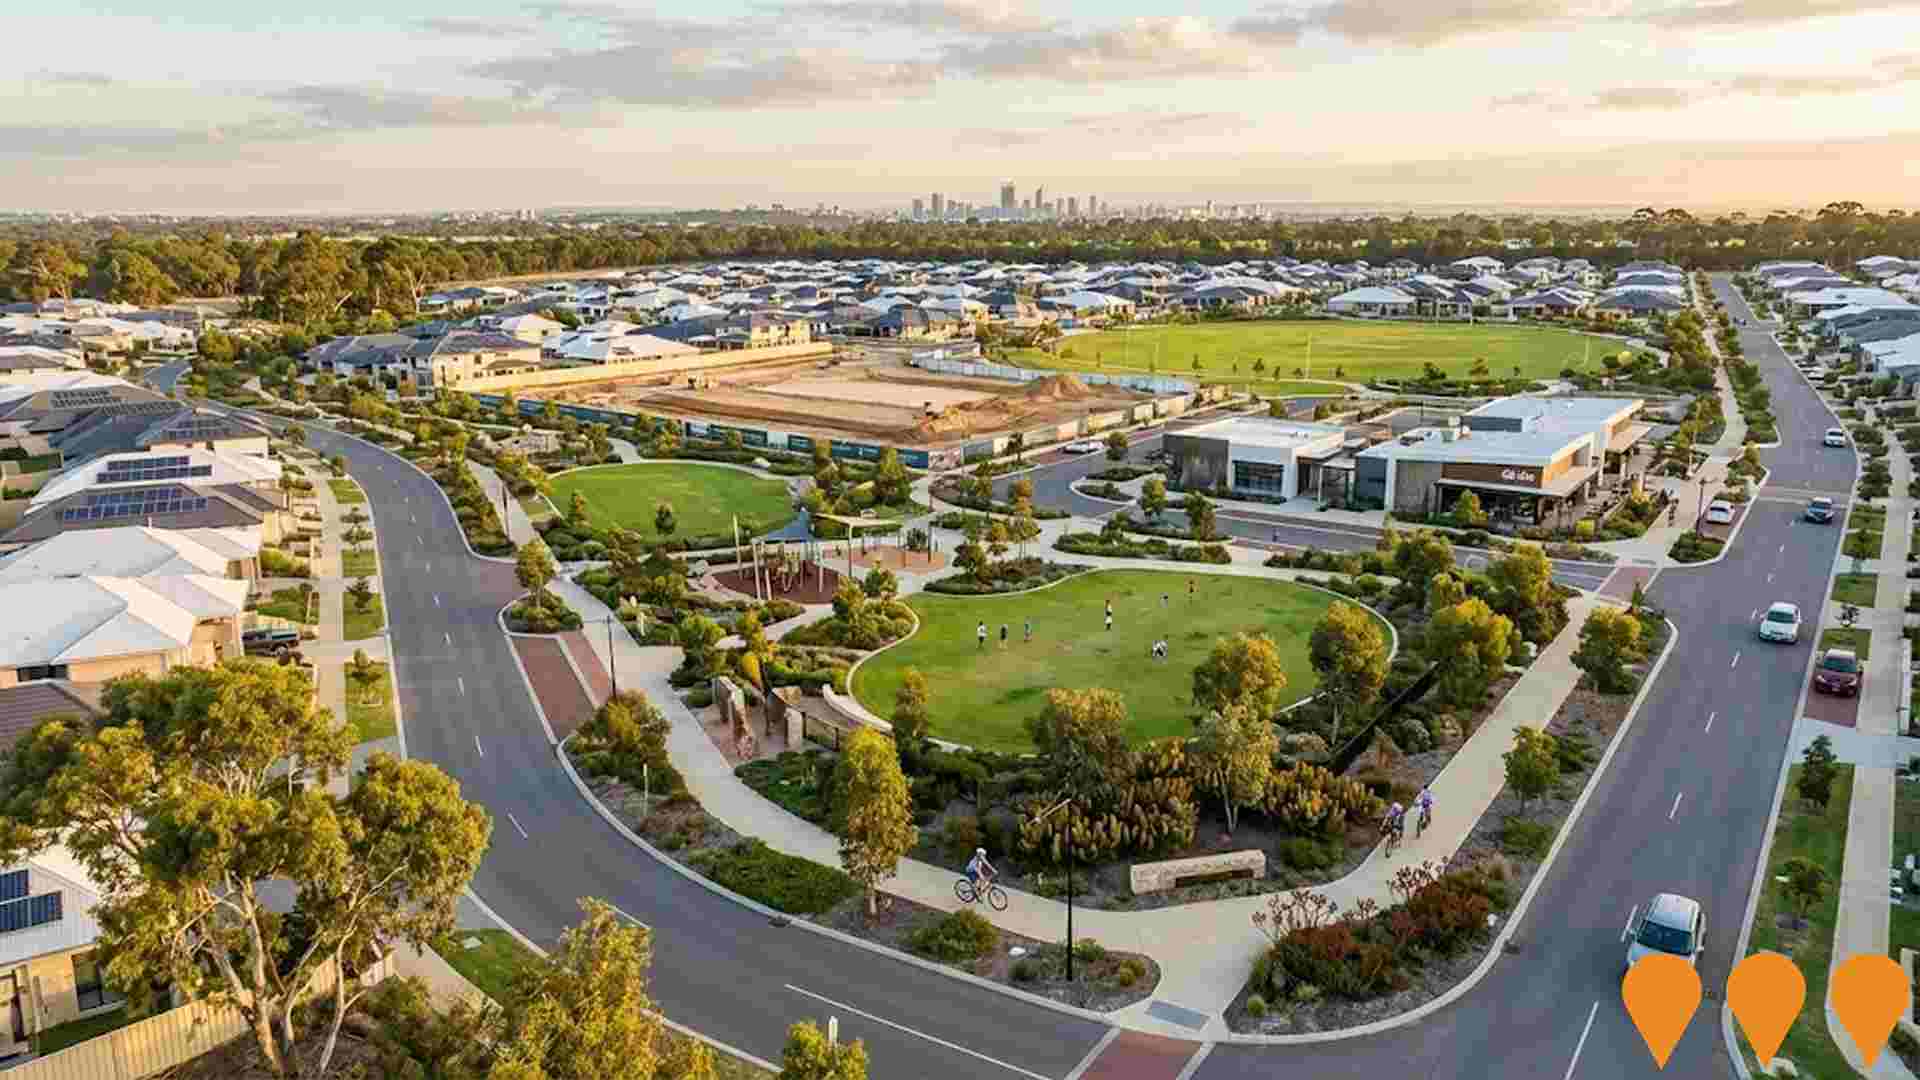
Calleya Estate by Stockland
Large master-planned residential community in Treeby featuring over 2,000 homes, parks, future primary school site, and integrated retail and community facilities.
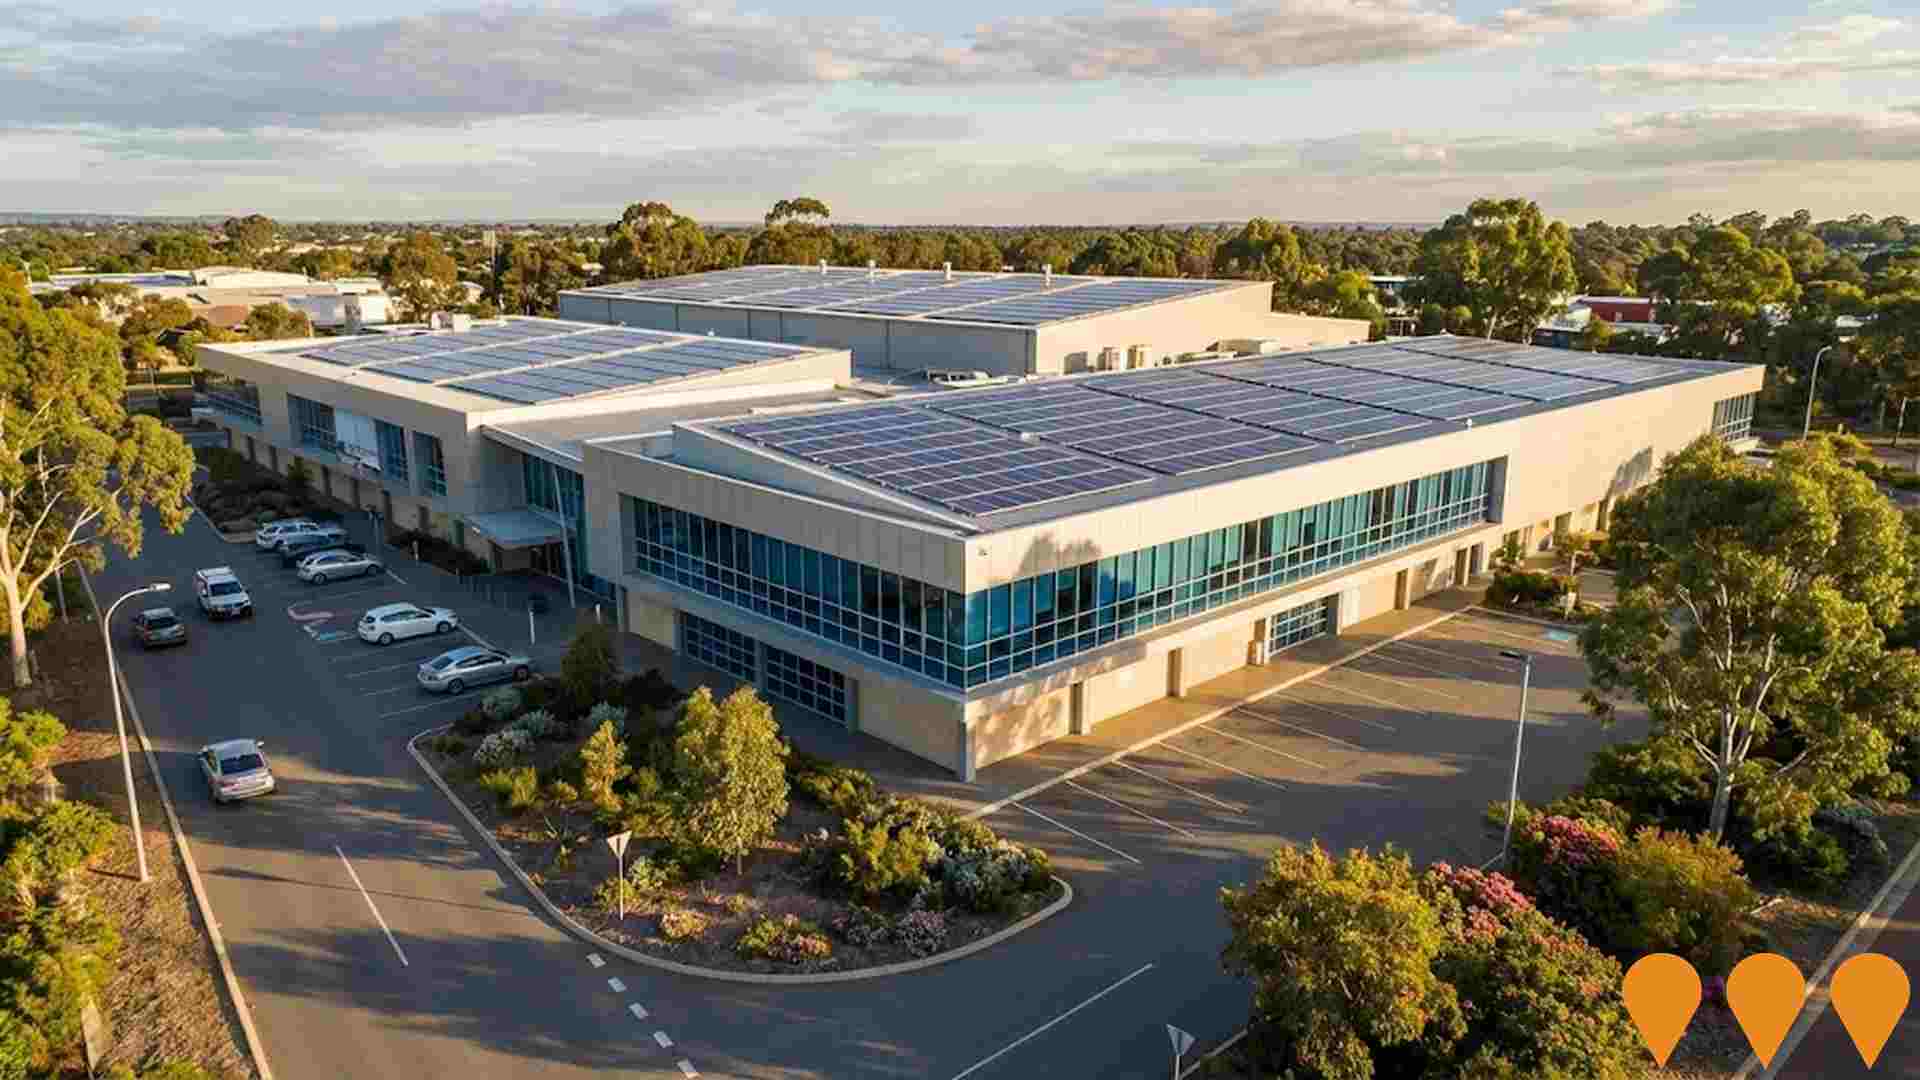
City of Armadale Solar Energy Program
Solar panel installation program across multiple City buildings including Administration Centre, Armadale Arena, Champion Centre, Orchard House, Armadale Fitness and Aquatic Centre (500kW), and others. Part of the City's Corporate Greenhouse Action Plan commitment to renewable energy and reducing carbon footprint.
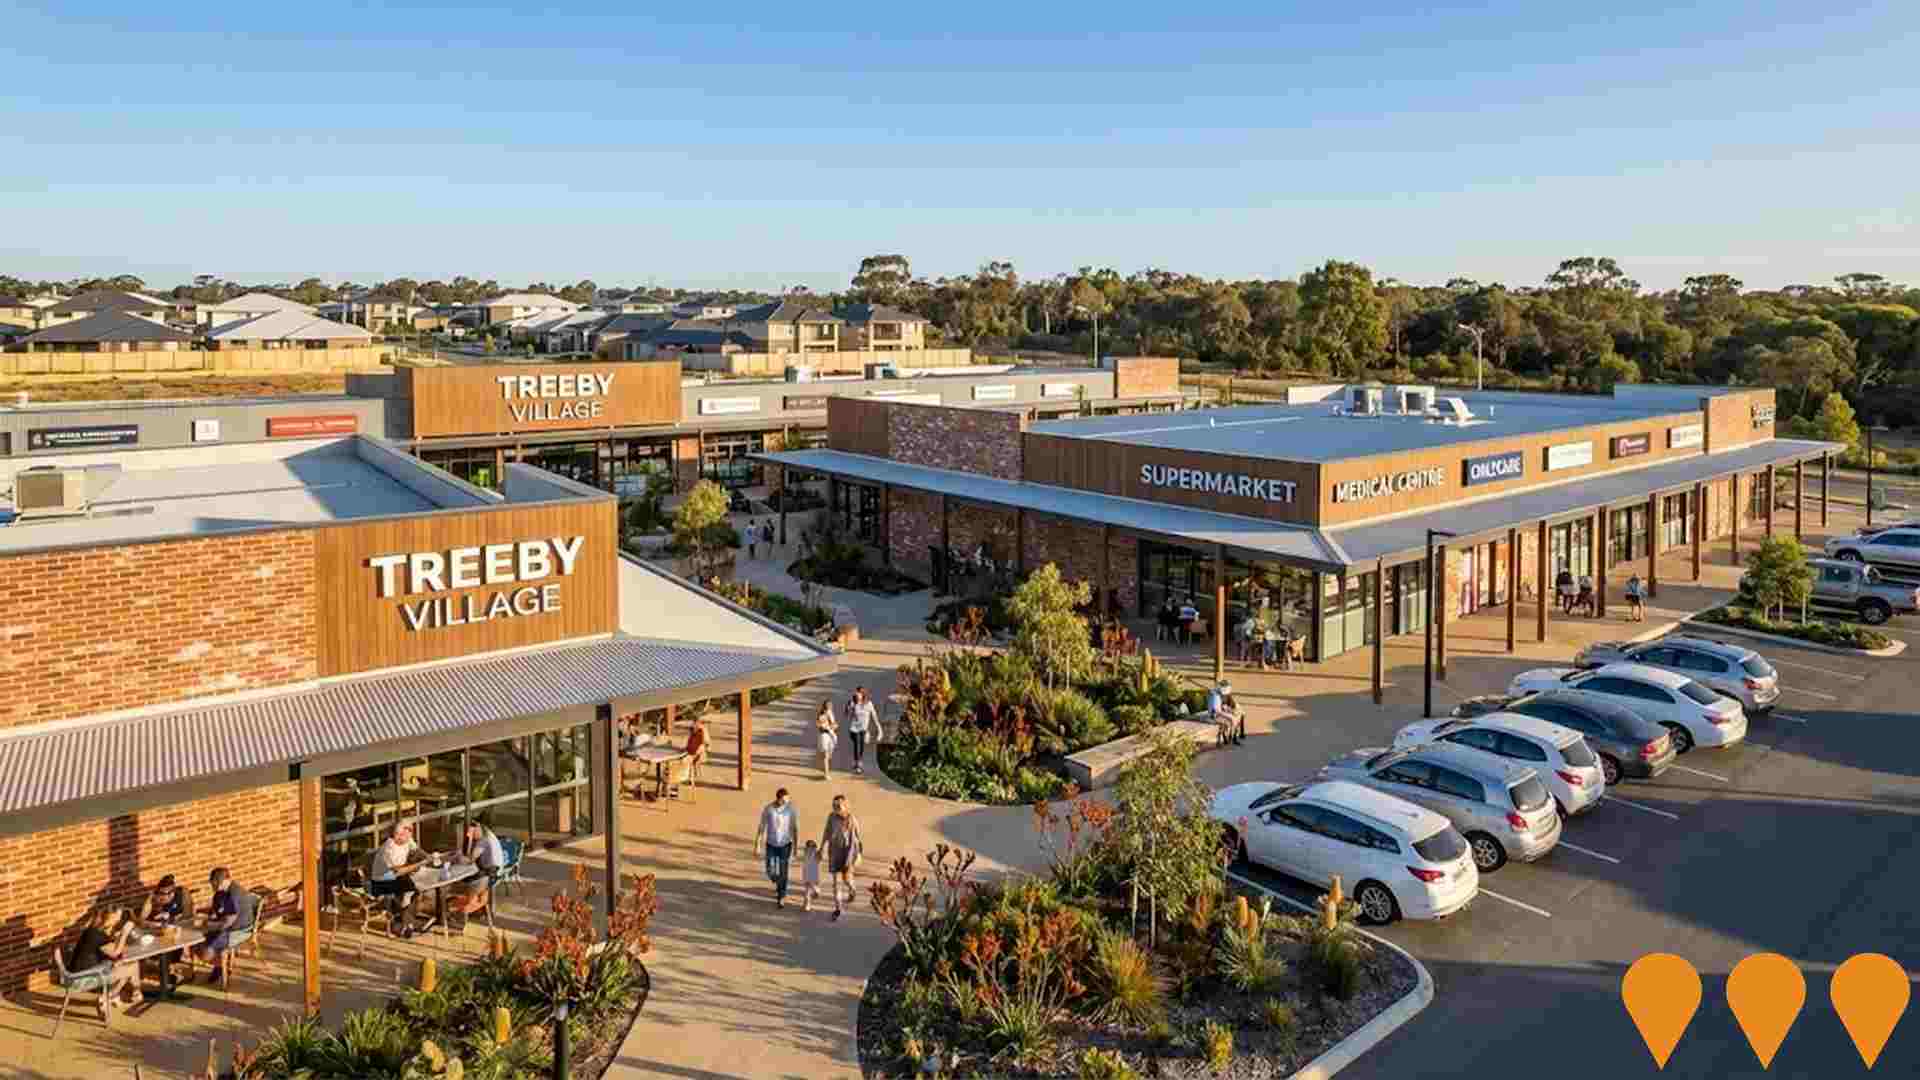
Treeby Village
Future neighbourhood retail centre within Calleya Estate including supermarket, specialty stores, medical centre, and childcare facility.
Employment
AreaSearch analysis of employment trends sees Banjup performing better than 90% of local markets assessed across Australia
Banjup has an educated workforce with strong representation in essential services sectors. Its unemployment rate is 1.9% and it saw a 4.6% employment growth over the past year as of September 2025.
In this month, 16,531 residents were employed while the unemployment rate was 2.0% lower than Greater Perth's 4.0%. Workforce participation in Banjup is high at 75.8%, compared to Greater Perth's 65.2%. Key industries of employment among residents are health care & social assistance, education & training, and construction. Notably, manufacturing has a higher concentration with employment levels at 1.2 times the regional average.
Conversely, accommodation & food services have lower representation at 5.8% compared to the regional average of 6.8%. The area offers limited local employment opportunities, as indicated by the difference between Census working population and resident population counts. Between September 2024 and September 2025, employment levels increased by 4.6% and labour force increased by 4.9%, causing the unemployment rate to rise by 0.3 percentage points. In comparison, Greater Perth recorded employment growth of 2.9%. State-level data from 25-Nov shows WA employment contracted by 0.27% (losing 5,520 jobs), with a state unemployment rate of 4.6%, compared to the national rate of 4.3%. National employment forecasts from May-25 project growth of 6.6% over five years and 13.7% over ten years. Applying these projections to Banjup's employment mix suggests local employment should increase by 6.4% over five years and 13.4% over ten years, based on a simple weighting extrapolation for illustrative purposes.
Frequently Asked Questions - Employment
Income
The economic profile demonstrates exceptional strength, placing the area among the top 10% nationally based on comprehensive AreaSearch income analysis
The Banjup SA2 has a high national income level based on latest ATO data aggregated by AreaSearch for financial year 2022. The median income among taxpayers in Banjup is $62,856 and the average income stands at $75,025. For Greater Perth, these figures are $58,380 and $78,020 respectively. With a Wage Price Index growth of 14.2% since financial year 2022, estimated incomes for September 2025 would be approximately $71,782 (median) and $85,679 (average). According to 2021 Census figures, household, family and personal incomes in Banjup rank highly nationally, between the 81st and 89th percentiles. The income distribution shows that 35.7% of residents (9,416 people) fall into the $1,500 - 2,999 bracket, similar to regional levels where 32.0% occupy this bracket. Banjup's affluence is evident with 38.1% earning over $3,000 per week, supporting premium retail and service offerings. Housing accounts for 14.7% of income, and strong earnings place residents within the 89th percentile for disposable income. The area's SEIFA income ranking places it in the 8th decile.
Frequently Asked Questions - Income
Housing
Banjup is characterized by a predominantly suburban housing profile, with ownership patterns similar to the broader region
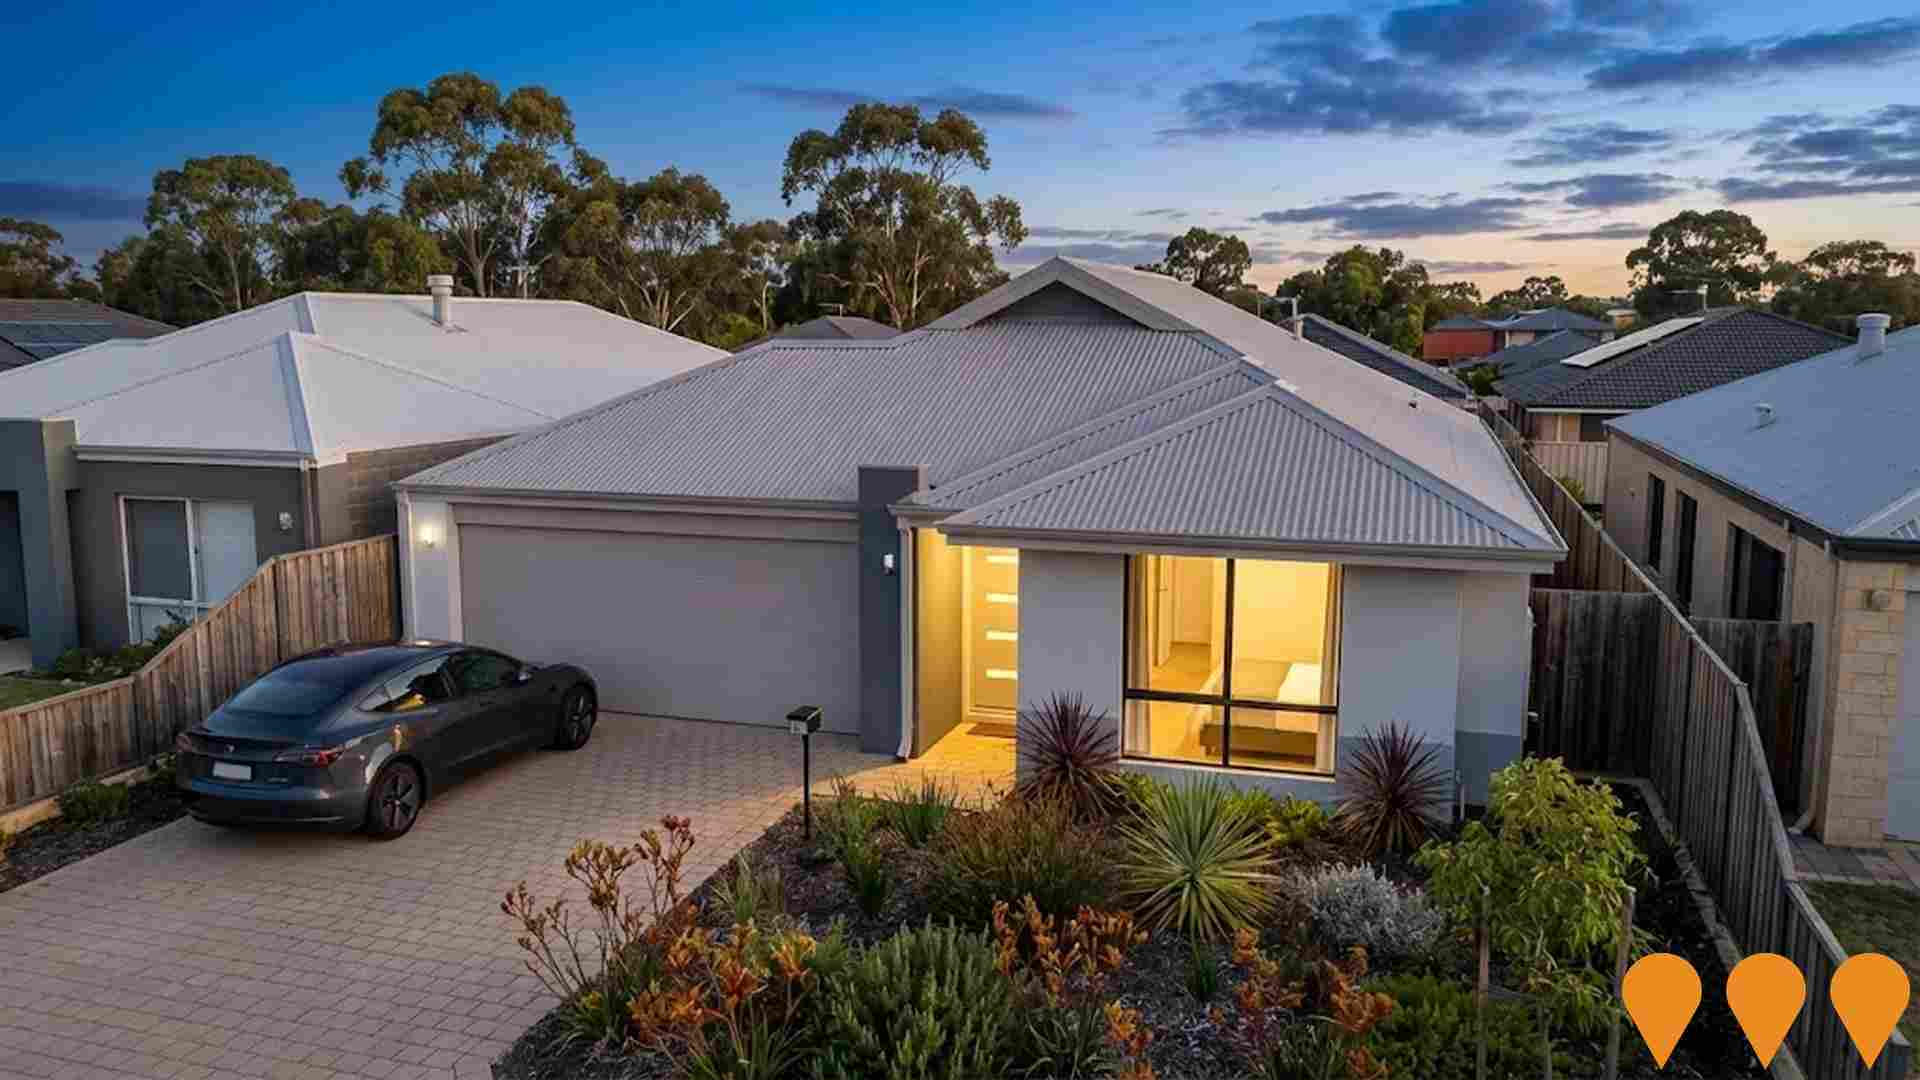
Banjup's dwelling structures, as per the latest Census, were 89.3% houses and 10.7% other dwellings (semi-detached, apartments, 'other' dwellings), contrasting with Perth metro's 81.2% houses and 18.8% other dwellings. Home ownership in Banjup stood at 20.0%, with mortgaged dwellings at 58.9% and rented ones at 21.0%. The median monthly mortgage repayment was $2,000, surpassing Perth metro's average of $1,950. Median weekly rent in Banjup was $420, higher than Perth metro's $370. Nationally, Banjup's mortgage repayments exceeded the Australian average of $1,863, and rents were substantially above the national figure of $375.
Frequently Asked Questions - Housing
Household Composition
Banjup features high concentrations of family households, with a higher-than-average median household size
Family households account for 84.0% of all households, including 49.1% couples with children, 24.0% couples without children, and 9.9% single parent families. Non-family households make up the remaining 16.0%, consisting of 13.6% lone person households and 2.4% group households. The median household size is 3.0 people, which is larger than the Greater Perth average of 2.6.
Frequently Asked Questions - Households
Local Schools & Education
The educational profile of Banjup exceeds national averages, with above-average qualification levels and academic performance metrics
Banjup has a higher percentage of residents with university qualifications (32.3%) compared to the SA3 area average (27.4%). Bachelor degrees are the most common at 22.5%, followed by postgraduate qualifications (6.9%) and graduate diplomas (2.9%). Vocational credentials are also prevalent, with 35.0% of residents aged 15+ holding such qualifications - advanced diplomas at 11.7% and certificates at 23.3%.
Educational participation is high, with 32.5% of residents currently enrolled in formal education. This includes 11.9% in primary education, 9.1% in secondary education, and 5.6% pursuing tertiary education.
Frequently Asked Questions - Education
Schools Detail
Nearby Services & Amenities
Transport
Transport servicing is low compared to other areas nationally based on assessment of service frequency, route connectivity and accessibility
Banjup has 69 operational public transport stops, all of which are bus stops. These stops are served by six different routes that together facilitate 1,626 weekly passenger trips. The accessibility of these services is considered good, with residents on average being located 332 meters from the nearest stop.
Across all routes, an average of 232 trips per day is maintained, which translates to approximately 23 weekly trips per individual stop.
Frequently Asked Questions - Transport
Transport Stops Detail
Health
Banjup's residents boast exceedingly positive health performance metrics with younger cohorts in particular seeing very low prevalence of common health conditions
Banjup's health outcomes data shows excellent results, particularly for younger age groups who have a very low prevalence of common health conditions.
Approximately 57% (~15,060 people) of Banjup's total population has private health cover. The most prevalent medical conditions are mental health issues (7.1%) and asthma (6.5%), while 77.0% of residents report no medical ailments compared to 72.9% in Greater Perth. As of 31 March 2021, 10.5% (2,758 people) of Banjup's residents are aged 65 and over, lower than the 14.8% in Greater Perth. Despite this, health outcomes among seniors require more attention than those in the broader population.
Frequently Asked Questions - Health
Cultural Diversity
Banjup was found to be more culturally diverse than the vast majority of local markets in Australia, upon assessment of a range of language and cultural background related metrics
Banjup's cultural diversity was higher than most local markets, with 24.3% of residents speaking a language other than English at home and 37.0% born overseas. Christianity was the predominant religion in Banjup, accounting for 43.7% of its population. Notably, Hinduism was overrepresented in Banjup compared to Greater Perth, comprising 4.0% versus 1.9%.
The top three ancestry groups were English (26.1%), Australian (22.9%), and Other (10.7%). Some ethnic groups showed notable differences: South African residents made up 1.4% of Banjup's population compared to 1.1% regionally, Maori residents comprised 1.0% versus 0.9%, and New Zealand residents accounted for 1.0% versus 0.9%.
Frequently Asked Questions - Diversity
Age
Banjup hosts a young demographic, positioning it in the bottom quartile nationwide
Banjup's median age is 34 years, which is lower than Greater Perth's average of 37 and considerably younger than Australia's median age of 38. Compared to Greater Perth, Banjup has a higher proportion of residents aged 35-44 (17.8%) but fewer residents aged 65-74 (6%). Between the 2021 Census and now, the percentage of residents aged 75-84 has grown from 2.4% to 3.5%, while those aged 55-64 increased from 8.2% to 9.3%. Conversely, the proportion of residents aged 5-14 has declined from 16.0% to 14.2%. By 2041, population forecasts indicate significant demographic changes in Banjup. The 45-54 age group is projected to grow by 34%, adding 1,232 residents to reach a total of 4,862. In contrast, the number of residents aged 5-14 is expected to fall by 64%.
