Chart Color Schemes
This analysis uses ABS Statistical Areas Level 2 (SA2) boundaries, which can materially differ from Suburbs and Localities (SAL) even when sharing similar names.
SA2 boundaries are defined by the Australian Bureau of Statistics and are designed to represent communities for statistical reporting (e.g., census and ERP).
Suburbs and Localities (SAL) represent commonly-used suburb/locality names (postal-style areas) and may use different geographic boundaries. For comprehensive analysis, consider reviewing both boundary types if available.
est. as @ -- *
ABS ERP | -- people | --
2021 Census | -- people
Sales Activity
Curious about local property values? Filter the chart to assess the volume and appreciation (including resales) trends and regional comparisons, or scroll to the map below view this information at an individual property level.
Find a Recent Sale
Sales Detail
Population
Population growth drivers in Seville Grove are strong compared to national averages based on AreaSearch's ranking of recent, and medium to long-term trends
Seville Grove's population, as of November 2025, is approximately 12,725. This figure represents an increase of 1,316 people since the 2021 Census, which reported a population of 11,409. The change was inferred from the estimated resident population of 12,722 as of June 2024 and an additional 14 validated new addresses since the Census date. This results in a population density ratio of 2,784 persons per square kilometer, placing Seville Grove in the upper quartile relative to national locations assessed by AreaSearch. The area's growth rate of 11.5% since the 2021 census exceeds the national average of 8.9%, indicating it as a growth leader in the region. Natural growth contributed approximately 54.0% of overall population gains during recent periods.
AreaSearch is adopting ABS/Geoscience Australia projections for each SA2 area, released in 2024 with a base year of 2022. For areas not covered by this data and to estimate post-2032 growth, AreaSearch uses growth rates by age cohort provided by the ABS in its latest Greater Capital Region projections, released in 2023 based on 2022 data. Looking ahead, demographic trends suggest a population increase just below the median of statistical areas analysed by AreaSearch, with an expected expansion to approximately 14,308 persons by 2041, reflecting a total increase of 12.4% over the 17-year period based on the latest annual ERP population numbers.
Frequently Asked Questions - Population
Development
Residential development activity is lower than average in Seville Grove according to AreaSearch's national comparison of local real estate markets
Seville Grove has recorded approximately 14 residential properties granted approval each year over the past five financial years, totalling 72 homes. In FY-26 so far, 4 approvals have been recorded. On average, around 17.9 people per year moved to the area for each dwelling built between FY-21 and FY-25, indicating significant demand exceeding new supply. New properties are constructed at an average expected cost of $161,000, below the regional average, suggesting more affordable housing options.
This financial year has seen $1.7 million in commercial approvals, reflecting minimal commercial development activity compared to Greater Perth, where Seville Grove shows substantially reduced construction, 89.0% below the regional average per person. New development consists of 90.0% detached houses and 10.0% attached dwellings, sustaining the area's suburban identity with a concentration of family homes suited to buyers seeking space. The location has approximately 1269 people per dwelling approval, demonstrating an established market. Population forecasts indicate Seville Grove will gain 1,580 residents through to 2041, suggesting that if current construction levels persist, housing supply could lag population growth, likely intensifying buyer competition and underpinning price growth.
Population forecasts indicate Seville Grove will gain 1,580 residents through to 2041 (from the latest AreaSearch quarterly estimate). Should current construction levels persist, housing supply could lag population growth, likely intensifying buyer competition and underpinning price growth.
Frequently Asked Questions - Development
Infrastructure
Seville Grove has emerging levels of nearby infrastructure activity, ranking in the 30thth percentile nationally
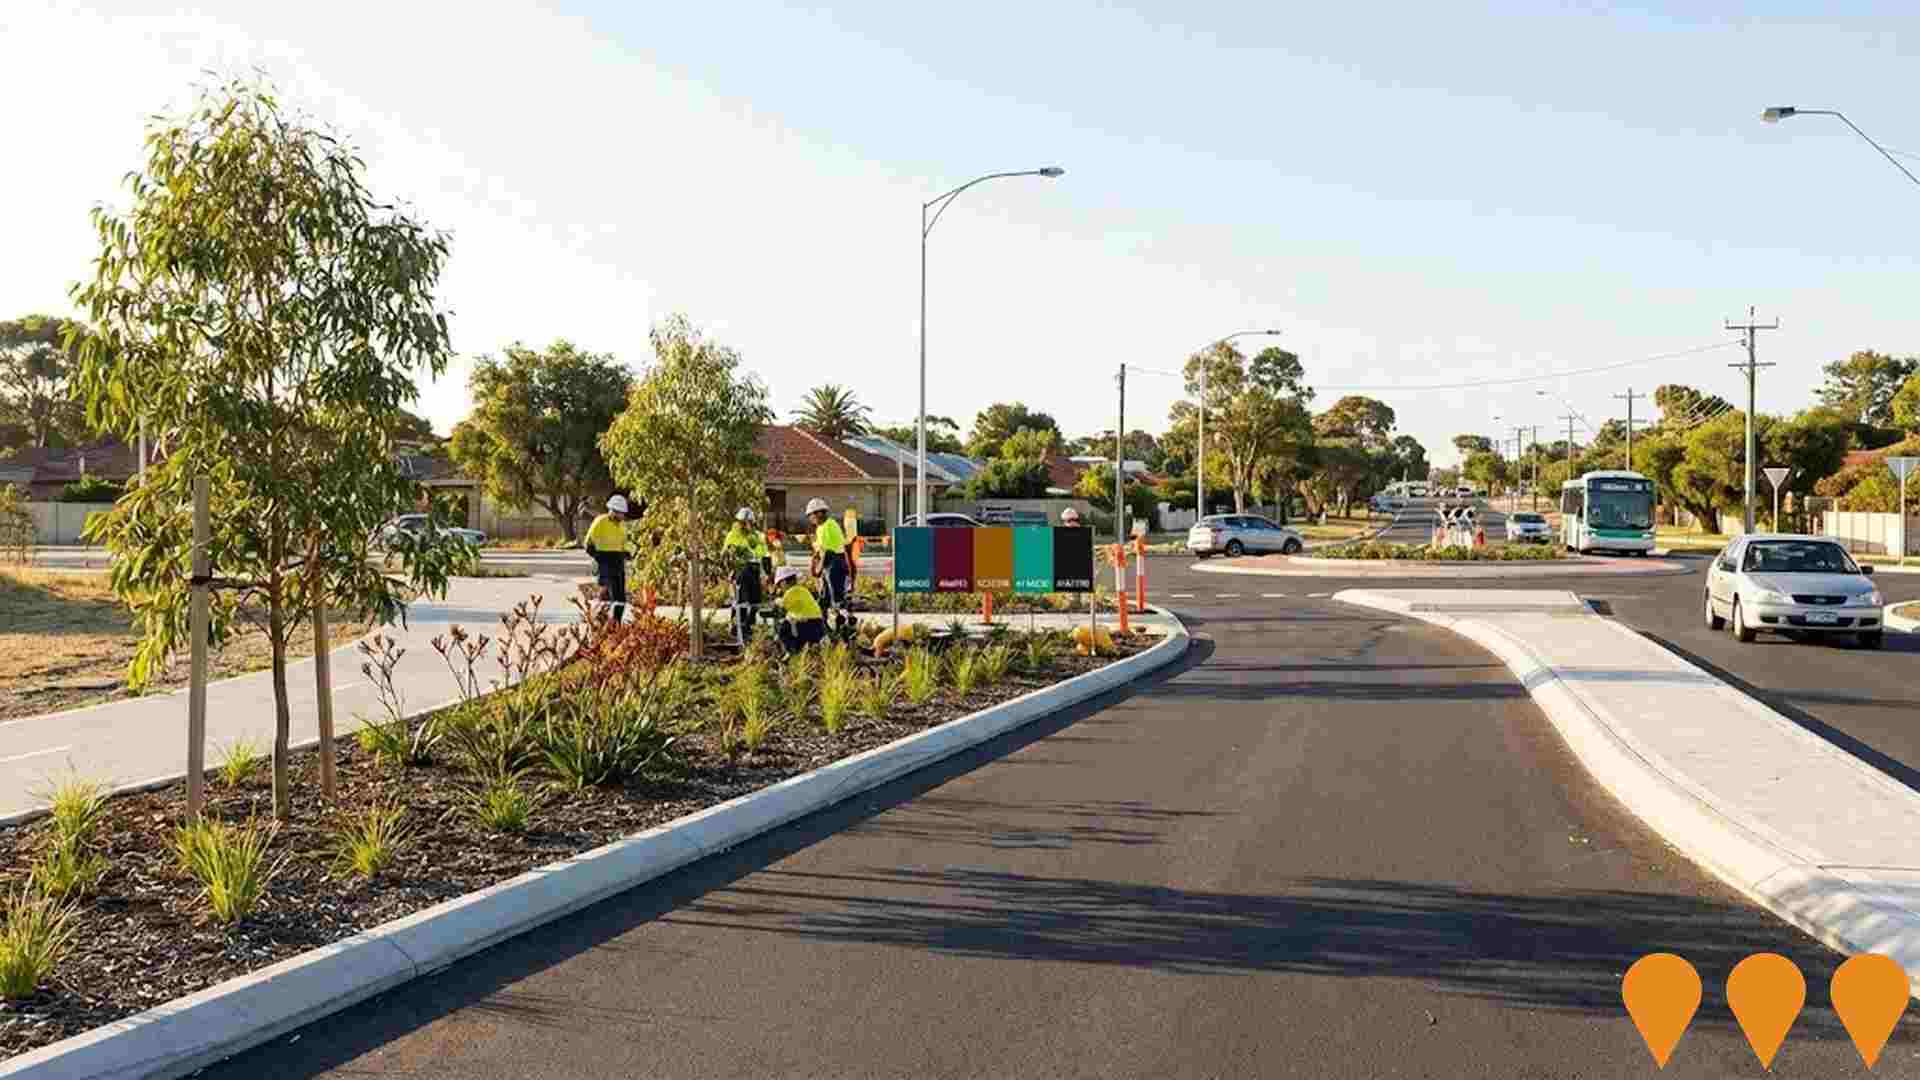
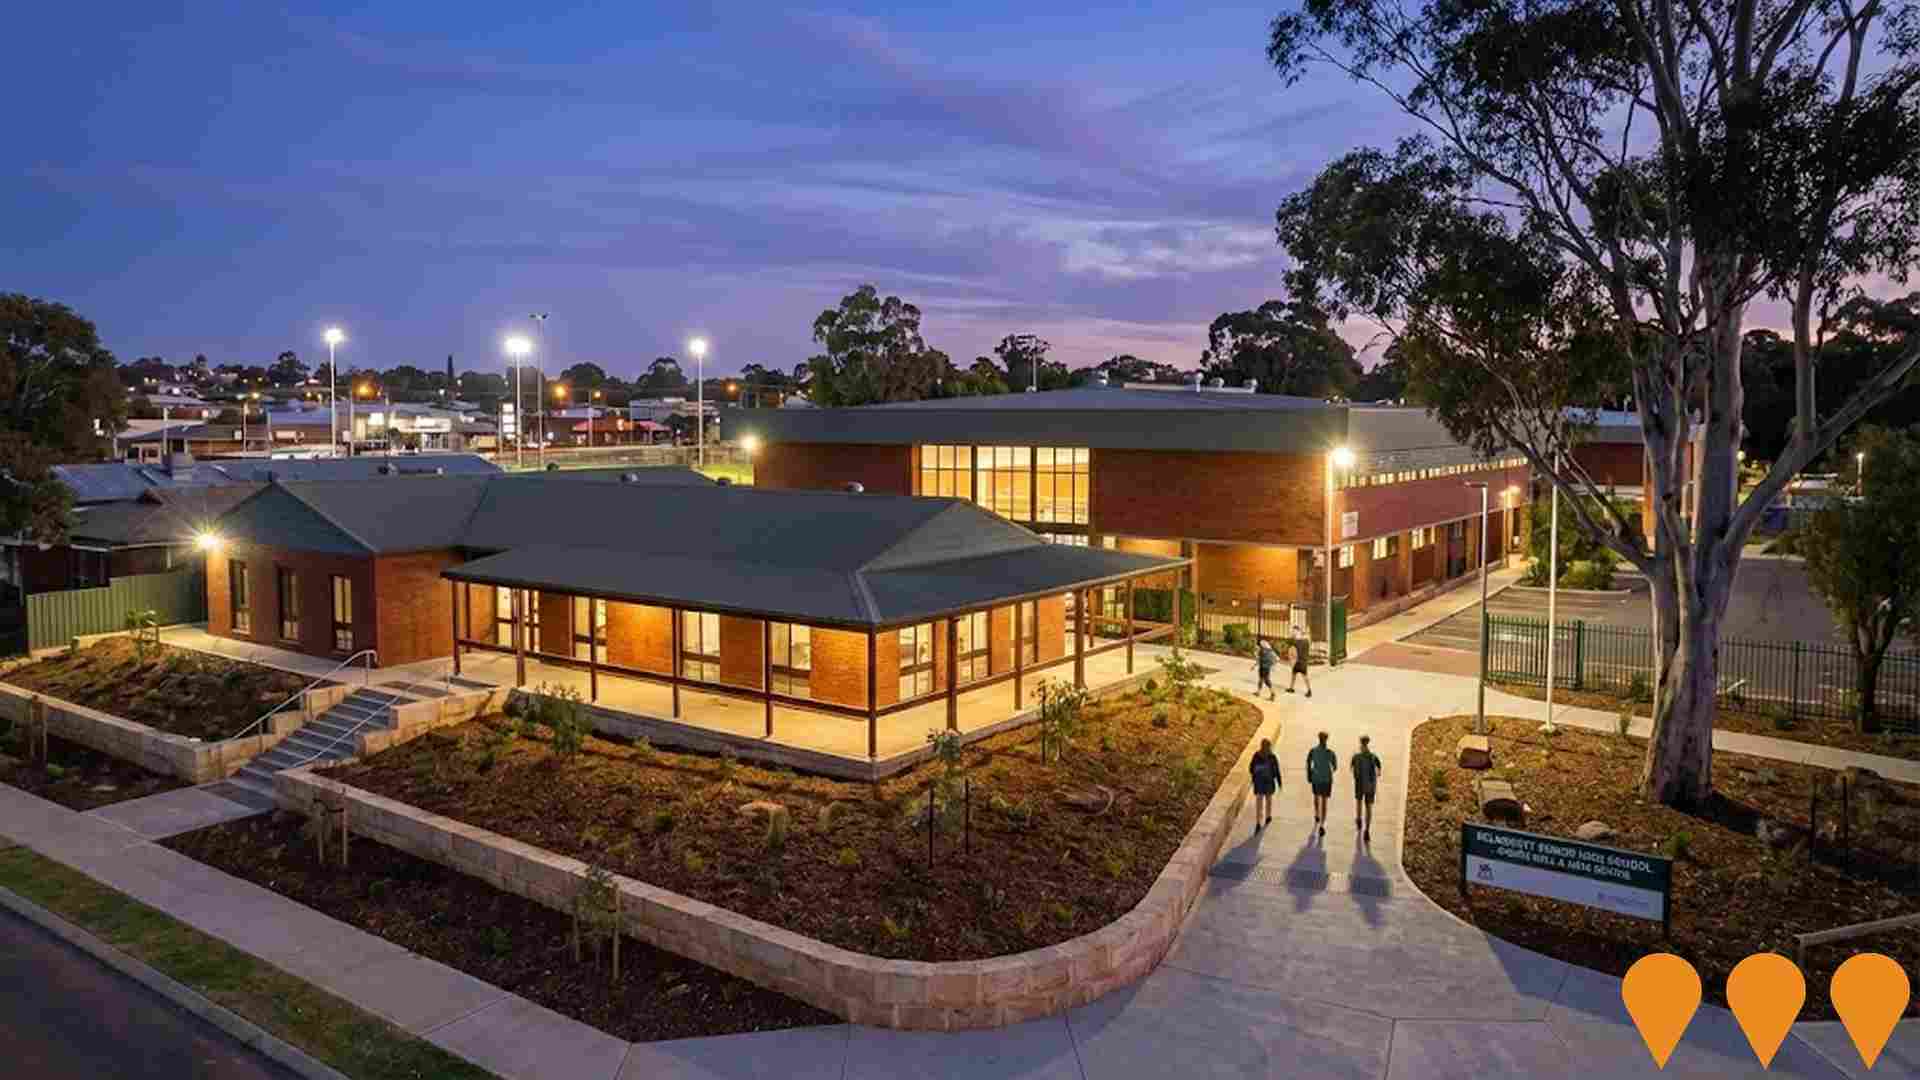
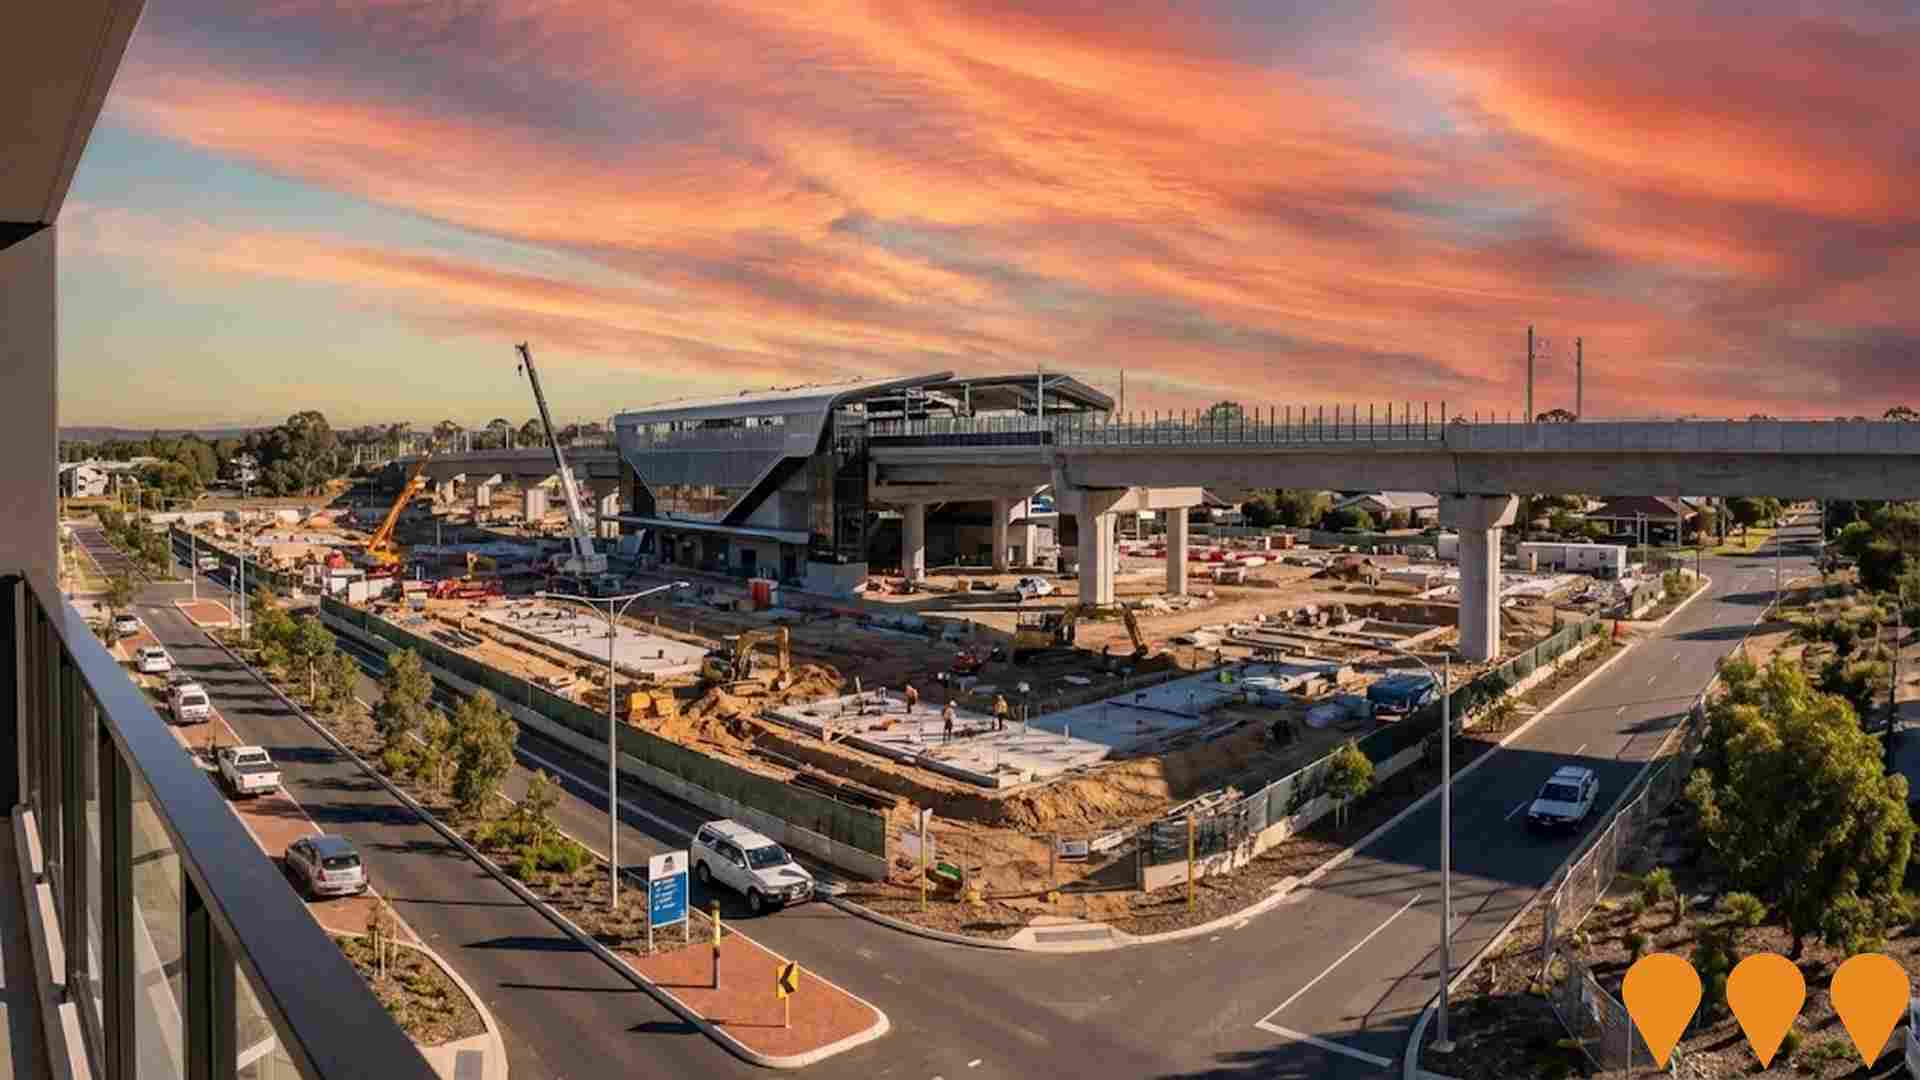
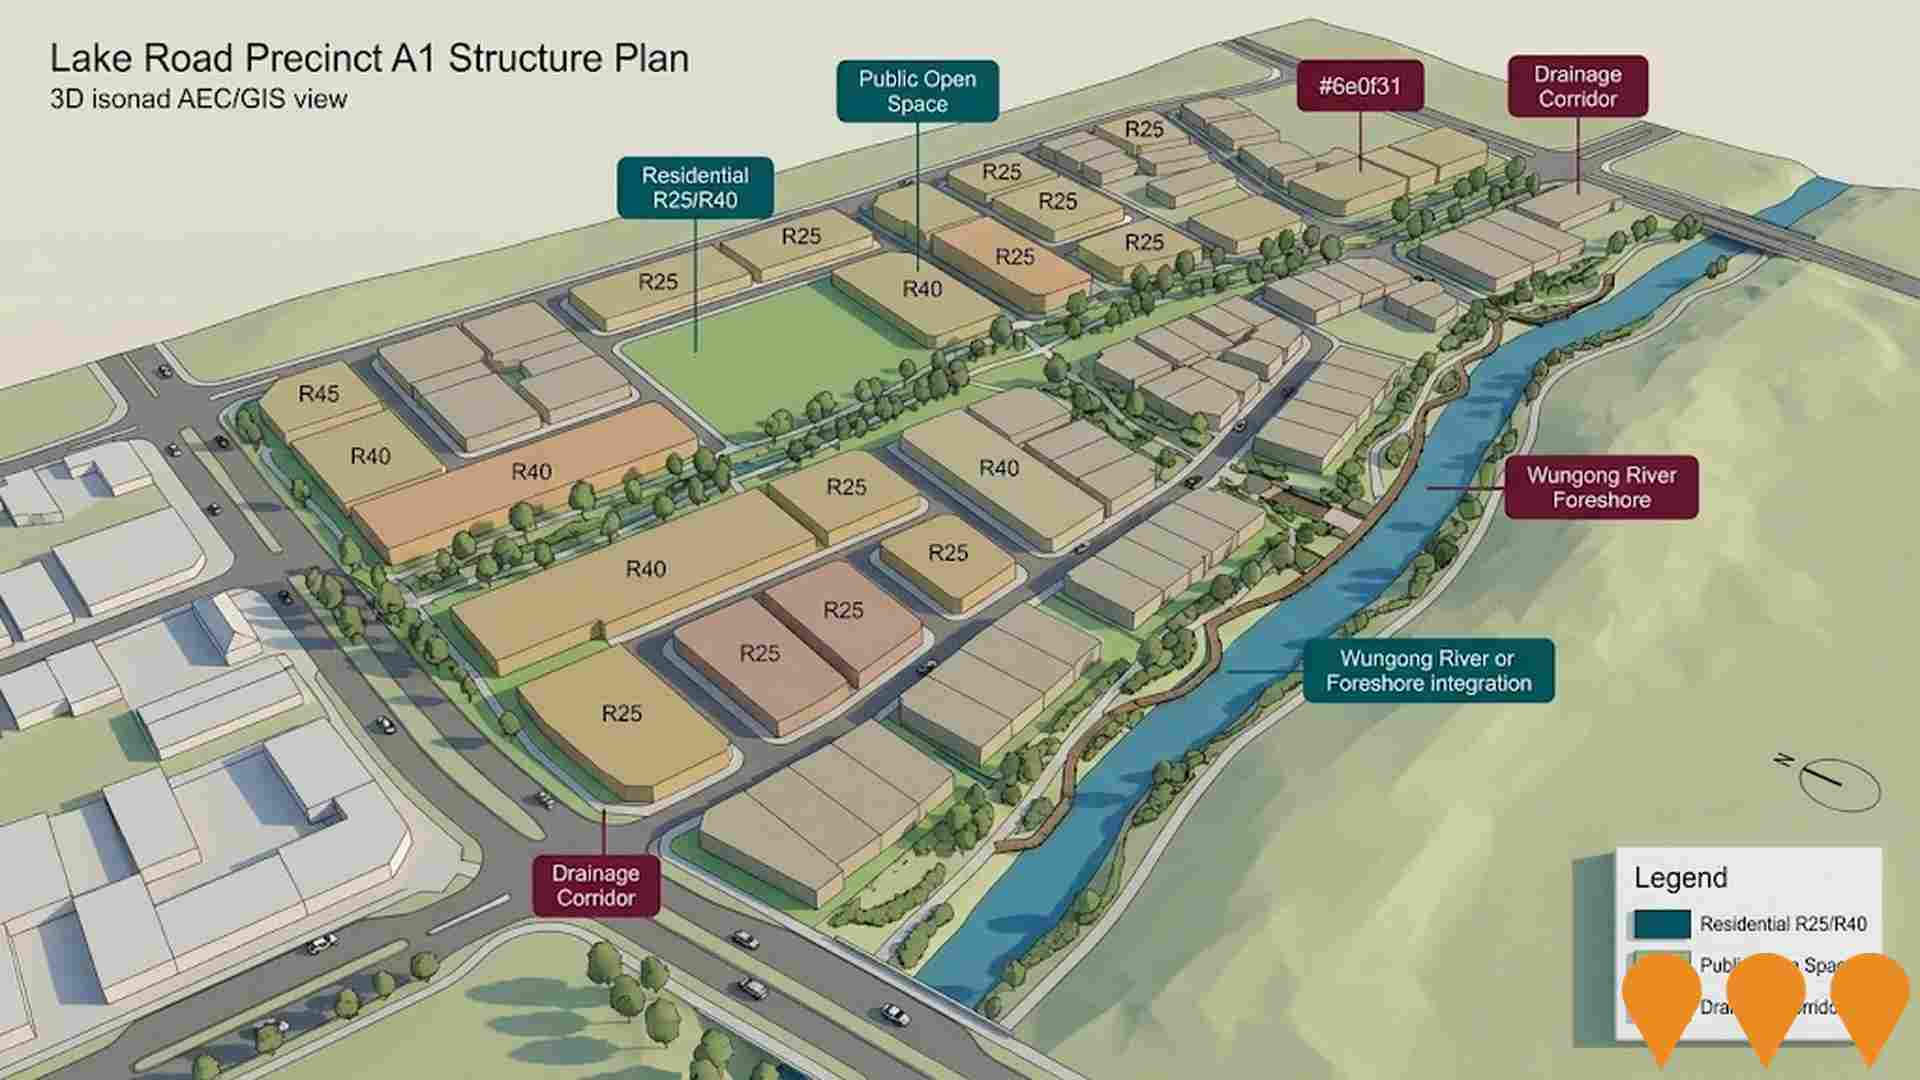
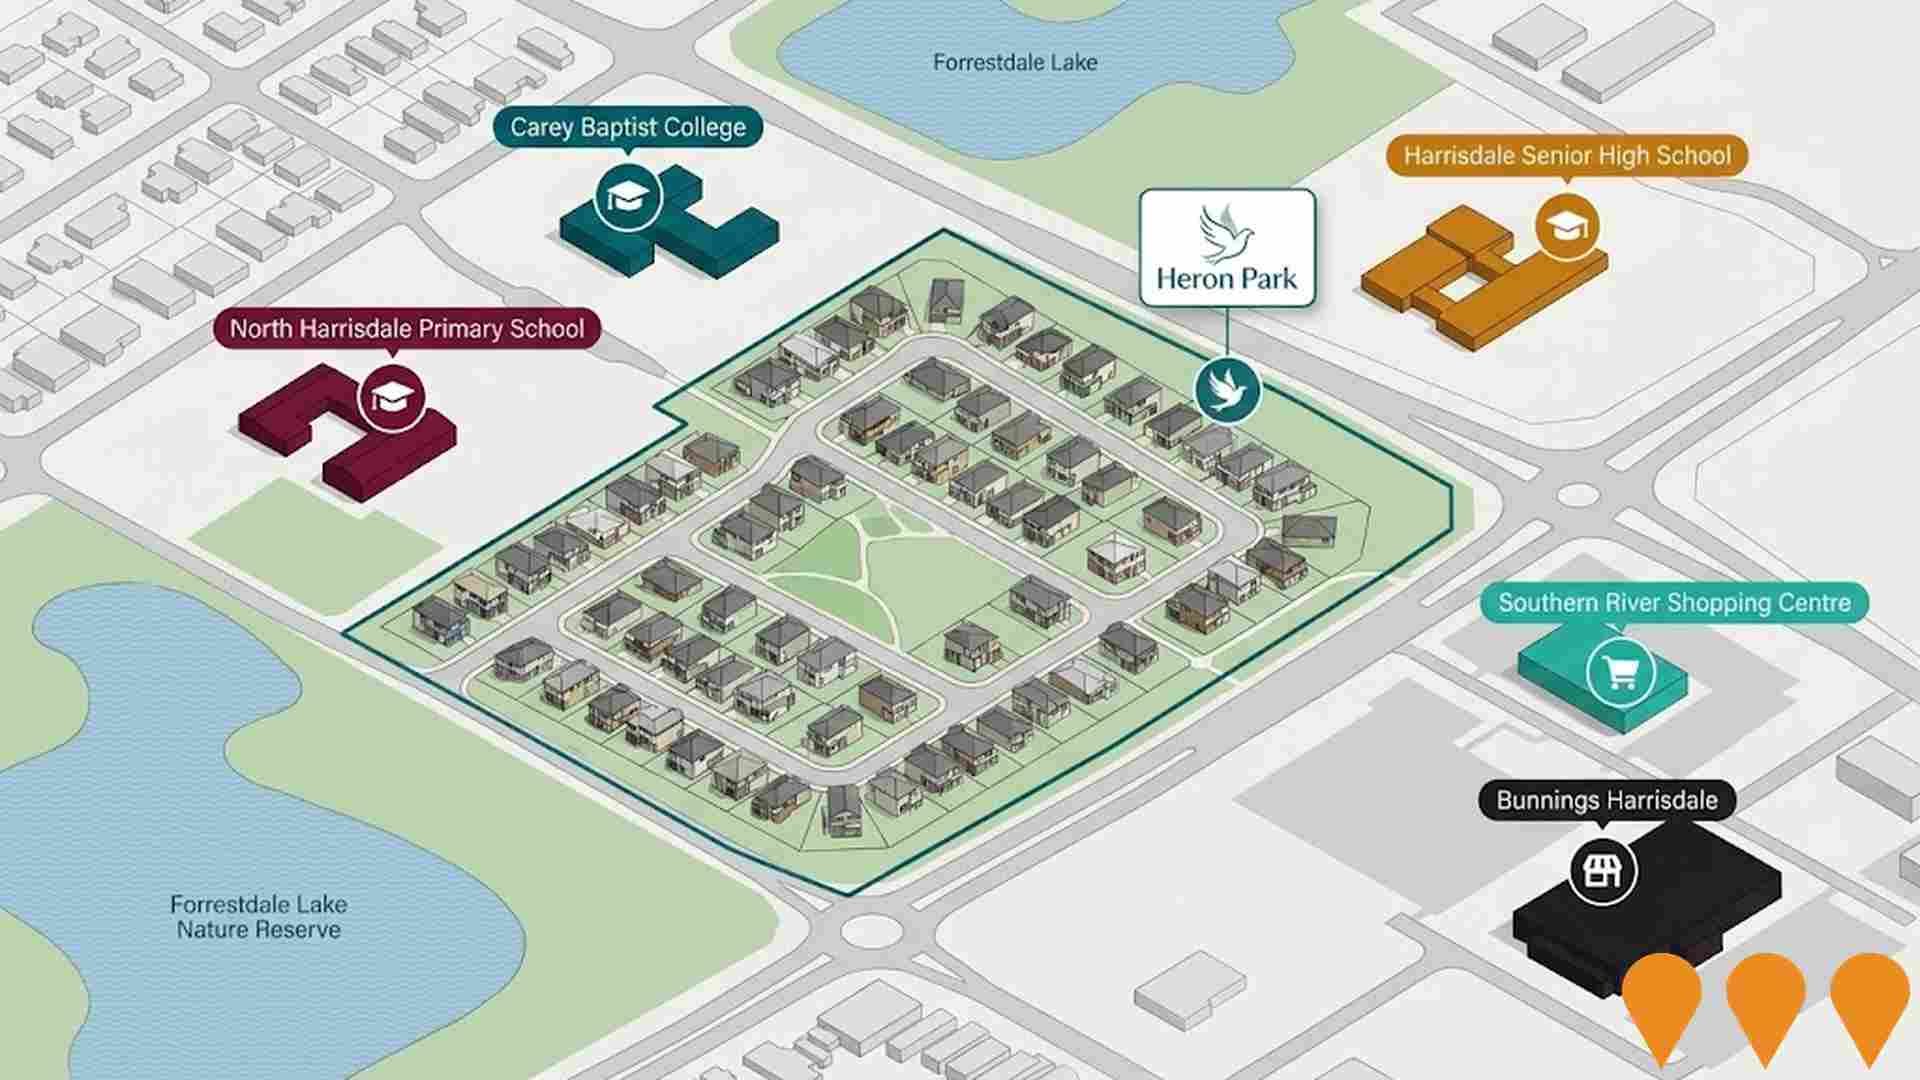
Changes to local infrastructure significantly influence an area's performance. AreaSearch has identified 14 projects that may impact the area. Notable projects include Eighth Road Upgrade, Armadale Strategic Metropolitan Centre Redevelopment, Piara Waters Residential Development, and Champion Centre and Seville Grove Library Redevelopment. The following list details those most likely to be relevant.
Professional plan users can use the search below to filter and access additional projects.
INFRASTRUCTURE SEARCH
 Denotes AI-based impression for illustrative purposes only, not to be taken as definitive under any circumstances. Please follow links and conduct other investigations from the project's source for actual imagery. Developers and project owners wishing us to use original imagery please Contact Us and we will do so.
Frequently Asked Questions - Infrastructure
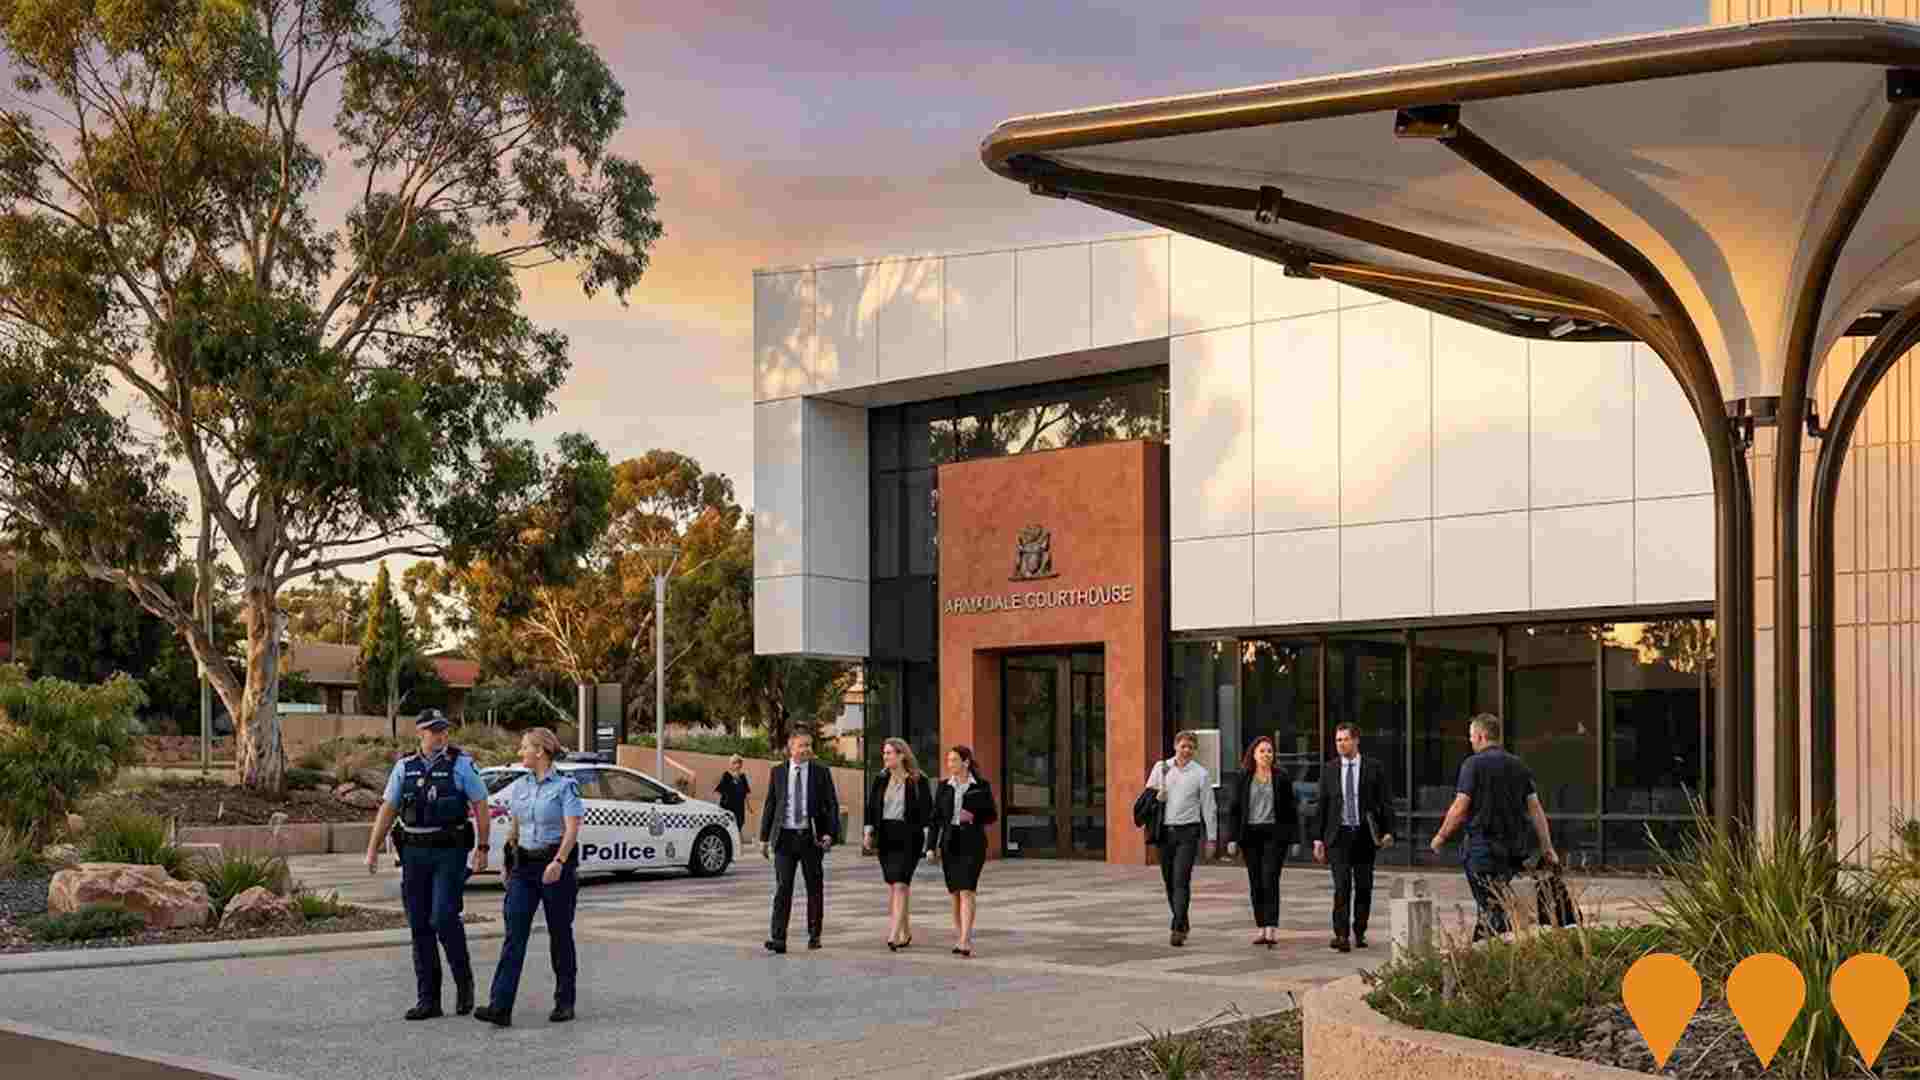
Armadale Strategic Metropolitan Centre Redevelopment
Major State Government-led transformation of Armadale into a Strategic Metropolitan Centre under the Perth and Peel @ 3.5 Million framework. Includes elevation and extension of the Armadale rail line (Byford Extension and Victoria Park-Canning Level Crossing Removal), new Armadale Station, shopping centre expansion, new cinema and entertainment precinct, central civic park, mixed-use commercial and residential towers, and significant public realm upgrades.
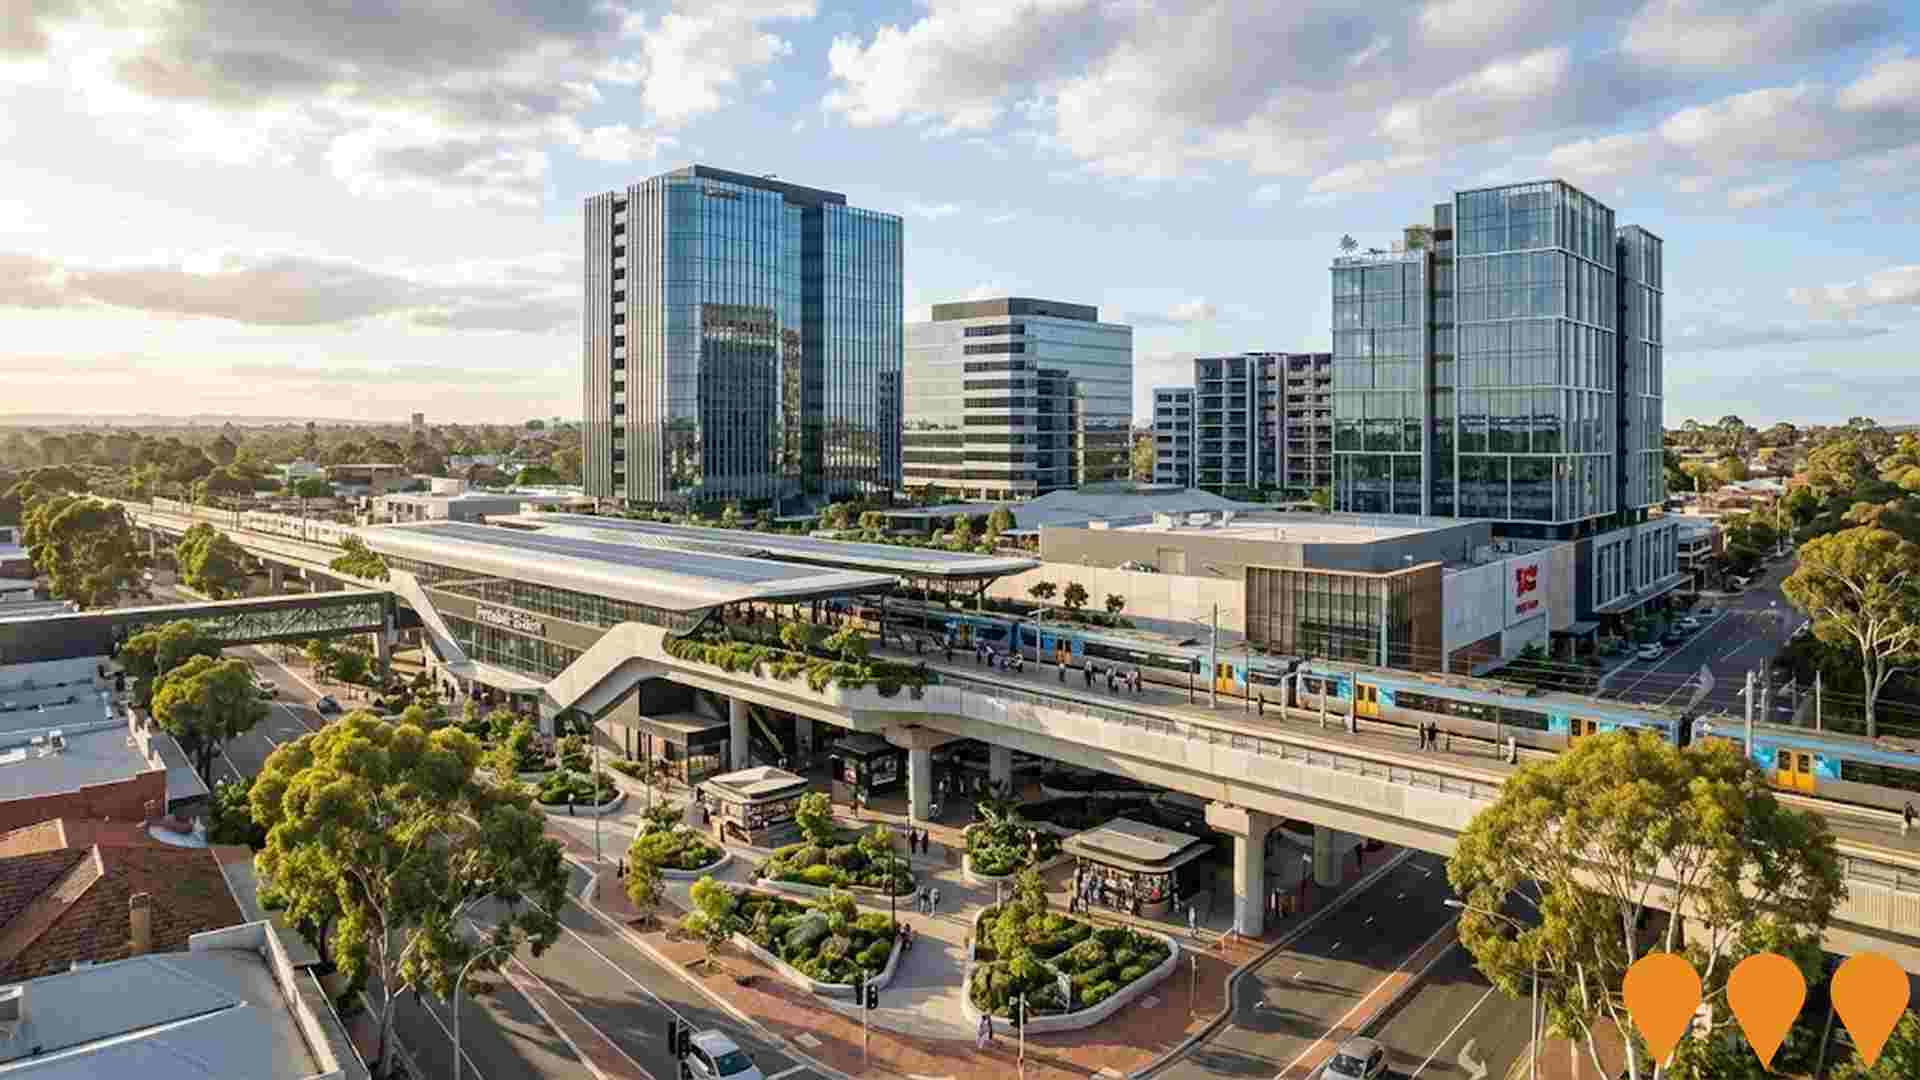
Forrestdale Business Park West
178-hectare master-planned industrial and commercial estate developed by DevelopmentWA. Offers light industry, service commercial and general industry lots with direct access to Tonkin Highway and Ranford Road. Supported by $27 million in State Government infrastructure funding. As of late 2025 approximately 35-40% of stages are sold or under development, with major occupants including Hitachi Construction Machinery, 7-Eleven, Western Power, Cleanaway and multiple other logistics and industrial businesses. Expected to deliver $816 million private investment, 4,478 ongoing jobs and $1.6 billion in annual economic output when complete.
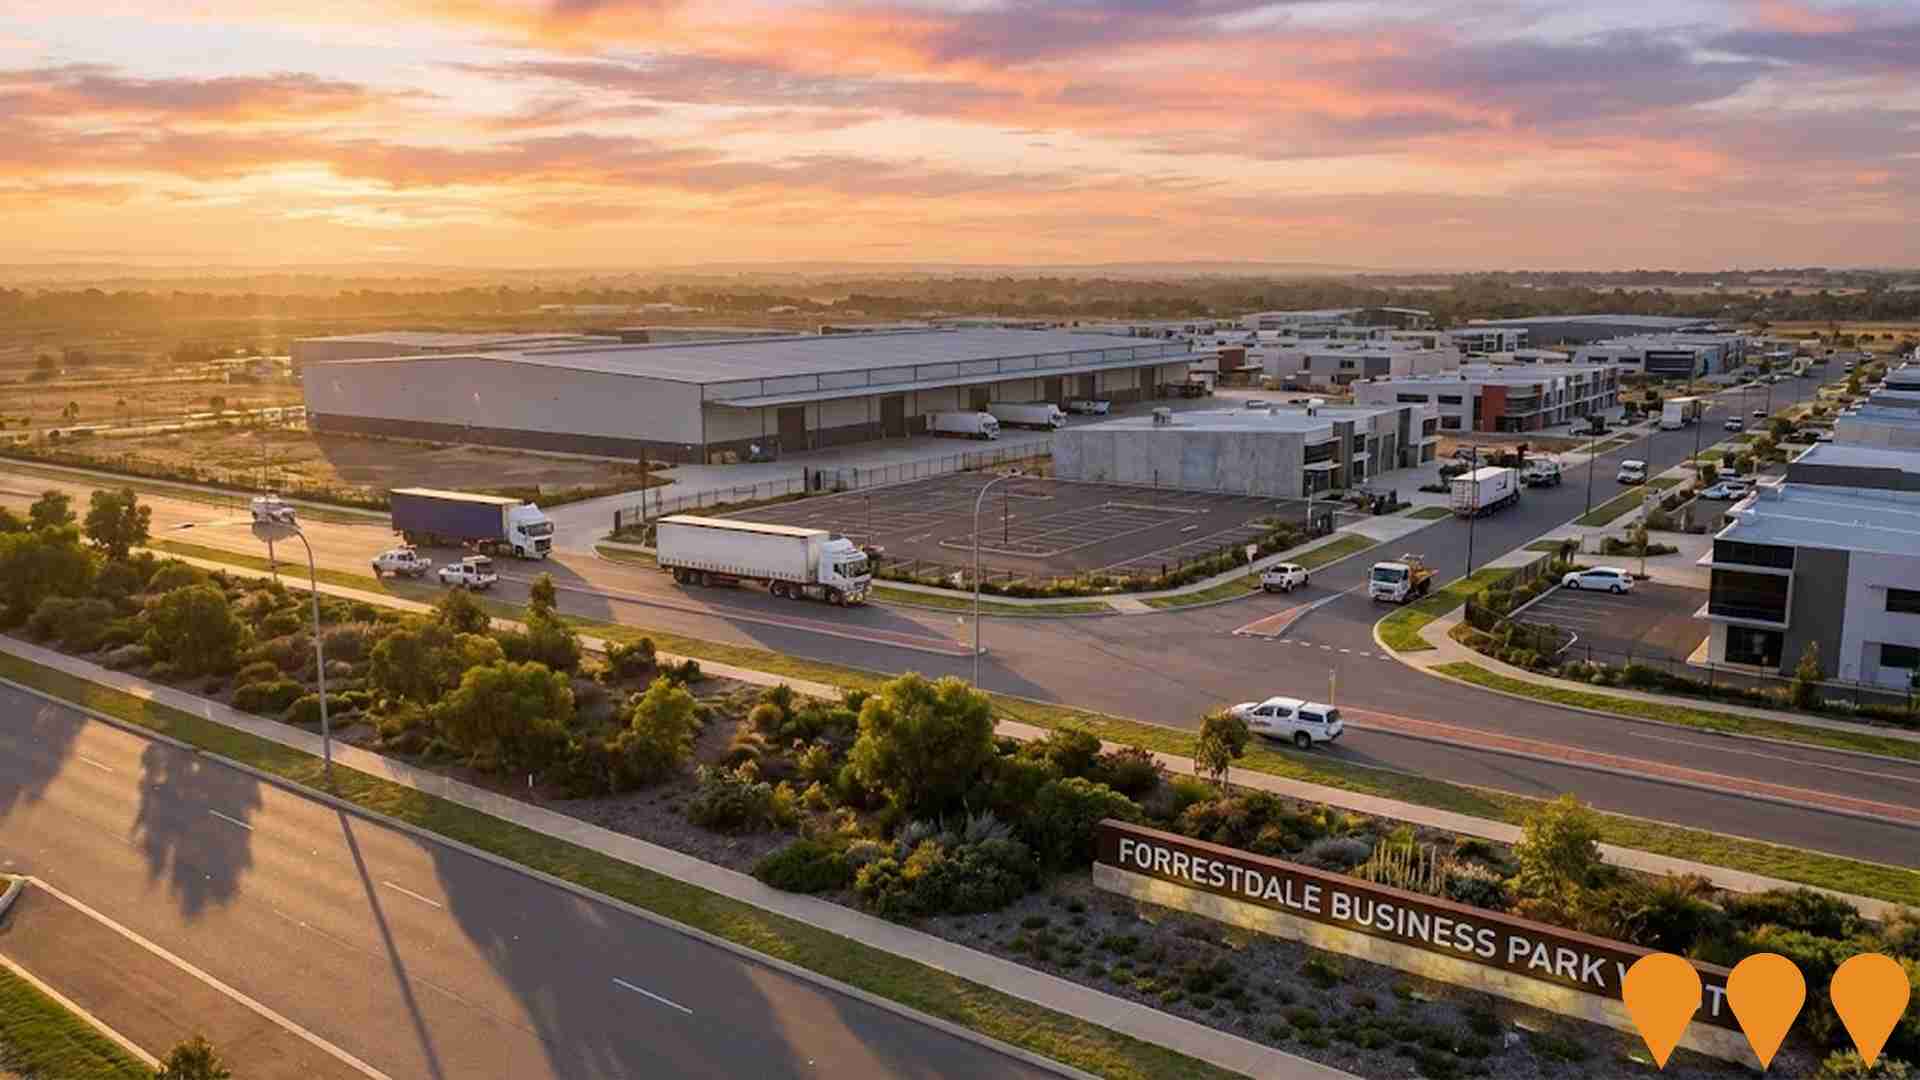
Armadale Courthouse and Police Complex
A $88.5 million state-of-the-art courthouse and police complex officially opened in November 2023. The 14,000 square metre facility combines services previously delivered from three separate locations and can accommodate approximately 350 police officers. It features five courtrooms, pre-trial conference rooms, and separate secure facilities for victims of crime.
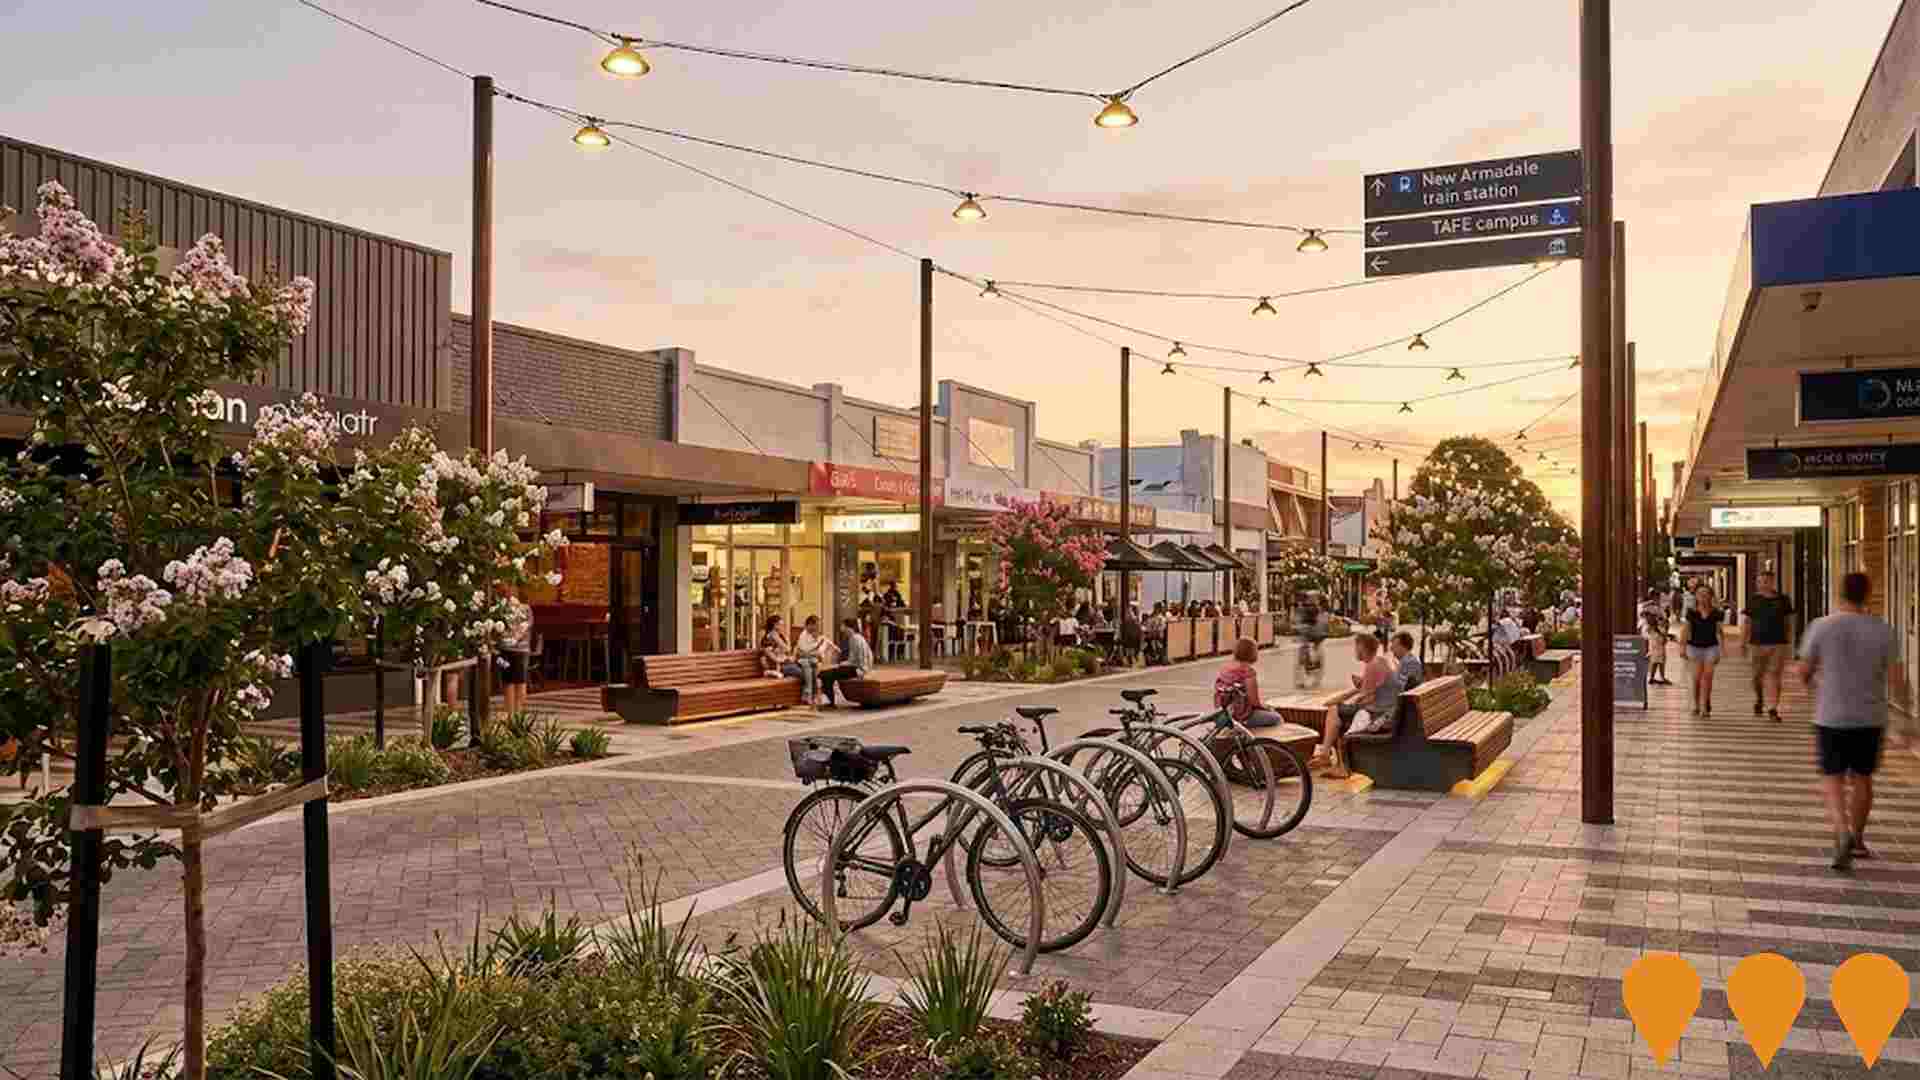
Jull Street Mall Improvement Project
Enhancement of Jull Street Mall with upgraded street furniture, new seating options, bike racks, improved lighting including suspended catenary lighting, and landscaping improvements. The project aims to create a more inviting, functional, and safe public space in the heart of Armadale's shopping district, connecting to nearby developments like the new train station and TAFE campus.
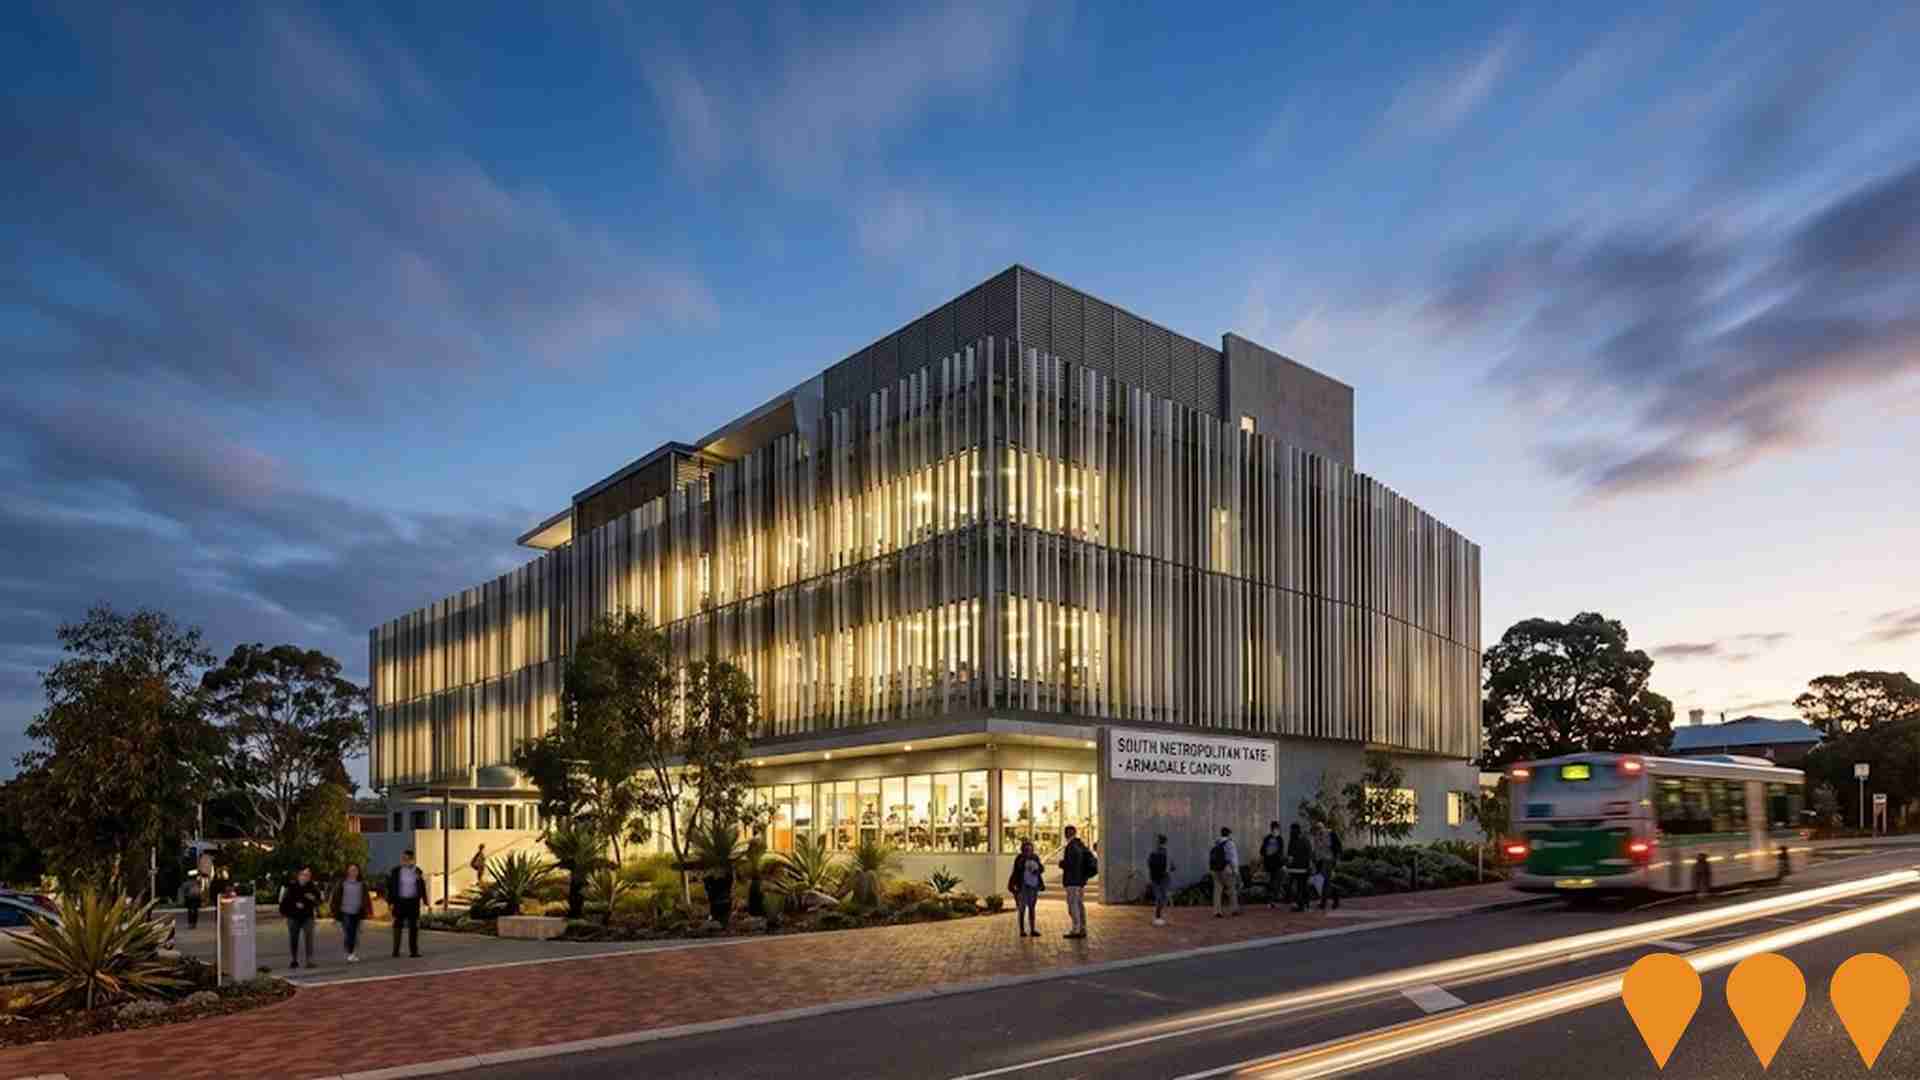
South Metropolitan TAFE Armadale Campus
$39 million multi-storey TAFE campus in Armadale town centre opened in August 2024, featuring cutting-edge facilities for community services, early childhood education, IT, and business training. Includes state-of-the-art simulated childcare facility, specialist training areas, and Jobs and Skills Centre. The purpose-built campus replaces and consolidates previous SM TAFE sites in Armadale, doubling training capacity with classrooms and computer labs for business and general education.
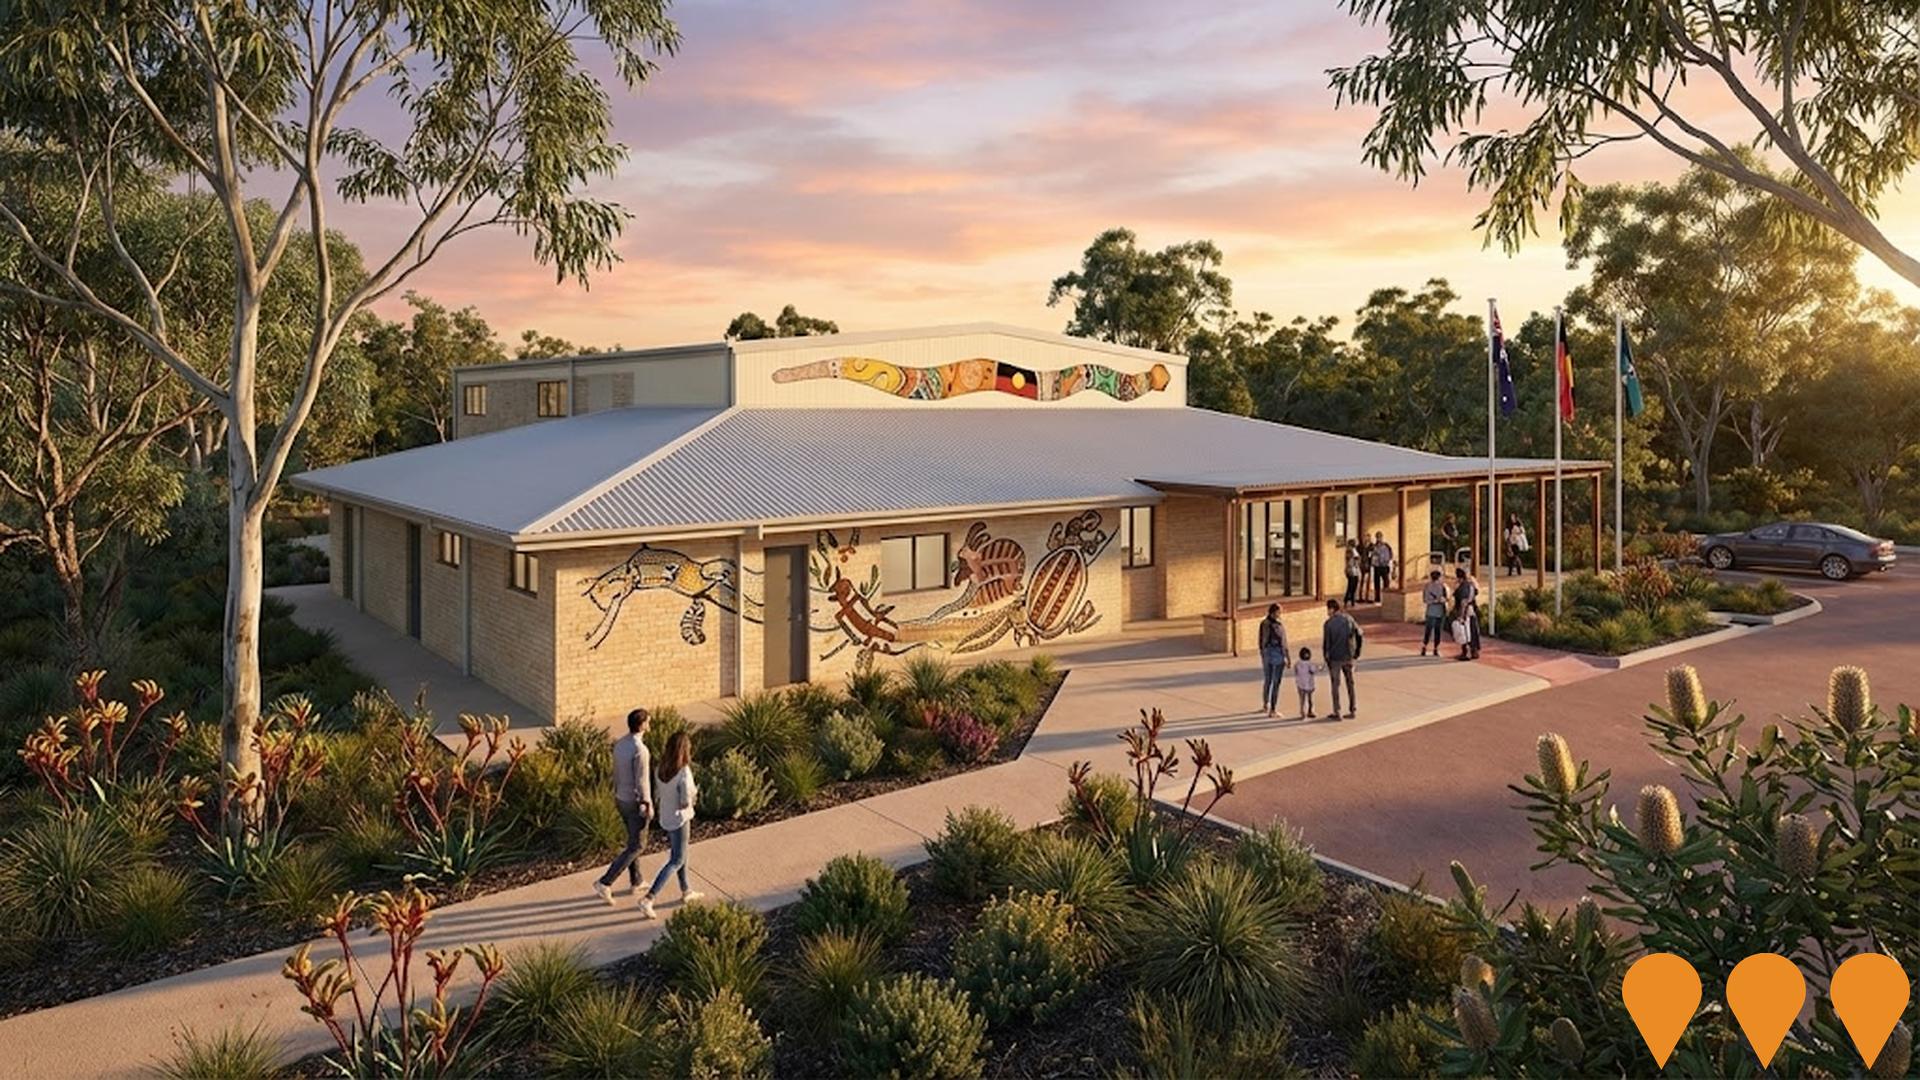
Champion Centre and Seville Grove Library Redevelopment
Redevelopment of the Champion Centre and upgrades to the adjacent Seville Grove Library to deliver culturally appropriate community facilities, flexible indoor areas, a digital hub and enhanced outdoor spaces connected to surrounding bushland. Works were funded by a Lotterywest grant and City municipal funds, and completed in 2019.
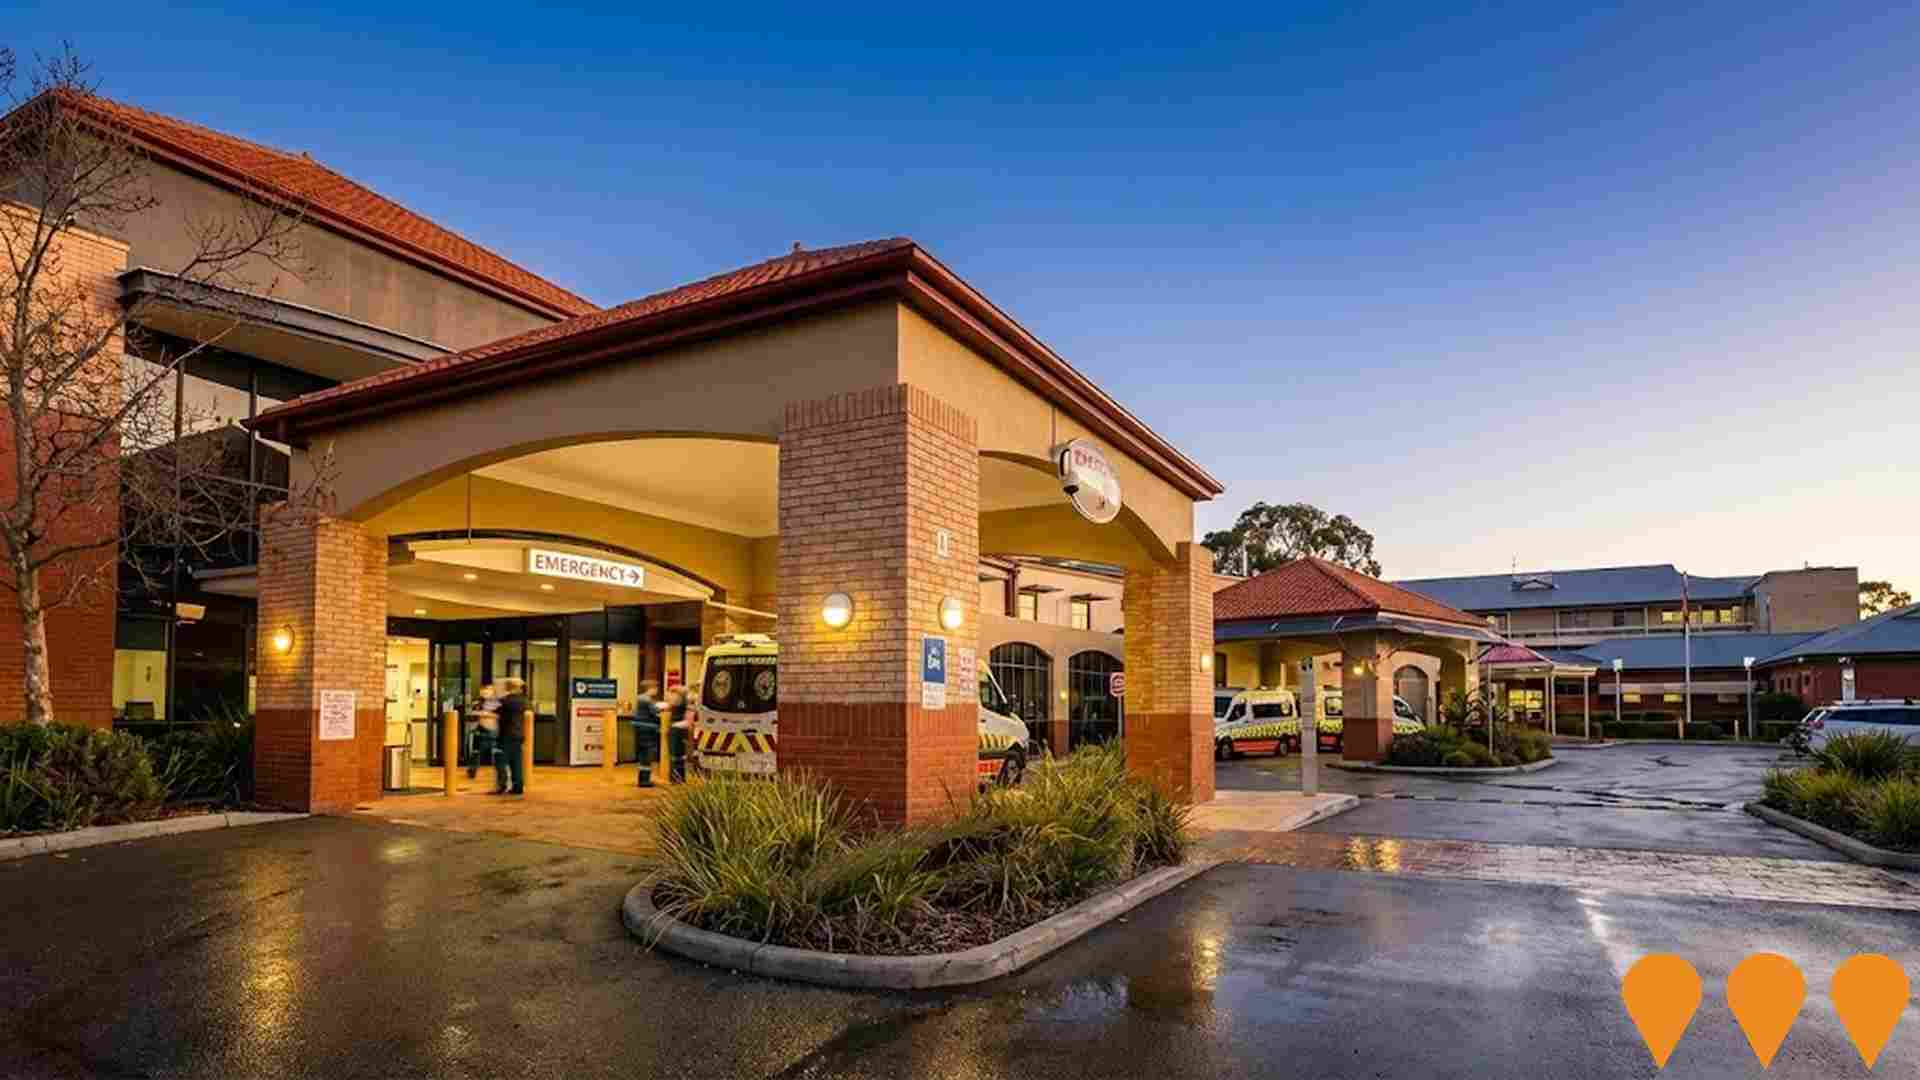
Armadale Hospital Emergency Department Upgrade
Major upgrade to Armadale Hospital's Emergency Department to improve capacity and patient care facilities. Enhanced triage areas, additional treatment bays, and modernised equipment to better serve growing population in Perth's south-eastern corridor.
Forrestdale Business Park East
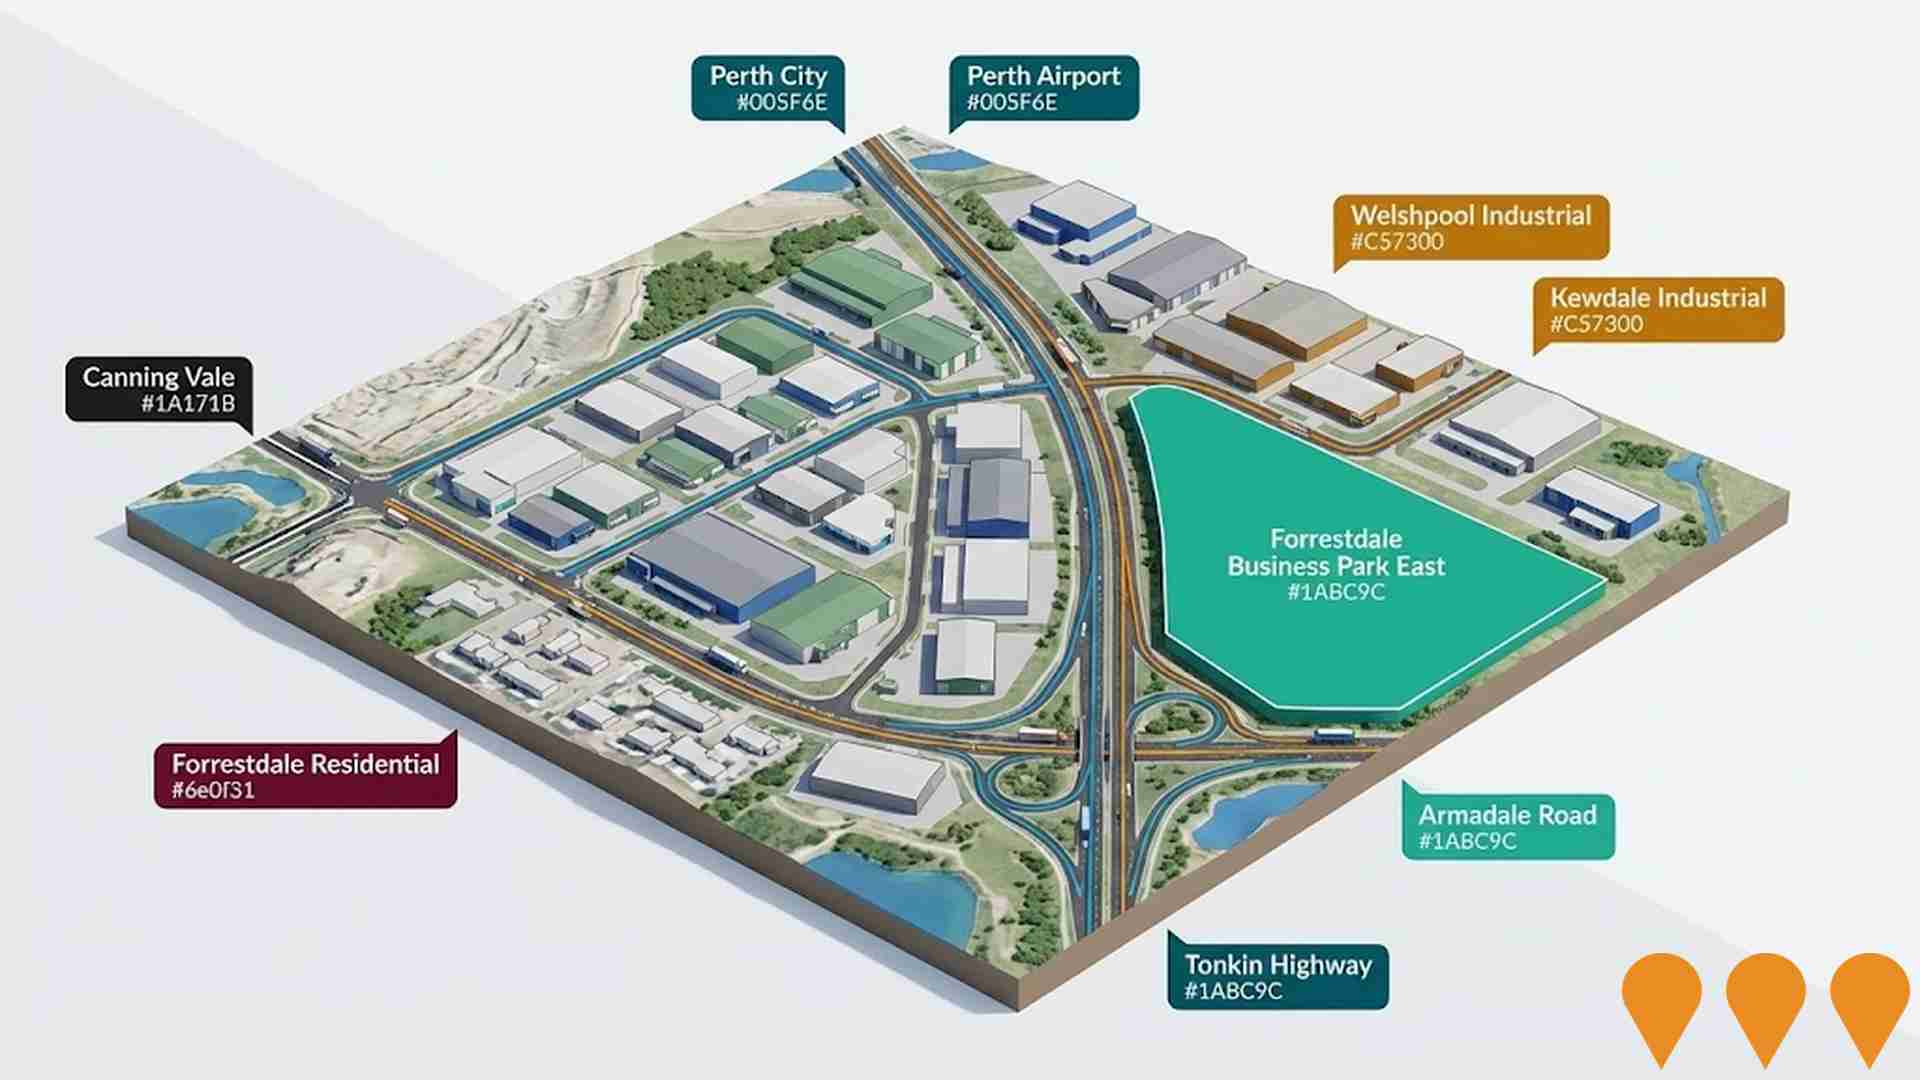
Forrestdale Business Park East is a 190 hectare industrial estate forming the eastern part of the 367 hectare Forrestdale Business Park, bounded by Tonkin Highway, Armadale Road and Ranford Road in Forrestdale. The wider business park is planned to deliver around 700 industrial lots and more than 15,000 jobs, with uses including warehousing, transport depots, showrooms, workshops and general industrial businesses. Planning authority for the East precinct has been transferred from DevelopmentWA back to the City of Armadale, while subdivision and building works continue as new industrial facilities are constructed. Upgraded local and regional roads and services provide direct freight access to Perth Airport, Fremantle Port, Kwinana and the Kewdale logistics hub.
Employment
Employment performance in Seville Grove has been below expectations when compared to most other areas nationally
Seville Grove has a diverse workforce with both white and blue collar jobs, notably in manufacturing and industrial sectors. Its unemployment rate was 7.1% as of September 2025, with an estimated employment growth of 2.8%.
There are currently 6,488 employed residents, with an unemployment rate of 3.1%, higher than Greater Perth's 4.0%. Workforce participation is at 67.3%, comparable to Greater Perth's 65.2%. Key industries include health care & social assistance, retail trade, and construction. The area has a strong specialization in transport, postal & warehousing (1.8 times the regional level), but professional & technical services employ only 3.9% of local workers, below Greater Perth's 8.2%.
From September 2024 to September 2025, employment levels increased by 2.8%, and labour force grew by 2.3%, leading to a 0.4 percentage point decrease in unemployment rate. In contrast, Greater Perth saw employment rise by 2.9% and labour force grow by 3.0%, with a marginal increase in unemployment. State-wide, WA's employment contracted by 0.27% from November 2024 to November 2025, losing 5,520 jobs, with an unemployment rate of 4.6%. Nationally, employment grew by 0.14%, and the unemployment rate was 4.3%. National employment forecasts suggest a growth of 6.6% over five years and 13.7% over ten years. Applying these projections to Seville Grove's employment mix indicates potential local employment increases of 5.9% over five years and 12.7% over ten years, though this is a simplified extrapolation for illustrative purposes.
Frequently Asked Questions - Employment
Income
Income levels sit below national averages according to AreaSearch assessment
According to AreaSearch's aggregation of the latest postcode level ATO data released for financial year 2022, Seville Grove SA2 had a median income among taxpayers of $46,099. The average income stood at $54,092. This was below the national average and compared to levels of $58,380 in Greater Perth. Based on Wage Price Index growth of 14.2% since financial year 2022, current estimates would be approximately $52,645 for median income and $61,773 for average income as of September 2025. Census data reveals household, family and personal incomes all rank modestly in Seville Grove, between the 43rd and 49th percentiles. Distribution data shows the $1,500 - 2,999 earnings band captures 43.7% of the community (5,560 individuals), consistent with broader trends across the region showing 32.0% in the same category. Housing affordability pressures are severe, with only 82.6% of income remaining after housing costs, ranking at the 48th percentile.
Frequently Asked Questions - Income
Housing
Seville Grove is characterized by a predominantly suburban housing profile, with a higher proportion of rental properties than the broader region
The dwelling structure in Seville Grove, as per the latest Census, consisted of 94.5% houses and 5.5% other dwellings such as semi-detached homes, apartments, and 'other' dwellings. This is compared to Perth metro's composition of 90.0% houses and 10.0% other dwellings. Home ownership in Seville Grove stood at 15.5%, with mortgaged properties at 61.1% and rented dwellings at 23.4%. The median monthly mortgage repayment in the area was $1,600, lower than Perth metro's average of $1,750. The median weekly rent figure for Seville Grove was $330, compared to Perth metro's $305. Nationally, Seville Grove's mortgage repayments were significantly lower than the Australian average of $1,863, while rents were substantially below the national figure of $375.
Frequently Asked Questions - Housing
Household Composition
Seville Grove features high concentrations of family households, with a higher-than-average median household size
Family households account for 79.8% of all households, including 42.6% couples with children, 20.6% couples without children, and 15.2% single parent families. Non-family households constitute the remaining 20.2%, with lone person households at 17.9% and group households comprising 2.2%. The median household size is 3.0 people, which is larger than the Greater Perth average of 2.8.
Frequently Asked Questions - Households
Local Schools & Education
Seville Grove faces educational challenges, with performance metrics placing it in the bottom quartile of areas assessed nationally
The area's university qualification rate is 14.3%, significantly lower than Australia's average of 30.4%. This presents both a challenge and an opportunity for targeted educational initiatives. Bachelor degrees are the most common at 10.5%, followed by postgraduate qualifications (2.4%) and graduate diplomas (1.4%). Trade and technical skills are prominent, with 41.4% of residents aged 15+ holding vocational credentials – advanced diplomas (11.0%) and certificates (30.4%).
Educational participation is high, with 35.1% of residents currently enrolled in formal education. This includes 14.5% in primary education, 9.7% in secondary education, and 3.5% pursuing tertiary education.
Frequently Asked Questions - Education
Schools Detail
Nearby Services & Amenities
Transport
Transport servicing is moderate compared to other areas nationally based on assessment of service frequency, route connectivity and accessibility
The analysis of public transport in Seville Grove has found that there are currently 51 active transport stops operating within the area. These stops serve a mix of bus routes, with a total of 5 individual routes providing service to these stops. Together, these routes facilitate 944 weekly passenger trips.
The accessibility of public transport is rated as excellent in Seville Grove, with residents typically located just 195 meters from their nearest transport stop. On average, there are 134 trips per day across all routes, which equates to approximately 18 weekly trips per individual stop.
Frequently Asked Questions - Transport
Transport Stops Detail
Health
The level of general health in Seville Grove is notably higher than the national average with prevalence of common health conditions low among the general population though higher than the nation's average across older, at risk cohorts
Seville Grove shows better-than-average health outcomes with a low prevalence of common conditions among its general population, although this is higher than the national average among older and at-risk groups. Approximately 47% (~5,980 people) have private health cover, compared to Greater Perth's 53.3%. Nationally, it stands at 55.3%.
Mental health issues and asthma are the most common conditions, affecting 8.7% and 8.5% of residents respectively. 72.3% report no medical ailments, similar to Greater Perth's 72.1%. The area has 8.8% (1,124 people) aged 65 and over, lower than Greater Perth's 12.8%. Health outcomes among seniors require more attention than the broader population.
Frequently Asked Questions - Health
Cultural Diversity
Seville Grove was found to be more culturally diverse than the vast majority of local markets in Australia, upon assessment of a range of language and cultural background related metrics
Seville Grove's population showed higher cultural diversity than most local markets, with 25.2% speaking languages other than English at home and 34.2% born overseas. Christianity was the dominant religion in Seville Grove, comprising 42.9%. Notably, the 'Other' religious category had a lower representation of 2.0%, compared to Greater Perth's 3.0%.
In terms of ancestry, the top three groups were English (26.4%), Australian (24.2%), and Other (14.9%). Some ethnic groups showed notable differences: Dutch was more prevalent at 2.9% in Seville Grove versus 2.4% regionally, Filipino at 3.6% compared to 2.1%, and Maori at 1.6% against 1.1%.
Frequently Asked Questions - Diversity
Age
Seville Grove hosts a very young demographic, ranking in the bottom 10% of areas nationwide
Seville Grove's median age is 32 years, which is younger than Greater Perth's average of 37 years and significantly lower than Australia's national average of 38 years. Compared to Greater Perth, Seville Grove has a higher proportion of residents aged 5-14 (17.5%) but fewer residents aged 65-74 (5.5%). This concentration of 5-14 year-olds is well above the national average of 12.2%. According to post-2021 Census data, the proportion of residents aged 55-64 has increased from 8.5% to 9.3%, while the proportion of those aged 25-34 has decreased from 15.9% to 14.7%. Demographic projections suggest that Seville Grove's age profile will change significantly by 2041, with the strongest projected growth in the 45-54 cohort (36%), adding 553 residents to reach a total of 2,103. Conversely, population declines are projected for the 0-4 and 35-44 age cohorts.

