Chart Color Schemes
This analysis uses ABS Statistical Areas Level 2 (SA2) boundaries, which can materially differ from Suburbs and Localities (SAL) even when sharing similar names.
SA2 boundaries are defined by the Australian Bureau of Statistics and are designed to represent communities for statistical reporting (e.g., census and ERP).
Suburbs and Localities (SAL) represent commonly-used suburb/locality names (postal-style areas) and may use different geographic boundaries. For comprehensive analysis, consider reviewing both boundary types if available.
est. as @ -- *
ABS ERP | -- people | --
2021 Census | -- people
Sales Activity
Curious about local property values? Filter the chart to assess the volume and appreciation (including resales) trends and regional comparisons, or scroll to the map below view this information at an individual property level.
Find a Recent Sale
Sales Detail
Population
An assessment of population growth drivers in Safety Bay - Shoalwater reveals an overall ranking slightly below national averages considering recent, and medium term trends
Safety Bay - Shoalwater's population was 12,039 as of the 2021 Census. By Nov 2025, it had increased to around 13,140, reflecting a growth of 1,101 people (9.1%) since the 2021 Census. This increase is inferred from ABS data showing an estimated resident population of 13,131 as of June 2024 and an additional 8 validated new addresses since the Census date. The population density ratio was 1,827 persons per square kilometer in Nov 2025, above national averages assessed by AreaSearch. Safety Bay - Shoalwater's growth rate of 9.1% since the 2021 census exceeded the national average of 8.9%. Interstate migration contributed approximately 62.6% of overall population gains during recent periods.
AreaSearch uses ABS/Geoscience Australia projections released in 2024, based on 2022 data, for each SA2 area. For areas not covered by this data and post-2032 growth estimation, AreaSearch utilises ABS Greater Capital Region projections released in 2023, based on 2022 data. Future population trends indicate an increase just below the median of statistical areas analysed by AreaSearch, with an expected growth of 813 persons to reach a total population of 2041 by Nov 2041, reflecting a 6.1% increase over the 17-year period.
Frequently Asked Questions - Population
Development
Recent residential development output has been above average within Safety Bay - Shoalwater when compared nationally
Safety Bay - Shoalwater averaged approximately 33 new dwelling approvals per year over the past five financial years, totalling 166 homes. As of FY26, 10 approvals have been recorded. This results in an average of 6.4 new residents per year for every home built between FY21 and FY25, indicating a significant demand outpacing supply. The average construction value of new homes is $316,000.
In FY26, $3.8 million in commercial approvals have been registered, reflecting the area's primarily residential nature. Compared to Greater Perth, Safety Bay - Shoalwater has 70.0% lower building activity per person, which typically strengthens demand and prices for existing properties. This level is also below national average, suggesting maturity and potential planning constraints. Recent construction comprises 92.0% detached dwellings and 8.0% townhouses or apartments, maintaining the area's traditional suburban character focused on family homes. With around 343 people per approval, Safety Bay - Shoalwater shows a transitioning market.
According to AreaSearch quarterly estimates, the area is projected to gain 804 residents by 2041. At current development rates, new housing supply should comfortably meet demand, offering good conditions for buyers and potentially supporting growth beyond current population projections.
Frequently Asked Questions - Development
Infrastructure
Safety Bay - Shoalwater has limited levels of nearby infrastructure activity, ranking in the 17thth percentile nationally
Changes to local infrastructure significantly impact an area's performance. AreaSearch has identified 14 projects likely to affect the region. Notable initiatives include Oceanside Promenade, The Strand at Safety Bay, Safety Bay Road & Penguin Road Mixed-Use Precinct (Proposed), and Safety Bay/Waikiki Foreshore Lighting Replacement Works. Below is a list of those most relevant.
Professional plan users can use the search below to filter and access additional projects.
INFRASTRUCTURE SEARCH
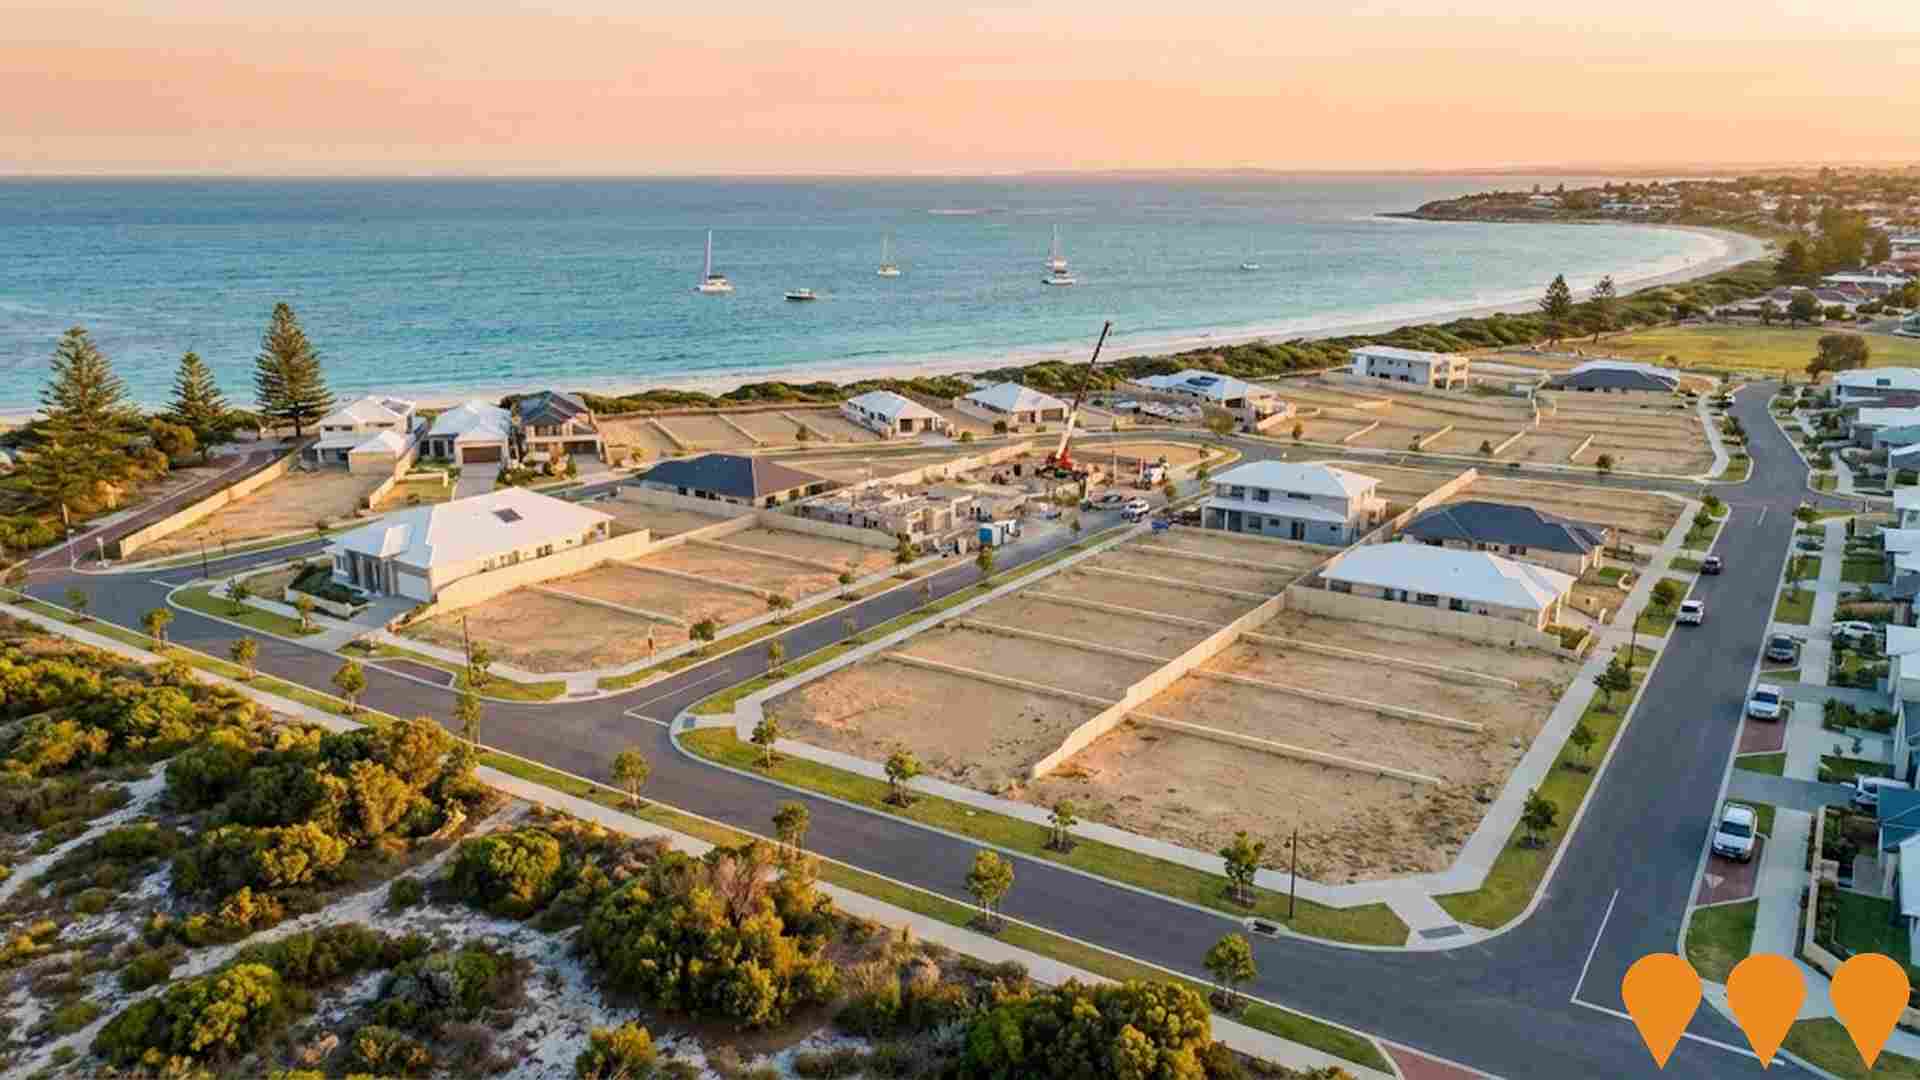
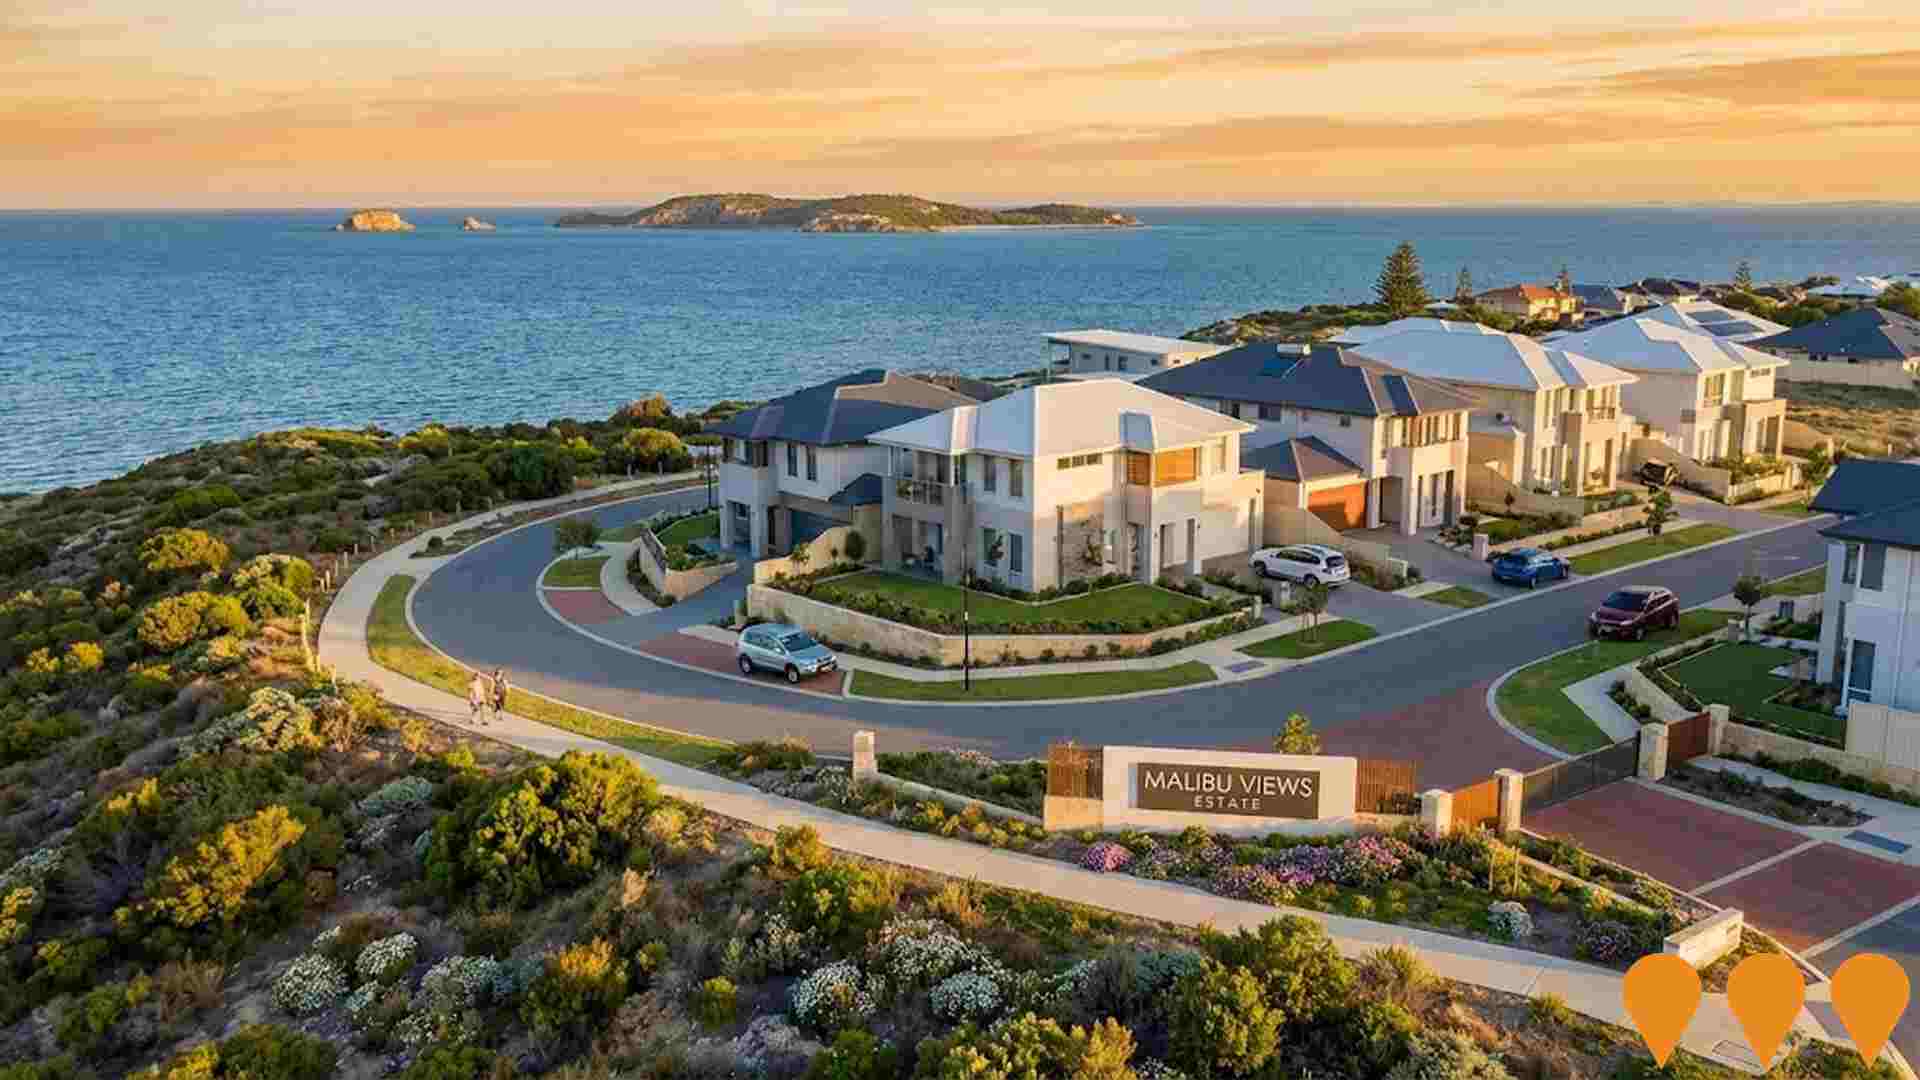
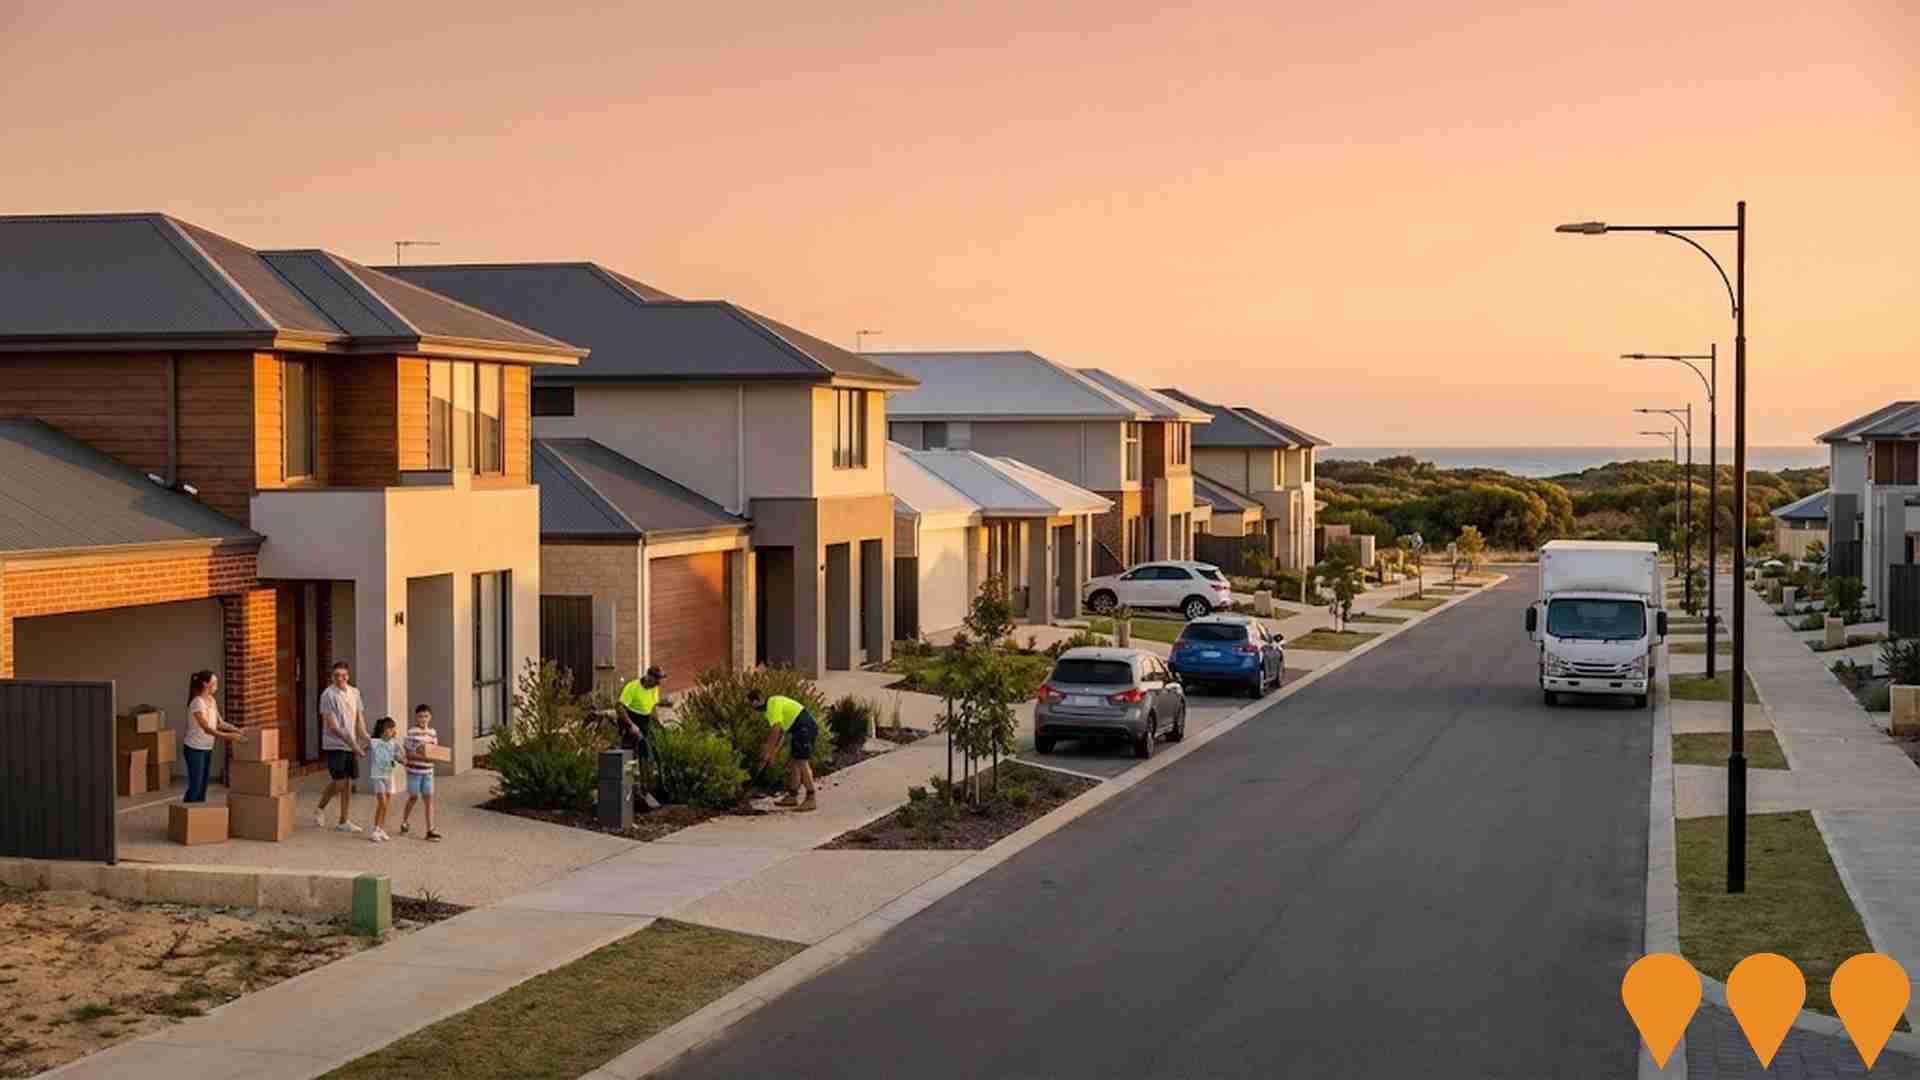
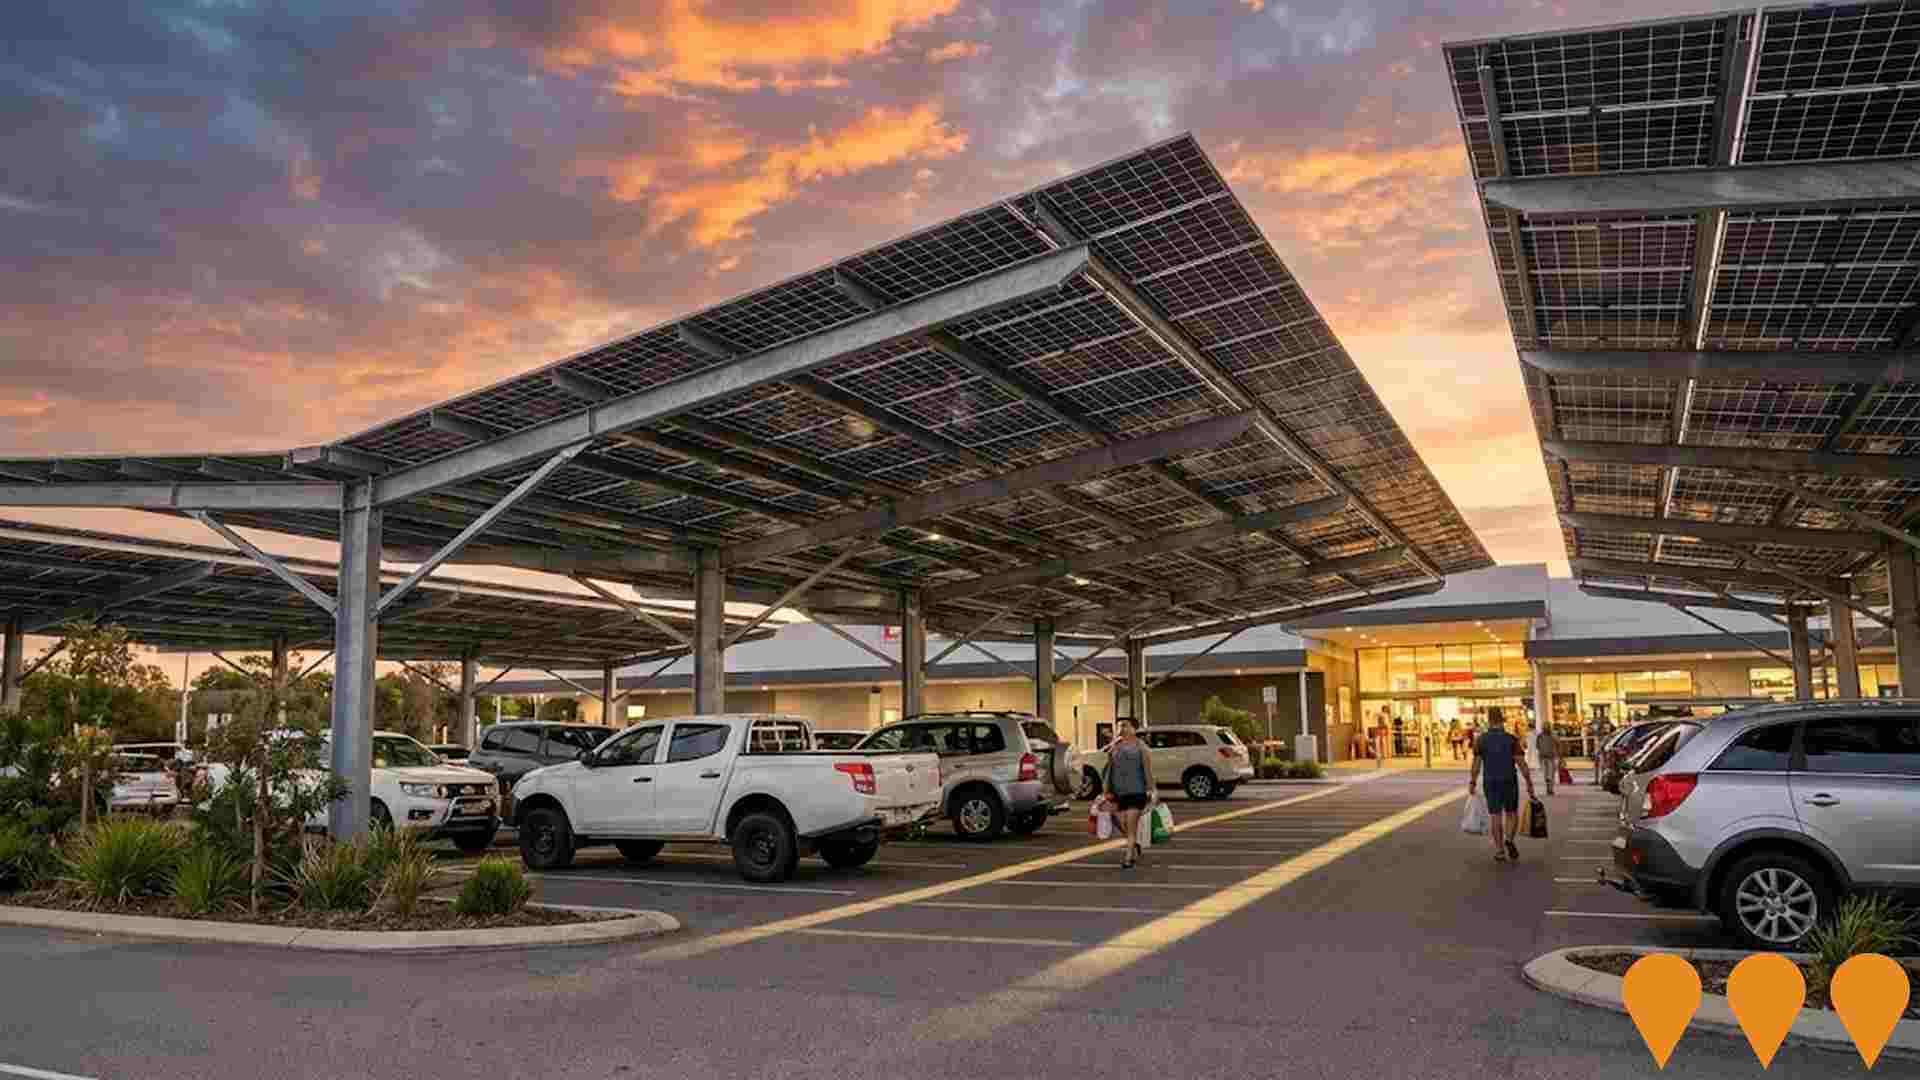
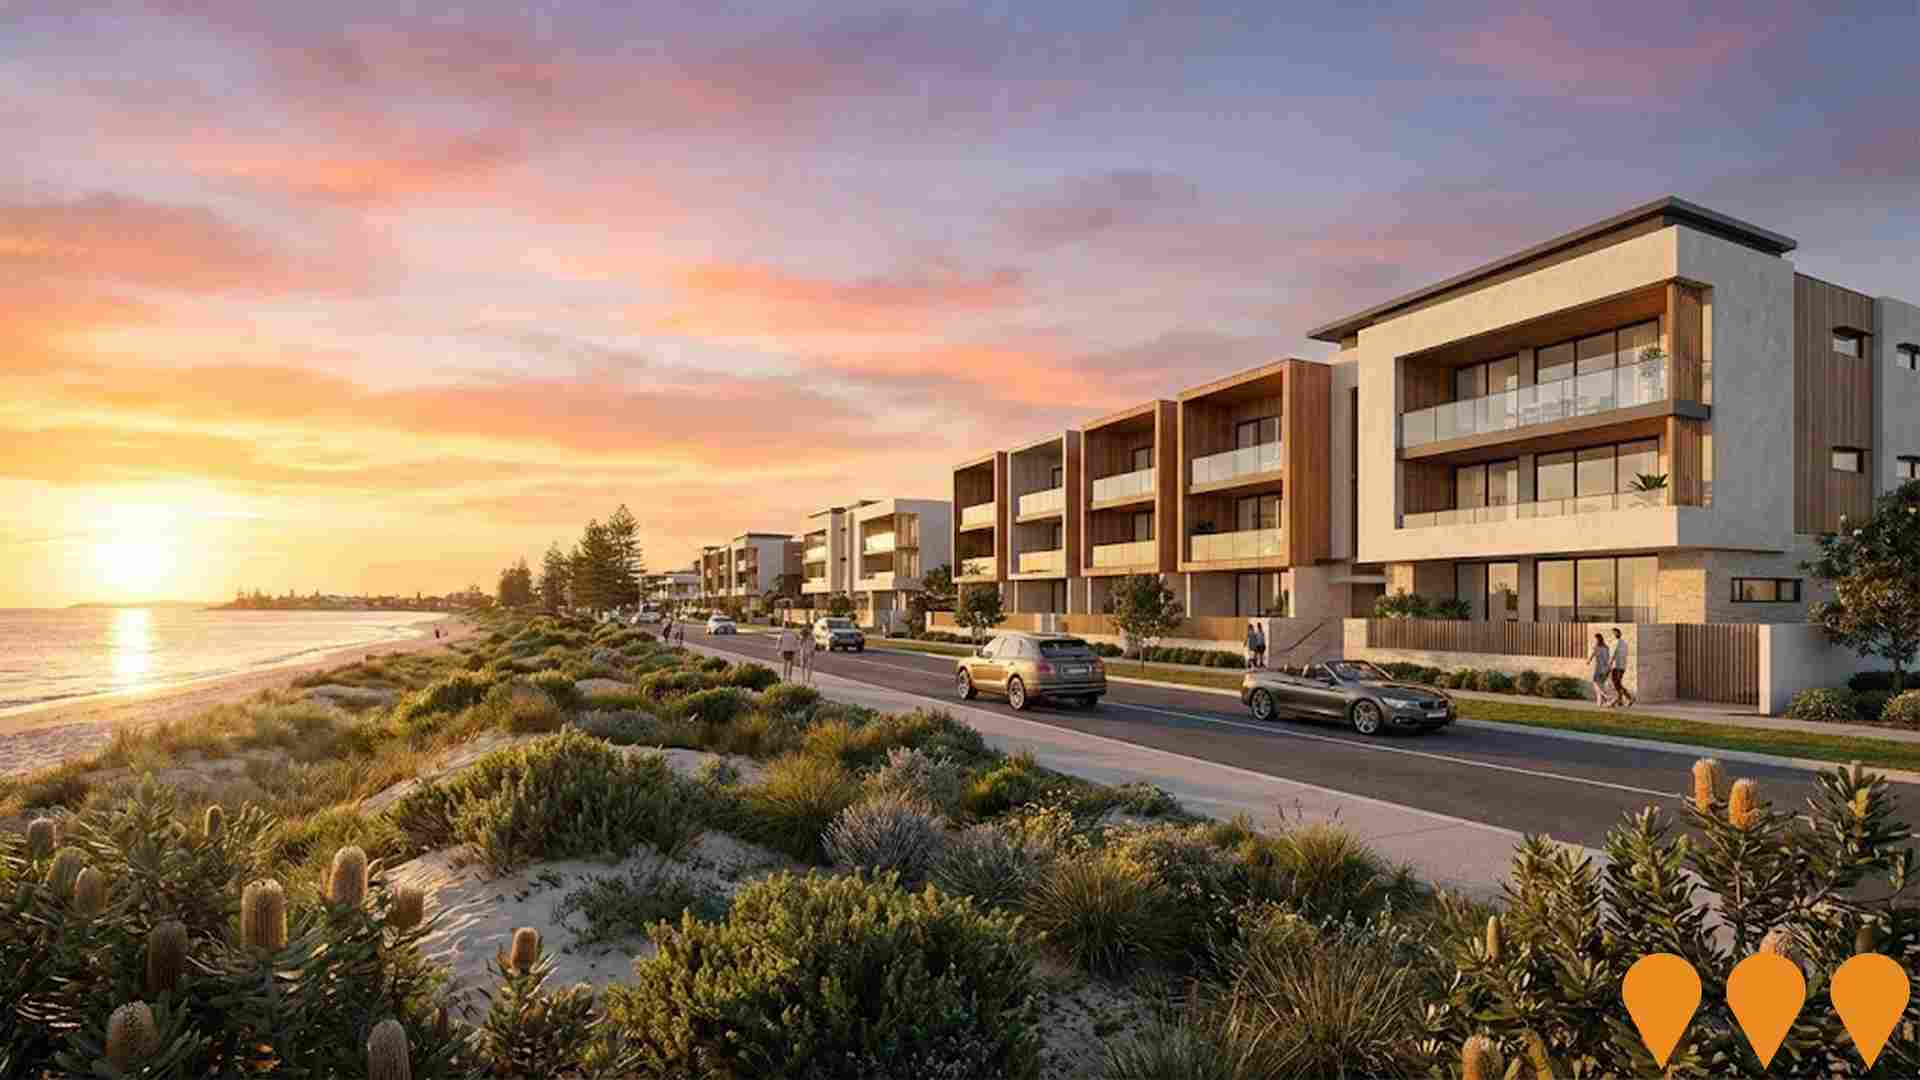
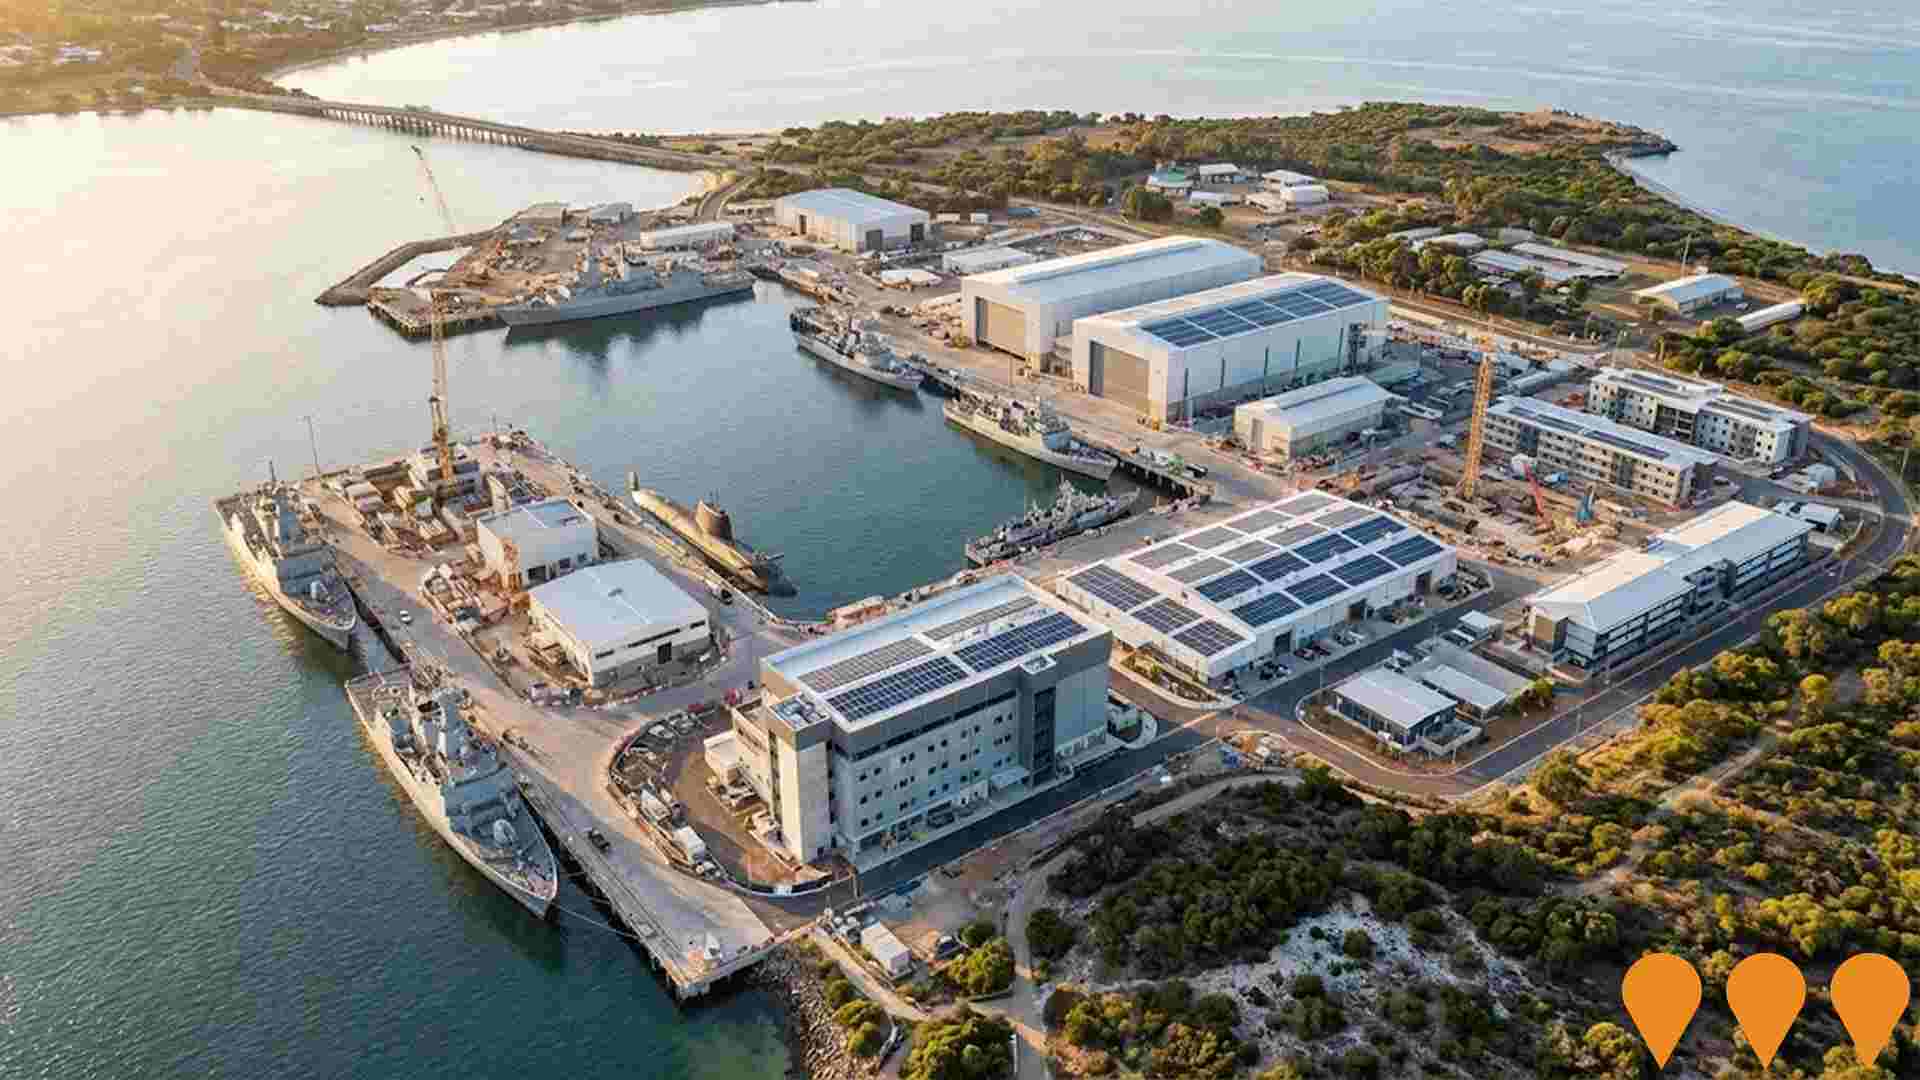
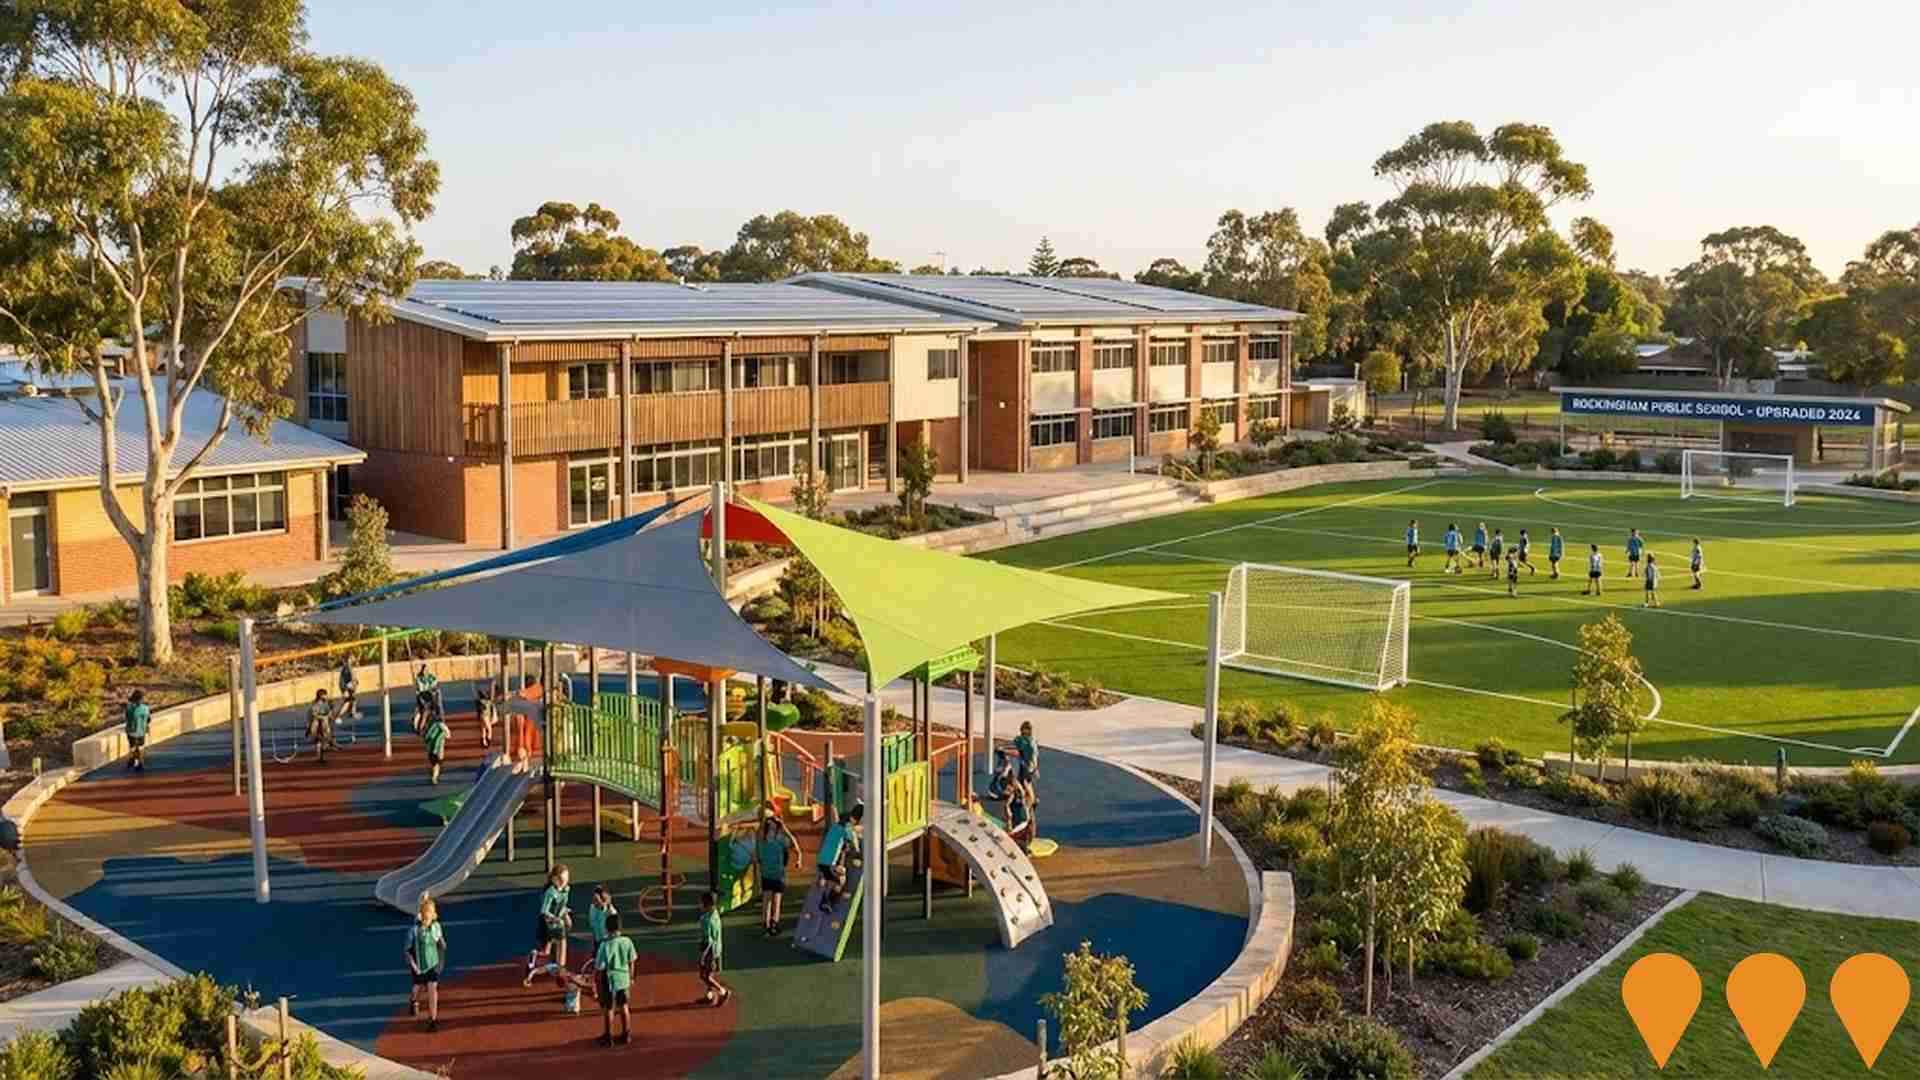
 Denotes AI-based impression for illustrative purposes only, not to be taken as definitive under any circumstances. Please follow links and conduct other investigations from the project's source for actual imagery. Developers and project owners wishing us to use original imagery please Contact Us and we will do so.
Frequently Asked Questions - Infrastructure
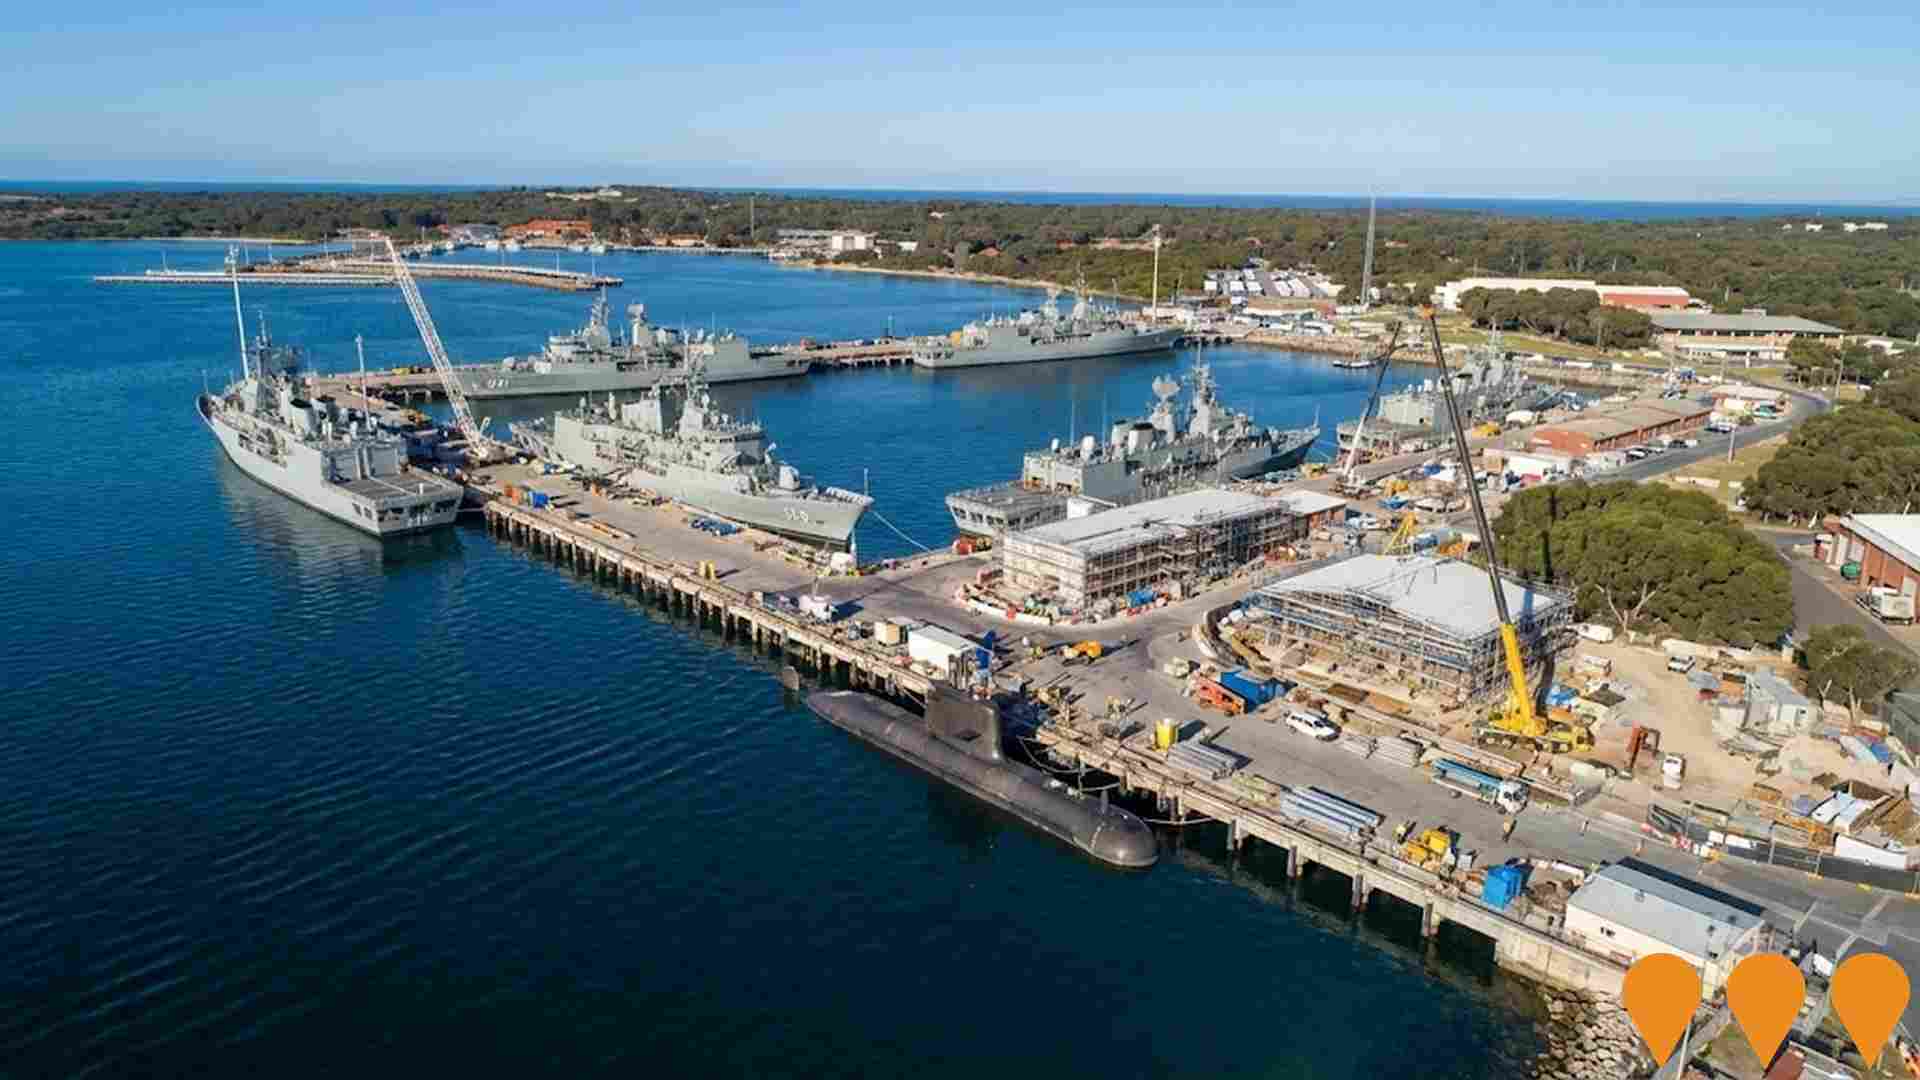
HMAS Stirling Redevelopment and AUKUS Nuclear-Powered Submarine Infrastructure Program
Major Commonwealth-led upgrade of HMAS Stirling naval base on Garden Island and the Australian Marine Complex at Henderson to support rotational presence of US and UK nuclear-powered submarines from 2027 and delivery of Australias SSN-AUKUS fleet in the early 2030s. Works include new wharves, submarine escape training facility, maintenance facilities, operational support buildings, training centres, accommodation, and upgrades to power, water and waste systems. Total investment approximately $8 billion to 2034-35.
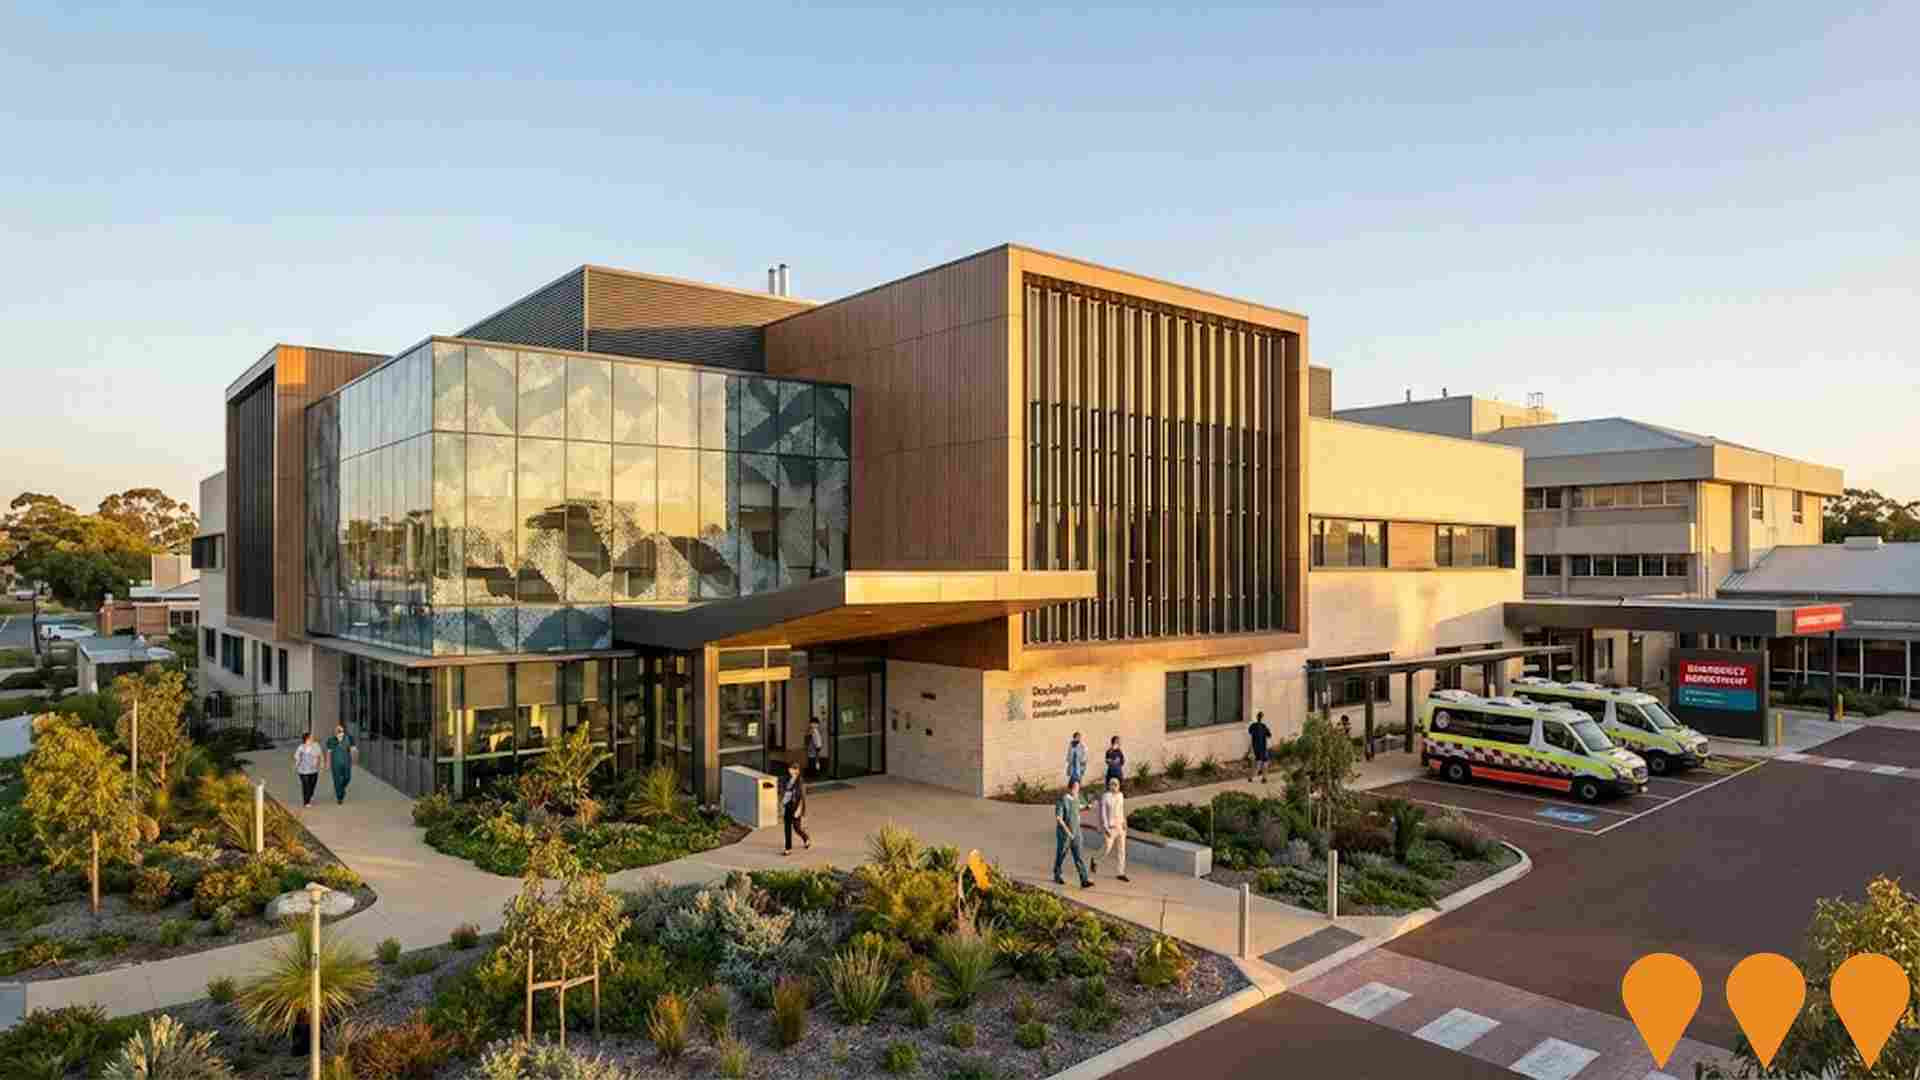
Rockingham General Hospital Redevelopment
Major redevelopment of Rockingham General Hospital, expanding from 47 to 229 beds. The project, completed in stages from 2007 to 2010, included addition of 182 beds, expansion and replacement of most departments, new emergency department, operating theatres, wards, intensive care, mental health, chemotherapy, obstetrics units. Further additions include a 30-bed mental health inpatient unit as the final stage and a 30-bed modular ward opened in 2022 to boost capacity.

Rockingham General Hospital Expansion Stage 2
Major expansion of Rockingham General Hospital including new mental health unit, additional inpatient beds, expanded emergency department and cancer services centre.
HMAS Stirling Infrastructure Enhancement
Package of Defence infrastructure works and supporting road and transport studies around HMAS Stirling on Garden Island, linked to the AUKUS Submarine Rotational Force West program. The project includes upgrades to wharves, berthing and base facilities at Fleet Base West, and Commonwealth and WA funded studies into roads, local transport, Garden Island Highway environmental and heritage impacts, and future access options between Rockingham, Cape Peron and HMAS Stirling. Early construction works for SRF West priority works began in 2024, main construction commenced in August 2025, and the external road and transport studies started in early 2025 with an initial 10 month program to inform later investment decisions.
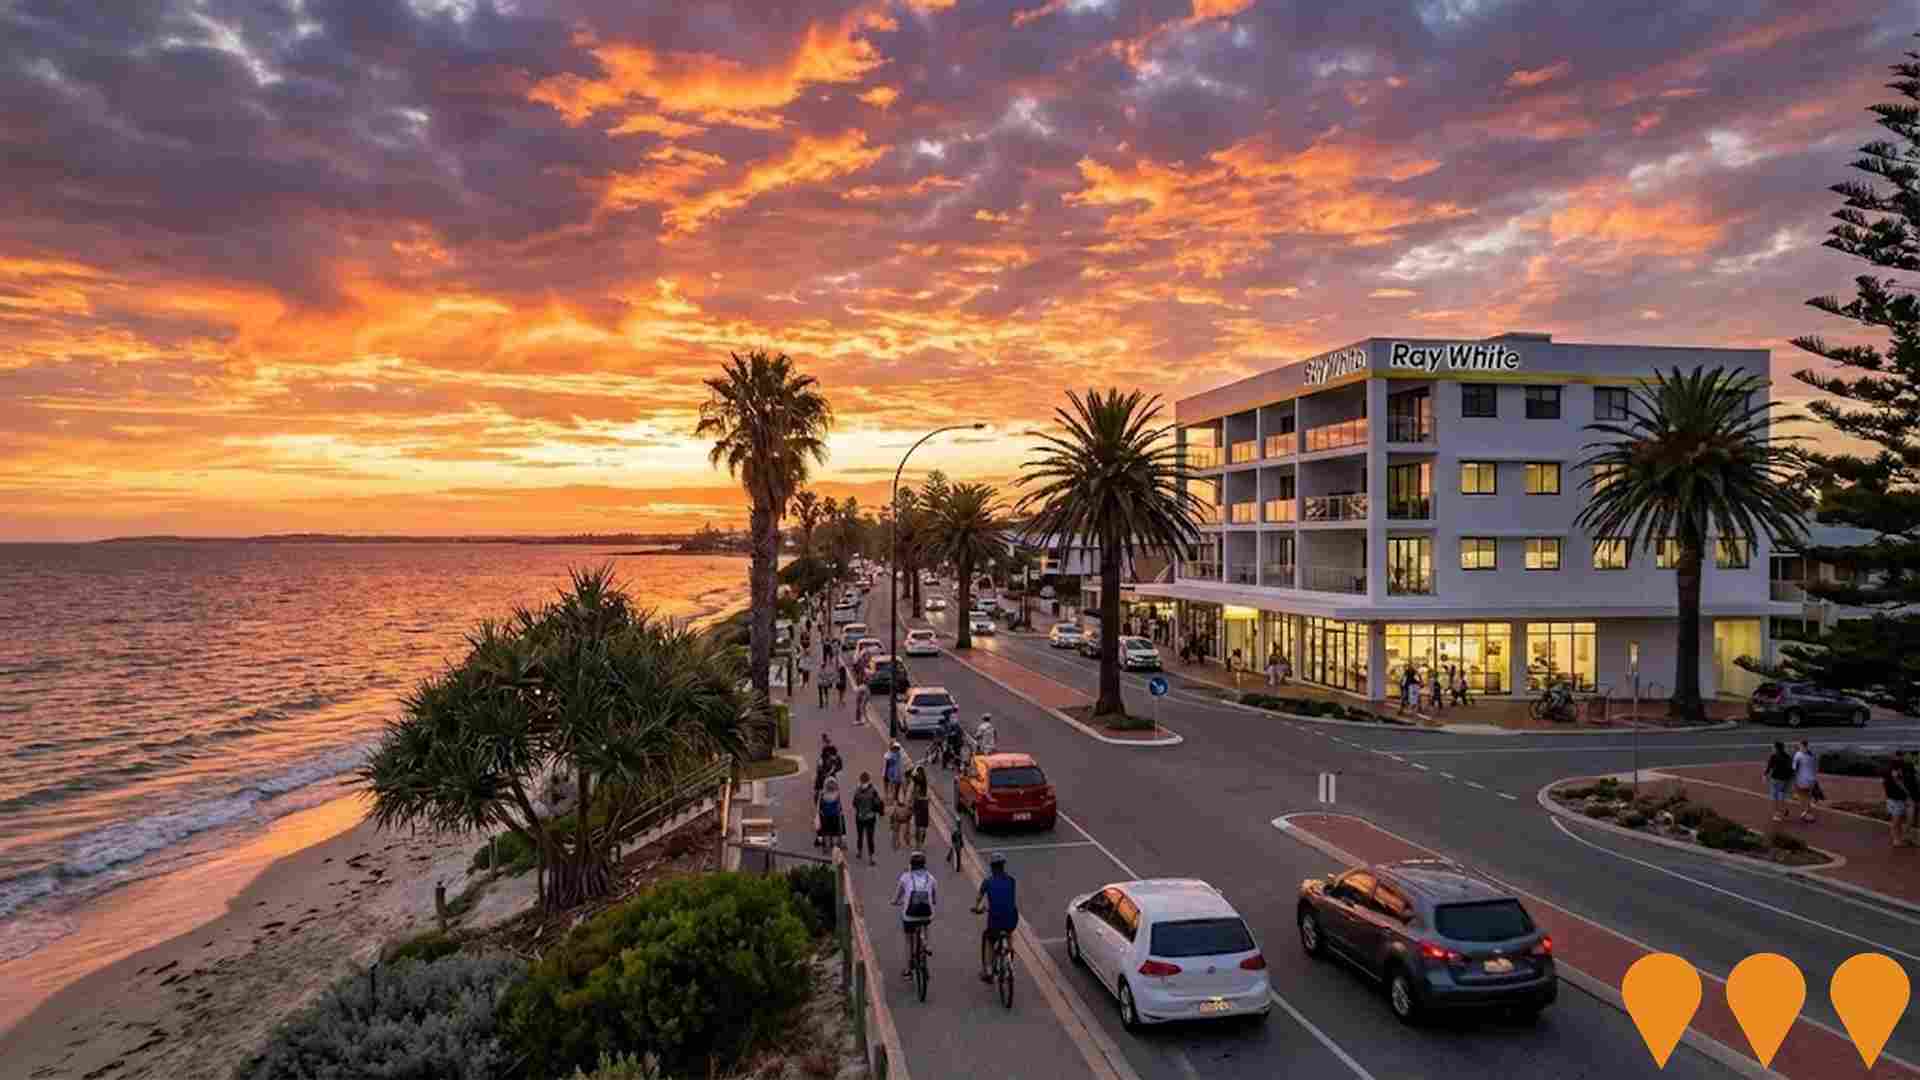
Safety Bay Road & Penguin Road Mixed-Use Precinct (Proposed)
Planned upgrade of the Safety Bay Road and Penguin Road Local Centre into a more intensive mixed-use precinct, guided by the City of Rockingham Local Planning Strategy and recent scheme amendments that rezone key lots on Penguin Road to commercial. The concept anticipates a walkable coastal village hub combining local retail, medical and commercial tenancies with medium density housing and improved public realm over time as private sites redevelop.
Rockingham Marina
State-led process to identify a new private proponent via an Expressions of Interest in 2025 for a marina at Wanliss Street/Rockingham Beach Road. The project aims to provide new vessel accommodation and improve coastal access and tourism while serving as a community asset.

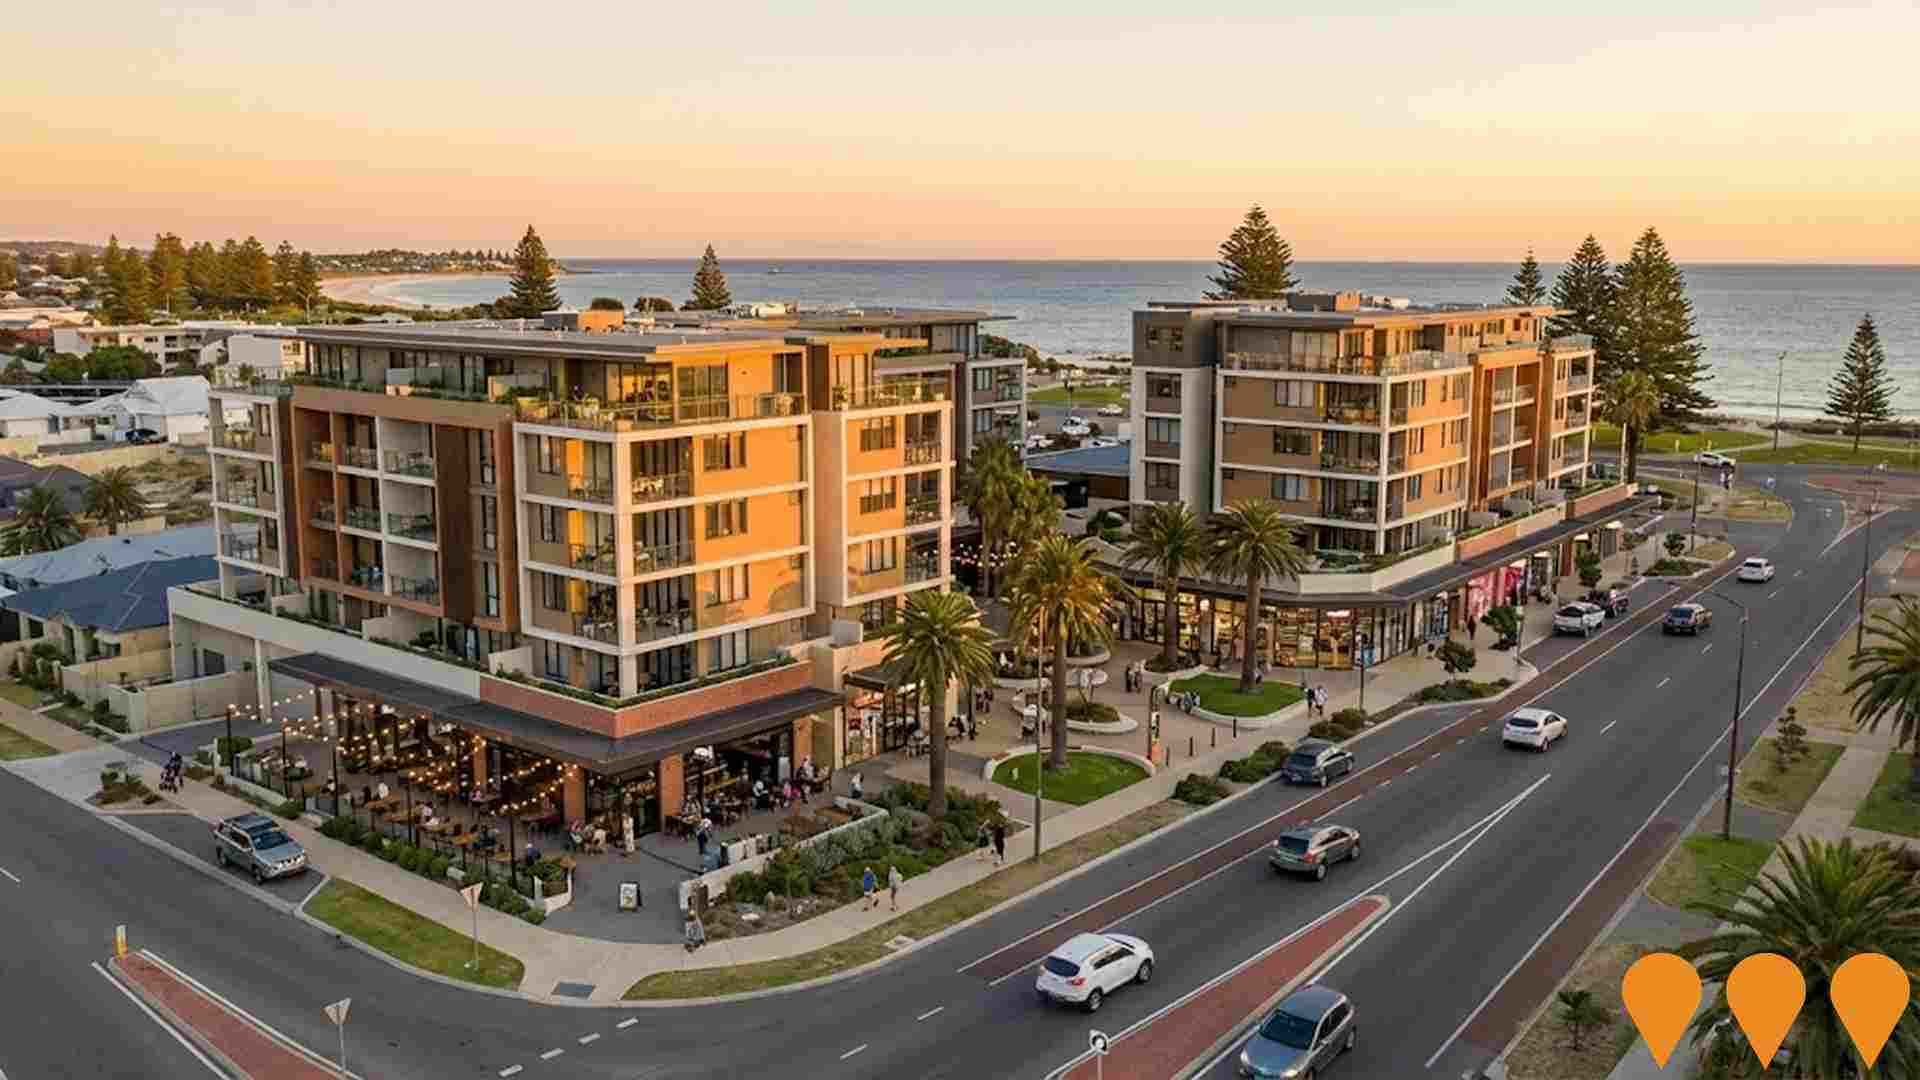
Waikiki Hotel Site Redevelopment
Mixed-use redevelopment of the former Waikiki Hotel/Motel site including licensed premises, residential, retail, and entertainment facilities on Safety Bay Road. The site requires a licensed premises component and aims to recreate the site's former reputation as a focal point for the coastal strip.
Schools Upgrade Fund - Rockingham and Kwinana Schools
Commonwealth-funded upgrades to multiple public schools in the Rockingham and Kwinana area under the Schools Upgrade Fund Round 2, including works such as classroom refurbishments, new playgrounds and sporting facility improvements. WA announcements list local recipients such as Gilmore College (Orelia), Koorana Education Support Centre (Warnbro), with delivery progressing through the WA Department of Education.
Employment
Safety Bay - Shoalwater shows employment indicators that trail behind approximately 70% of regions assessed across Australia
Safety Bay - Shoalwater had an unemployment rate of 5.5% as of September 2025, with estimated employment growth of 3.6% over the past year. As of that date, 6,485 residents were in work, while the unemployment rate was 1.5% higher than Greater Perth's rate of 4.0%.
Workforce participation was at 54.9%, significantly lower than Greater Perth's 65.2%. Major employment sectors for residents included health care & social assistance, construction, and education & training. The area showed strong specialization in manufacturing, with an employment share 1.5 times the regional level. However, professional & technical services employed only 5.3% of local workers, lower than Greater Perth's 8.2%.
Employment opportunities appeared limited locally, as indicated by the Census working population vs resident population count. In the 12-month period ending September 2025, employment increased by 3.6% while labour force grew by 4.3%, resulting in a 0.6 percentage point rise in unemployment rate. This contrasted with Greater Perth's figures of 2.9% employment growth, 3.0% labour force growth, and marginal unemployment increase. State-level data as of 25-Nov showed WA employment contracted by 0.27%, with an unemployment rate of 4.6% compared to the national rate of 4.3%. National employment forecasts from May-25 projected a 6.6% expansion over five years and 13.7% over ten years, but growth rates varied significantly between industry sectors. Applying these projections to Safety Bay - Shoalwater's employment mix suggested local employment should increase by 6.0% over five years and 12.8% over ten years.
Frequently Asked Questions - Employment
Income
The area's income profile falls below national averages based on AreaSearch analysis
The Safety Bay - Shoalwater SA2's median income among taxpayers was $53,386 and average income stood at $66,775 in the financial year 2022, according to latest ATO data aggregated by AreaSearch. This compares with Greater Perth's figures of $58,380 and $78,020 respectively. Based on Wage Price Index growth of 14.2% since financial year 2022, current estimates would be approximately $60,967 (median) and $76,257 (average) as of September 2025. According to 2021 Census figures, household, family and personal incomes in Safety Bay - Shoalwater rank modestly, between the 24th and 27th percentiles. Income analysis reveals that the largest segment comprises 27.9% earning $1,500 - 2,999 weekly (3,666 residents), consistent with broader trends across the metropolitan region showing 32.0% in the same category. Housing affordability pressures are severe, with only 84.4% of income remaining, ranking at the 25th percentile.
Frequently Asked Questions - Income
Housing
Safety Bay - Shoalwater is characterized by a predominantly suburban housing profile, with above-average rates of outright home ownership
In Safety Bay - Shoalwater, as per the latest Census, 87.4% of dwellings were houses, with the remaining 12.7% comprising semi-detached homes, apartments, and other types. In contrast, Perth metro had 90.5% houses and 9.6% other dwellings. Home ownership in Safety Bay - Shoalwater stood at 39.7%, with mortgaged properties making up 35.1% and rented dwellings at 25.2%. The median monthly mortgage repayment was $1,674, lower than Perth metro's average of $1,733. The median weekly rent in Safety Bay - Shoalwater was $300, compared to Perth metro's $330. Nationally, Safety Bay - Shoalwater's mortgage repayments were significantly lower than the Australian average of $1,863, and rents were substantially below the national figure of $375.
Frequently Asked Questions - Housing
Household Composition
Safety Bay - Shoalwater features high concentrations of lone person households, with a lower-than-average median household size
Family households comprise 66.3% of all households, including 25.4% couples with children, 29.9% couples without children, and 10.2% single parent families. Non-family households account for 33.7%, with lone person households at 31.5% and group households making up 2.1%. The median household size is 2.3 people, which is smaller than the Greater Perth average of 2.6.
Frequently Asked Questions - Households
Local Schools & Education
Educational outcomes in Safety Bay - Shoalwater fall within the lower quartile nationally, indicating opportunities for improvement in qualification attainment
The area's university qualification rate is 17.8%, significantly lower than the Australian average of 30.4%. This indicates a need for targeted educational initiatives. Bachelor degrees are most common at 12.8%, followed by postgraduate qualifications (2.9%) and graduate diplomas (2.1%). Vocational credentials are prevalent, with 44.8% of residents aged 15+ holding them, including advanced diplomas (12.0%) and certificates (32.8%).
Educational participation is high, with 26.6% of residents currently enrolled in formal education. This includes 9.9% in primary education, 7.7% in secondary education, and 3.5% pursuing tertiary education.
Frequently Asked Questions - Education
Schools Detail
Nearby Services & Amenities
Transport
Transport servicing is moderate compared to other areas nationally based on assessment of service frequency, route connectivity and accessibility
Transport analysis in Safety Bay - Shoalwater shows 86 active public transport stops operating. These are served by a mix of bus routes, totalling six individual routes. The combined weekly passenger trips across these routes amount to 1,594.
Residential accessibility to transport is rated excellent, with residents typically located 188 meters from the nearest stop. Service frequency averages 227 trips per day across all routes, equating to approximately 18 weekly trips per individual stop.
Frequently Asked Questions - Transport
Transport Stops Detail
Health
Health performance in Safety Bay - Shoalwater is lower than average with common health conditions somewhat prevalent across both younger and older age cohorts
Safety Bay - Shoalwater faces significant health challenges with common health conditions prevalent across both younger and older age cohorts. The rate of private health cover is approximately 52%, totaling around 6,885 people, compared to Greater Perth's 55.3%.
The most common medical conditions are arthritis (10.2%) and mental health issues (8.7%). About 64.4% of residents report no medical ailments, compared to 68.5% in Greater Perth. Around 25% of residents are aged 65 and over (3,282 people), higher than the 15.6% in Greater Perth.
Frequently Asked Questions - Health
Cultural Diversity
In terms of cultural diversity, Safety Bay - Shoalwater records figures broadly comparable to the national average, as found in AreaSearch's assessment of a number of language and cultural background related metrics
Safety Bay-Shoalwater exhibited cultural diversity with 6.2% speaking a language other than English at home and 30.7% born overseas. Christianity was the dominant religion, accounting for 46.0%. Buddhism showed an overrepresentation of 1.3%, compared to Greater Perth's 1.0%.
The top three ancestry groups were English (37.1%), Australian (25.4%), and Scottish (8.2%). Notable divergences included Welsh at 1.1% (regional: 0.9%), Maori at 1.1% (vs regional 2.0%), and Dutch at 1.8% (vs regional 1.7%).
Frequently Asked Questions - Diversity
Age
Safety Bay - Shoalwater hosts an older demographic, ranking in the top quartile nationwide
The median age in Safety Bay - Shoalwater is 46 years, which exceeds Greater Perth's average of 37 years and is also higher than Australia's median age of 38 years. The 65-74 age cohort is notably over-represented locally at 12.7%, while the 25-34 age group is under-represented at 10.5%. According to the 2021 Census, the population aged 15 to 24 has increased from 9.4% to 10.5%, while the 55 to 64 cohort has decreased from 14.8% to 14.2%. By 2041, population forecasts indicate significant demographic changes for Safety Bay - Shoalwater. The 85+ age cohort is projected to increase by 465 people (103%), from 453 to 919. Those aged 65 and above are expected to comprise 89% of the total population growth, while the 25-34 and 0-4 age groups are anticipated to experience population declines.
