Chart Color Schemes
This analysis uses ABS Statistical Areas Level 2 (SA2) boundaries, which can materially differ from Suburbs and Localities (SAL) even when sharing similar names.
SA2 boundaries are defined by the Australian Bureau of Statistics and are designed to represent communities for statistical reporting (e.g., census and ERP).
Suburbs and Localities (SAL) represent commonly-used suburb/locality names (postal-style areas) and may use different geographic boundaries. For comprehensive analysis, consider reviewing both boundary types if available.
est. as @ -- *
ABS ERP | -- people | --
2021 Census | -- people
Sales Activity
Curious about local property values? Filter the chart to assess the volume and appreciation (including resales) trends and regional comparisons, or scroll to the map below view this information at an individual property level.
Find a Recent Sale
Sales Detail
Population
Karnup lies within the top 10% of areas nationally in terms of population growth performance according to AreaSearch analysis of short and medium-term trends
Karnup's population was around 2,764 as of November 2025. This showed an increase of 668 people since the 2021 Census, which reported a population of 2,096 people. The change was inferred from the estimated resident population of 2,524 in June 2024 and an additional 209 validated new addresses since the Census date. This resulted in a density ratio of 51 persons per square kilometer. Karnup's growth rate of 31.9% since the 2021 census exceeded both national (8.9%) and state averages, indicating significant population expansion in the region. Interstate migration contributed approximately 51.6% of overall population gains during recent periods, although all factors including natural growth and overseas migration were positive influences.
AreaSearch uses ABS/Geoscience Australia projections for each SA2 area, released in 2024 with a base year of 2022. For areas not covered by this data, AreaSearch utilises growth rates by age cohort provided by the ABS in its latest Greater Capital Region projections (released in 2023, based on 2022 data). Future population dynamics forecast a significant increase in the top quartile of statistical areas across the nation. Karnup is expected to increase by 711 persons to reach 3,475 by 2041, reflecting an overall gain of 17.0% over the 17-year period based on the latest annual ERP population numbers.
Frequently Asked Questions - Population
Development
AreaSearch assessment of residential development activity positions Karnup among the top 25% of areas assessed nationwide
Karnup has received approximately 65 dwelling approvals per year over the past five financial years, totalling 327 homes from FY-20 to FY-24. As of FY-26, 19 approvals have been recorded. On average, 1.5 people move to Karnup annually for each dwelling built between FY-21 and FY-25, indicating balanced supply and demand dynamics. The average construction cost value of new dwellings is $260,000.
In FY-26, there have been $157,000 in commercial approvals, suggesting a primarily residential focus. Compared to Greater Perth, Karnup has 233% higher development activity per capita, offering buyers more choice and reflecting strong developer confidence. All recent developments have been detached houses, maintaining the area's traditional low-density character. With around 39 people moving for each dwelling approval, Karnup exhibits growth area characteristics. According to AreaSearch's latest quarterly estimate, Karnup is projected to add 471 residents by 2041.
Based on current development patterns, new housing supply should meet demand, creating favourable conditions for buyers and potentially facilitating population growth beyond projections.
Frequently Asked Questions - Development
Infrastructure
Karnup has emerging levels of nearby infrastructure activity, ranking in the 24thth percentile nationally
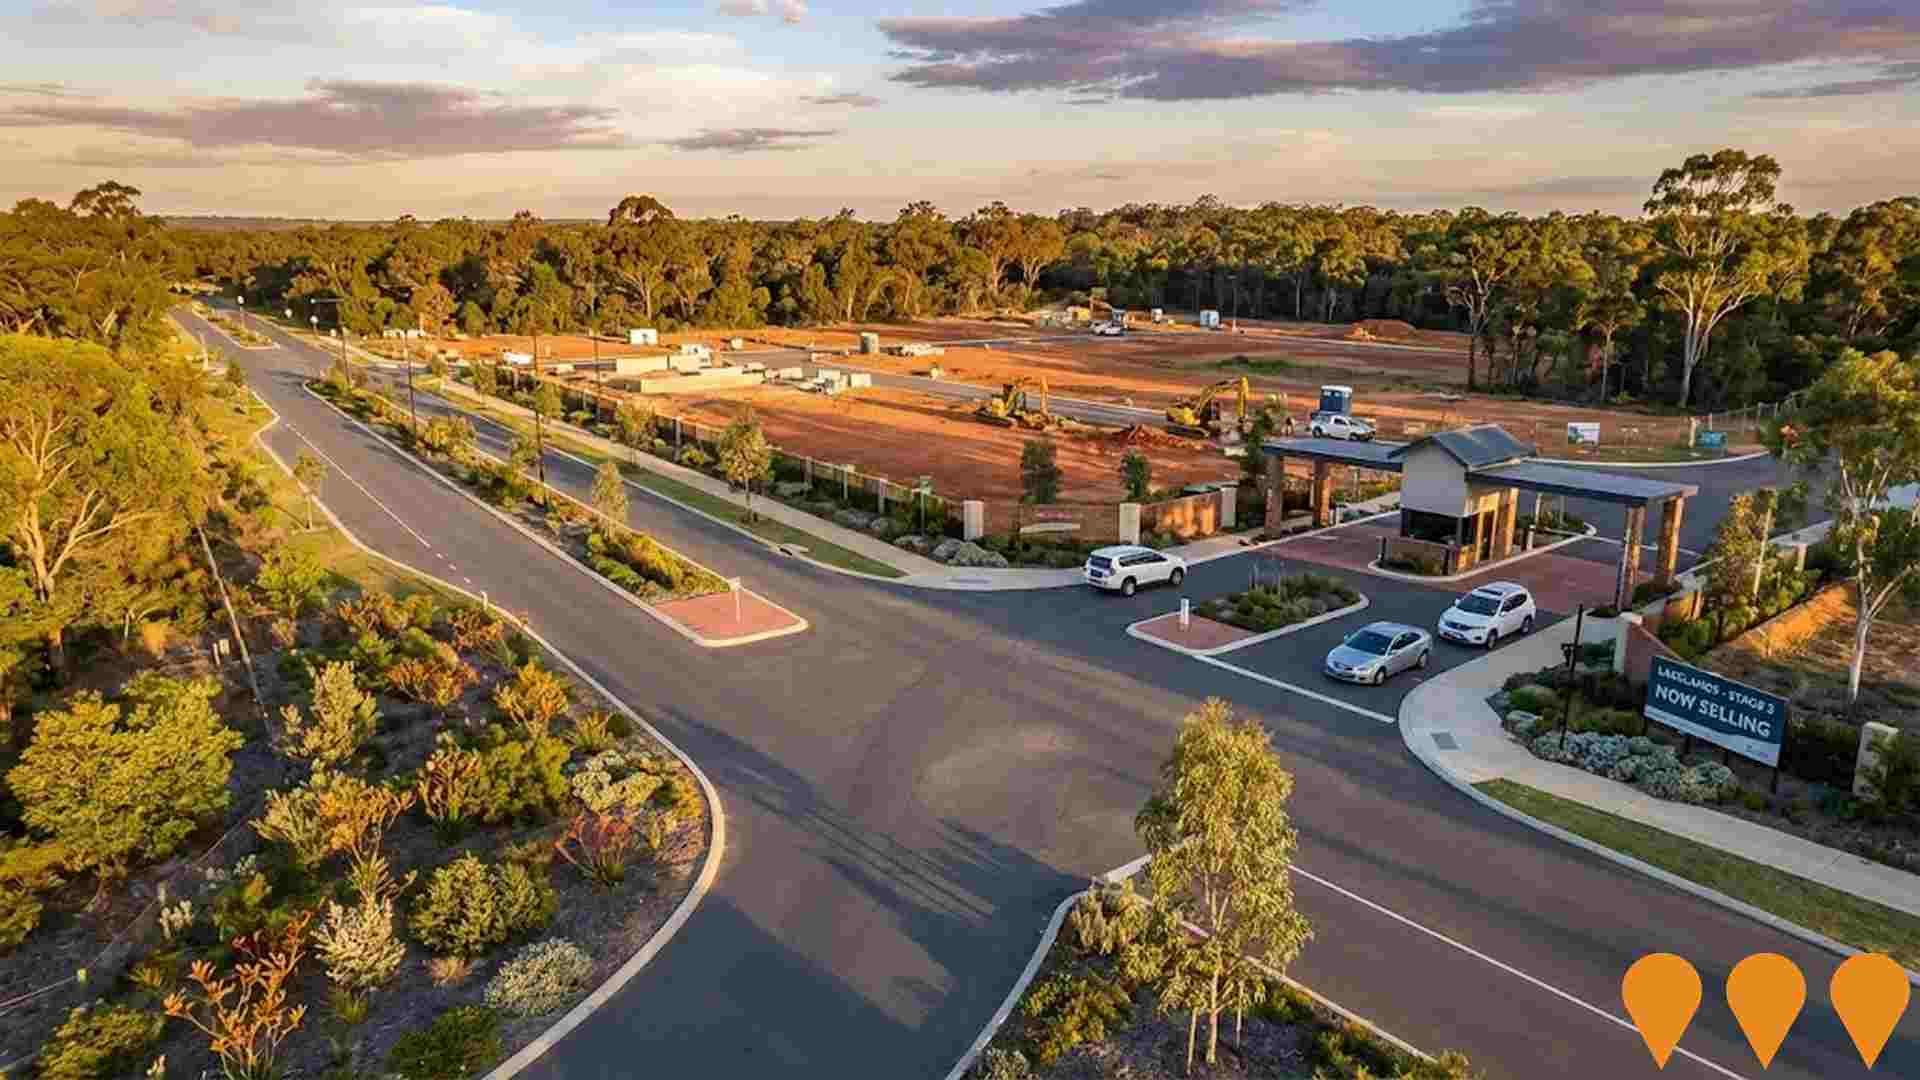
AreaSearch has identified a total of 21 projects that are expected to impact the area significantly due to their influence on local infrastructure, major developments, and planning initiatives. Among these key projects are The Gardens Estate - Lakelands, Lakelands Town Centre, METRONET Karnup Station Precinct, and Lakelands Residential Development Stage 3. A detailed list of these projects is provided below for further reference.
Professional plan users can use the search below to filter and access additional projects.
INFRASTRUCTURE SEARCH
 Denotes AI-based impression for illustrative purposes only, not to be taken as definitive under any circumstances. Please follow links and conduct other investigations from the project's source for actual imagery. Developers and project owners wishing us to use original imagery please Contact Us and we will do so.
Frequently Asked Questions - Infrastructure
METRONET Karnup Station Precinct
New railway station on the Mandurah Line at Karnup, integrated with a transit-oriented precinct delivering approximately 2000 dwellings, community facilities, retail and public open space across 35 hectares. Structure planning is progressing and the Metropolitan Region Scheme amendment to rezone land for urban development was gazetted in May 2025.

Lakelands Town Centre
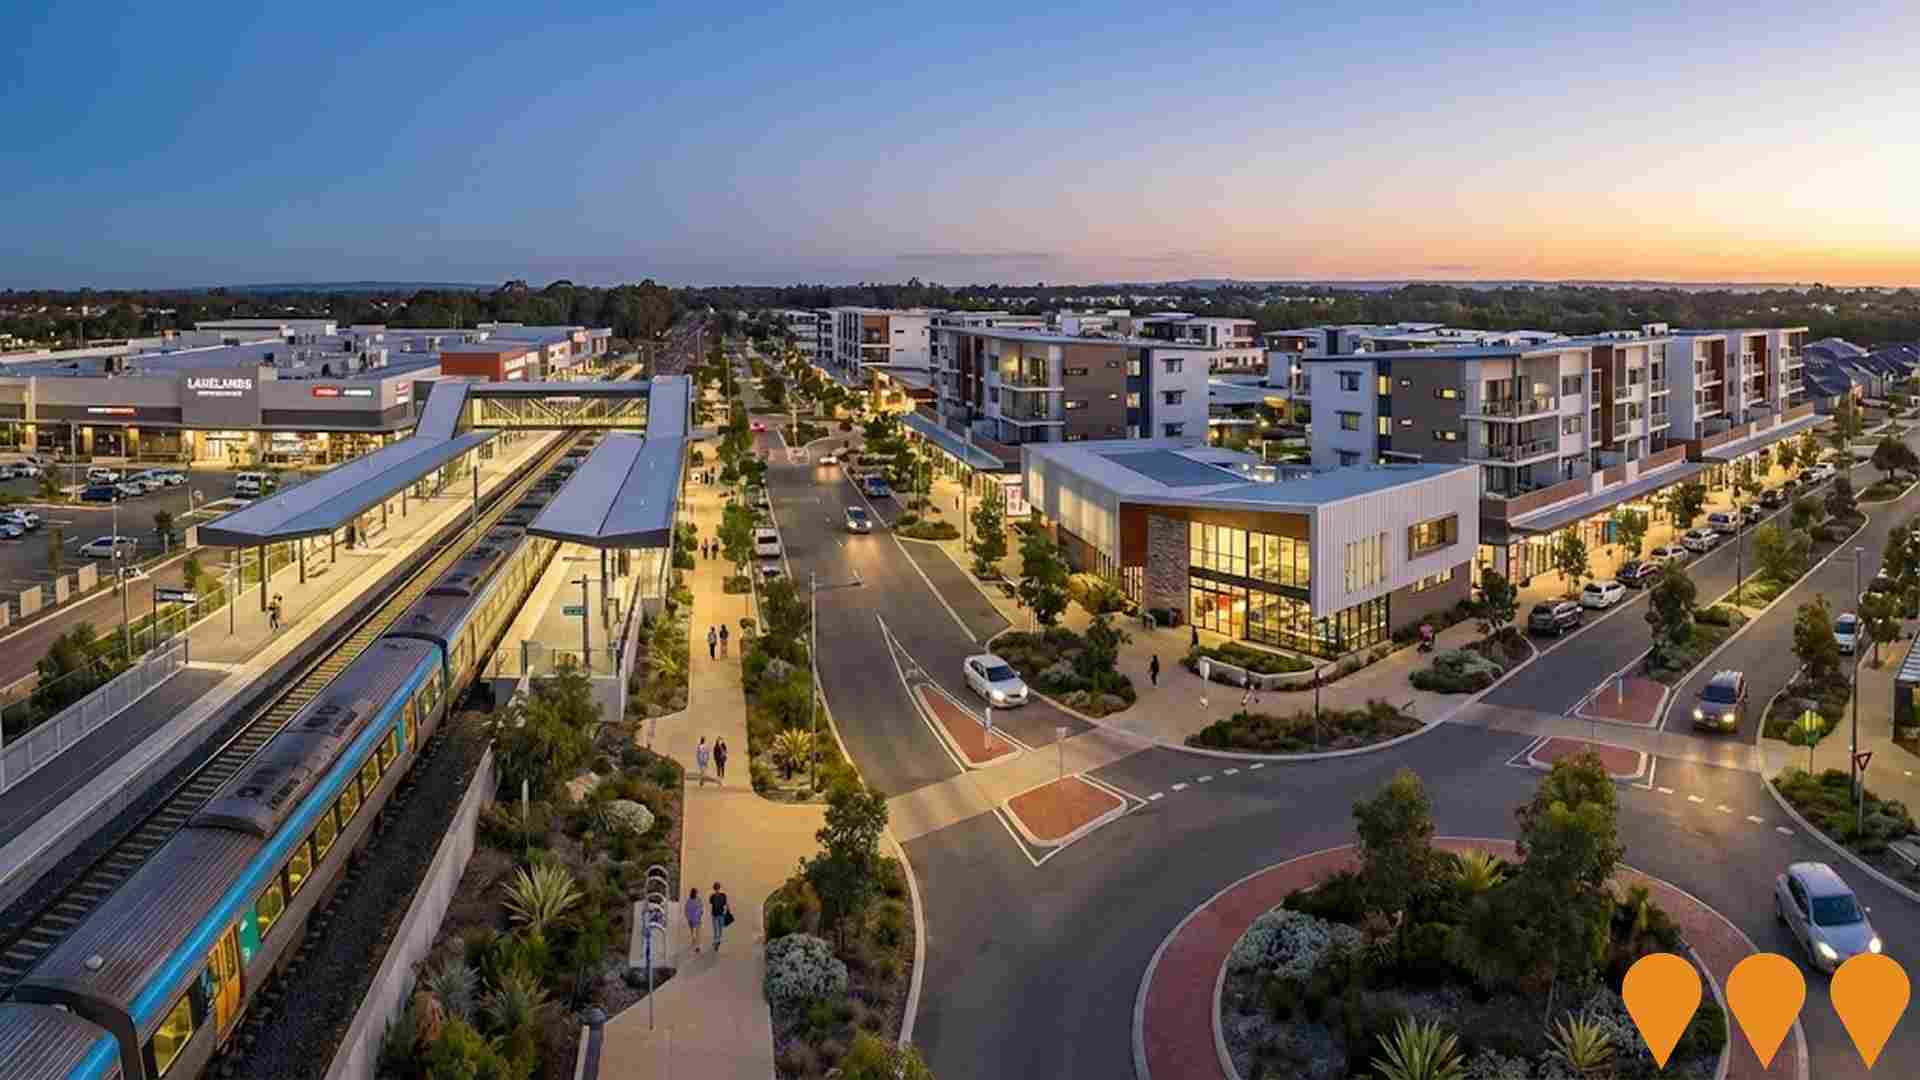
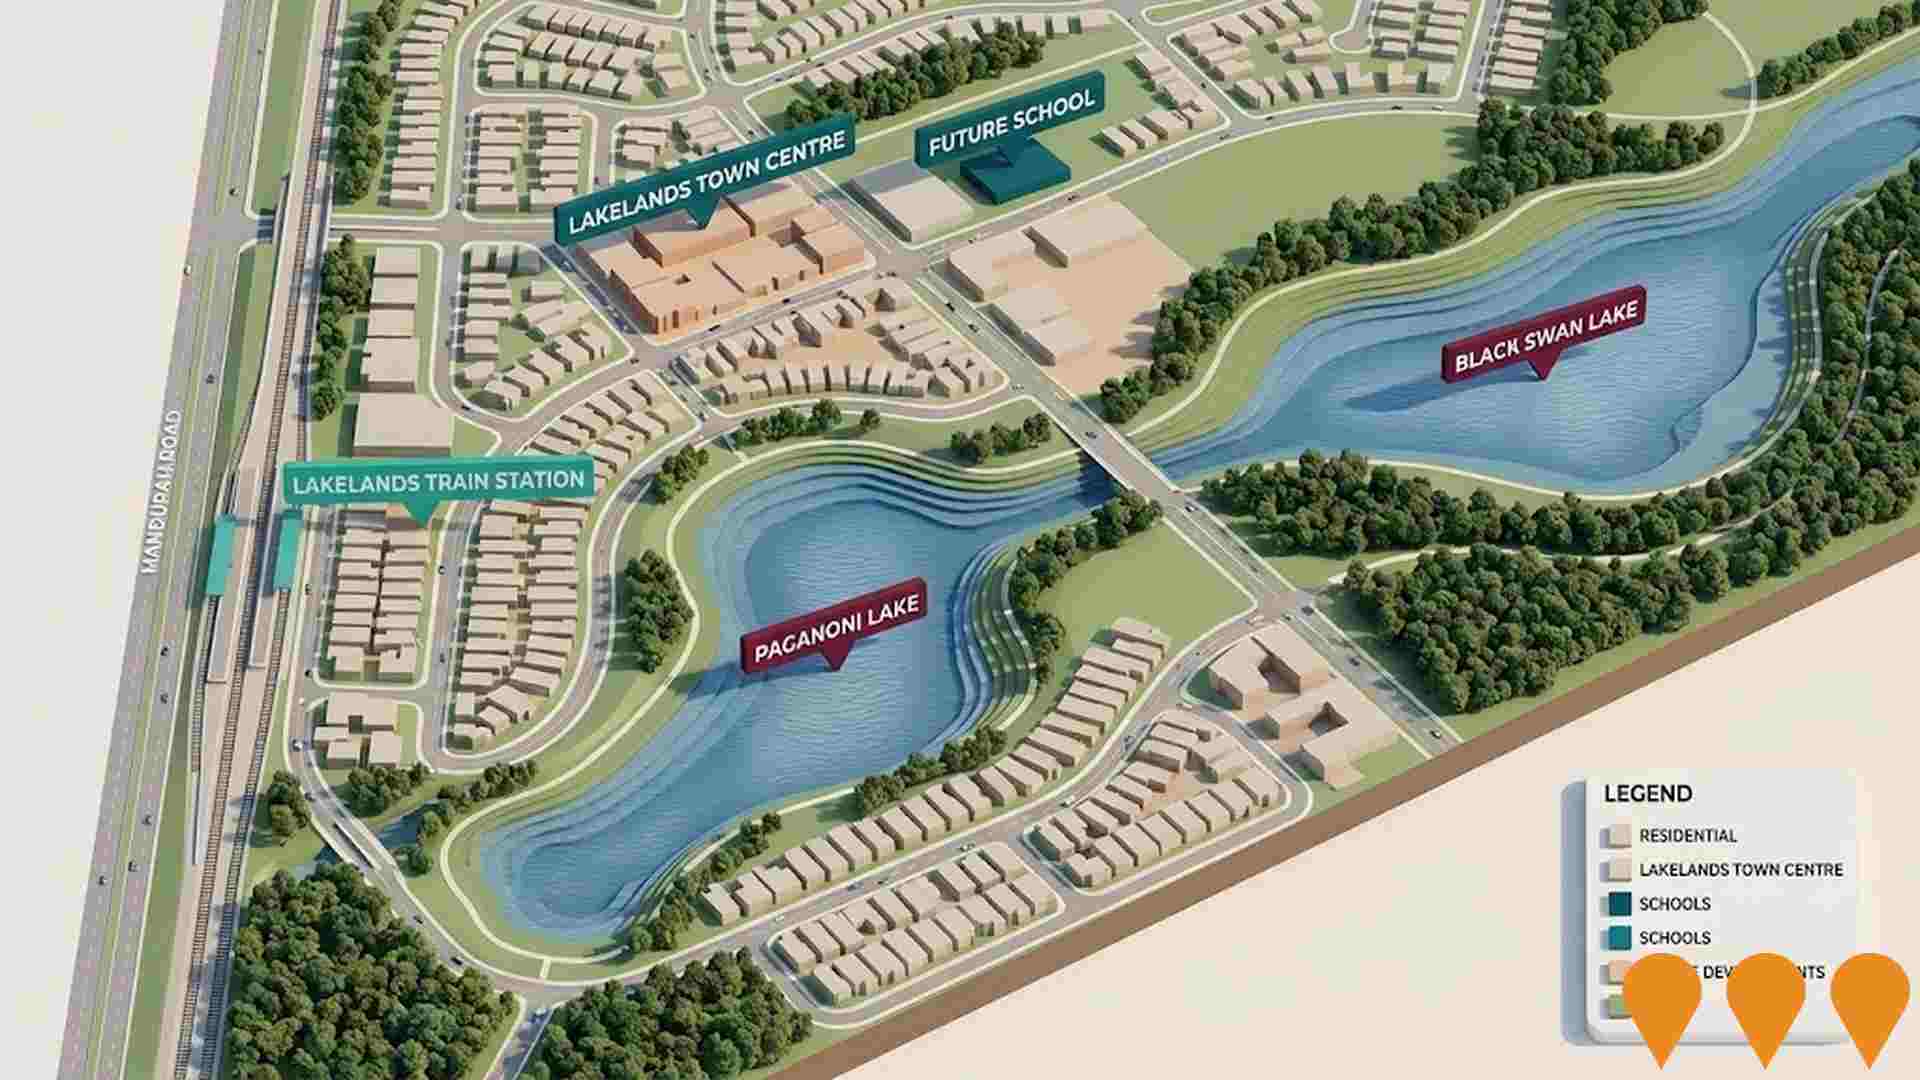
A major mixed-use precinct serving the northern Mandurah corridor, anchored by the Lakelands Shopping Centre (completed 2017) and the new Lakelands Train Station (completed 2023). The precinct integrates retail, civic, and transit facilities, including the Lakelands Library and Community Centre. Ongoing development includes a new Mixed Business Sub-Precinct offering large format showrooms and commercial spaces, alongside continued residential expansion within the master-planned estate.
Lakelands Station
New METRONET infill railway station on the Mandurah Line between Warnbro and Mandurah. Opened 11 June 2023 with two side platforms, pedestrian overpass, 8-stand bus interchange, kiss-and-ride, secure cycle storage and a 400-bay car park. Provides an approx. 50-minute commute to Perth CBD and relieves pressure on Mandurah and Warnbro stations. Station is future-proofed for escalators, more lifts, a kiosk, fare gates and a customer service office as demand grows.

Lakelands Estate
Lakelands Estate is a large Peet masterplanned community in the Mandurah growth corridor, delivering around 2,700 house and land lots alongside the Lakelands Town Centre, multiple schools, landscaped parklands, a lifestyle village and the Lakelands train station. The project has been underway since the early 2000s and continues to release new stages, with completion of remaining lots expected around 2028.
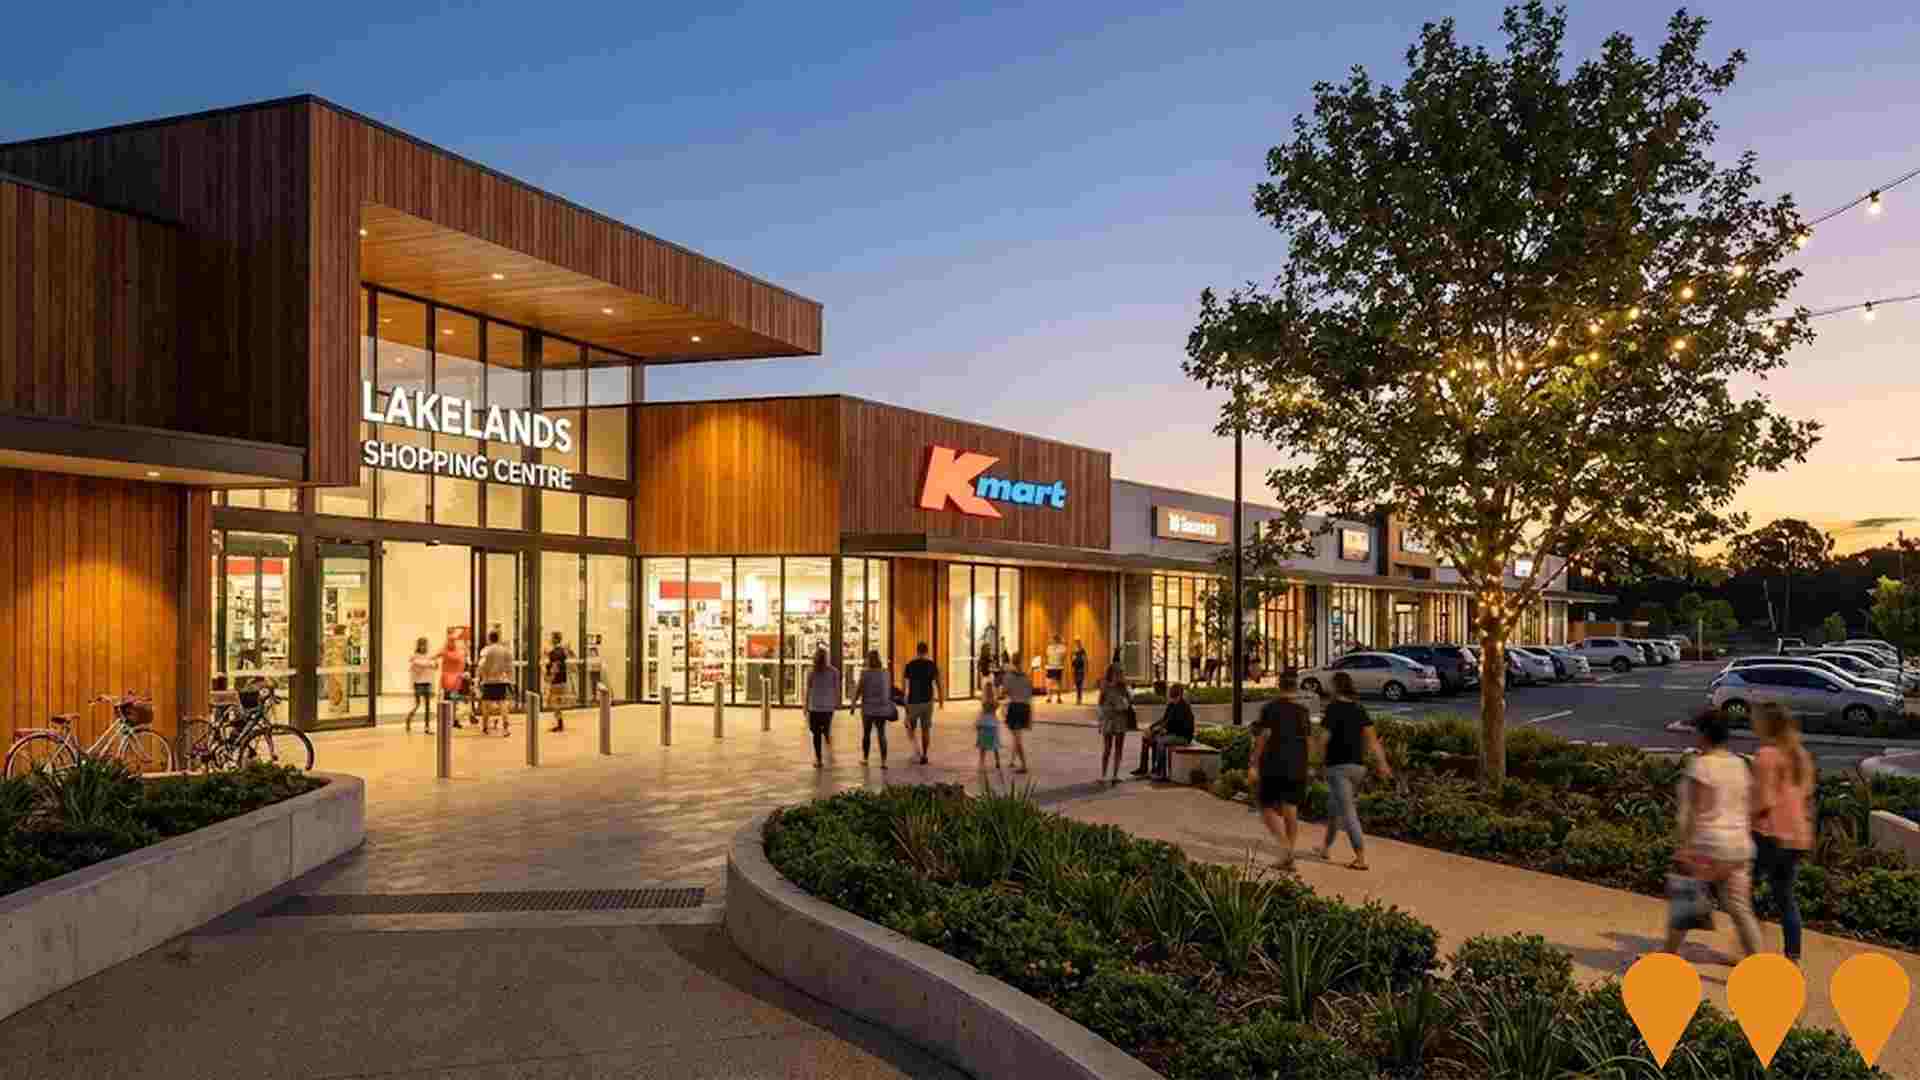
Lakelands Shopping Centre
Major retail destination featuring Woolworths, Coles, Kmart, specialty stores, food court, and medical facilities. Anchors the growing Lakelands community with convenient shopping and services.
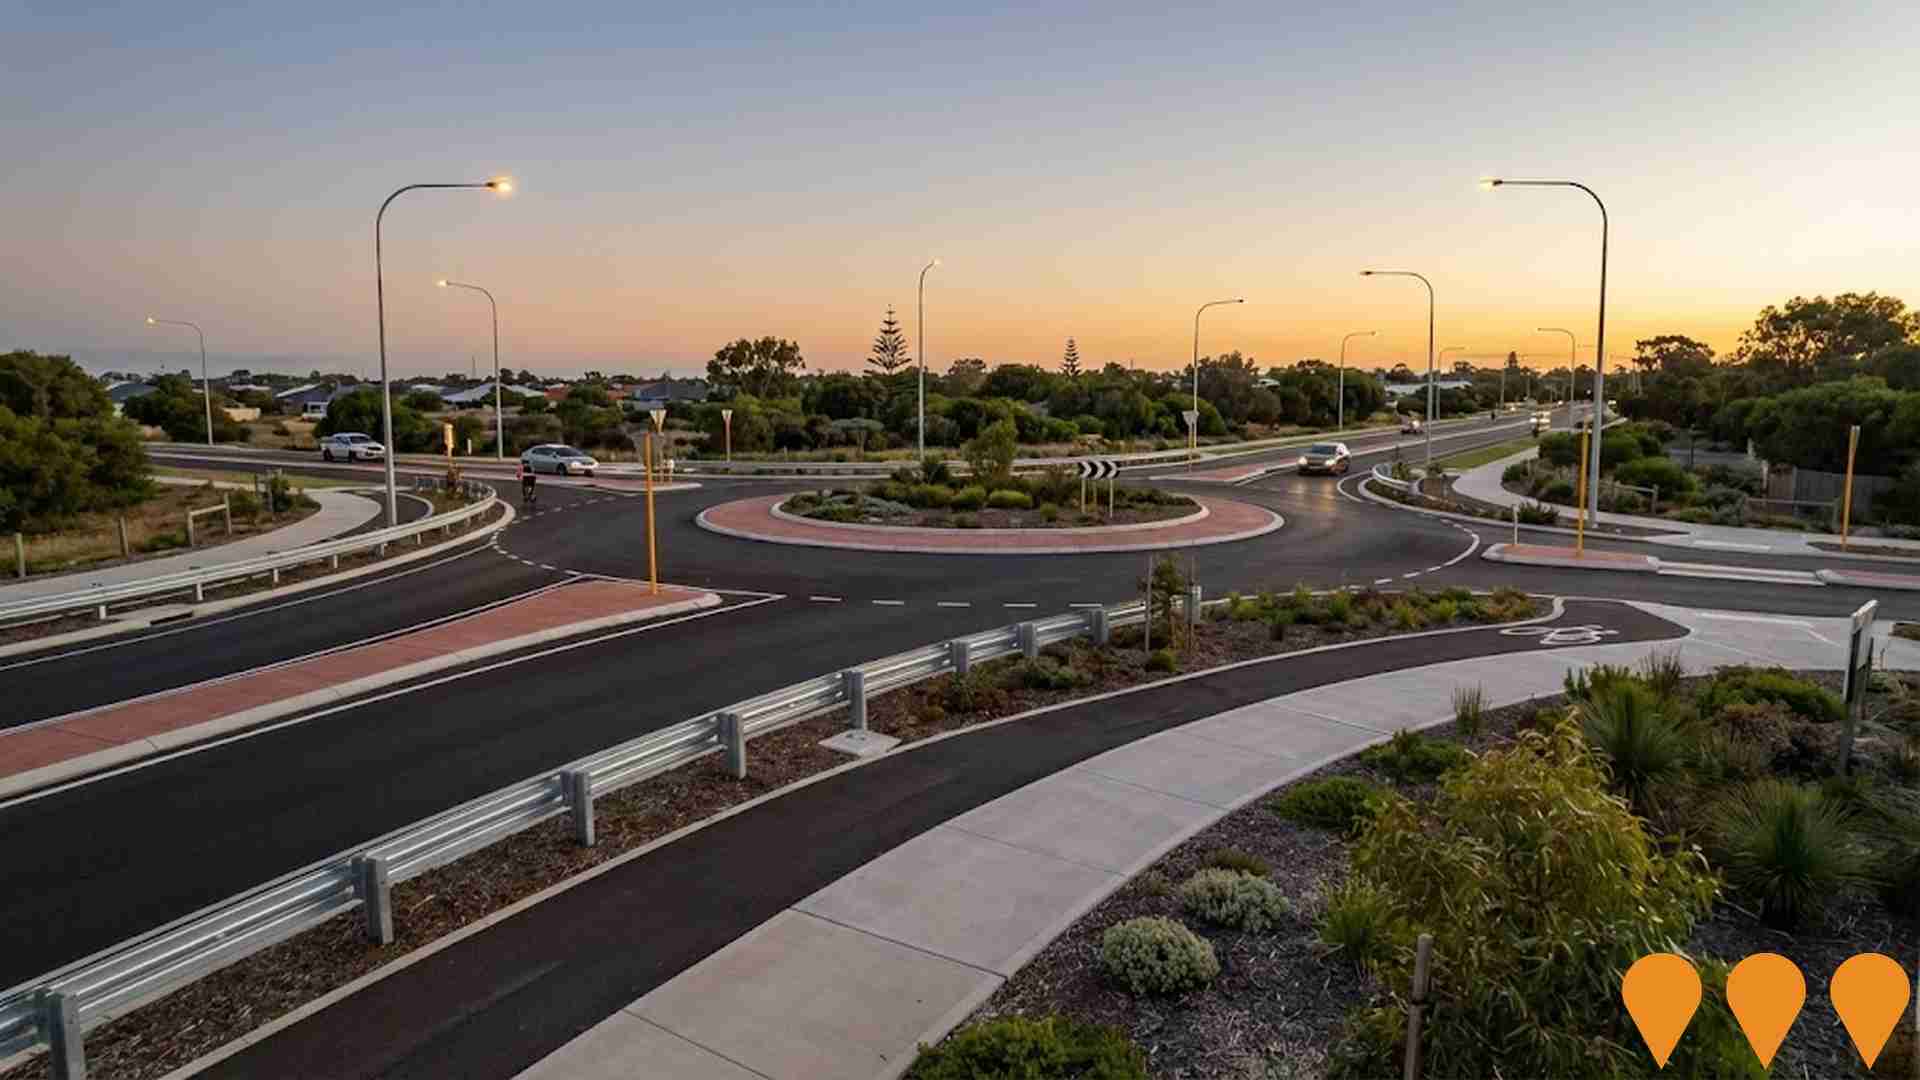
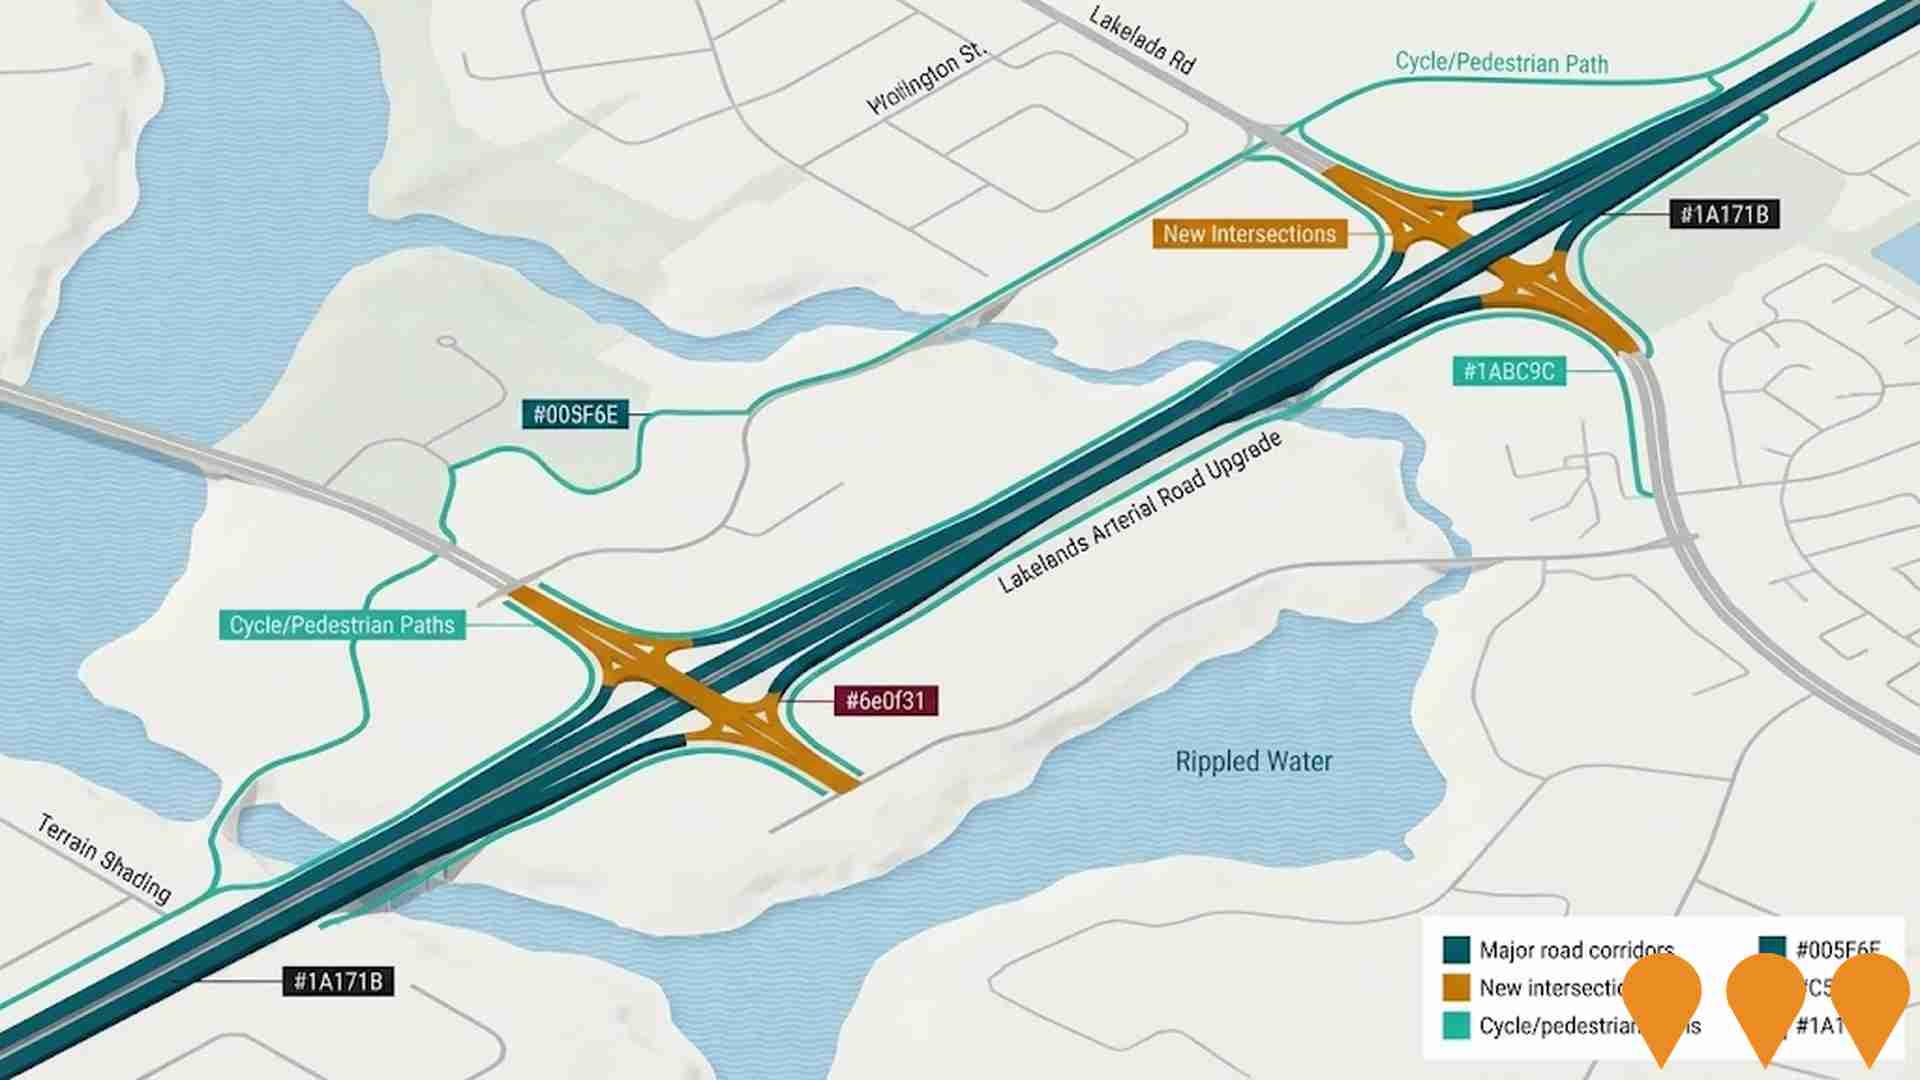
Lakelands Arterial Road Upgrade
Major road infrastructure upgrade to improve traffic flow and safety in the Lakelands area. Includes road widening, new intersections, cycling paths, and improved pedestrian facilities.
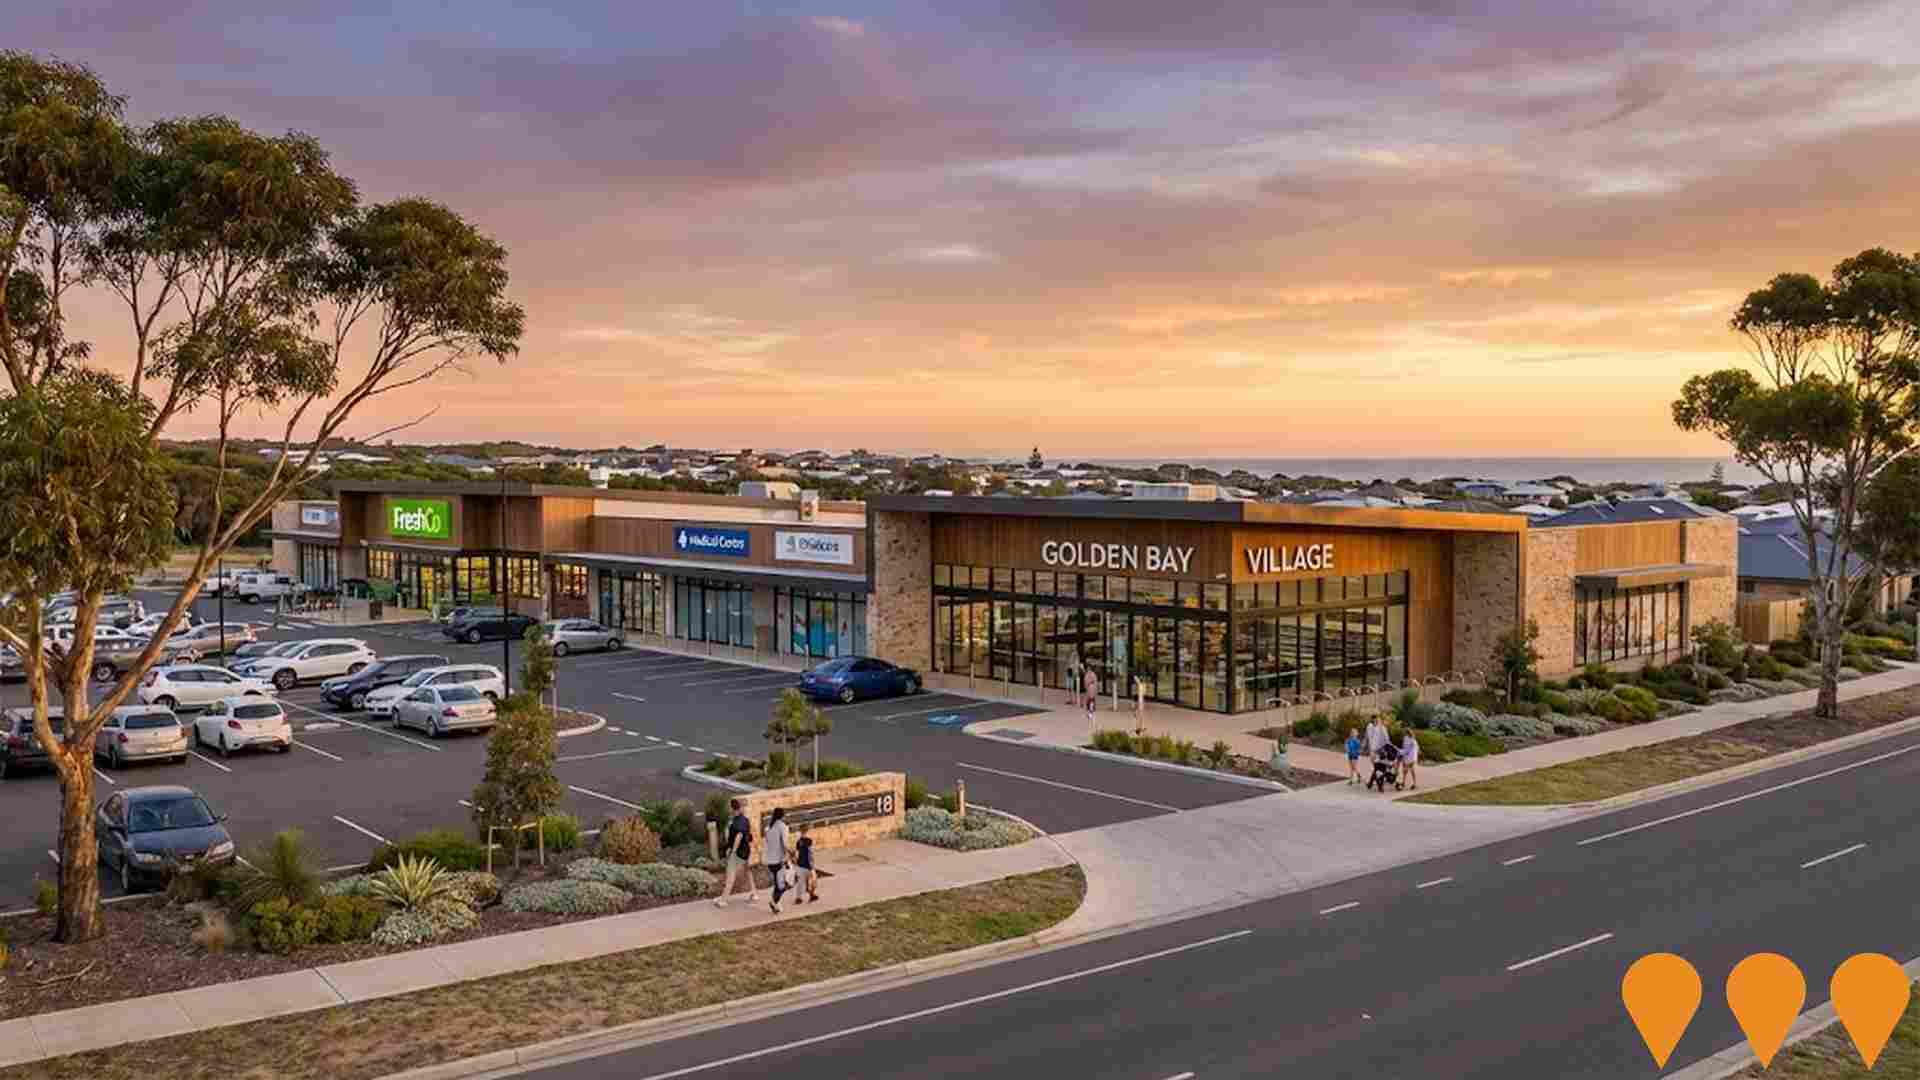
Golden Bay Local Centre
Future neighbourhood retail centre planned for Golden Bay including supermarket, specialty shops, medical centre and childcare.
The Gardens Estate - Lakelands
Residential estate development in Lakelands featuring family homes with modern design, parks, and community facilities in a master-planned community setting.

Employment
Employment performance in Karnup has been broadly consistent with national averages
Karnup has a balanced workforce with both white and blue collar jobs. The construction sector is prominent, with an unemployment rate of 4.3% and estimated employment growth of 3.5% in the past year as of September 2025.
There are 1,432 residents employed, with an unemployment rate of 4.7%, which is 0.4% higher than Greater Perth's rate of 4.0%. Workforce participation stands at 70.4%, compared to Greater Perth's 65.2%. Major employment sectors include construction, health care & social assistance, and retail trade. Karnup specializes in construction, with an employment share 1.4 times the regional level.
However, professional & technical services employ only 3.0% of local workers, below Greater Perth's 8.2%. Between September 2024 and September 2025, employment increased by 3.5%, while labour force grew by 5.1%, leading to a rise in unemployment by 1.5 percentage points. In contrast, Greater Perth recorded employment growth of 2.9% with marginal unemployment increase. As of 25-Nov-25, WA's employment contracted by 0.27%, with the state unemployment rate at 4.6%. Nationally, employment grew by 0.14% with an unemployment rate of 4.3%. Jobs and Skills Australia forecasts national employment growth of 6.6% over five years and 13.7% over ten years. Applying these projections to Karnup's employment mix suggests local employment should increase by 5.6% over five years and 12.2% over ten years, though this is a simple extrapolation for illustrative purposes.
Frequently Asked Questions - Employment
Income
The area exhibits notably strong income performance, ranking higher than 70% of areas assessed nationally through AreaSearch analysis
The Karnup SA2 had a median taxpayer income of $60,008 and an average of $74,121 in the latest postcode level ATO data aggregated by AreaSearch for the financial year 2022. This was higher than the national averages of $58,380 (median) and $78,020 (average). Using the Wage Price Index growth rate of 14.2% since financial year 2022, estimated incomes for September 2025 would be approximately $68,529 (median) and $84,646 (average). Census data indicated that household, family, and personal incomes in Karnup were at the 69th percentile nationally. The income distribution showed that 46.4% of residents earned between $1,500 and $2,999, which was similar to the metropolitan region where this bracket represented 32.0%. Residents spent 16.0% of their income on housing costs, but strong earnings placed disposable income at the 73rd percentile nationally. The area's SEIFA income ranking placed it in the fifth decile.
Frequently Asked Questions - Income
Housing
Karnup is characterized by a predominantly suburban housing profile, with ownership patterns similar to the broader region
Karnup's dwelling structures, as per the latest Census, consisted entirely of houses with no other dwellings. This is in contrast to Perth metro's mix of 90.5% houses and 9.6% other dwellings. Home ownership in Karnup was at 17.9%, with mortgaged dwellings at 62.1% and rented ones at 20.0%. The median monthly mortgage repayment in Karnup was $1,857, higher than Perth metro's average of $1,733. The median weekly rent figure for Karnup stood at $370, compared to Perth metro's $330. Nationally, Karnup's mortgage repayments were lower than the Australian average of $1,863, and rents were less than the national figure of $375.
Frequently Asked Questions - Housing
Household Composition
Karnup features high concentrations of family households, with a higher-than-average median household size
Family households constitute 85.6% of all households, including 46.8% couples with children, 26.3% couples without children, and 12.2% single parent families. Non-family households account for 14.4%, with lone person households at 13.1% and group households comprising 1.1%. The median household size is 3.0 people, larger than the Greater Perth average of 2.6.
Frequently Asked Questions - Households
Local Schools & Education
Karnup performs slightly above the national average for education, showing competitive qualification levels and steady academic outcomes
The area's university qualification rate is 13.2%, significantly lower than Australia's average of 30.4%. Bachelor degrees are the most common at 8.7%, followed by postgraduate qualifications (2.5%) and graduate diplomas (2.0%). Vocational credentials are prevalent, with 49.2% of residents aged 15+ holding them, including advanced diplomas (12.6%) and certificates (36.6%). Educational participation is high at 32.0%, with 13.2% in primary education, 9.2% in secondary education, and 2.9% pursuing tertiary education.
Educational participation is notably high, with 32.0% of residents currently enrolled in formal education. This includes 13.2% in primary education, 9.2% in secondary education, and 2.9% pursuing tertiary education.
Frequently Asked Questions - Education
Schools Detail
Nearby Services & Amenities
Transport
Transport servicing is low compared to other areas nationally based on assessment of service frequency, route connectivity and accessibility
Transport analysis indicates one active public transport stop operating within Karnup. This stop services a mix of bus routes, totalling one individual route that provides 412 weekly passenger trips. Transport accessibility is rated as limited, with residents typically located 1211 meters from the nearest stop.
Service frequency averages 58 trips per day across all routes, equating to approximately 412 weekly trips per individual stop.
Frequently Asked Questions - Transport
Transport Stops Detail
Health
Karnup's residents boast exceedingly positive health performance metrics with younger cohorts in particular seeing very low prevalence of common health conditions
Health outcomes data shows excellent results across Karnup, with younger cohorts experiencing particularly low prevalence of common health conditions.
Approximately 56% (~1,561 people) of the total population has private health cover. The most prevalent medical conditions in the area are mental health issues and asthma, affecting 7.8% and 7.2% of residents respectively. A significant majority, 74.8%, report being completely clear of medical ailments compared to 68.5% across Greater Perth. Karnup has a lower proportion of seniors aged 65 and over at 10.7% (296 people) compared to Greater Perth's 15.6%. Despite this, health outcomes among seniors in Karnup are above average and require more attention than the broader population.
Frequently Asked Questions - Health
Cultural Diversity
In terms of cultural diversity, Karnup records figures broadly comparable to the national average, as found in AreaSearch's assessment of a number of language and cultural background related metrics
Karnup's cultural diversity aligns with the broader area, with 83.5% citizens, 72.6% born in Australia, and 93.9% speaking English only at home. Christianity is the dominant religion, comprising 36.3%. The 'Other' category is slightly higher than Greater Perth's average, 0.8% vs 0.7%.
Top ancestry groups are English (34.4%), Australian (28.3%), and Scottish (6.2%). Some ethnicities show variations: Maori (2.3%, compared to regional 2.0%), South African (1.9%, vs 1.1%), New Zealand (1.5%, vs 1.2%).
Frequently Asked Questions - Diversity
Age
Karnup hosts a very young demographic, ranking in the bottom 10% of areas nationwide
Karnup's median age is 30 years, which is younger than the Greater Perth average of 37 and the Australian median of 38. Compared to Greater Perth, Karnup has a higher percentage of residents aged 5-14 (16.9%) but fewer residents aged 55-64 (8.4%). Post-2021 Census data shows that the population aged 15-24 grew from 11.6% to 13.5%, while those aged 35-44 increased from 12.3% to 14.0%. Conversely, the percentage of residents aged 25-34 declined from 19.8% to 16.9%, and the 0-4 age group decreased from 10.3% to 8.9%. Demographic modeling indicates that Karnup's age profile will change significantly by 2041, with the 75-84 age cohort projected to expand substantially from 100 to 211 people (an increase of 110 people or 111%). Conversely, the number of residents aged 0-4 is expected to decrease.


