Chart Color Schemes
This analysis uses ABS Statistical Areas Level 2 (SA2) boundaries, which can materially differ from Suburbs and Localities (SAL) even when sharing similar names.
SA2 boundaries are defined by the Australian Bureau of Statistics and are designed to represent communities for statistical reporting (e.g., census and ERP).
Suburbs and Localities (SAL) represent commonly-used suburb/locality names (postal-style areas) and may use different geographic boundaries. For comprehensive analysis, consider reviewing both boundary types if available.
est. as @ -- *
ABS ERP | -- people | --
2021 Census | -- people
Sales Activity
Curious about local property values? Filter the chart to assess the volume and appreciation (including resales) trends and regional comparisons, or scroll to the map below view this information at an individual property level.
Find a Recent Sale
Sales Detail
Population
Population growth drivers in Mandurah are strong compared to national averages based on AreaSearch's ranking of recent, and medium to long-term trends
Mandurah's population was approximately 11,749 as of November 2025. This figure represents an increase of 1,493 people since the 2021 Census, which reported a population of 10,256. The estimated resident population in June 2024 was 11,508, with an additional 112 validated new addresses recorded since the Census date. This results in a population density ratio of 1,398 persons per square kilometer, higher than the average seen across national locations assessed by AreaSearch. Mandurah's growth rate of 14.6% since the 2021 census exceeded both the national average (8.9%) and state averages, positioning it as a growth leader in the region. Interstate migration contributed approximately 51.1% of overall population gains during recent periods.
AreaSearch is adopting ABS/Geoscience Australia projections for each SA2 area, released in 2024 with a base year of 2022. For areas not covered by this data and to estimate growth post-2032, AreaSearch uses growth rates by age cohort provided by the ABS in its latest Greater Capital Region projections (released in 2023, based on 2022 data). Looking ahead, Mandurah is projected to have above median population growth for national statistical areas. By 2041, the area is expected to grow by 2,472 persons, reflecting a total gain of 19.0% over the 17-year period based on the latest annual ERP population numbers.
Frequently Asked Questions - Population
Development
The level of residential development activity in Mandurah was found to be higher than 90% of real estate markets across the country
Mandurah has received approximately 61 dwelling approvals annually over the past five financial years, totalling 309 homes. In FY26 so far, 33 approvals have been recorded. On average, 5.2 new residents arrive per year for each dwelling constructed between FY21 and FY25. This supply lags demand, indicating heightened buyer competition and pricing pressures.
New properties are constructed at an average value of $407,000, reflecting a focus on the premium segment. In FY26, $43.7 million in commercial approvals have been registered, demonstrating high local commercial activity. Compared to Greater Perth, Mandurah has 53.0% less construction per person. This limited supply supports stronger demand and values for established properties.
Recent construction consists of 51.0% detached dwellings and 49.0% attached dwellings, offering a mix of housing options across price brackets. There are approximately 115 people per dwelling approval in Mandurah. By 2041, Mandurah is forecasted to gain 2,231 residents. Building activity is keeping pace with growth projections, but buyers may face increased competition as the population grows.
Frequently Asked Questions - Development
Infrastructure
Mandurah has limited levels of nearby infrastructure activity, ranking in the 13thth percentile nationally
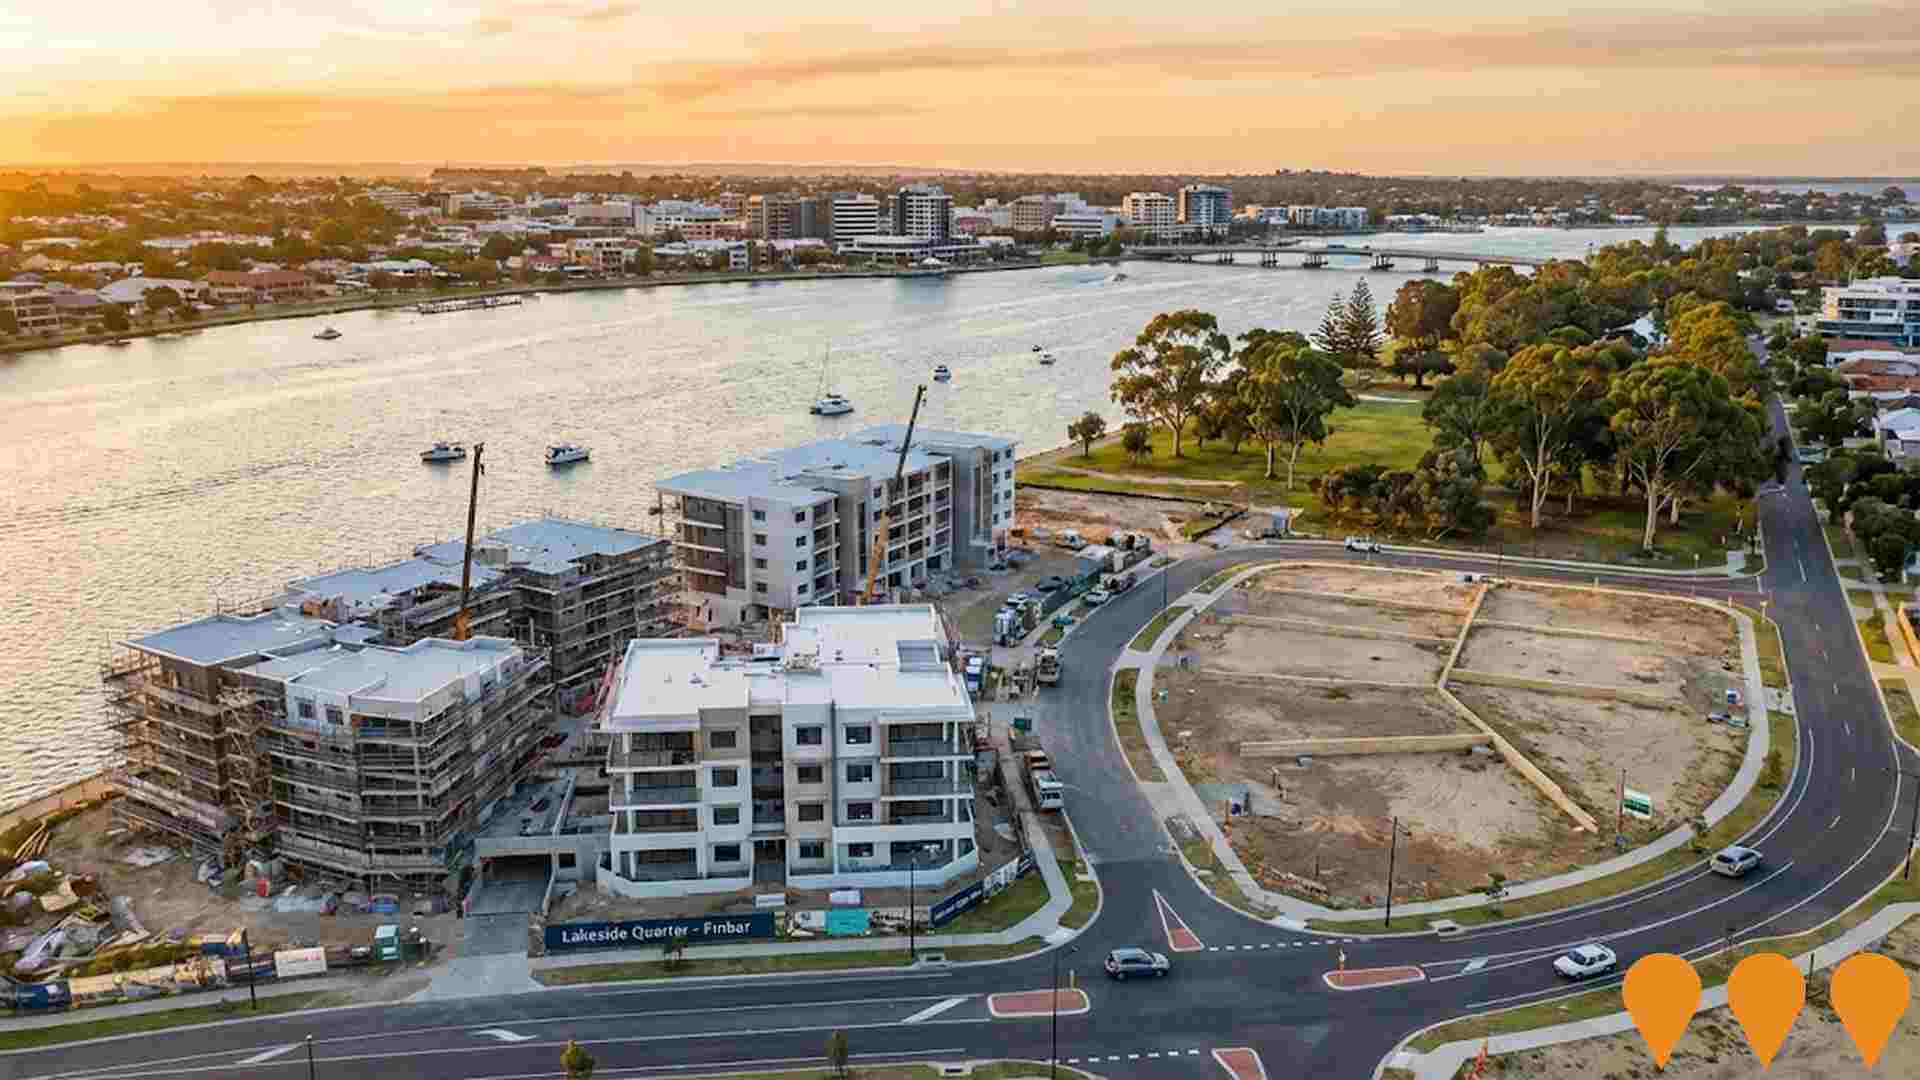
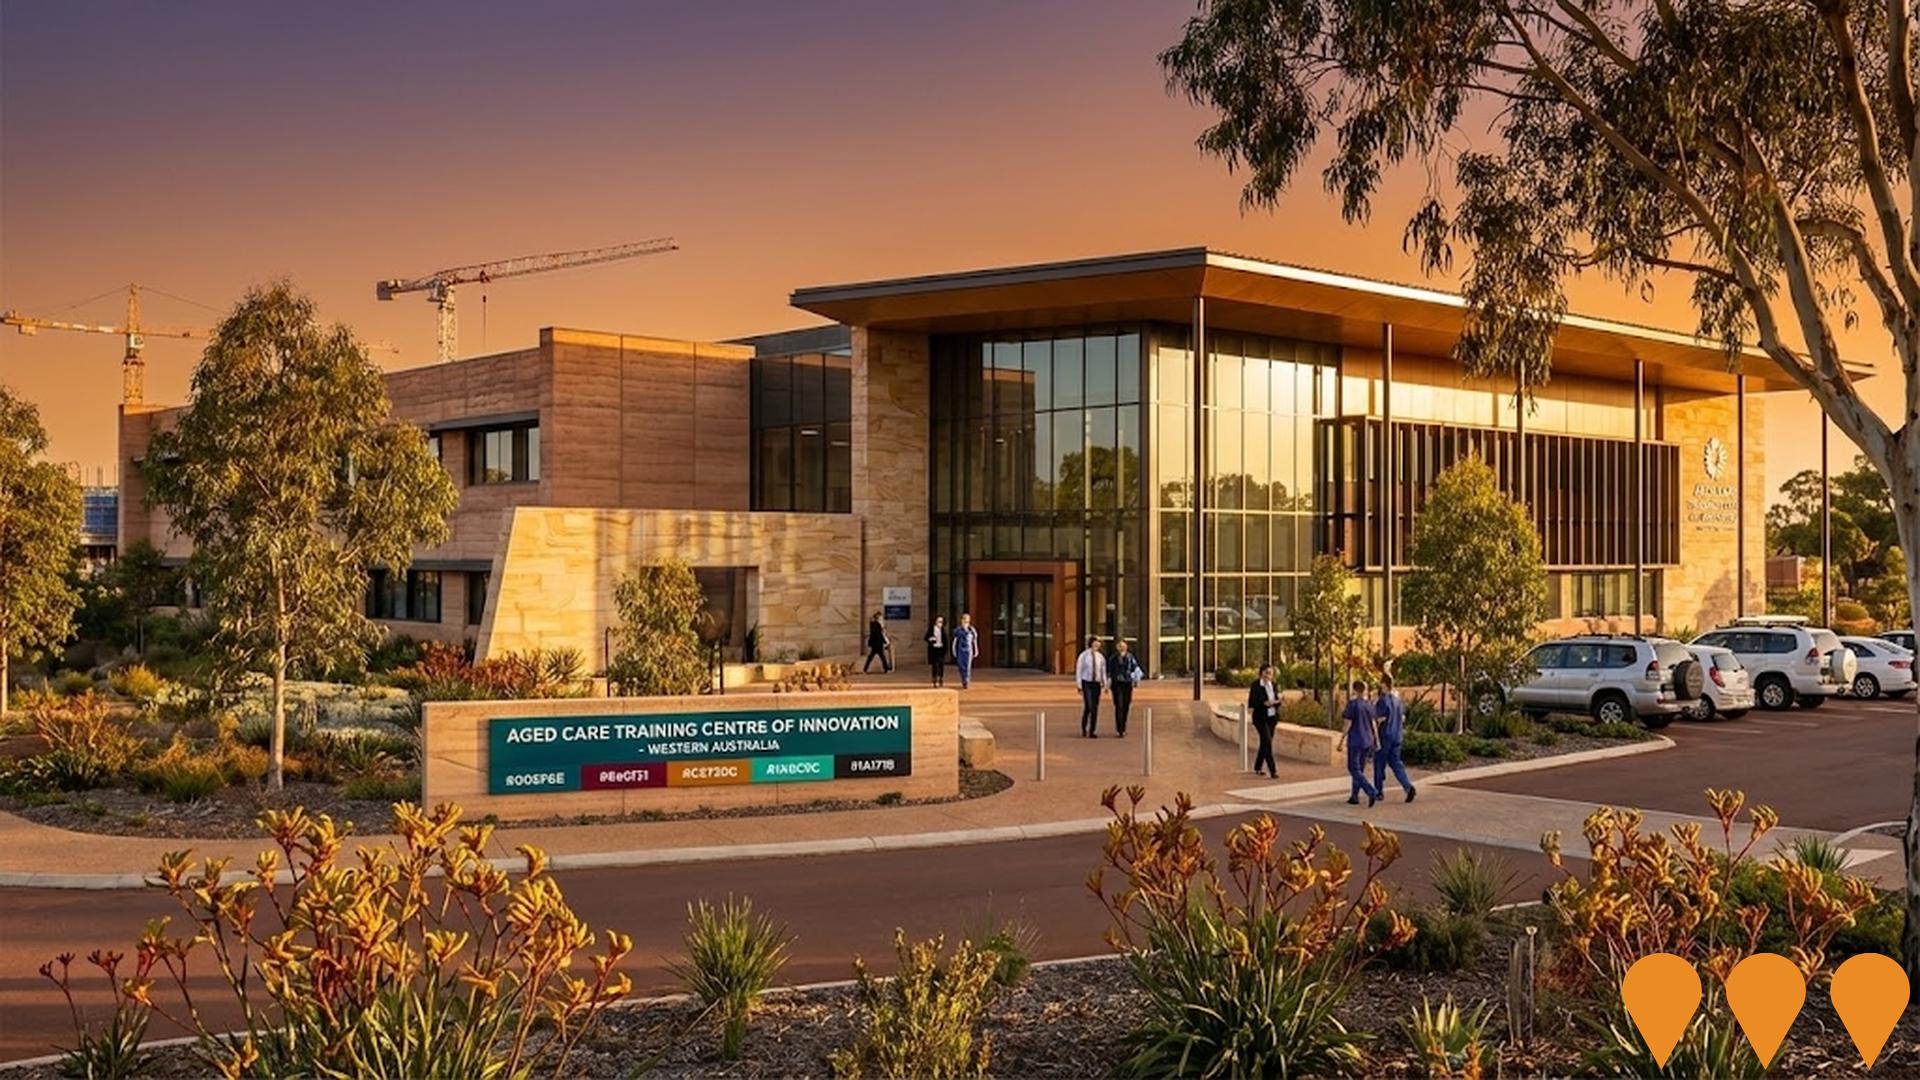
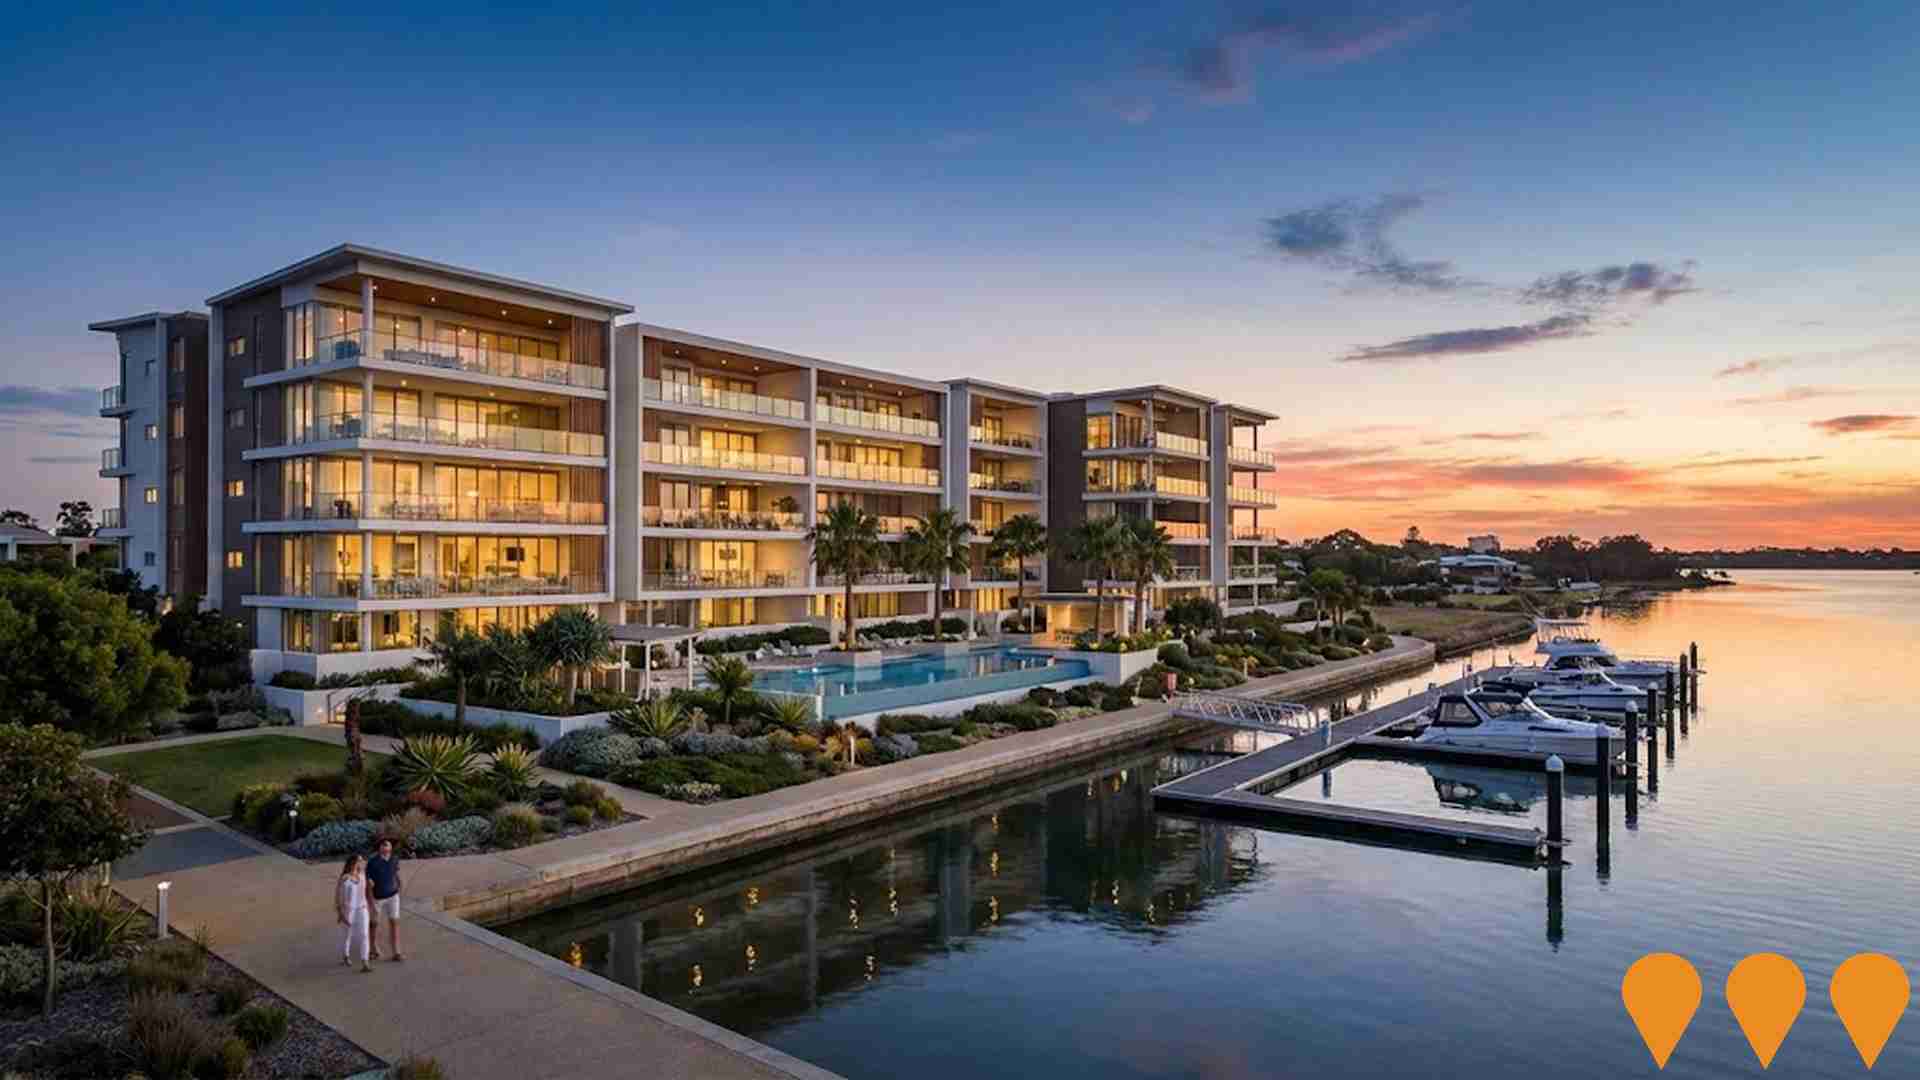
Changes in local infrastructure significantly affect an area's performance. AreaSearch has identified 26 projects that could impact the area. Notable ones include Peel Health Campus Redevelopment, Lakeside Quarter, The Bridgewater Mandurah, and Aged Care Training Centre of Innovation. Relevant projects are listed below.
Professional plan users can use the search below to filter and access additional projects.
INFRASTRUCTURE SEARCH
 Denotes AI-based impression for illustrative purposes only, not to be taken as definitive under any circumstances. Please follow links and conduct other investigations from the project's source for actual imagery. Developers and project owners wishing us to use original imagery please Contact Us and we will do so.
Frequently Asked Questions - Infrastructure
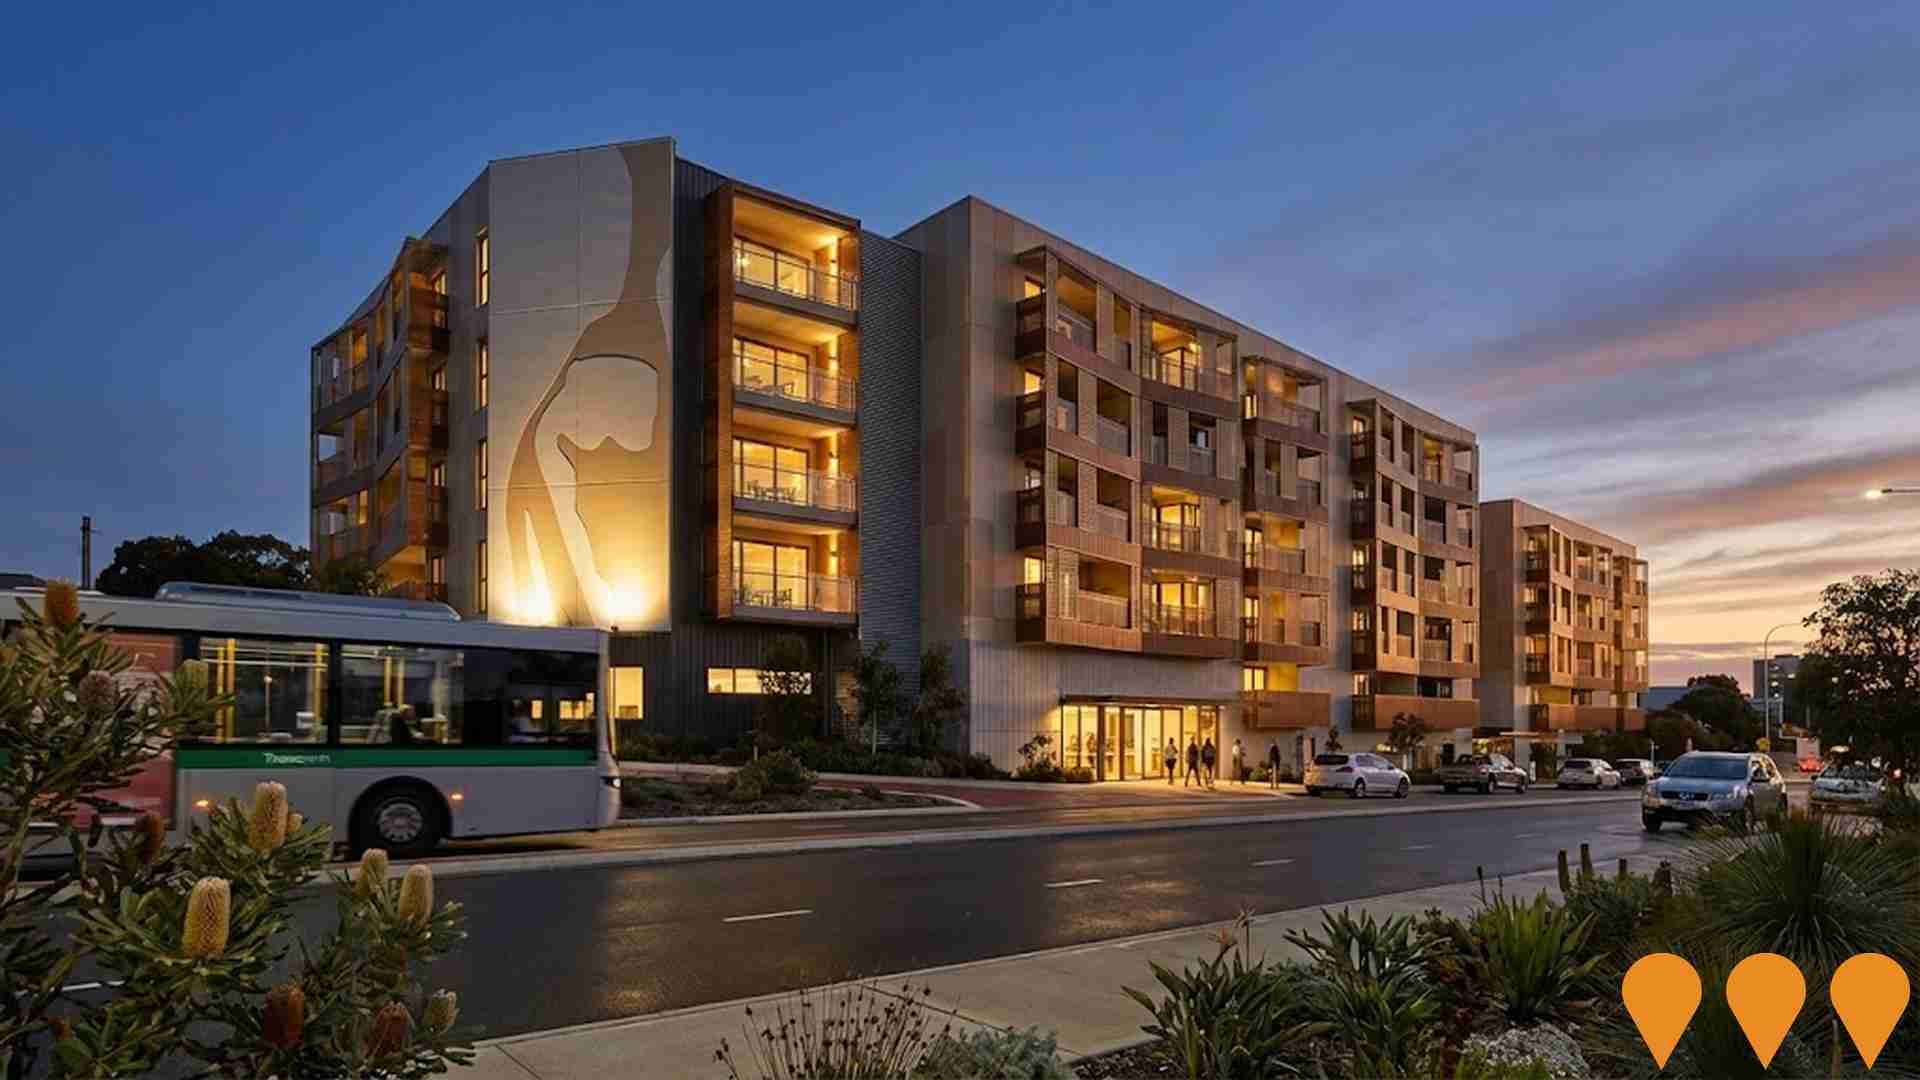
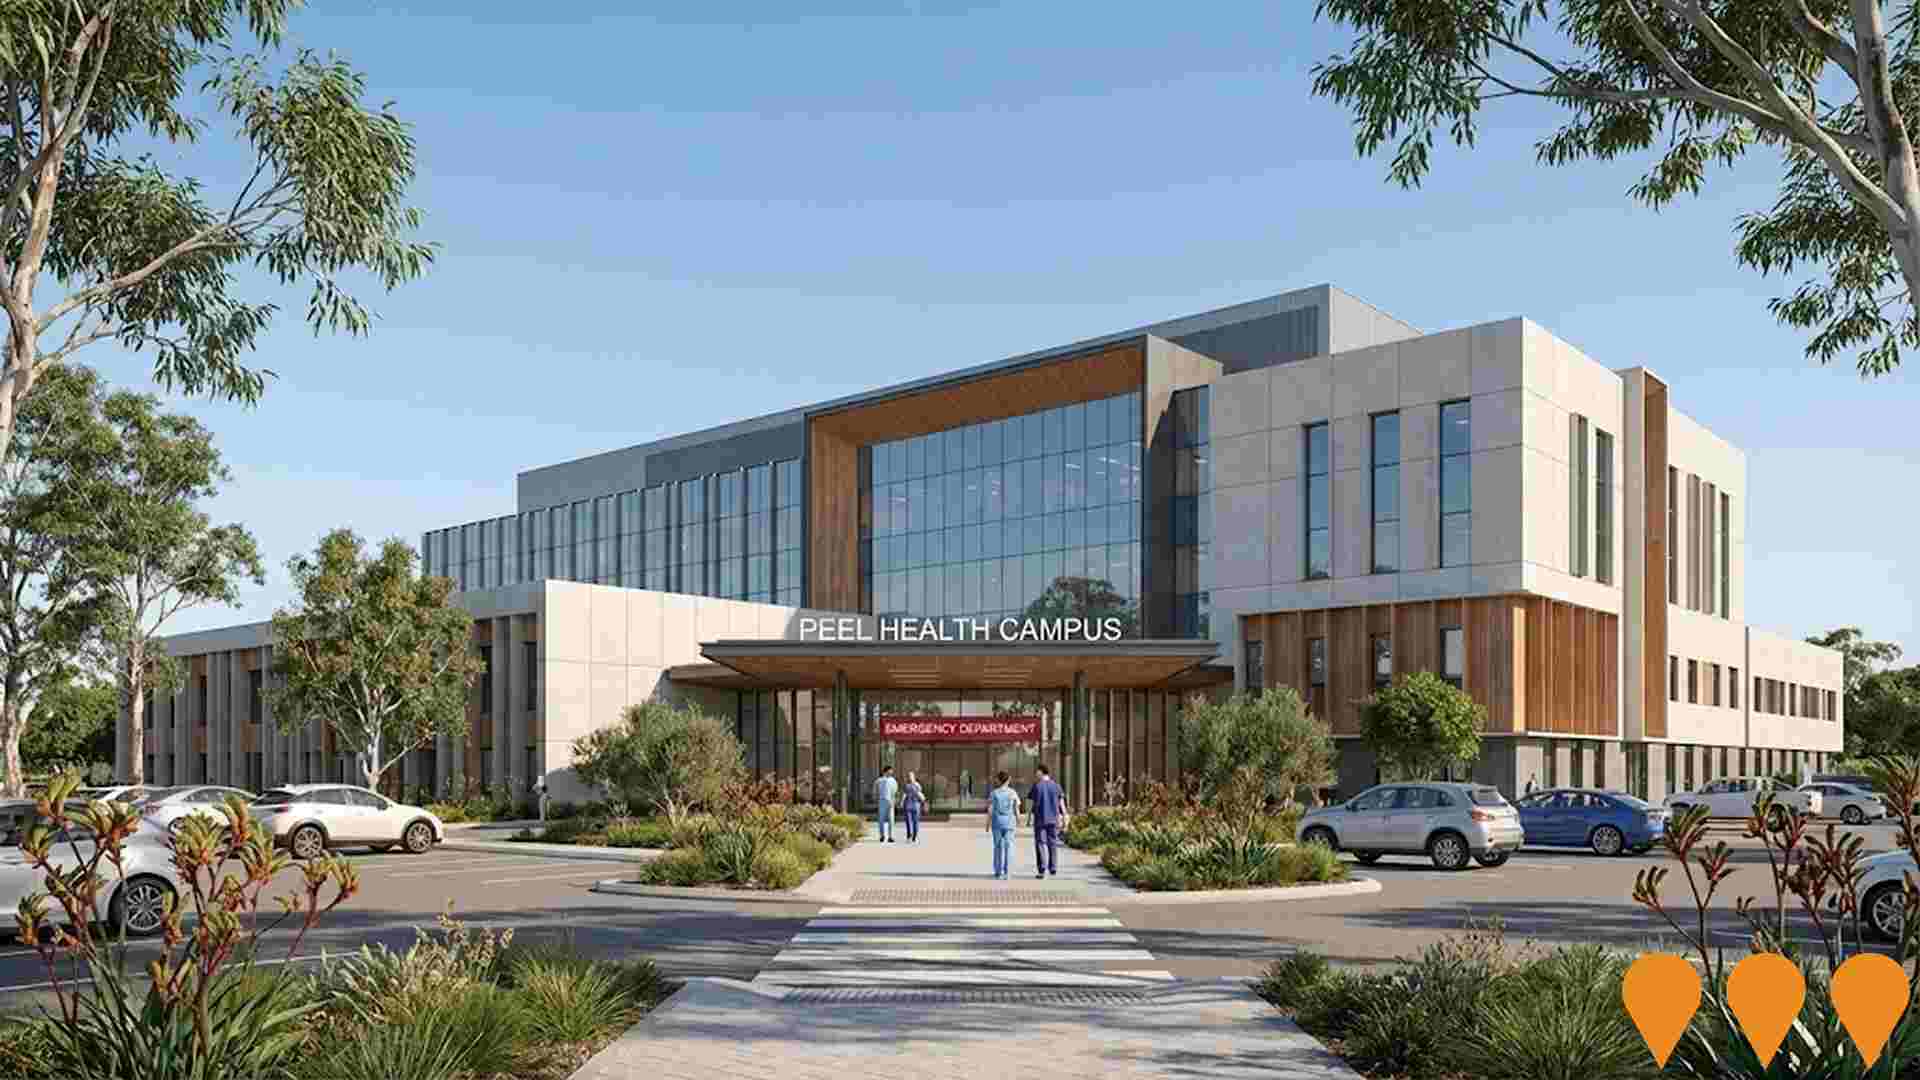
Peel Health Campus Redevelopment
Major redevelopment of Peel Health Campus, including construction of a new public hospital on the existing site to deliver expanded and modernised services. The project scope includes an expanded Emergency Department, a dedicated Mental Health Emergency Centre with 20 beds, an additional operating theatre, 30 new inpatient beds, 12 chemotherapy chairs, and 15 palliative care hospice beds. The hospital officially transitioned to public hands in August 2024. Forward works, including car parking and a new Central Energy Plant shell, have been awarded to Devlyn Australia Pty Ltd and are commencing. Main works construction is expected to begin in June 2026, subject to approvals, and the hospital will remain operational throughout.
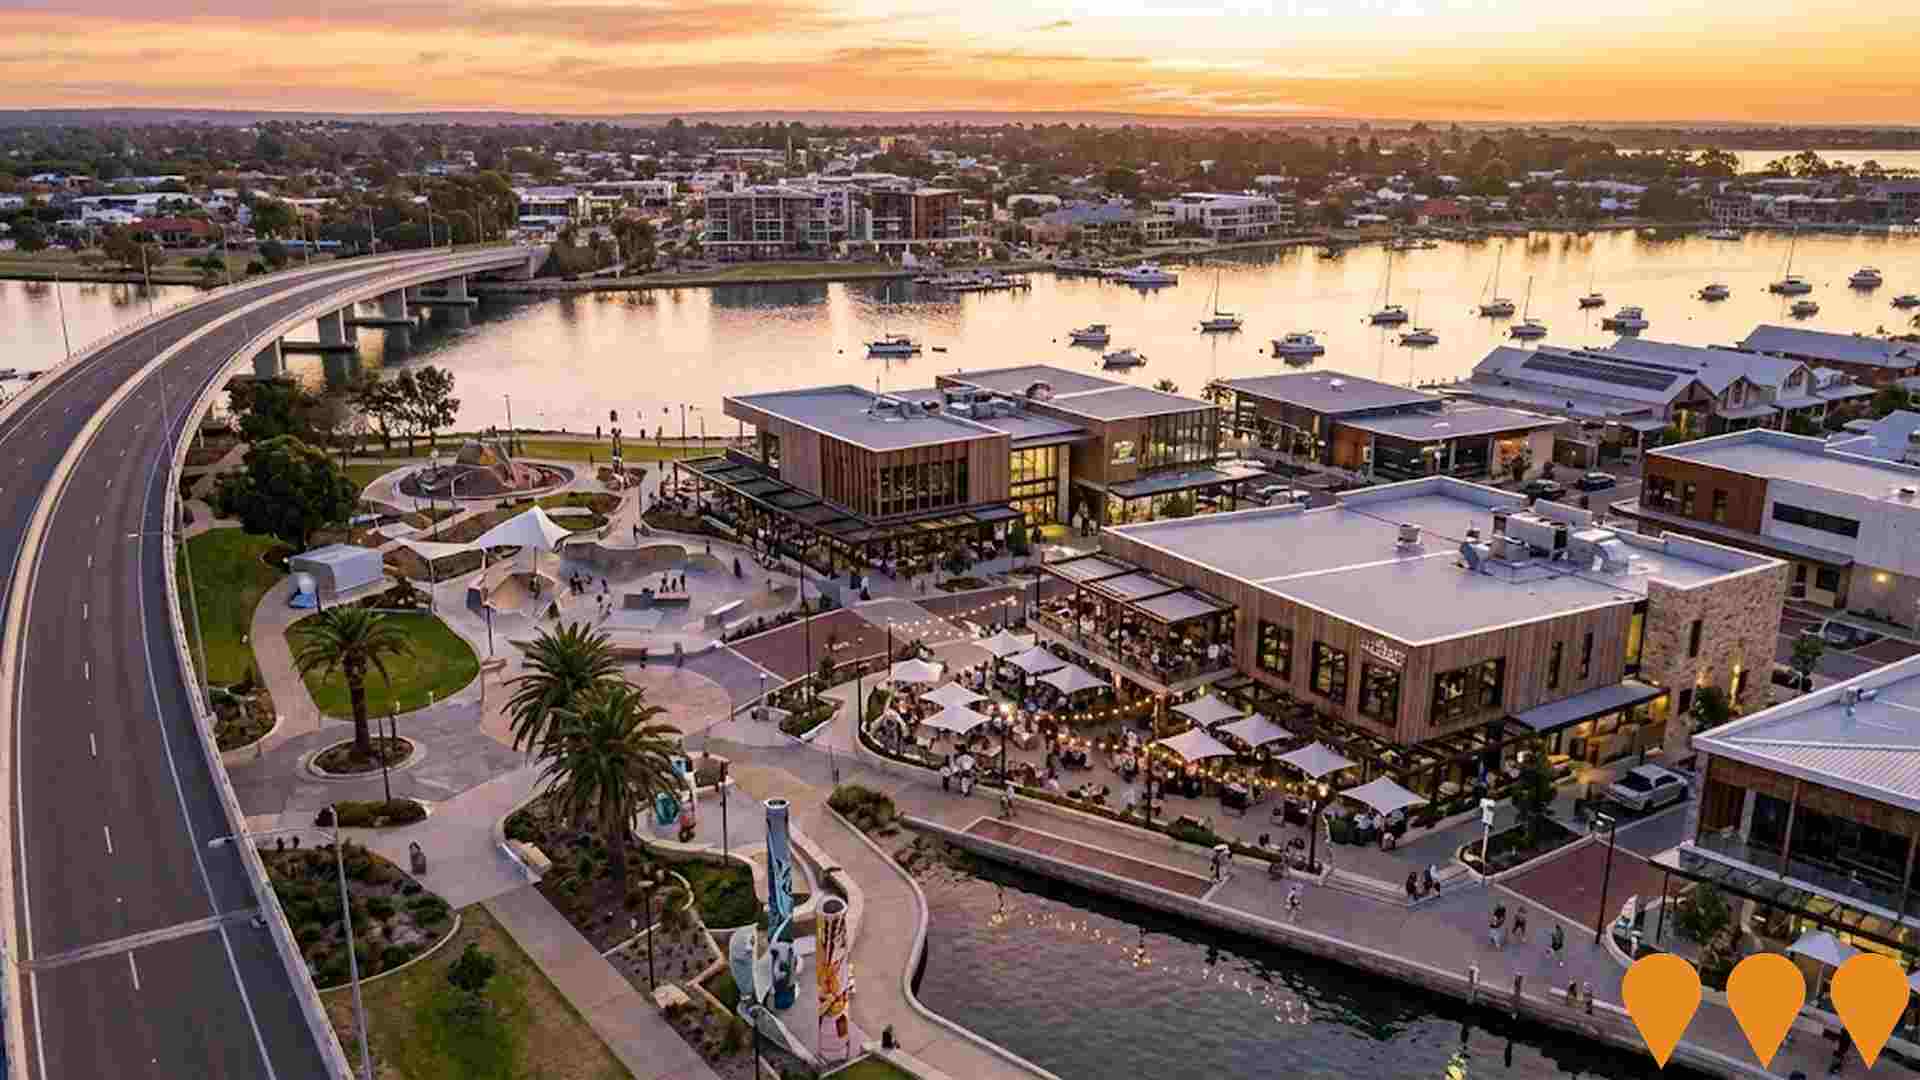
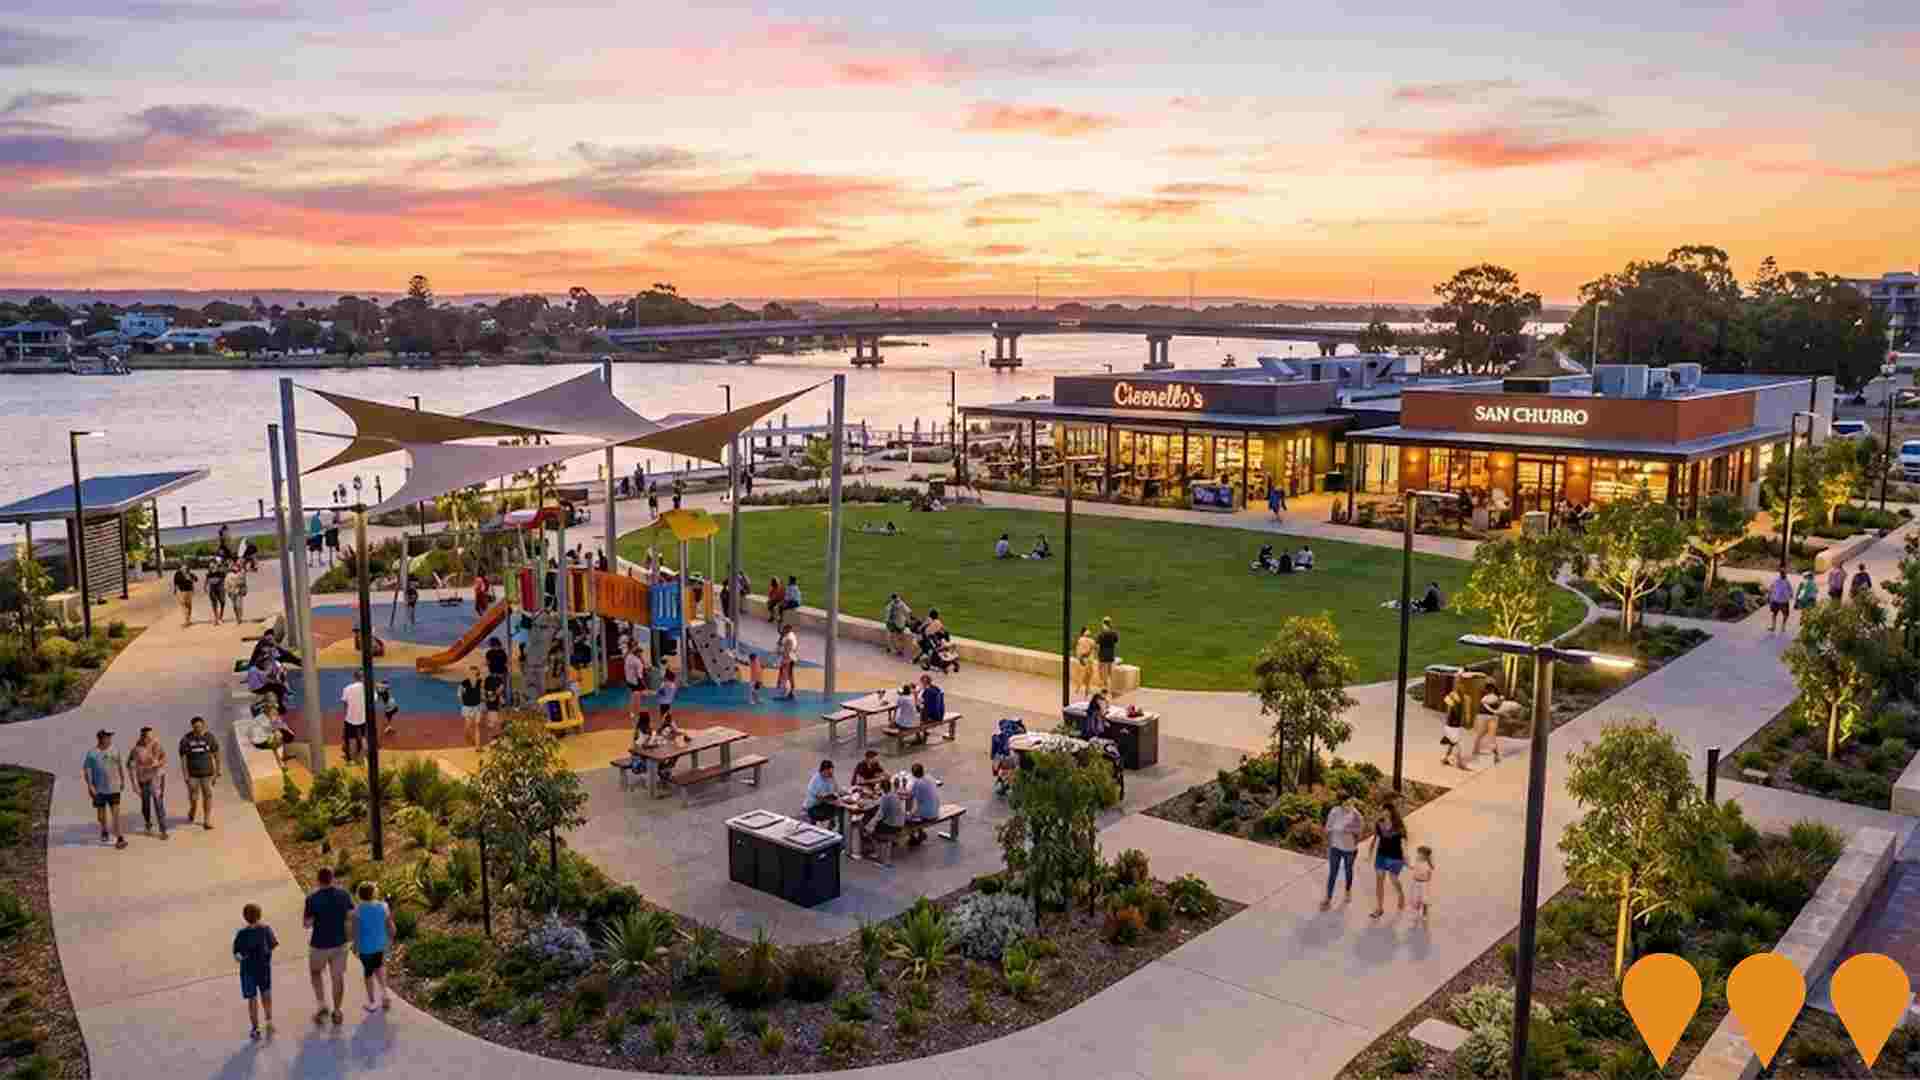
Eastern Foreshore North and Central Renewal
Renewal of the central and northern areas of the Eastern Foreshore, part of the wider Mandurah Waterfront Project, to create safe, accessible, and inclusive spaces. The upgrade includes a new fully-fenced, all-abilities playground, upgraded lighting, new barbecues, picnic tables and seating, widened paved pathways, increased shade, and a central grassed area for recreation and events. The project was completed in early 2025 for the annual Crab Fest.
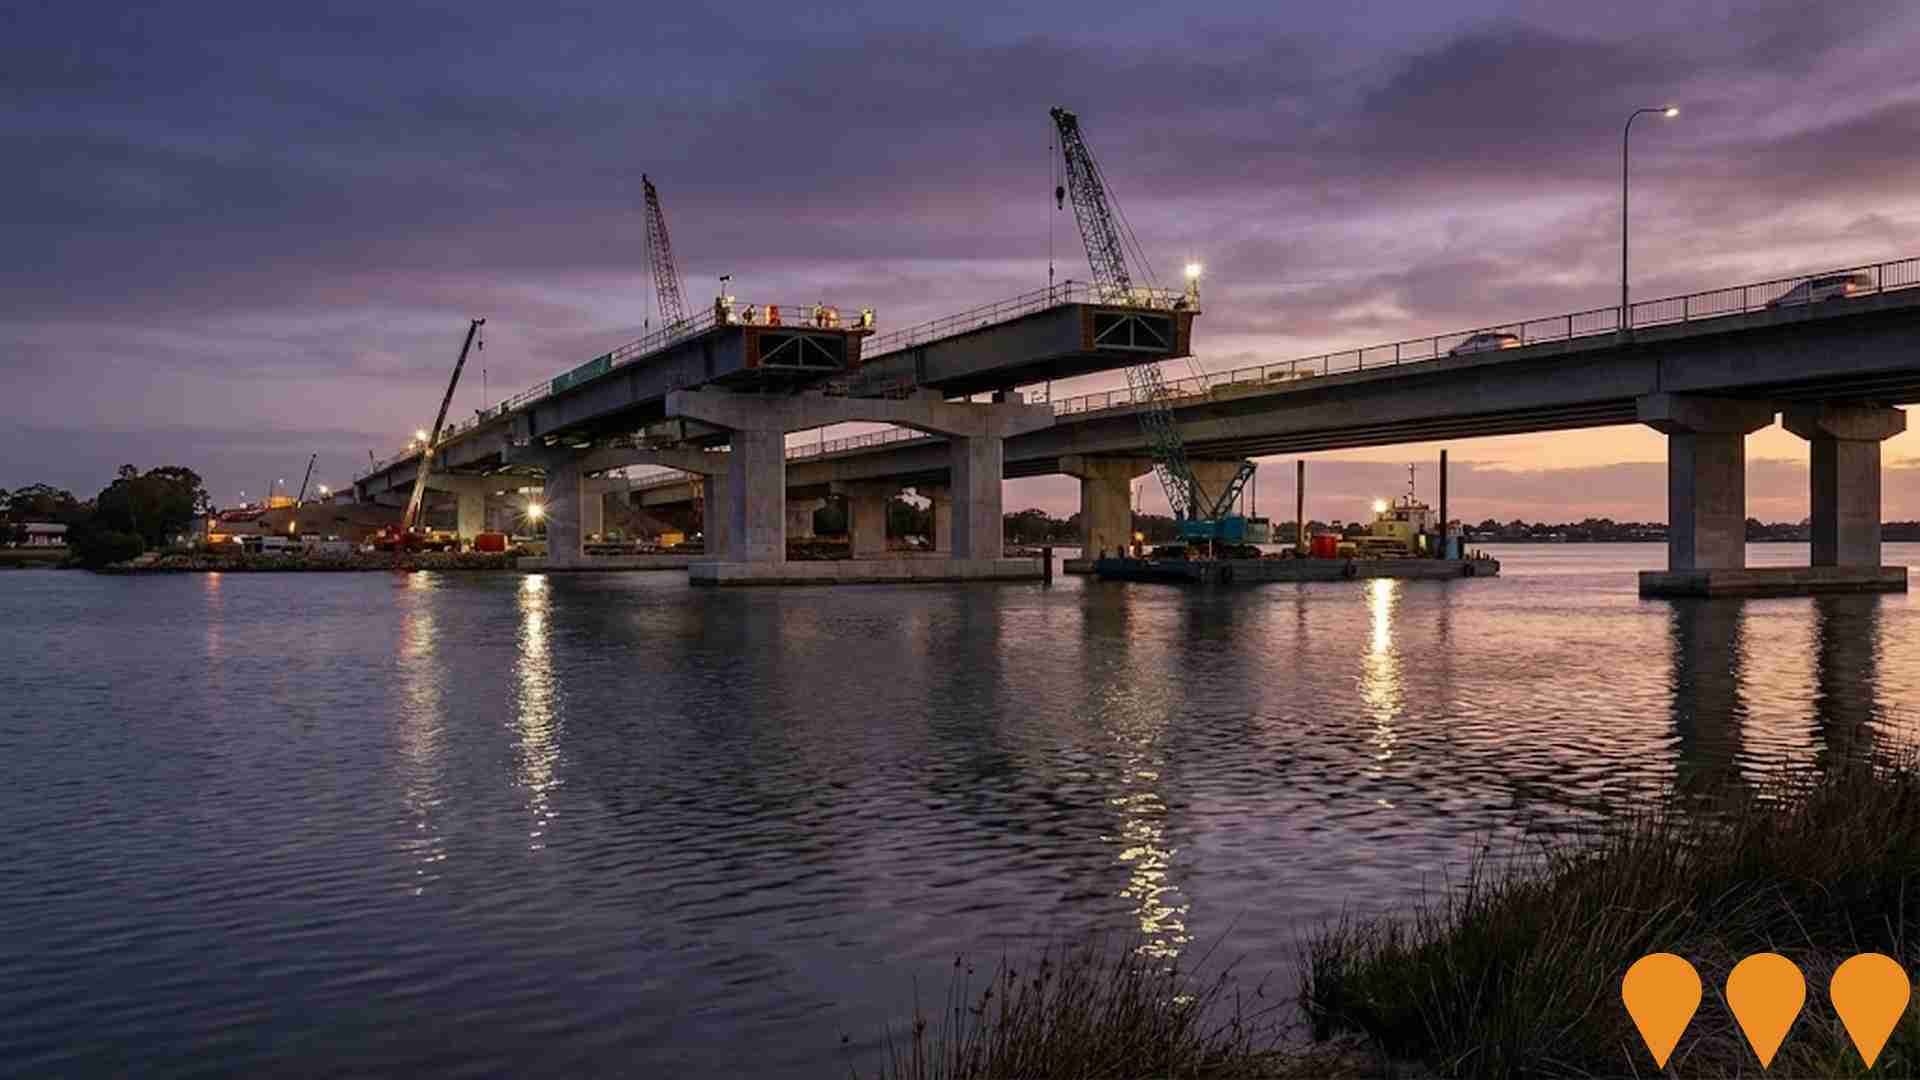
Mandurah Estuary Bridge Duplication
Construction of a second two-lane bridge on the south side of the existing Mandurah Estuary Bridge to reduce congestion and improve road user safety for over 33,000 daily vehicles. The $148.8 million project will deliver a new two-lane bridge with provision for a future third lane, a 4-metre-wide accessible shared path, an accessible fishing platform, programmable feature lighting, and urban design elements. Construction is being carried out using an incremental launch method for the bridge segments.
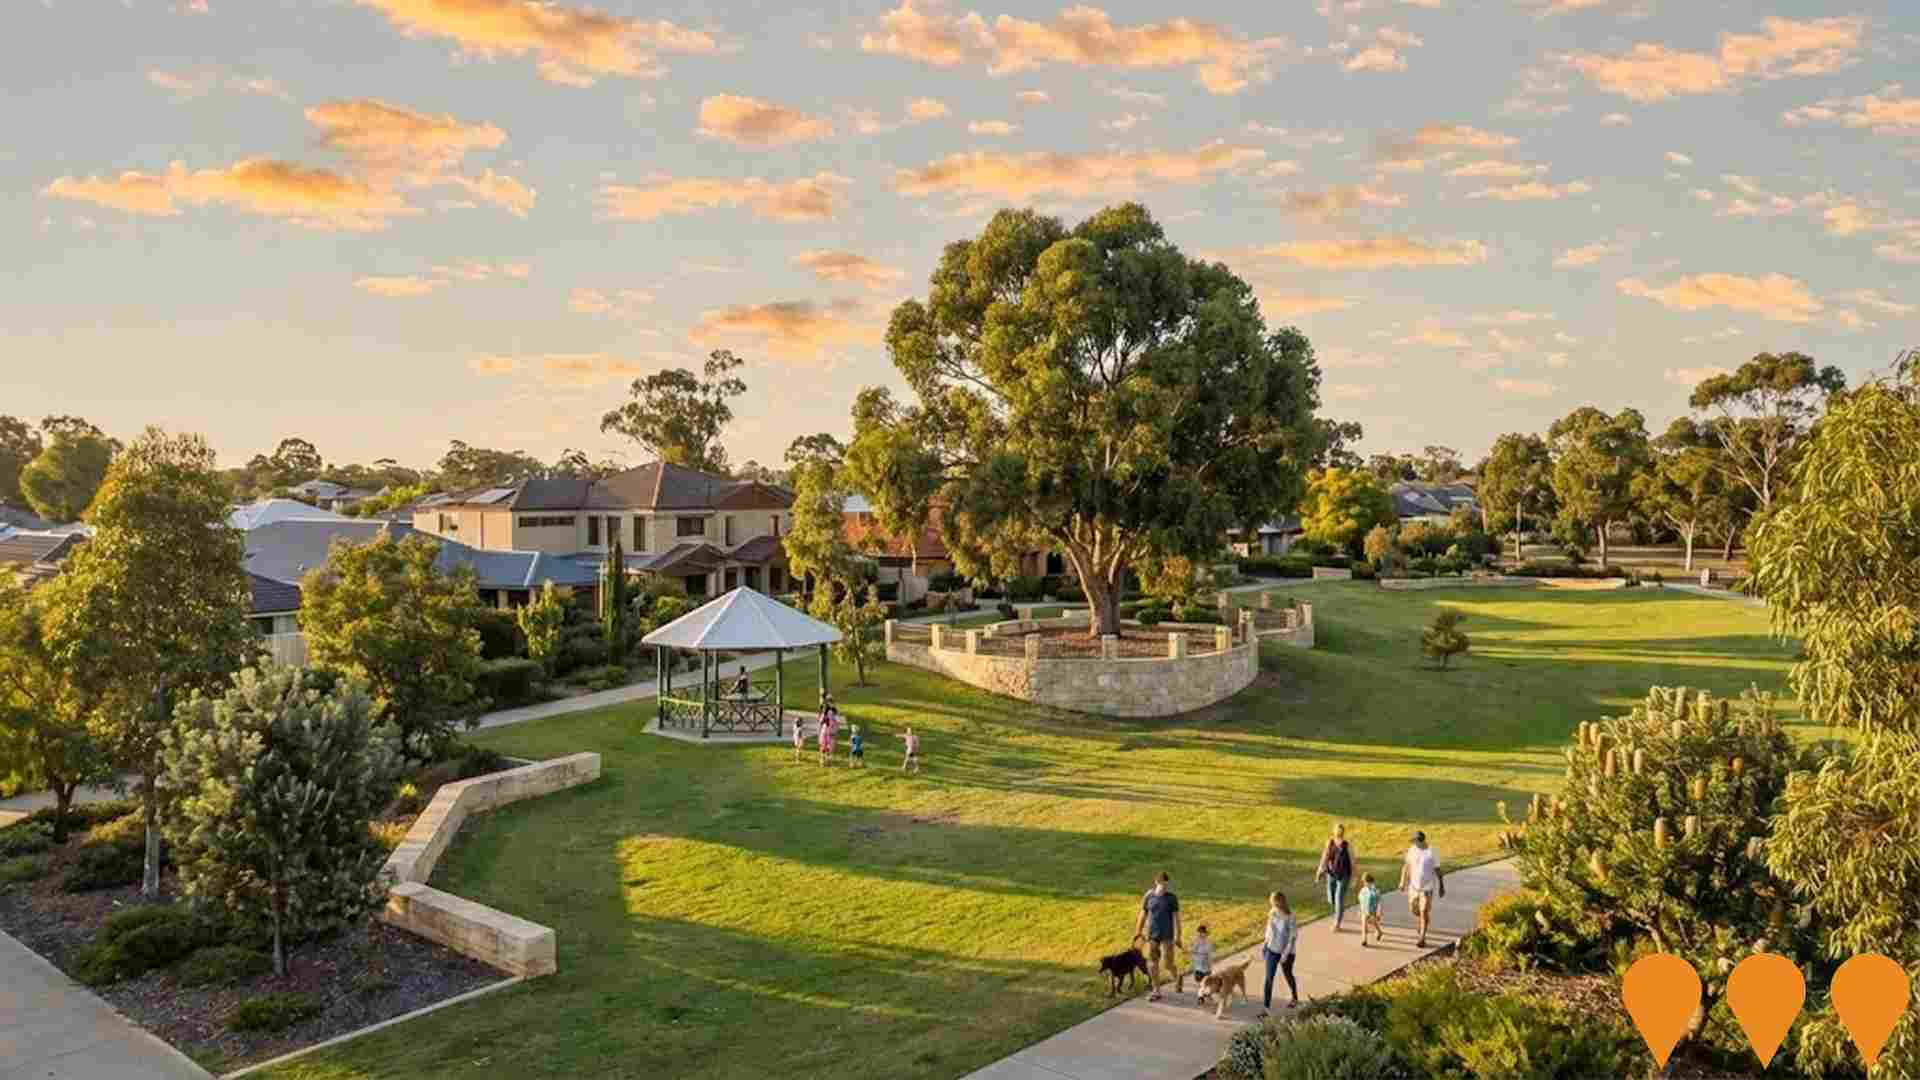
Meadow Springs Master Plan Redevelopment
Comprehensive master plan redevelopment of Meadow Springs area including residential subdivisions, commercial precincts, recreational facilities, and infrastructure upgrades. Major urban renewal project transforming the northern Mandurah suburbs.
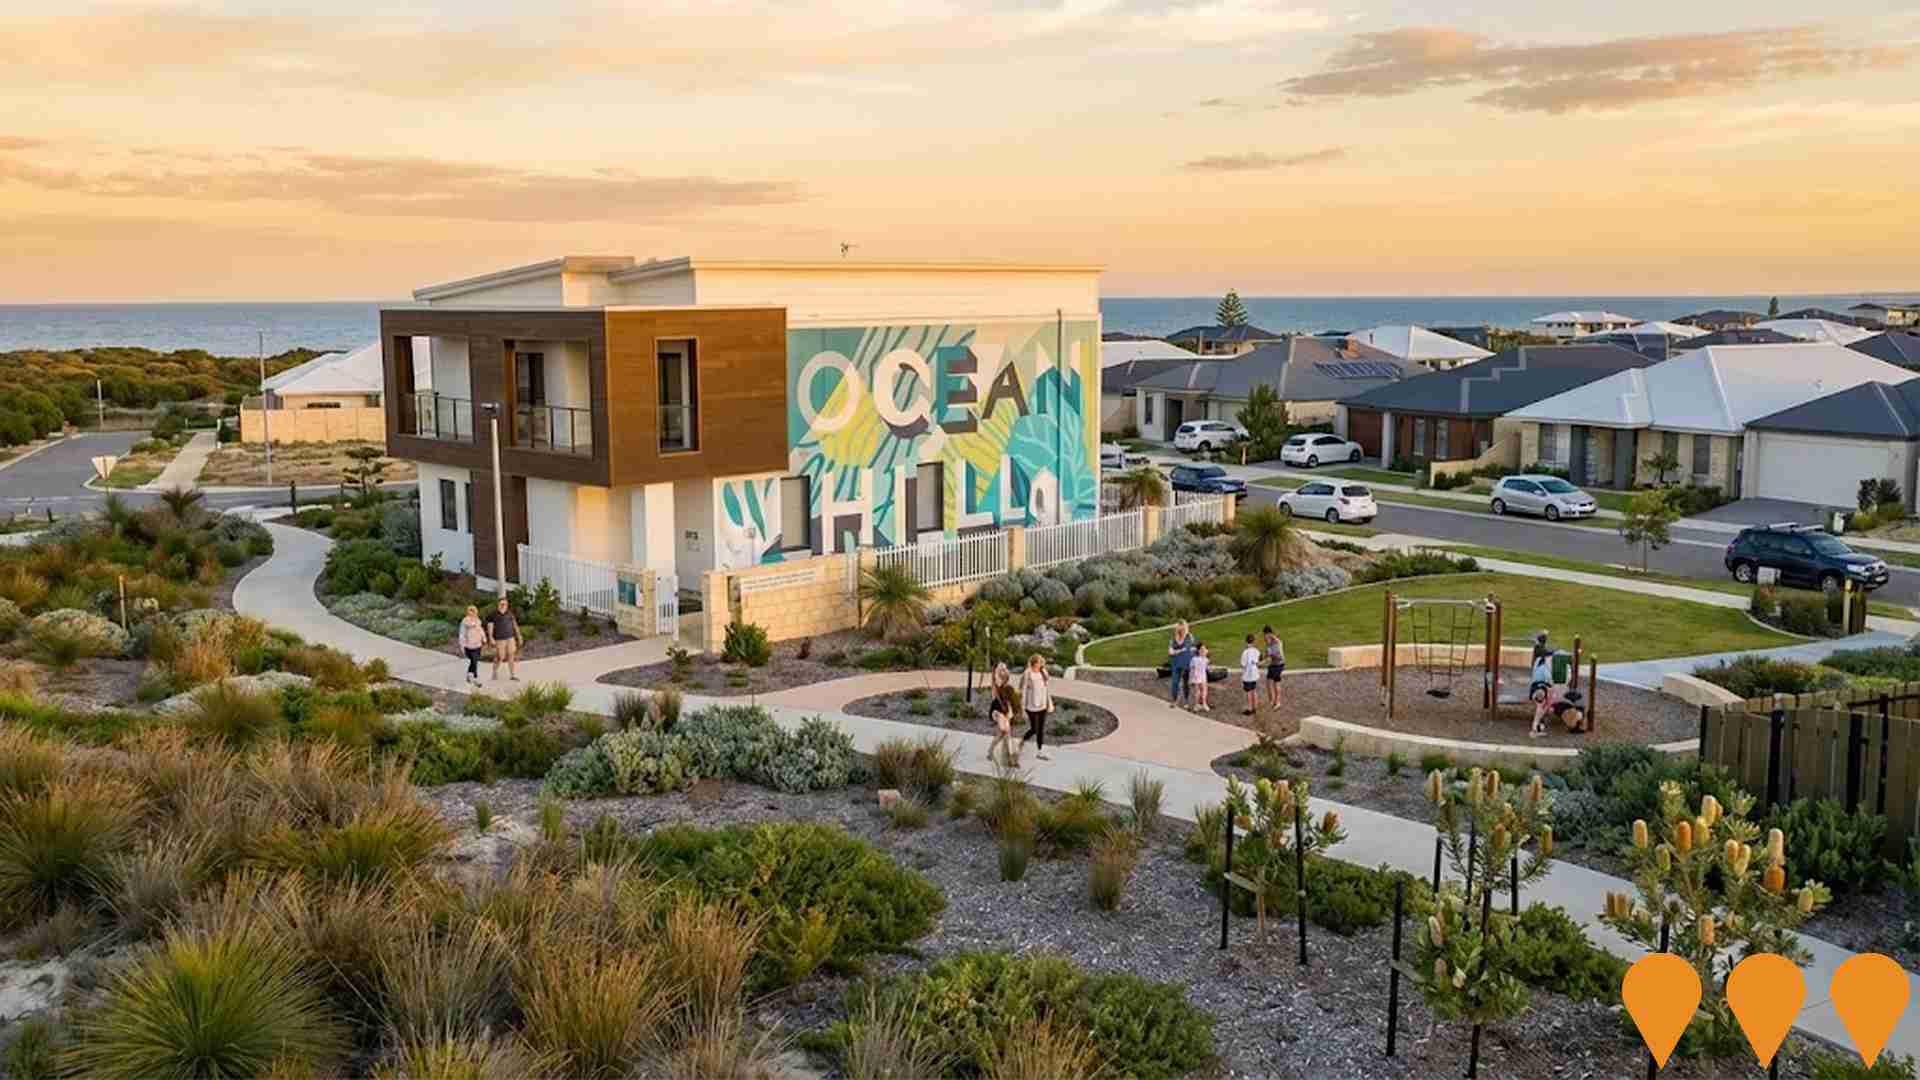
Ocean Hill Estate
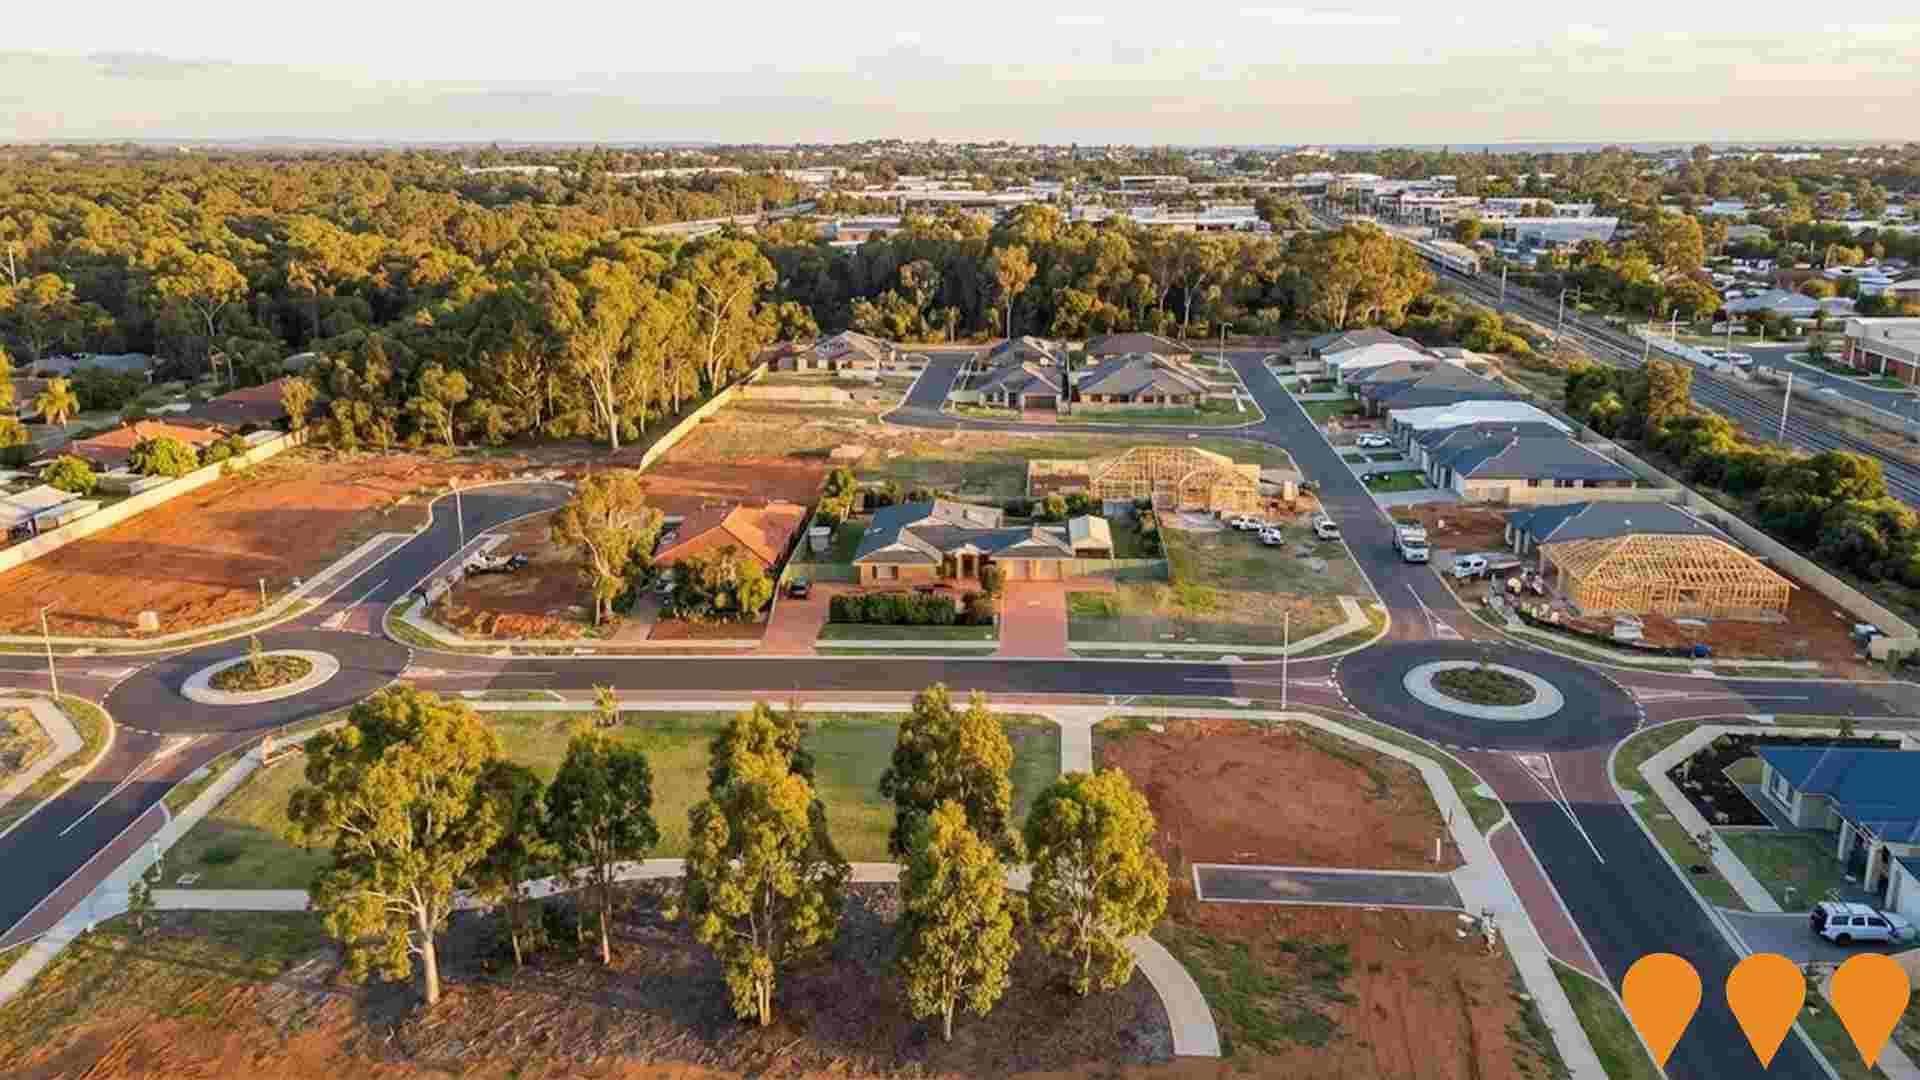
Master planned residential estate in North Lakelands offering modern family homes in a coastal setting. Located within walking distance of Madora Beach and Lakelands Shopping Centre. Features 1,900 lots across 23 stages when completed, with CP Group and Satterley Property Group as developers.
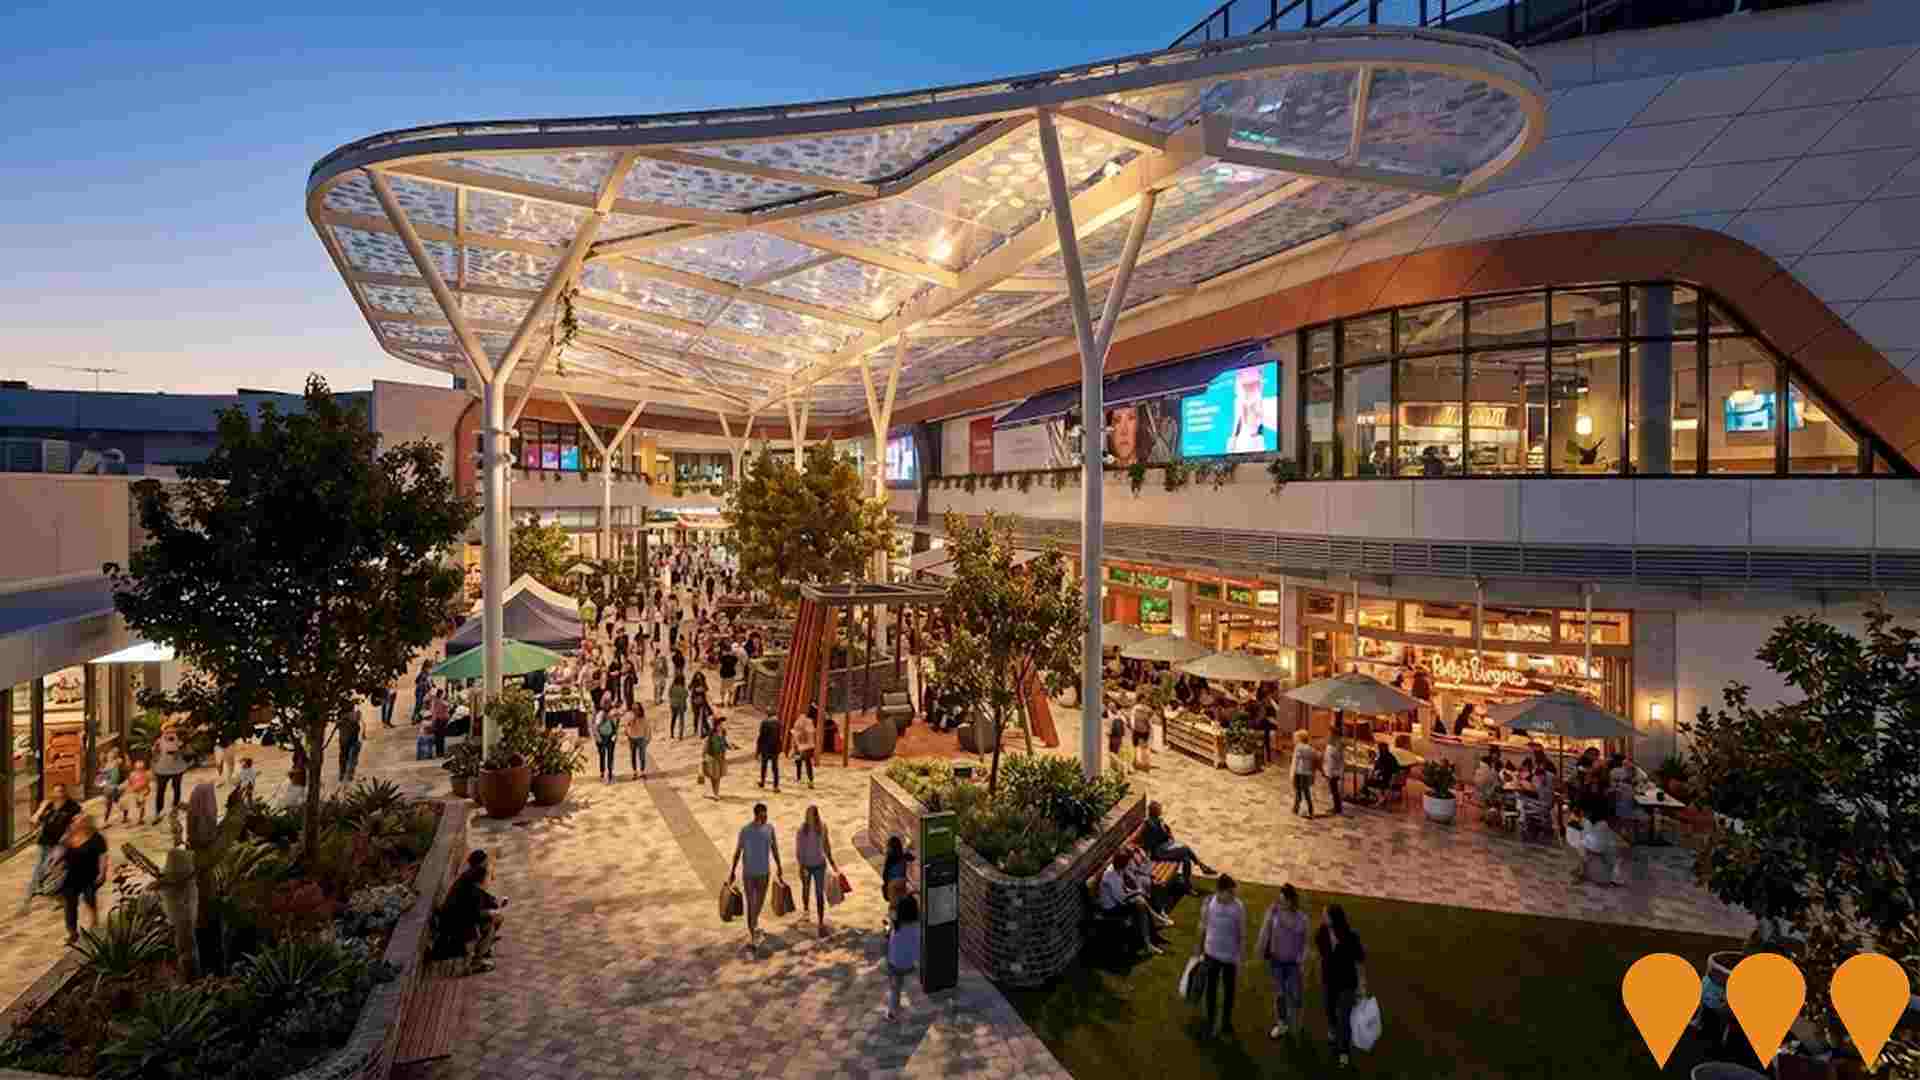
Mandurah Forum Shopping Centre Redevelopment
Major $350 million shopping centre redevelopment and expansion almost doubling the existing size from 38,535m2 to approximately 63,000m2 of retail floor space. Features over 220 stores including David Jones, Target, Kmart, Big W, Coles and Woolworths, plus new multi-deck car park.
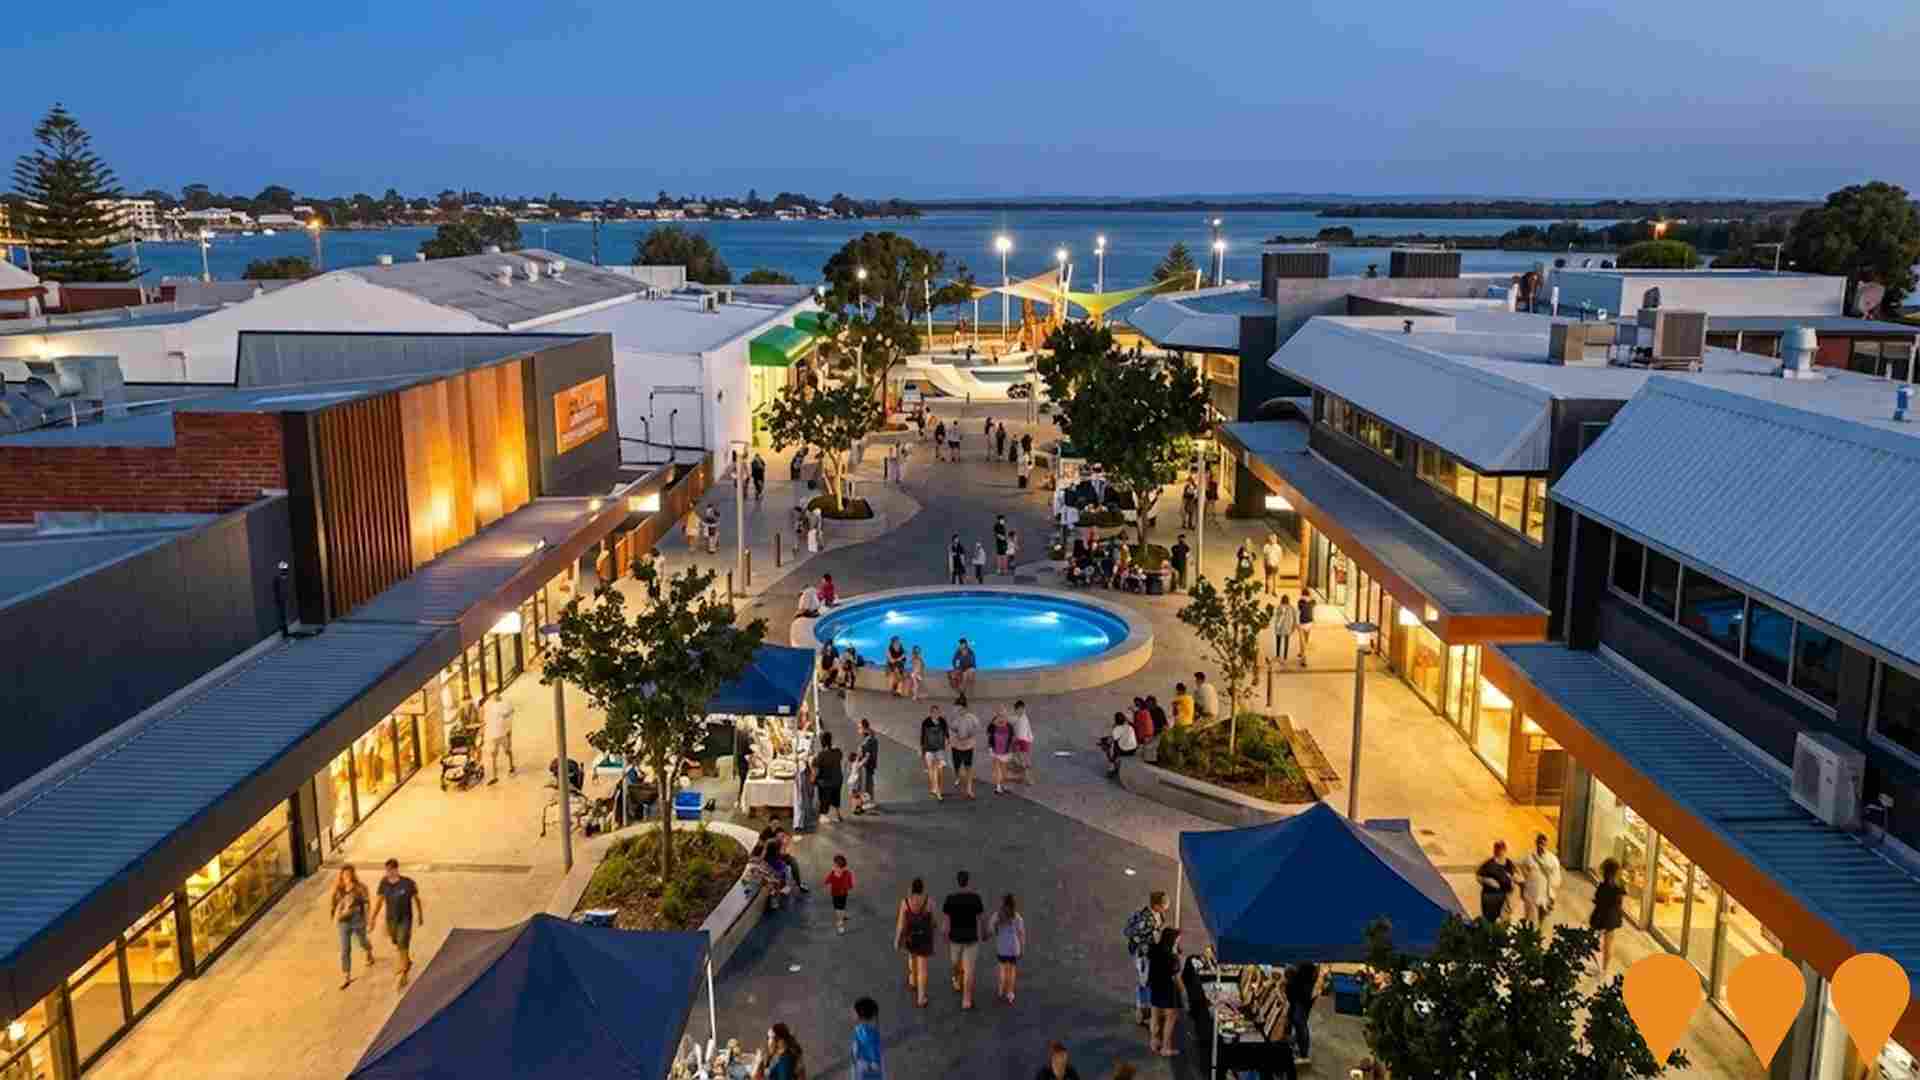
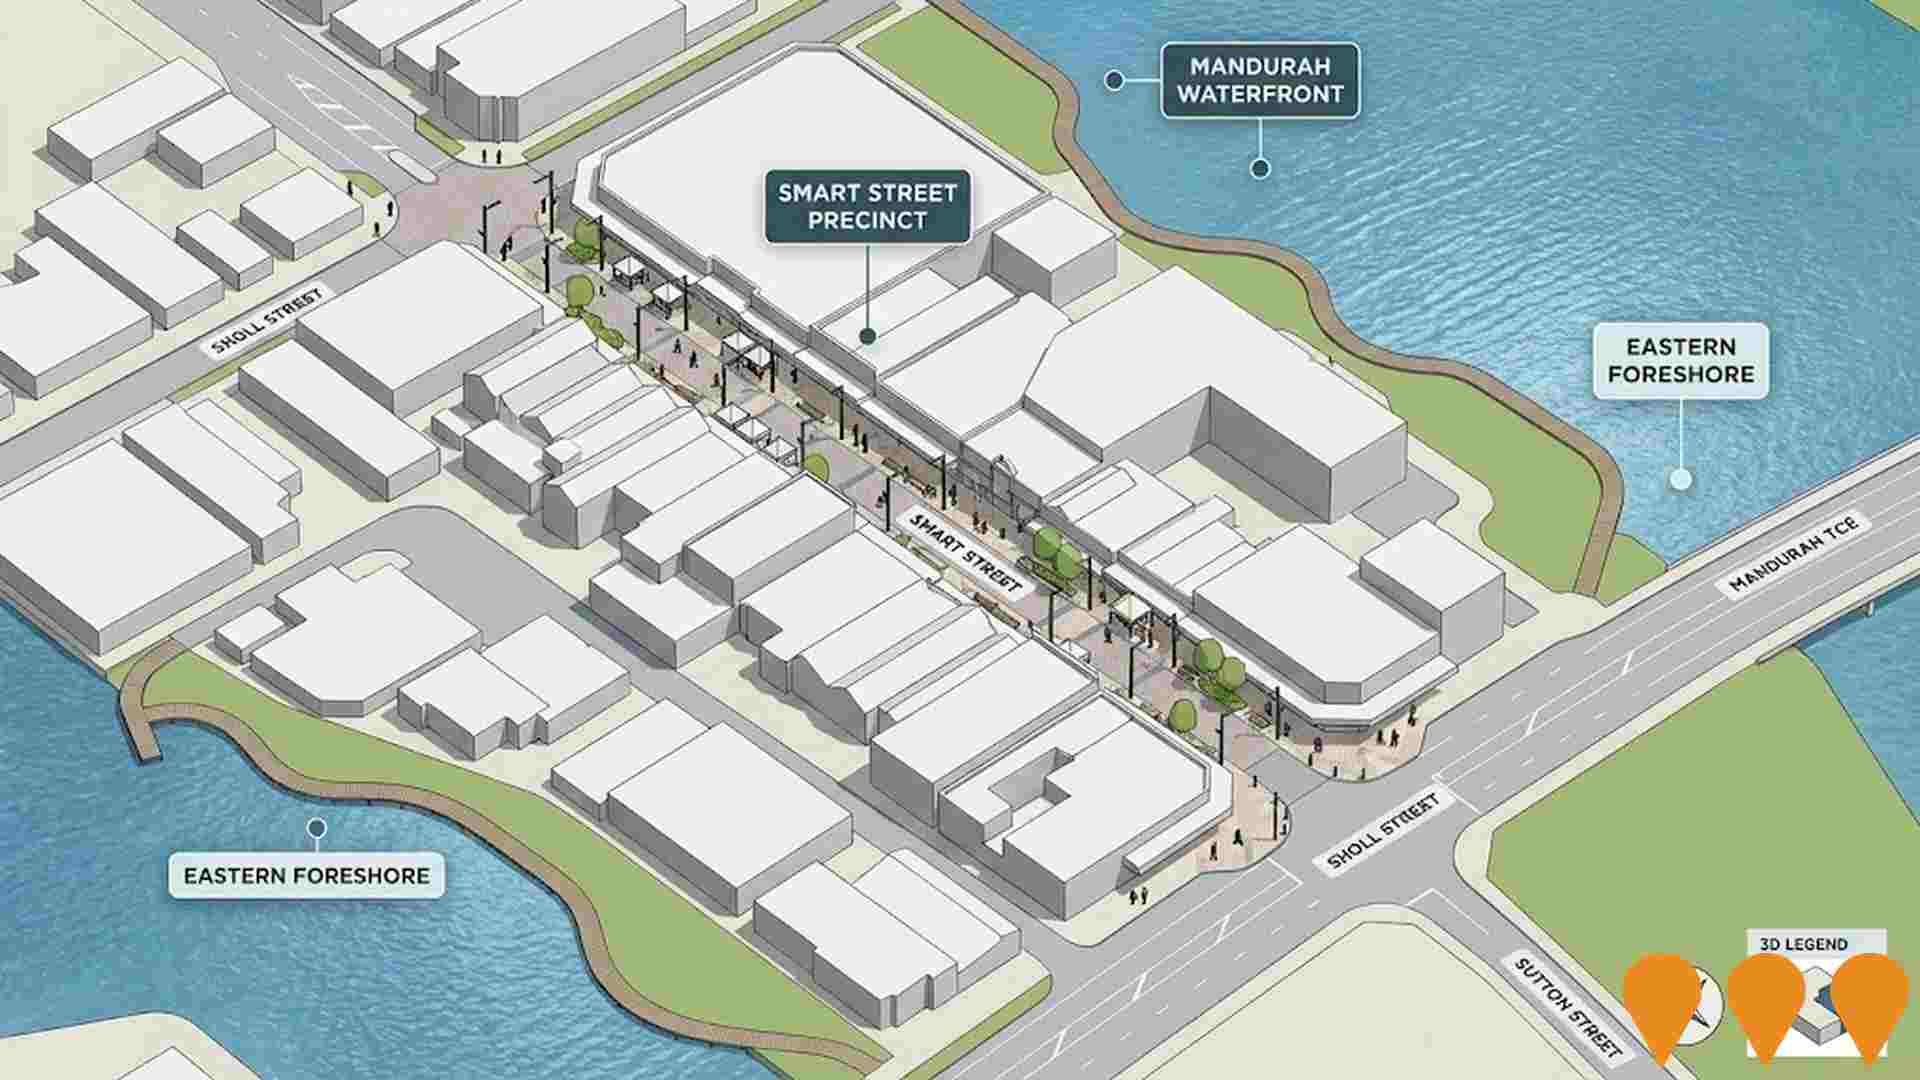
Smart Street Precinct Upgrade and Activation
A $2.5 million infrastructure upgrade and activation program for Smart Street Mall to create an adaptable, pedestrian-focused street. The upgrade included new lighting, paving, and seating. The primary project scope of work, which is part of the larger Mandurah Waterfront Project, has been completed, with minor works like final paving finished. The activation program, including markets, events, buskers, and alfresco incentives, is ongoing through a town team and the City to improve the area's social and economic vitality.
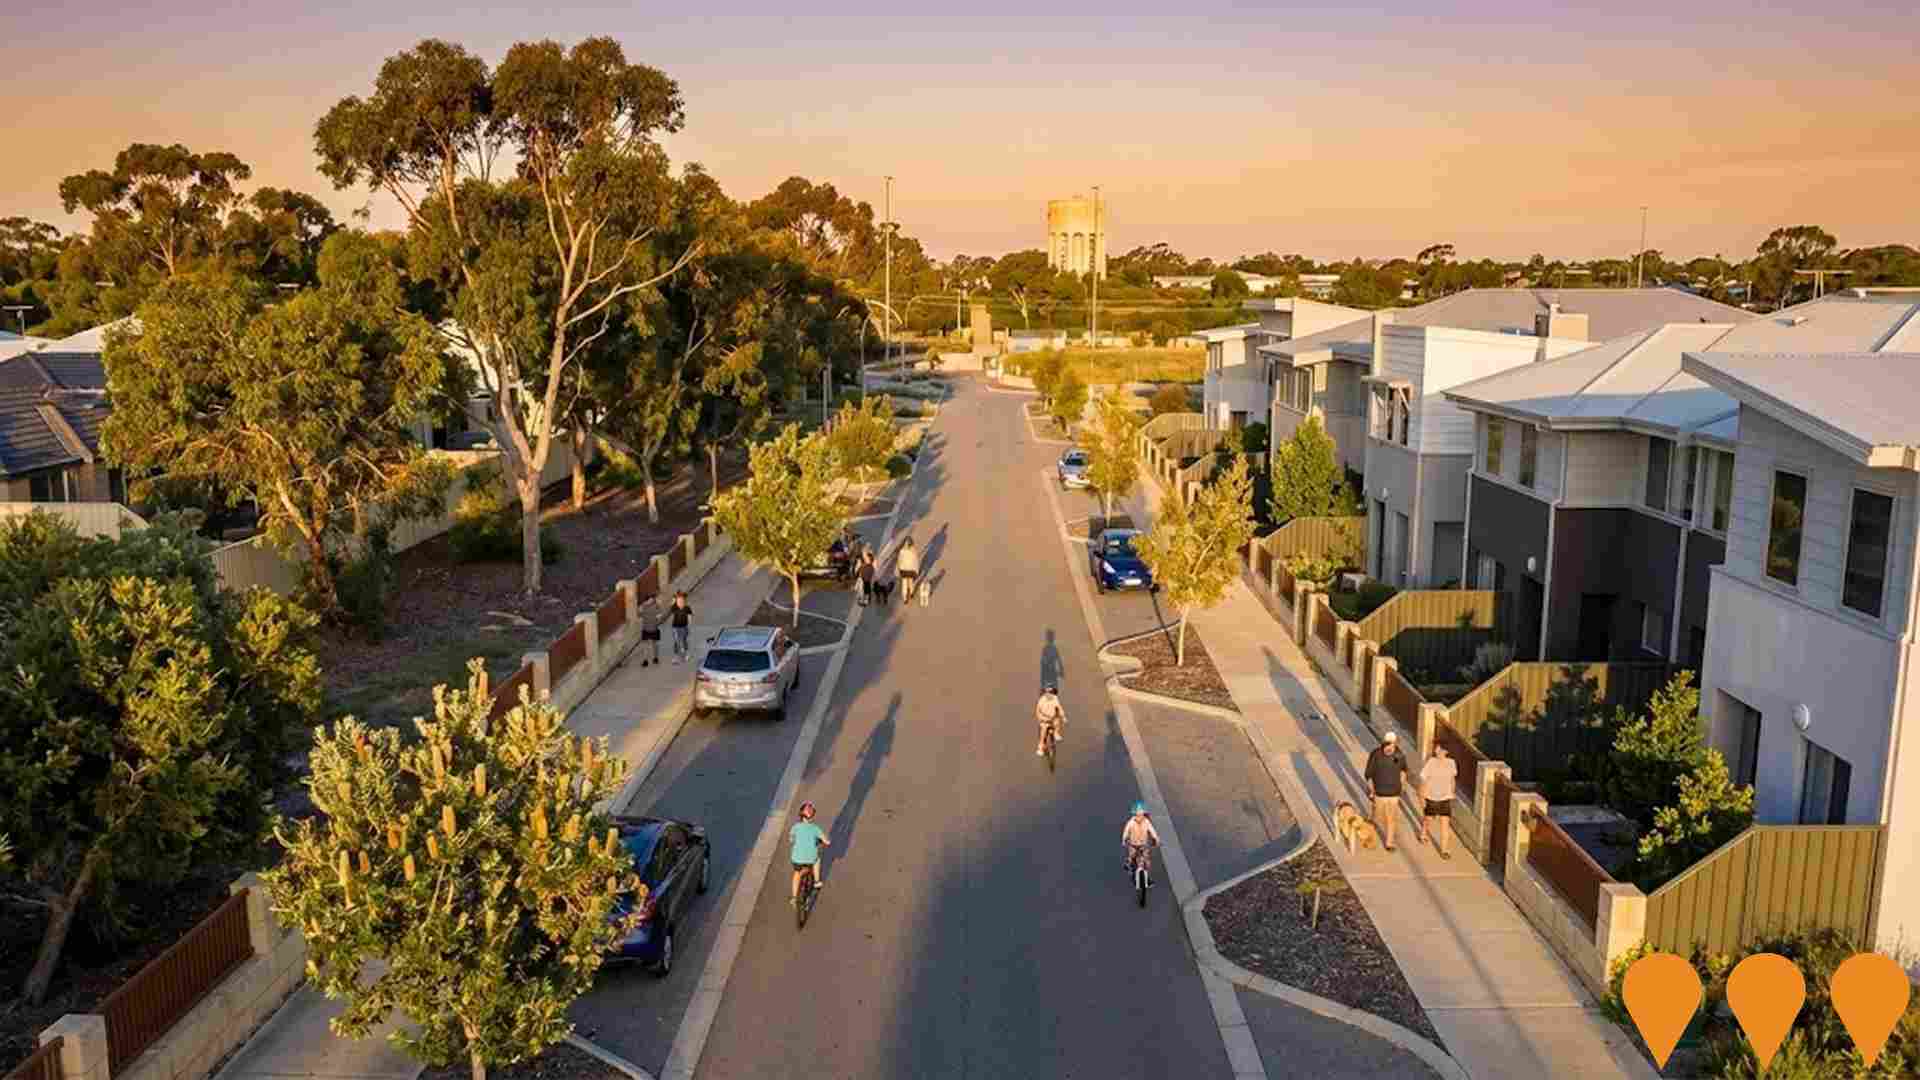
Mandurah Junction Residential Estate
Master planned residential estate adjacent to the Mandurah Train Station offering diverse housing options for up to 2,000 residents. Features extensive landscaped open spaces, retained native trees, mixed-use development opportunities and direct public transport access.
Employment
AreaSearch assessment indicates Mandurah faces employment challenges relative to the majority of Australian markets
Mandurah's workforce is balanced across white and blue collar jobs. Manufacturing and industrial sectors are prominent, with an unemployment rate of 6.9% as of September 2025.
Employment growth over the past year was estimated at 10.5%. There are 4,794 residents employed currently, with an unemployment rate of 7.0%, which is 3.0% higher than Greater Perth's rate of 4.0%. Workforce participation in Mandurah stands at 45.0%, significantly lower than Greater Perth's 65.2%. Leading employment industries among residents include health care & social assistance, retail trade, and accommodation & food.
Notably, accommodation & food has an employment concentration 1.5 times the regional average. Conversely, professional & technical services are under-represented, with only 3.8% of Mandurah's workforce compared to Greater Perth's 8.2%. The worker-to-resident ratio is 1.0, indicating substantial local employment opportunities. Between September 2024 and September 2025, employment increased by 10.5%, while the labour force grew by 9.5%, leading to a fall in unemployment rate of 0.8 percentage points. In contrast, Greater Perth experienced employment growth of 2.9% over the same period, with a marginal rise in its unemployment rate. State-level data from 25-Nov-25 shows WA employment contracted by 0.27%, losing 5,520 jobs, with an unemployment rate of 4.6%, slightly higher than the national rate of 4.3%. National employment forecasts from May-25 project a growth of 6.6% over five years and 13.7% over ten years. Applying these projections to Mandurah's current employment mix suggests local employment should increase by 5.8% over five years and 12.5% over ten years, though this is a simplified extrapolation for illustrative purposes only.
Frequently Asked Questions - Employment
Income
The area's income levels rank in the lower 15% nationally based on AreaSearch comparative data
According to AreaSearch's aggregation of the latest postcode level ATO data released for financial year 2022, Mandurah SA2 had a median income among taxpayers of $47,520 and an average level standing at $67,011. These figures are slightly above national averages of $58,380 and $78,020 respectively for Greater Perth. Based on Wage Price Index growth of 14.2% since financial year 2022, current estimates would be approximately $54,268 (median) and $76,527 (average) as of September 2025. Census 2021 income data shows household, family and personal incomes in Mandurah all fall between the 1st and 8th percentiles nationally. Distribution data indicates that 32.9% of the population (3,865 individuals) earn within the $400 - 799 income range, contrasting with the broader area where the $1,500 - 2,999 bracket leads at 32.0%. Economic circumstances reflect widespread financial pressure, with 45.2% of households operating on weekly budgets below $800. Housing affordability pressures are severe, with only 78.4% of income remaining, ranking at the 3rd percentile nationally.
Frequently Asked Questions - Income
Housing
Mandurah displays a diverse mix of dwelling types, with a higher proportion of rental properties than the broader region
Mandurah's dwelling structures, as per the latest Census, consisted of 52.2% houses and 47.7% other dwellings (semi-detached, apartments, 'other' dwellings). This contrasts with Perth metro's figures of 85.0% houses and 15.0% other dwellings. Home ownership in Mandurah stood at 29.9%, with mortgaged dwellings at 18.8% and rented ones at 51.3%. The median monthly mortgage repayment was $1,300, lower than Perth metro's $1,733. The median weekly rent in Mandurah was $270, compared to Perth metro's $300. Nationally, Mandurah's mortgage repayments were significantly lower at $1,863 and rents substantially below the national figure of $375.
Frequently Asked Questions - Housing
Household Composition
Mandurah features high concentrations of lone person households, with a lower-than-average median household size
Family households constitute 52.1% of all households, including 12.1% couples with children, 25.7% couples without children, and 12.8% single parent families. Non-family households account for the remaining 47.9%, with lone person households at 44.5% and group households comprising 3.5%. The median household size is 1.9 people, which is smaller than the Greater Perth average of 2.4.
Frequently Asked Questions - Households
Local Schools & Education
Mandurah faces educational challenges, with performance metrics placing it in the bottom quartile of areas assessed nationally
The area has university qualification rates at 14.4%, significantly lower than the Australian average of 30.4%. This presents both a challenge and an opportunity for targeted educational initiatives. Bachelor degrees are most common at 10.4%, followed by postgraduate qualifications (2.3%) and graduate diplomas (1.7%). Trade and technical skills are prominent, with 42.0% of residents aged 15+ holding vocational credentials – advanced diplomas (10.6%) and certificates (31.4%).
Educational participation is high, with 25.6% of residents currently enrolled in formal education. This includes 7.9% in primary education, 7.1% in secondary education, and 2.9% pursuing tertiary education.
Frequently Asked Questions - Education
Schools Detail
Nearby Services & Amenities
Transport
Transport servicing is good compared to other areas nationally based on assessment of service frequency, route connectivity and accessibility
Mandurah's public transport system operates 111 active stops, serving a mix of train and bus services. These stops are covered by 40 individual routes, facilitating 4,065 weekly passenger trips in total. Residents enjoy good transport accessibility, with an average distance of 229 meters to the nearest stop.
Service frequency stands at 580 trips per day across all routes, translating to roughly 36 weekly trips per stop.
Frequently Asked Questions - Transport
Transport Stops Detail
Health
Health performance in Mandurah is a key challenge with a range of health conditions having marked impacts on both younger and older age cohorts
Mandurah faces significant health challenges, with various conditions affecting both younger and older residents. The private health cover rate stands at approximately 52% (~6,156 people), slightly higher than the average SA2 area but lower than Greater Perth's 54.9%.
Arthritis and mental health issues are the most prevalent medical conditions, impacting 11.7% and 11.1% of residents respectively. However, 58.2% of residents report no medical ailments, compared to 63.6% in Greater Perth. Mandurah has a higher proportion of seniors aged 65 and over at 30.6% (3,594 people), compared to Greater Perth's 27.5%. Despite this, health outcomes among seniors in Mandurah are better than the general population.
Frequently Asked Questions - Health
Cultural Diversity
The level of cultural diversity witnessed in Mandurah was found to be slightly above average when compared nationally for a number of language and cultural background related metrics
Mandurah's cultural diversity is above average, with 9.2% speaking a language other than English at home and 30.0% born overseas. Christianity is the predominant religion in Mandurah, accounting for 46.1%. The most notable overrepresentation is in Other religions, comprising 1.3%, compared to Greater Perth's 0.6%.
In terms of ancestry, the top three groups are English (34.9%), Australian (25.5%), and Irish (7.7%). Notably, Welsh (0.8%) and Maori (1.2%) are overrepresented in Mandurah compared to regional averages.
Frequently Asked Questions - Diversity
Age
Mandurah hosts an older demographic, ranking in the top quartile nationwide
Mandurah has a median age of 49, which is higher than Greater Perth's figure of 37 and also above the national average of 38. The age profile shows that those aged 65-74 make up 15.6% of the population, compared to 9.4% nationally. Those aged 5-14 are less prevalent at 8.0%, compared to Greater Perth's figure. Since the 2021 Census, the 75 to 84 age group has increased from 9.1% to 11.1%. Conversely, the 45 to 54 cohort has decreased from 12.4% to 11.3%. By 2041, demographic projections show significant shifts in Mandurah's age structure. The 75 to 84 group is expected to grow by 72%, reaching 2,247 people from 1,307. Notably, the combined 65+ age groups will account for 83% of total population growth. In contrast, the 0 to 4 and 5 to 14 cohorts are projected to decline in population.
