Chart Color Schemes
This analysis uses ABS Statistical Areas Level 2 (SA2) boundaries, which can materially differ from Suburbs and Localities (SAL) even when sharing similar names.
SA2 boundaries are defined by the Australian Bureau of Statistics and are designed to represent communities for statistical reporting (e.g., census and ERP).
Suburbs and Localities (SAL) represent commonly-used suburb/locality names (postal-style areas) and may use different geographic boundaries. For comprehensive analysis, consider reviewing both boundary types if available.
est. as @ -- *
ABS ERP | -- people | --
2021 Census | -- people
Sales Activity
Curious about local property values? Filter the chart to assess the volume and appreciation (including resales) trends and regional comparisons, or scroll to the map below view this information at an individual property level.
Find a Recent Sale
Sales Detail
Population
Falcon - Wannanup lies within the top quartile of areas nationally for population growth performance according to AreaSearch analysis of recent, and medium to long-term trends
Falcon-Wannanup's population is approximately 10,983 as of November 2025. This figure represents an increase of 1,319 people since the 2021 Census, which recorded a population of 9,664. The growth was inferred from the estimated resident population of 10,935 in June 2024 and 71 new addresses validated after the Census date. The population density is around 1,145 persons per square kilometer, comparable to averages across other locations assessed by AreaSearch. Falcon-Wannanup's growth rate of 13.6% since the 2021 Census exceeds the national average of 8.9%, indicating it as a region with significant population increase. Interstate migration contributed approximately 54.7% of overall population gains during recent periods, though all factors including overseas migration and natural growth were positive influences.
AreaSearch uses ABS/Geoscience Australia projections for each SA2 area, released in 2024 with a base year of 2022. For areas not covered by this data, AreaSearch employs growth rates by age cohort from the ABS's Greater Capital Region projections (released in 2023, based on 2022 data). Demographic trends suggest an above-median population growth for Falcon-Wannanup, with a projected increase of 2,101 persons to reach 12,084 by 2041. This reflects an overall gain of approximately 18.7% over the 17-year period.
Frequently Asked Questions - Population
Development
The level of residential development activity in Falcon - Wannanup was found to be higher than 90% of real estate markets across the country
Falcon-Wannanup has seen approximately 95 new home approvals annually over the past five financial years, totalling 479 homes. As of FY26, 30 approvals have been recorded. On average, each home built between FY21 and FY25 accommodates around three new residents per year, indicating supply may not meet demand, potentially leading to heightened buyer competition and pricing pressures. The average construction cost for new homes is $322,000.
In FY26, commercial approvals have reached $6.6 million, suggesting limited commercial development focus compared to residential growth. When compared to Greater Perth, Falcon-Wannanup shows around 75% of the construction activity per person and ranks among the top 83rd percentile nationally in terms of assessed areas. New developments consist predominantly of standalone homes (97%) with a smaller proportion of attached dwellings (3%), maintaining the area's suburban character focused on family homes.
With approximately 123 people per approval, Falcon-Wannanup reflects an actively developing area. According to AreaSearch's latest quarterly estimate, the population is forecasted to grow by 2,053 residents by 2041. Assuming current construction levels continue, housing supply should meet demand, creating favourable conditions for buyers and potentially exceeding current population growth forecasts.
Frequently Asked Questions - Development
Infrastructure
Falcon - Wannanup has limited levels of nearby infrastructure activity, ranking in the 8thth percentile nationally
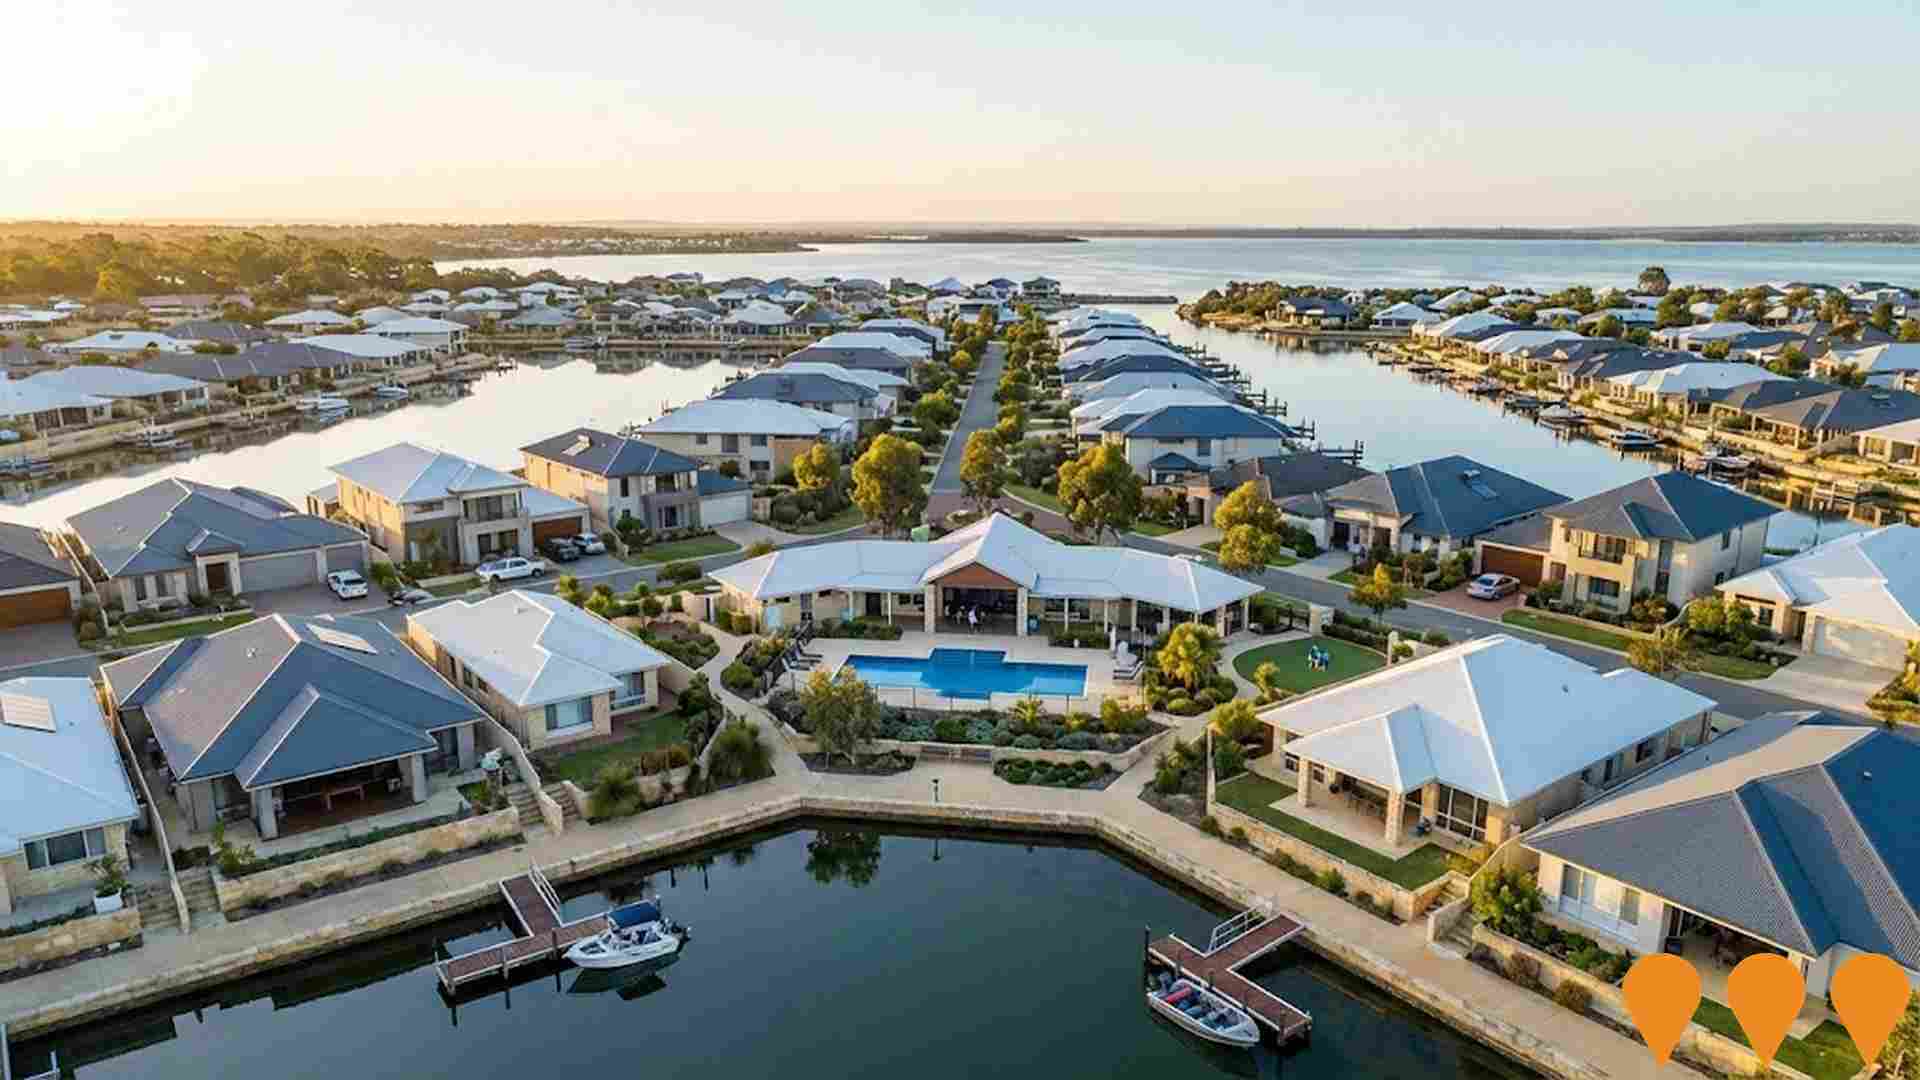
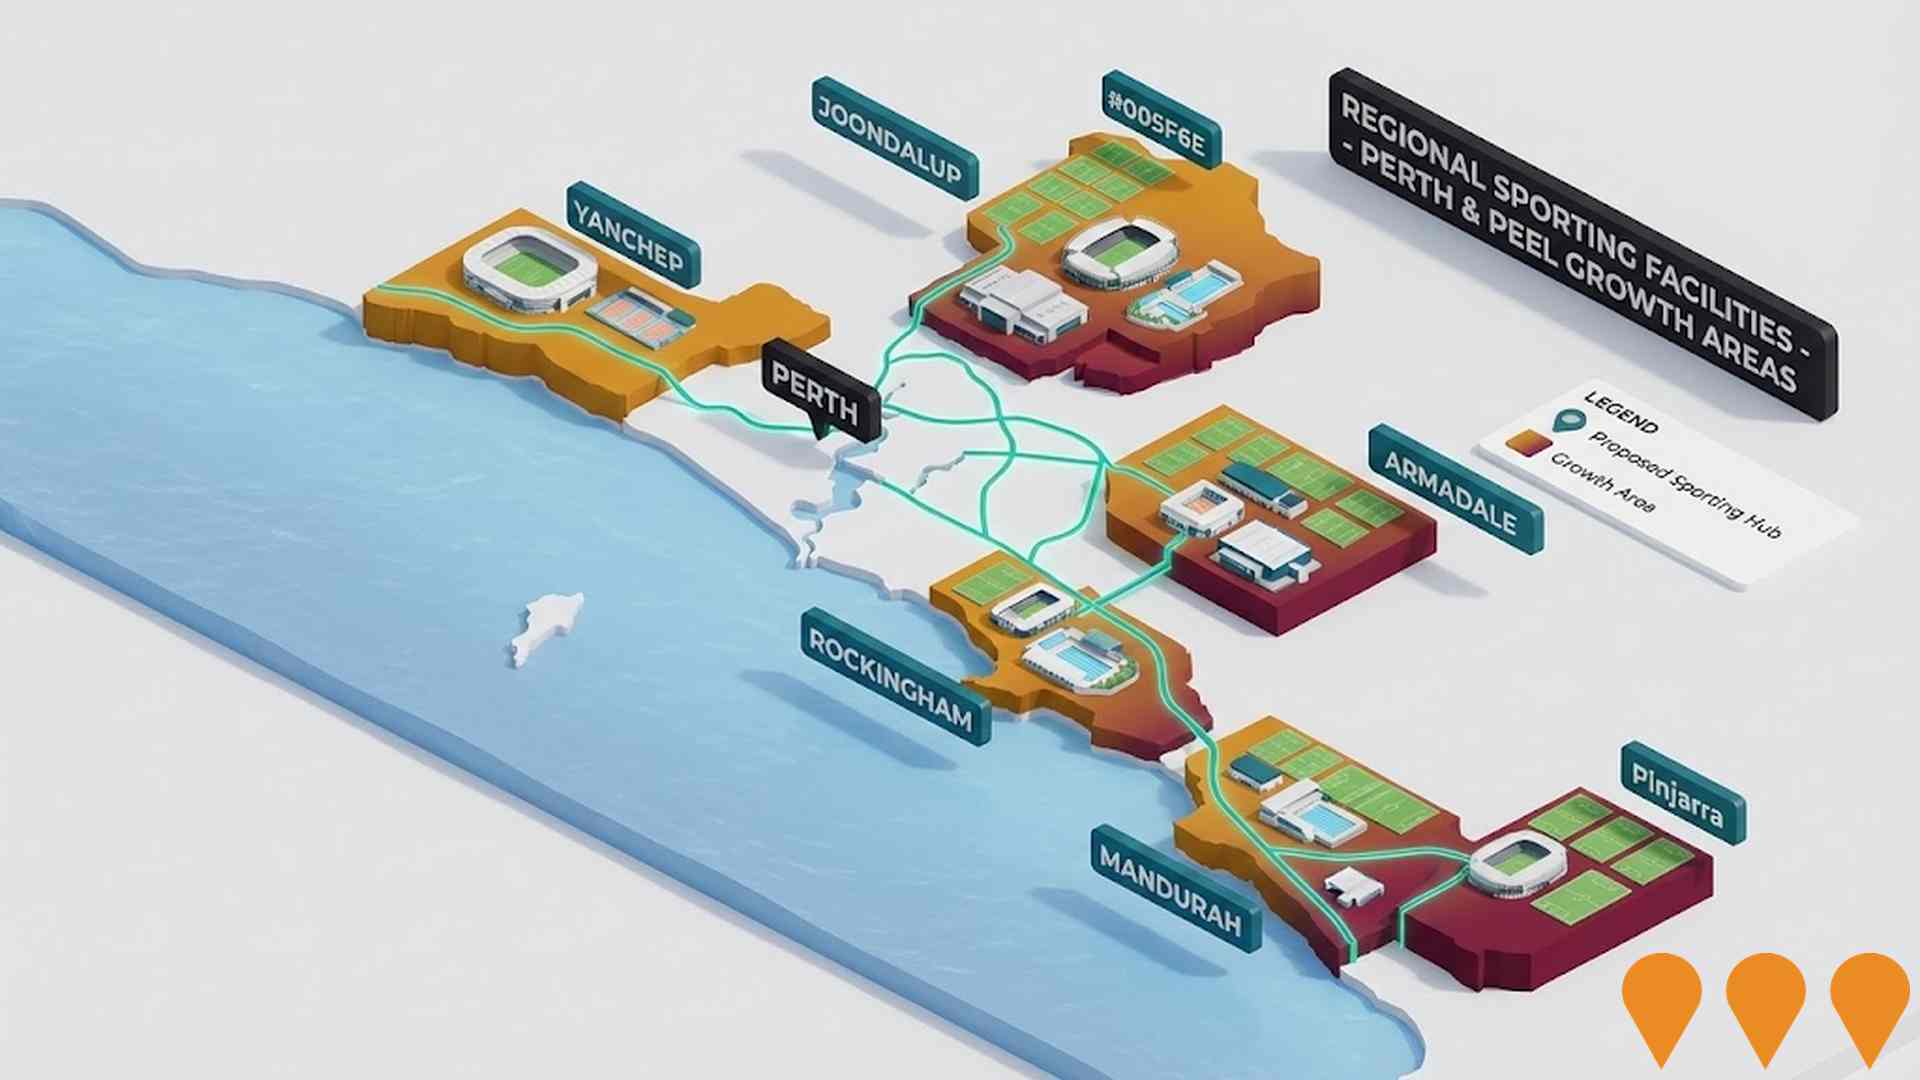
Changes to local infrastructure significantly impact an area's performance. AreaSearch identified one major project likely affecting the region: Yalgorup National Park Eco-Tourism Development, Timbers Edge Estate, Southern Beaches Coastal Hazard Risk Management and Adaptation Plan (CHRMAP), Dawesville Community Centre (Djilba-Wardarn Bo).
Professional plan users can use the search below to filter and access additional projects.
INFRASTRUCTURE SEARCH
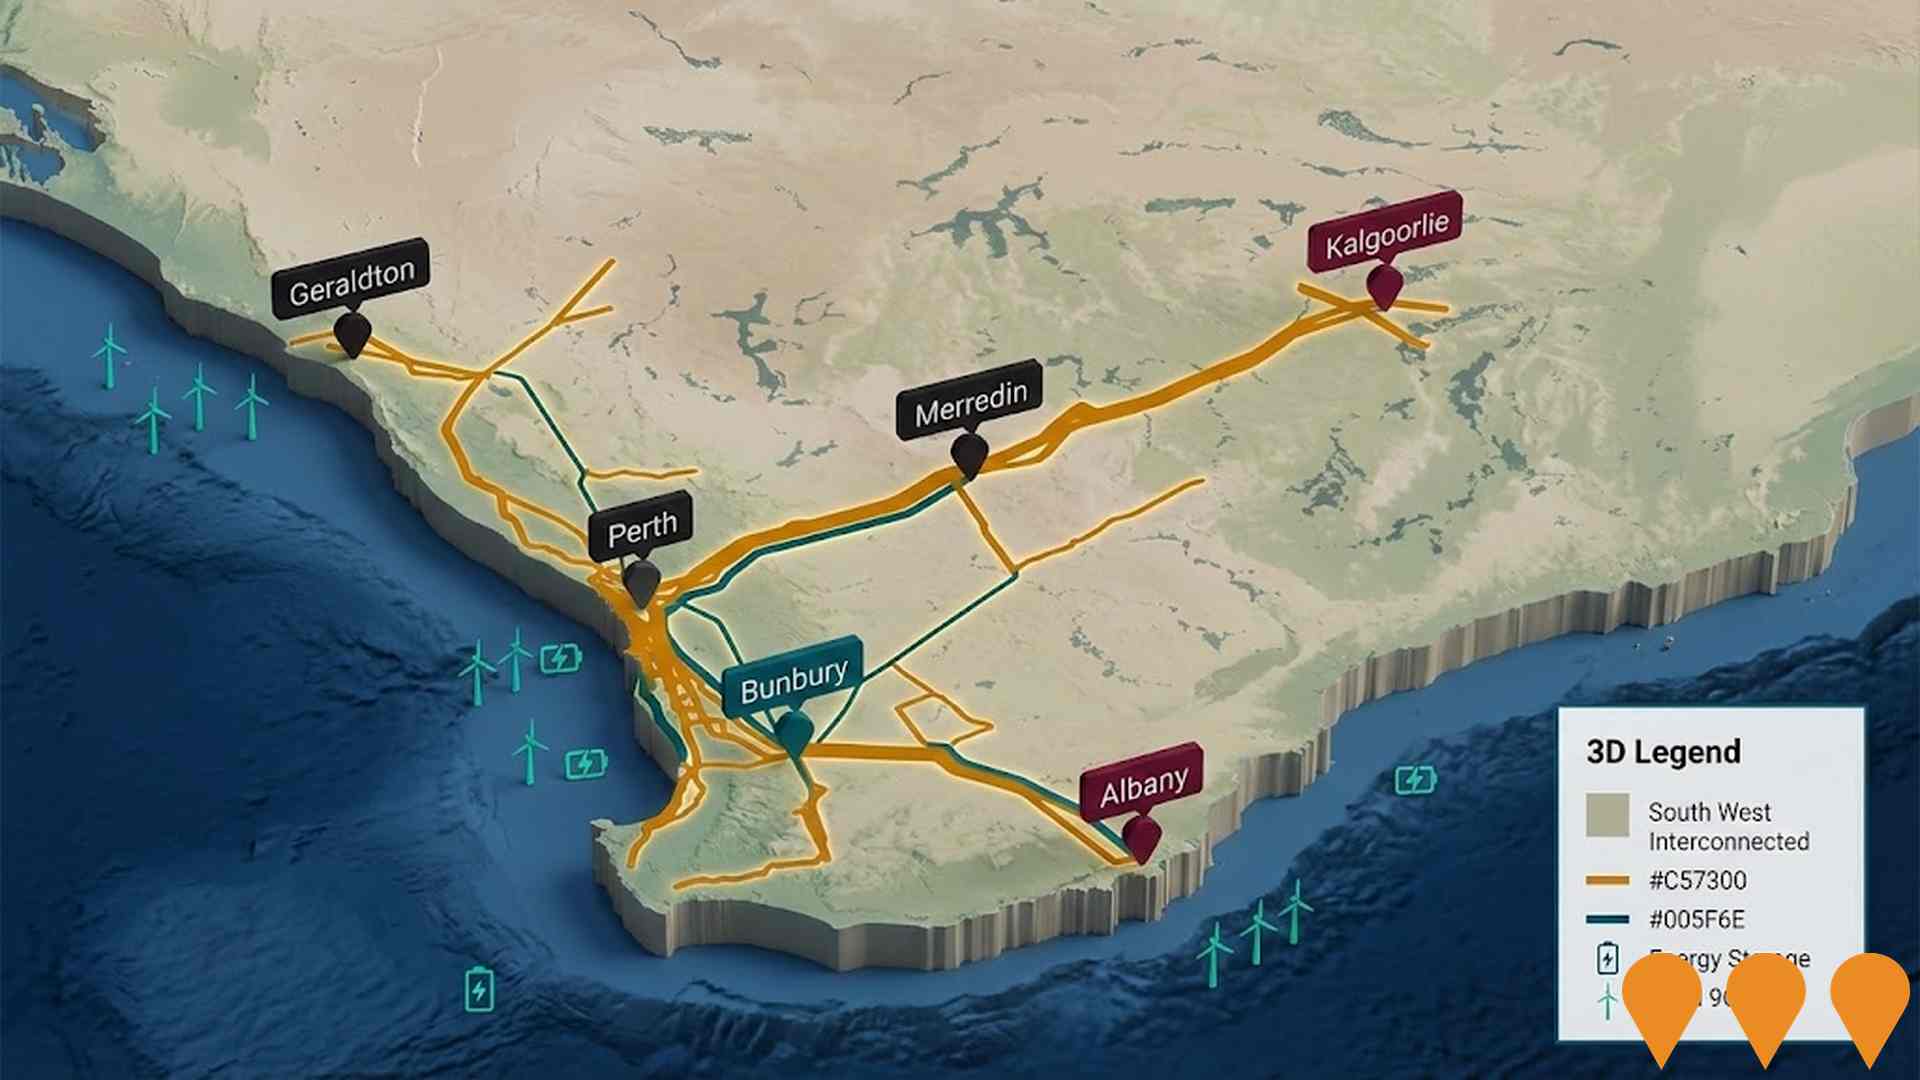
 Denotes AI-based impression for illustrative purposes only, not to be taken as definitive under any circumstances. Please follow links and conduct other investigations from the project's source for actual imagery. Developers and project owners wishing us to use original imagery please Contact Us and we will do so.
Frequently Asked Questions - Infrastructure
Resources Community Investment Initiative
A $750 million partnership between the Western Australian Government and seven major resource companies (Rio Tinto, BHP, Woodside Energy, Chevron Australia, Mineral Resources, Fortescue, Roy Hill) to co-fund community, social and regional infrastructure projects across regional Western Australia, with strong focus on the Pilbara, Goldfields, Kimberley, Mid West and Gascoyne.
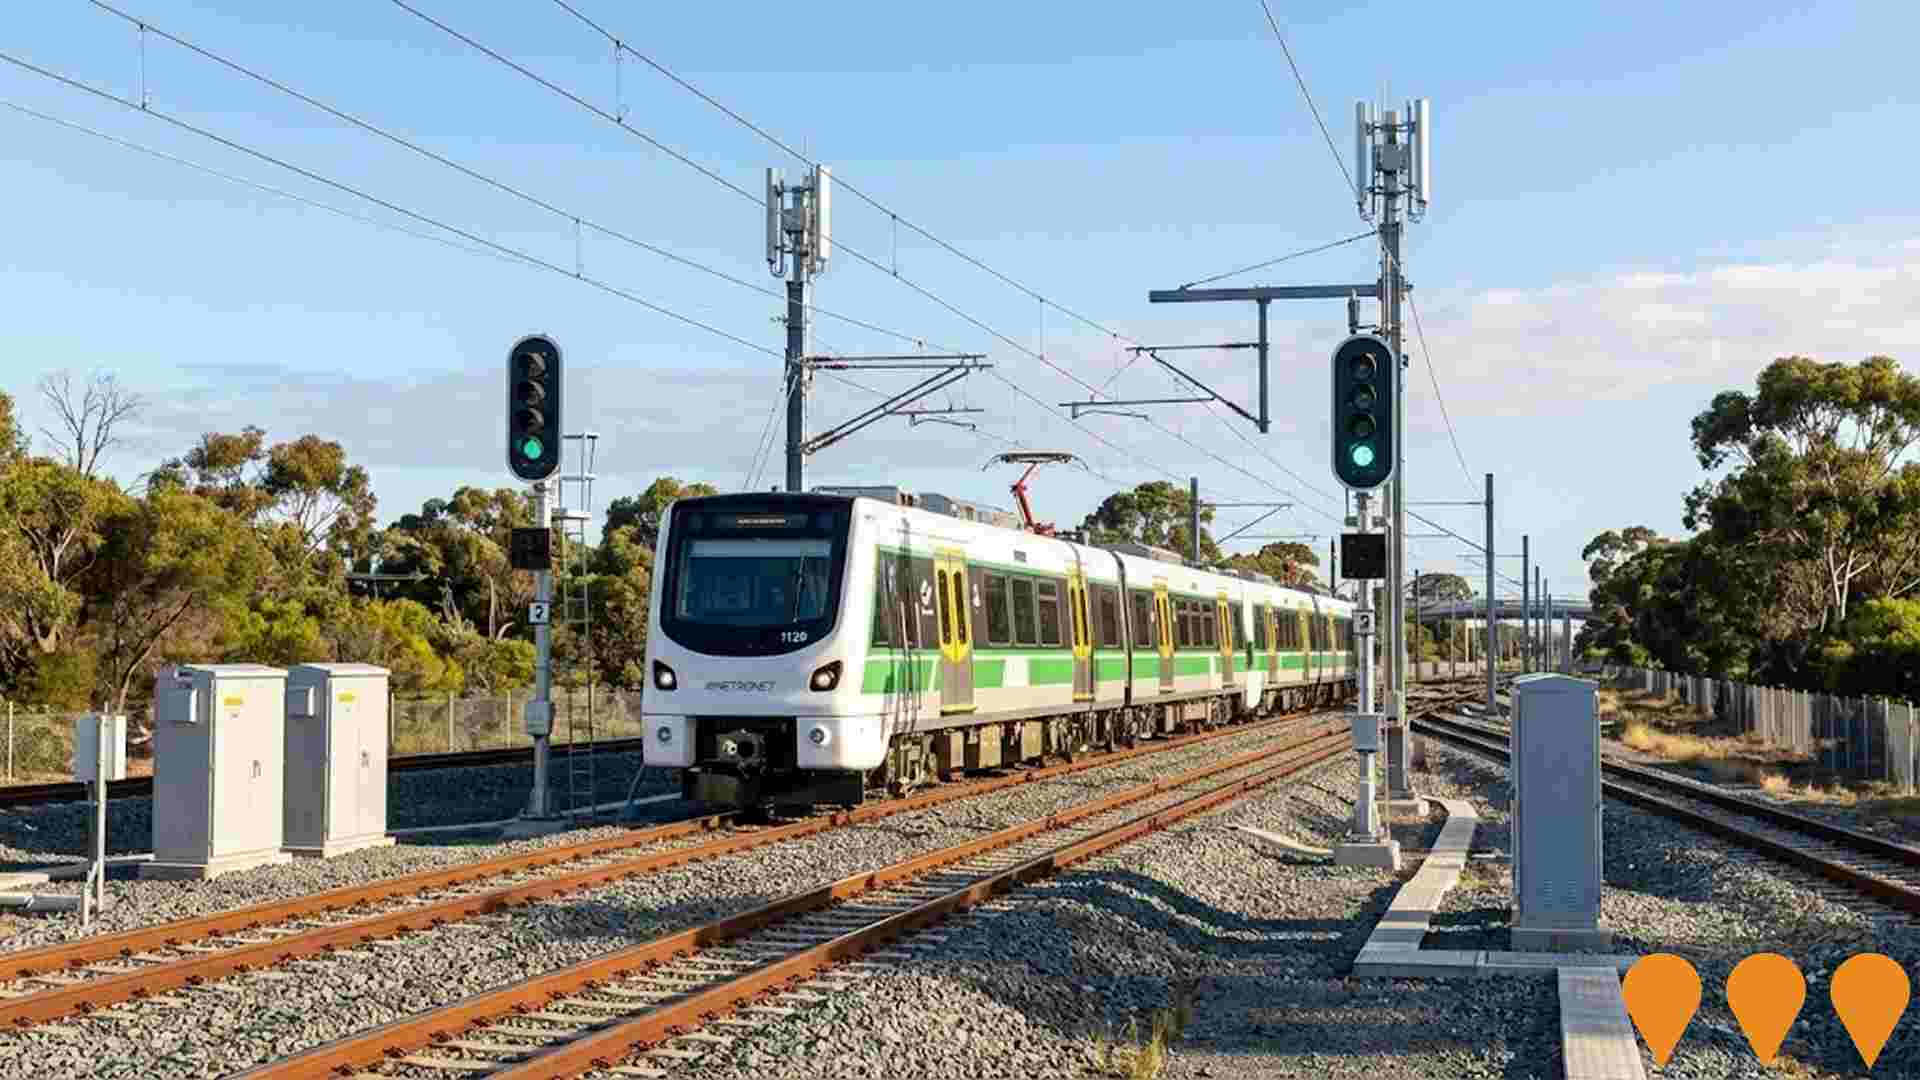
METRONET High Capacity Signalling Project
City wide upgrade of Perth's urban rail signalling and train control systems to a communications based train control automatic train control system across about 500 km of the Transperth network, increasing capacity by up to 40 percent and supporting more frequent, reliable METRONET passenger services. Works include new in cab signalling, trackside equipment, integration with the Public Transport Operations Control Centre and digital radio, delivered progressively over about a decade.
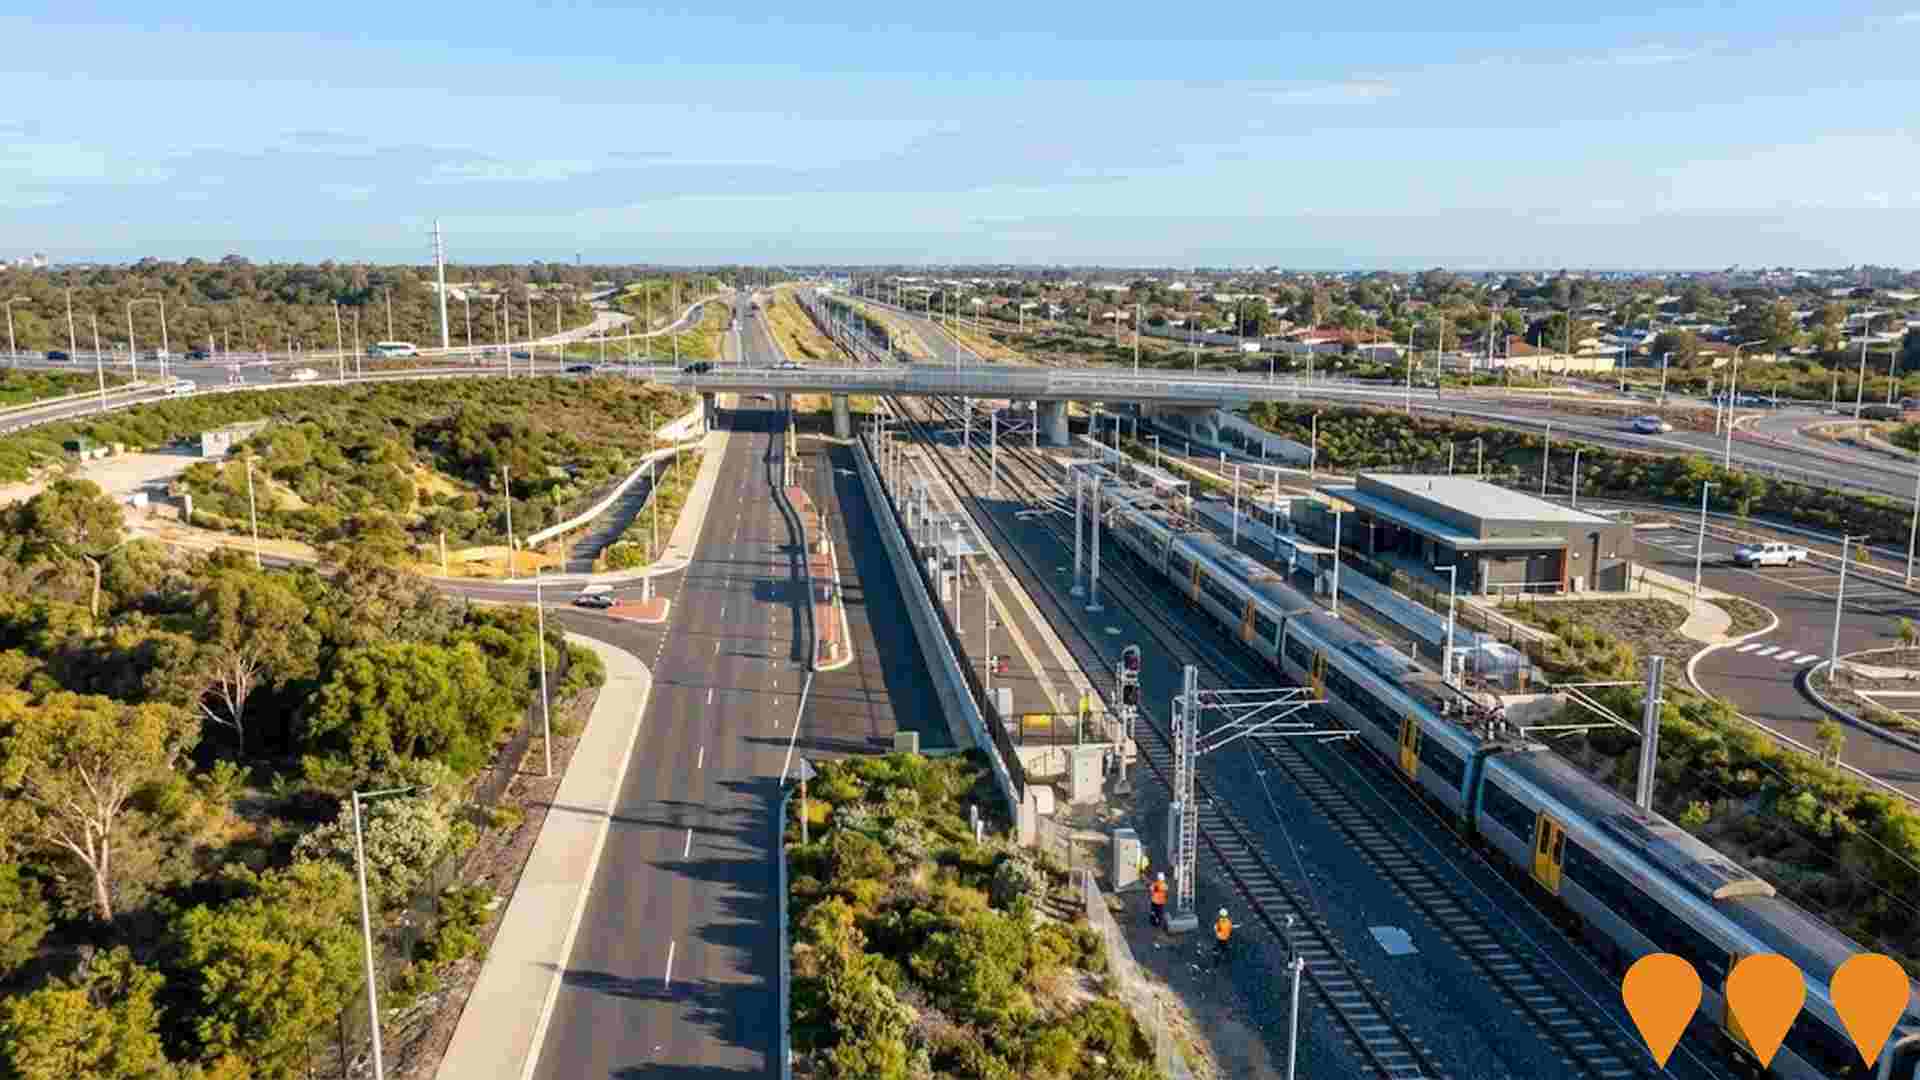
METRONET High Capacity Signalling Program
The High Capacity Signalling Project will upgrade the existing signalling and control systems to an integrated communications-based train control system, making better use of the existing rail network by allowing more trains to run more often. The project aims to increase network capacity by 40 percent, provide energy-saving benefits, enhance cybersecurity, and future-proof the network for growth.
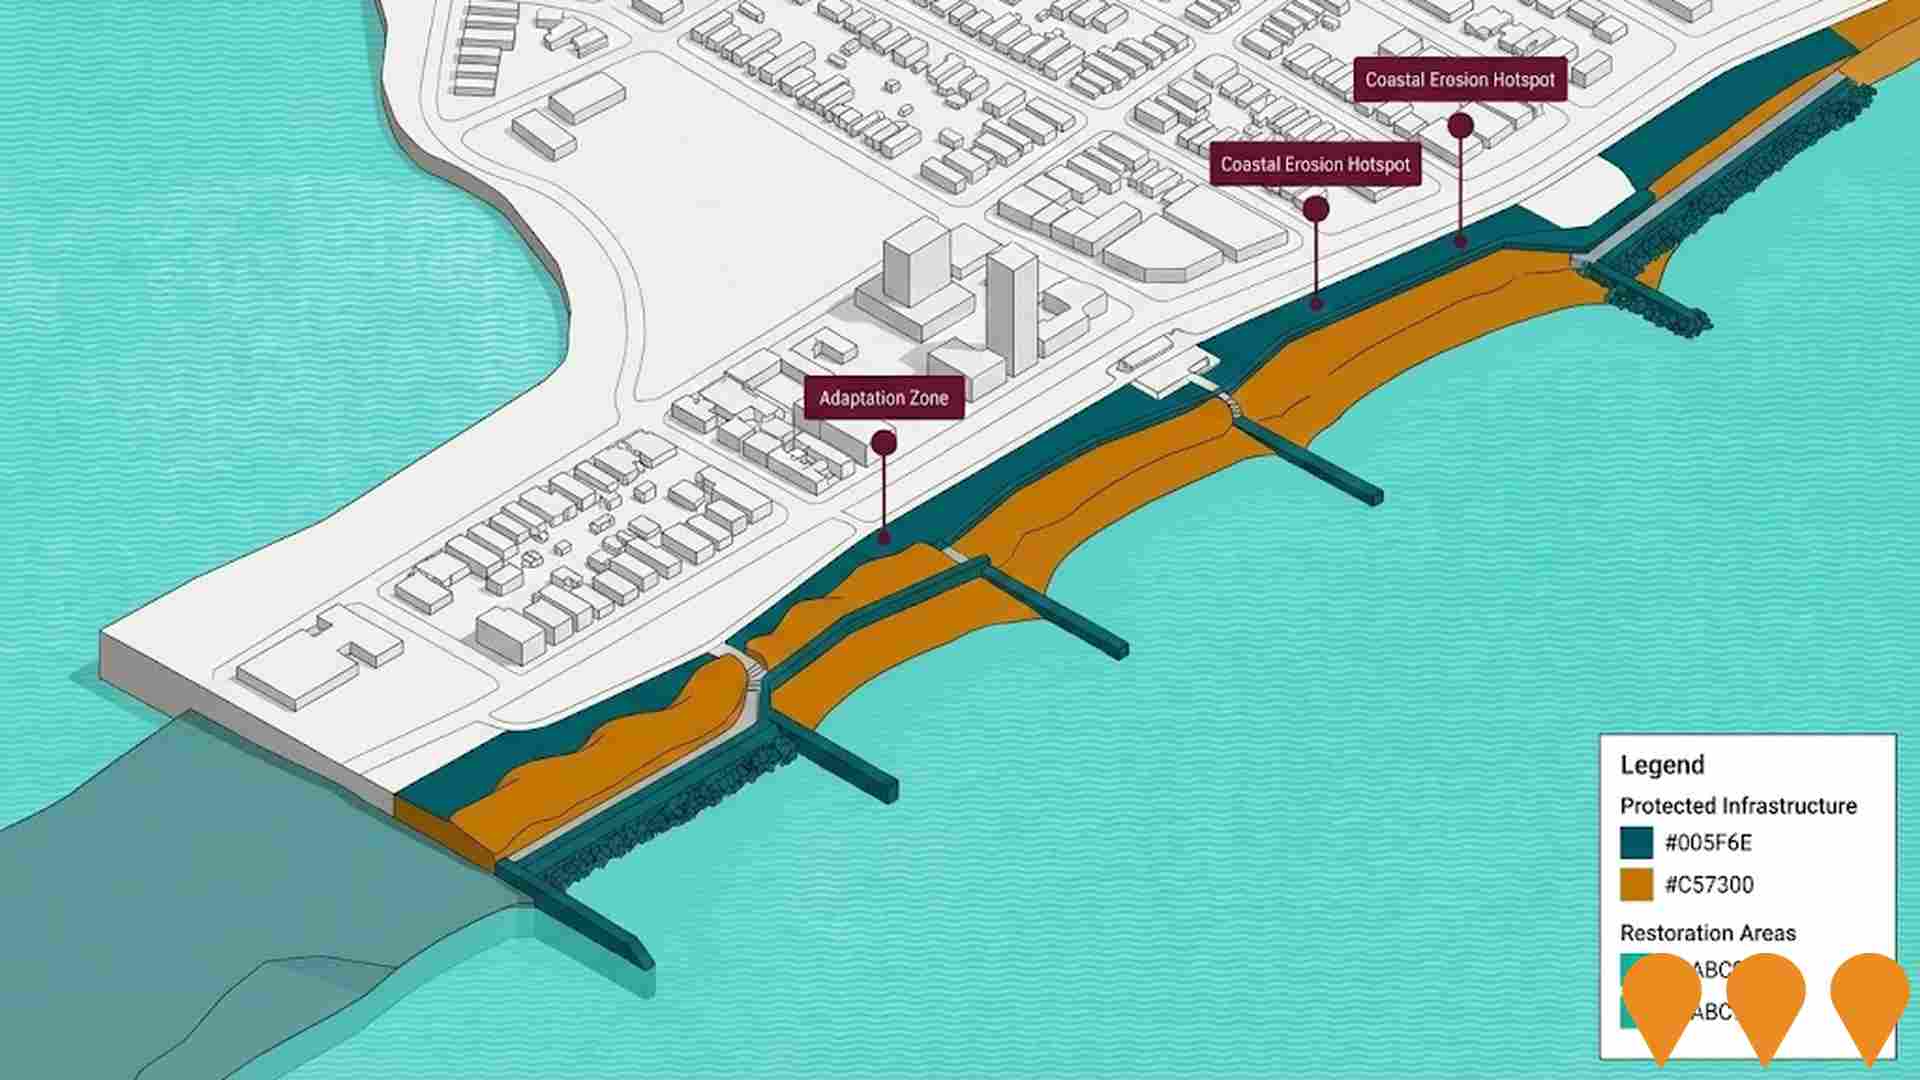
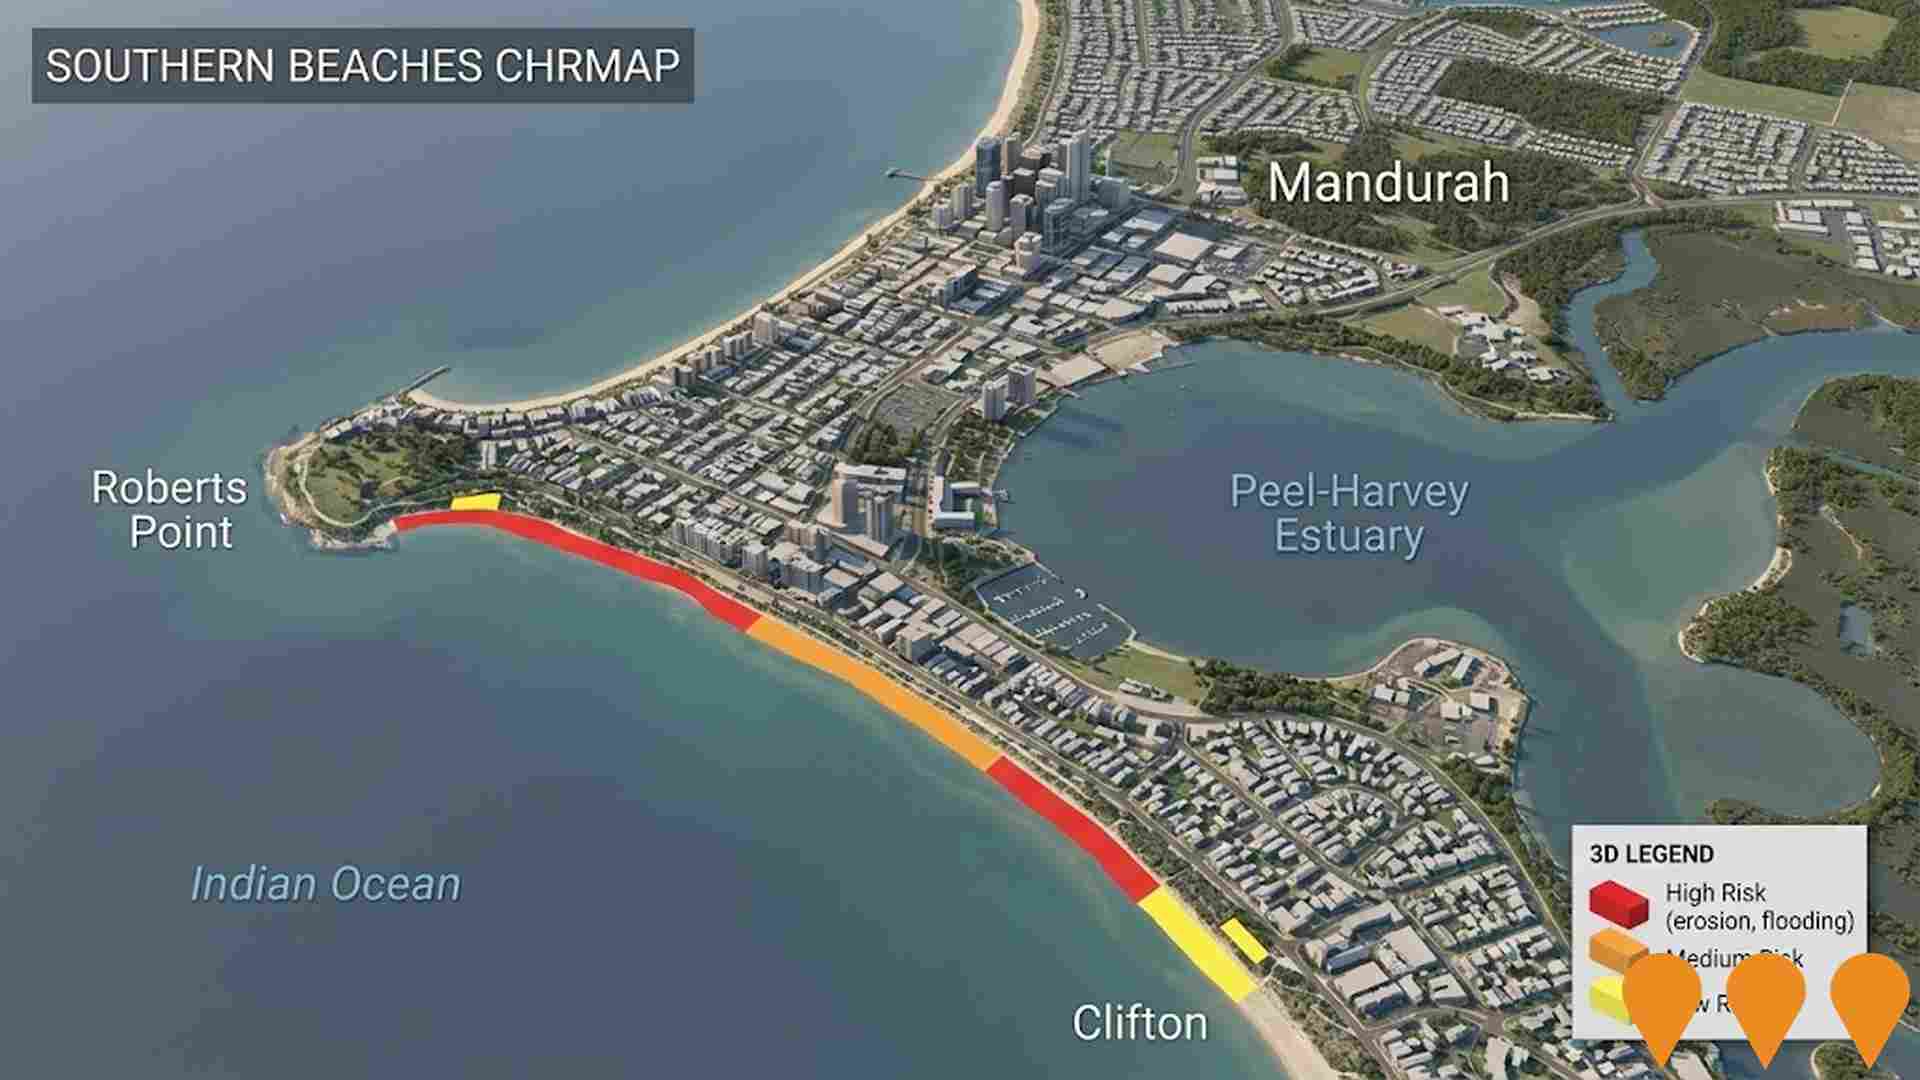
Southern Beaches Coastal Hazard Risk Management and Adaptation Plan (CHRMAP)
A long-term (100-year) strategic plan by the City of Mandurah to address the risks posed by coastal hazards, such as erosion, sea level rise, and flooding, along the southern coastline from Roberts Point to Clifton. The plan involves technical studies and community engagement to identify key assets, assess risks, and develop sustainable adaptation strategies. Stage 1 and 2 community engagement are complete, and the draft CHRMAP is anticipated for public comment in the coming months.
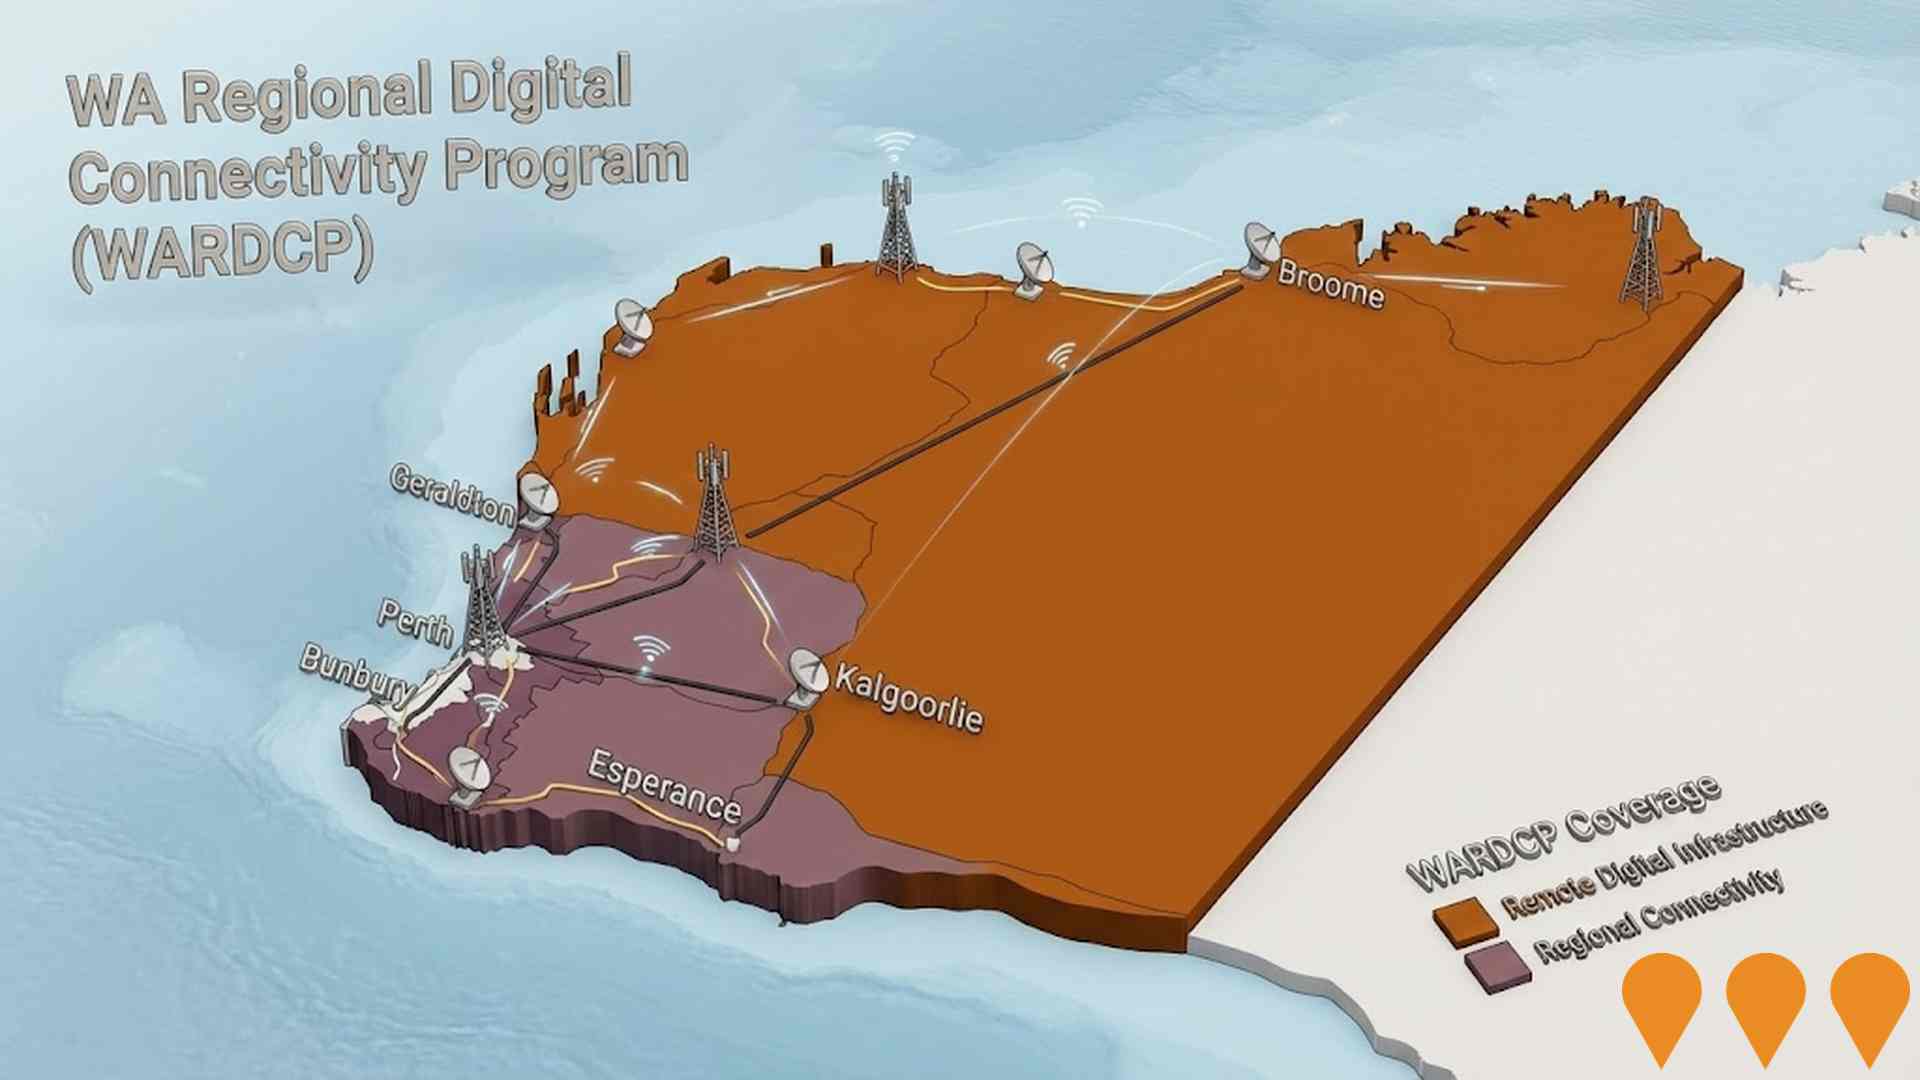
WA Regional Digital Connectivity Program (WARDCP)
Statewide co-investment program delivering new and upgraded mobile, fixed wireless and broadband infrastructure to improve reliability, coverage and performance for regional and remote Western Australia. Current workstreams include the Regional Telecommunications Project, State Agriculture Telecommunications Infrastructure Fund, and the WA Regional Digital Connectivity Program (WARDCP).
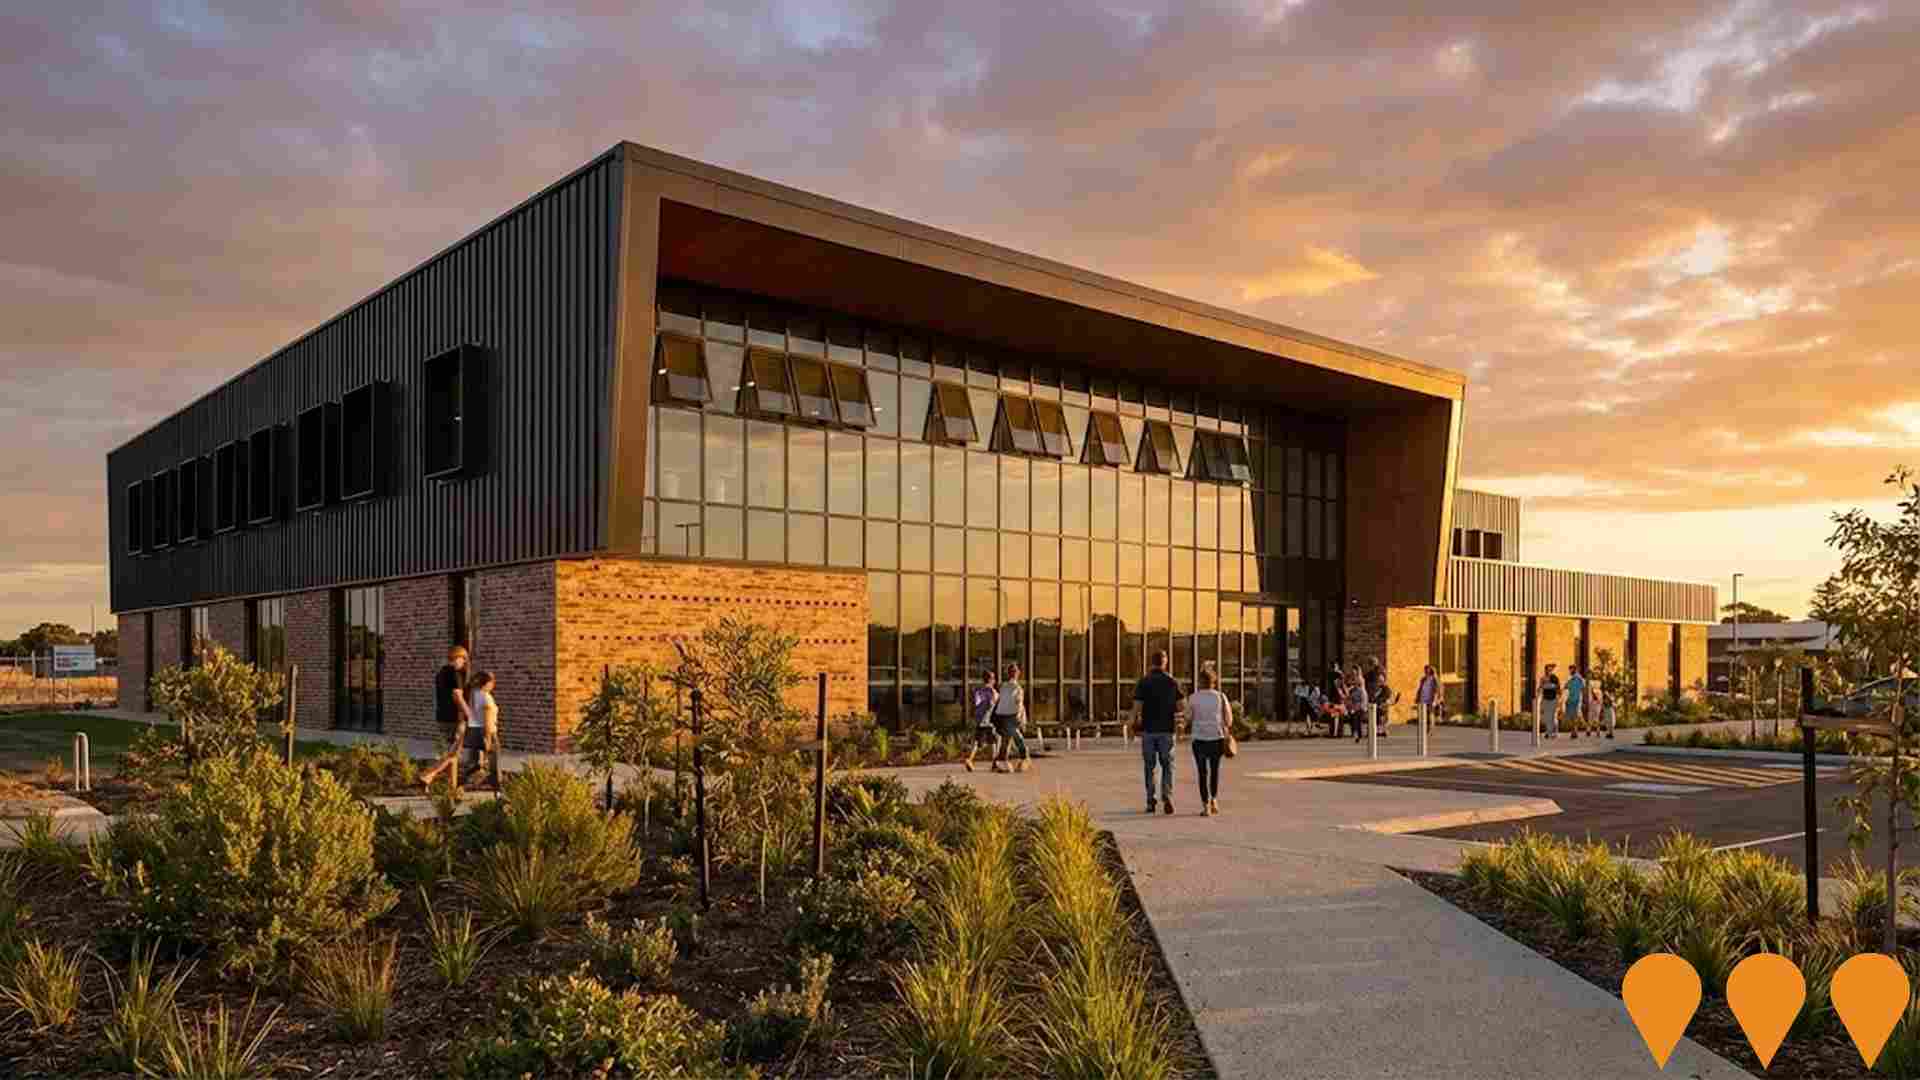
Dawesville Community Centre (Djilba-Wardarn Bo)
A multi-purpose community hub that has officially opened, designed to serve the growing Dawesville population. The centre is also known by its Aboriginal name, Djilba-Wardarn Bo, meaning 'the place where it is not far from the estuary to the ocean.' Features include a main hall with a stage, wet and dry multi-use activity rooms, a kitchen, office space, meeting rooms, universally accessible toilets, landscaping, and an external playground. The project was funded by a $6.237 million financial contribution from the State Government and a $2.65 million Lotterywest grant, totaling approximately $8.89 million.
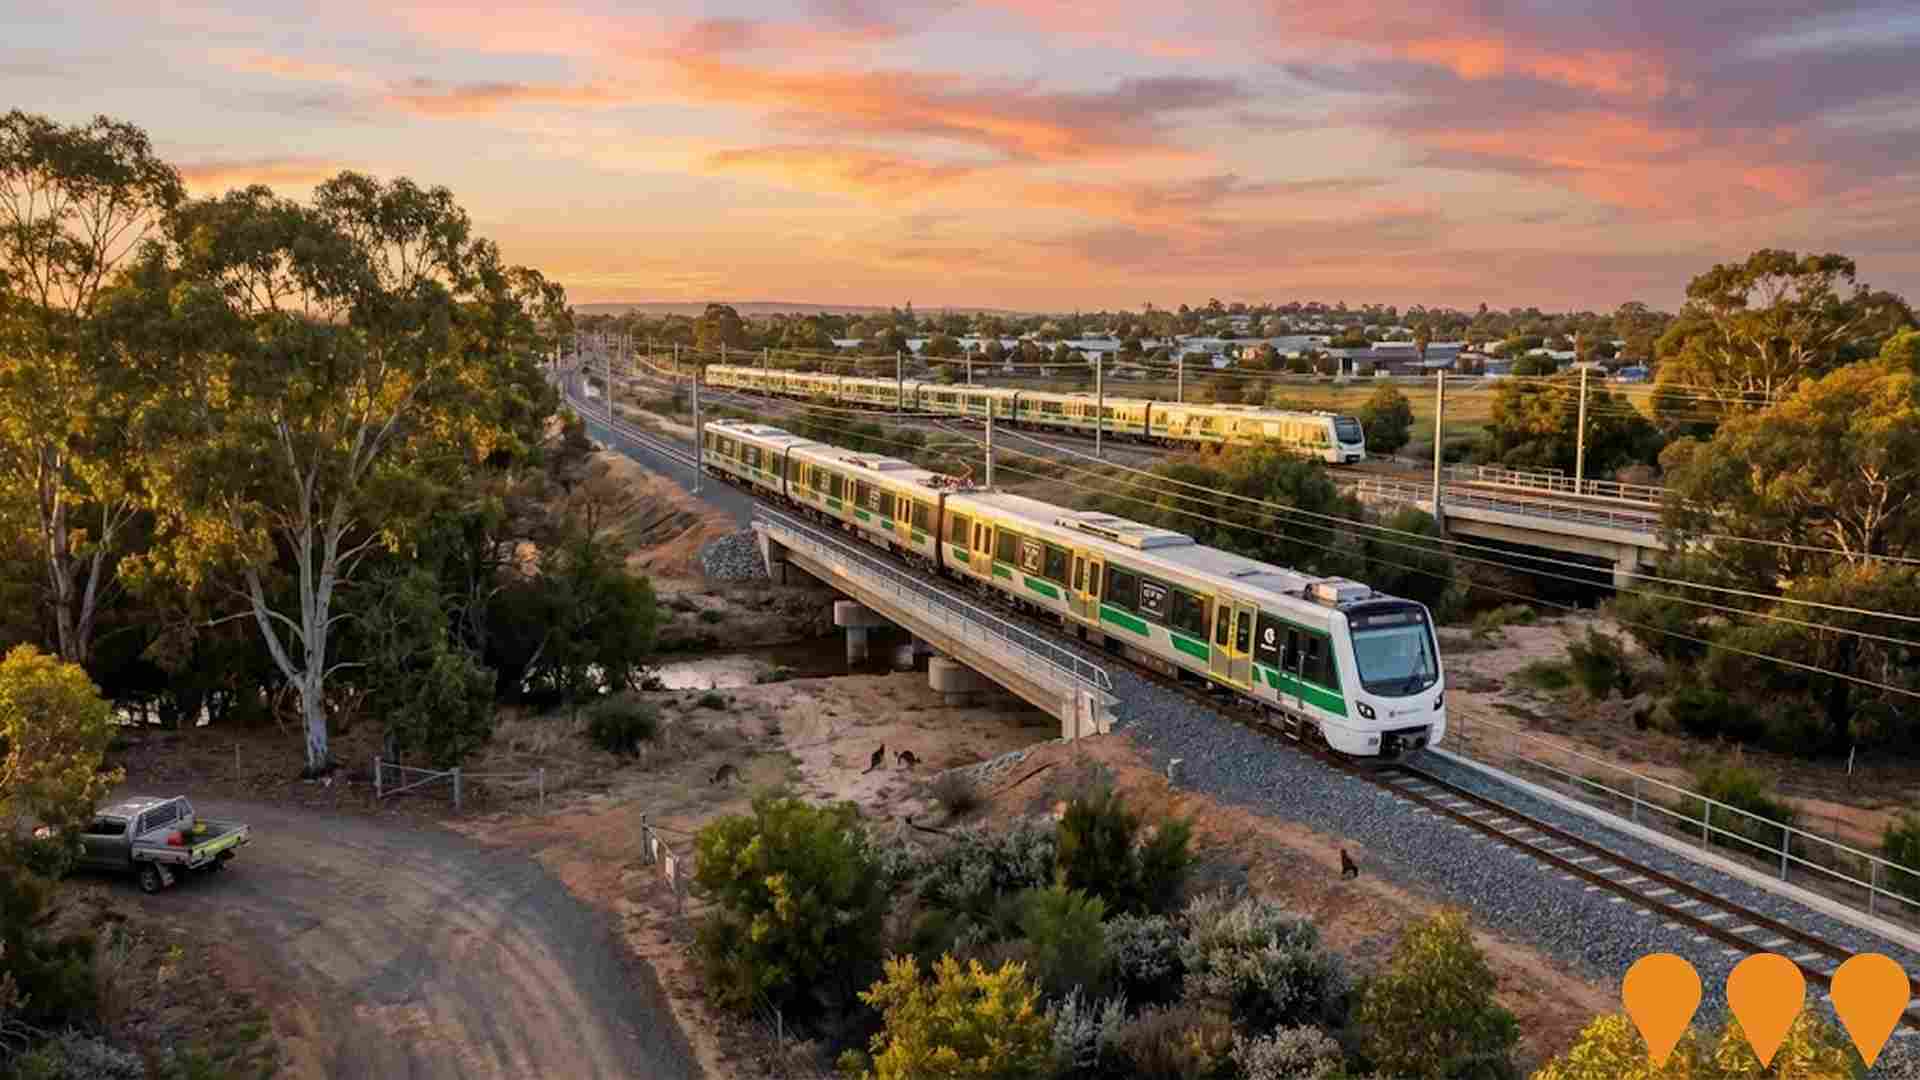
Additional Australind Trains Procurement
Procurement of two additional three-car Australind diesel railcar sets to improve service reliability and support increased frequency on the Perth to Bunbury route. Part of WA Government's broader rail improvement strategy, these trains will be manufactured by Alstom at the Bellevue facility and are scheduled to commence operations when the Armadale Train Line reopens in early 2026.
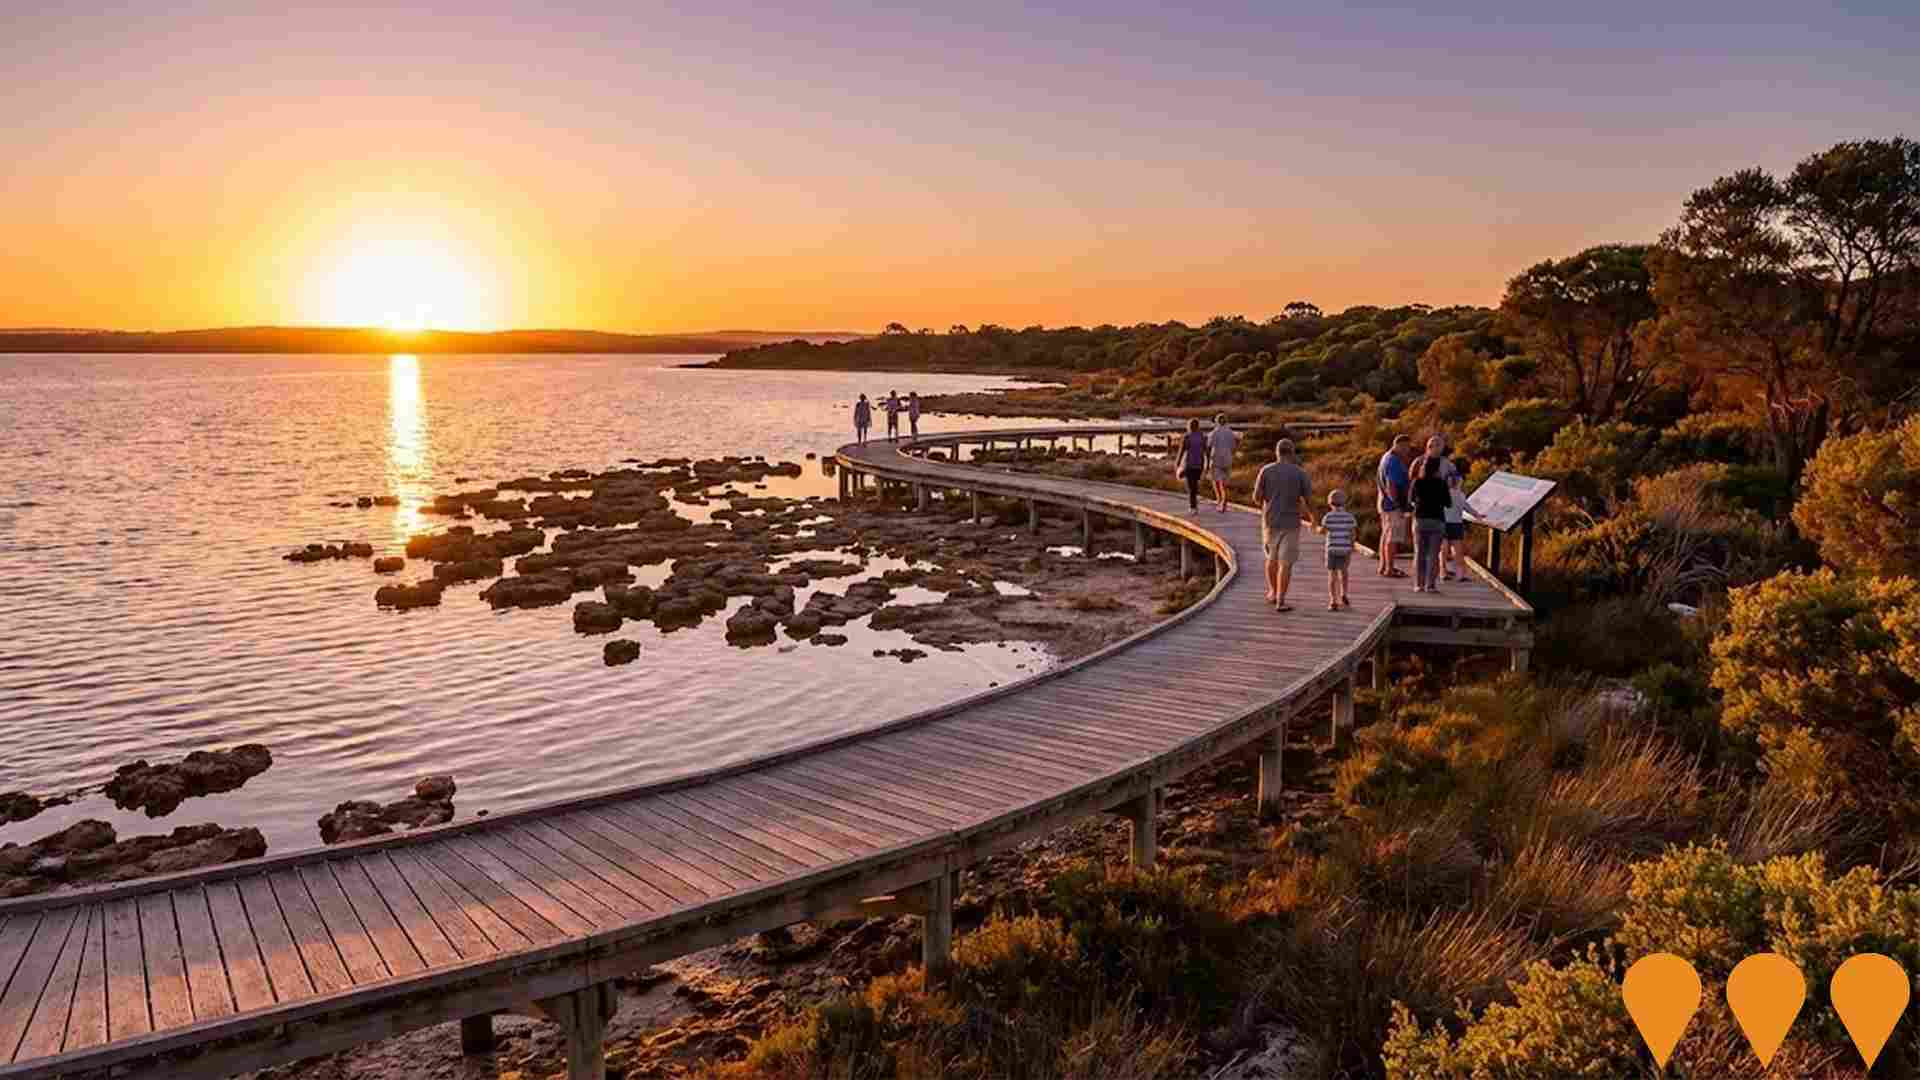
Yalgorup National Park Eco-Tourism Development
Eco-tourism development within Yalgorup National Park featuring sustainable visitor facilities, interpretive centers, environmentally sustainable trails, accommodation, and enhanced access to natural attractions including Lake Clifton thrombolites, aiming to position the park as a premier destination for nature-based tourism.
Employment
The labour market in Falcon - Wannanup shows considerable strength compared to most other Australian regions
Falcon-Wannanup has a balanced workforce with strong representation in manufacturing and industrial sectors. Its unemployment rate is 2.7%, lower than Greater Perth's 4.0%.
Employment growth over the past year was estimated at 9.2%. As of September 2025, 5,024 residents are employed, with an unemployment rate of 1.2% below Greater Perth's rate. Workforce participation is significantly lower at 52.3%, compared to Greater Perth's 65.2%. Key industries include health care & social assistance, mining, and construction.
Mining employment share is 1.8 times the regional level, while professional & technical services employ only 3.6% of local workers, below Greater Perth's 8.2%. Over the year to September 2025, employment increased by 9.2%, but unemployment rose slightly due to a higher labour force increase of 9.5%. In contrast, Greater Perth saw lower employment and labour force growth rates, with marginal unemployment change. Statewide in WA, employment contracted by 0.27% over the year to 25-Nov, losing 5,520 jobs, with an unemployment rate of 4.6%, slightly higher than the national rate of 4.3%. National employment forecasts from May-25 project a 6.6% increase over five years and 13.7% over ten years. Applying these projections to Falcon-Wannanup's employment mix suggests local employment could grow by 5.6% over five years and 12.3% over ten years, though this is a simplified extrapolation for illustrative purposes only.
Frequently Asked Questions - Employment
Income
The area's income profile falls below national averages based on AreaSearch analysis
AreaSearch's latest postcode level ATO data for financial year ended June 2022 shows median income in Falcon - Wannanup SA2 was $53,658 and average income was $75,666. In comparison, Greater Perth had a median income of $58,380 and an average income of $78,020. Based on Wage Price Index growth of 14.2% since June 2022, estimated incomes for September 2025 would be approximately $61,277 (median) and $86,411 (average). According to Census 2021 income data, Falcon - Wannanup's household, family and personal incomes all fall between the 18th and 19th percentiles nationally. Income distribution shows that 26.0% of residents (2,855 people) earn within the $1,500 - 2,999 bracket, aligning with surrounding regions at 32.0%. Housing affordability pressures are severe in Falcon - Wannanup, with only 83.3% of income remaining after housing costs, ranking at the 19th percentile nationally.
Frequently Asked Questions - Income
Housing
Falcon - Wannanup is characterized by a predominantly suburban housing profile, with above-average rates of outright home ownership
Falcon-Wannanup's dwelling structure, as per the latest Census, had 93.1% houses and 6.9% other dwellings (semi-detached, apartments, 'other' dwellings). Perth metro, in comparison, had 85.0% houses and 15.0% other dwellings. Home ownership in Falcon-Wannanup stood at 41.5%, with mortgaged dwellings at 36.3% and rented ones at 22.2%. The median monthly mortgage repayment was $1,733, aligning with Perth metro's average. Median weekly rent was $320, compared to Perth metro's $300. Nationally, Falcon-Wannanup's mortgage repayments were lower than the Australian average of $1,863, and rents were substantially below the national figure of $375.
Frequently Asked Questions - Housing
Household Composition
Falcon - Wannanup has a typical household mix, with a lower-than-average median household size
Family households account for 71.9 percent of all households, including 23.8 percent couples with children, 36.6 percent couples without children, and 10.8 percent single parent families. Non-family households constitute the remaining 28.1 percent, with lone person households at 25.8 percent and group households comprising 2.2 percent of the total. The median household size is 2.3 people, which is smaller than the Greater Perth average of 2.4.
Frequently Asked Questions - Households
Local Schools & Education
Educational outcomes in Falcon - Wannanup fall within the lower quartile nationally, indicating opportunities for improvement in qualification attainment
The area has university qualification rates of 15.1%, significantly lower than the Australian average of 30.4%. This presents both a challenge and an opportunity for targeted educational initiatives. Bachelor degrees are the most common at 11.1%, followed by graduate diplomas (2.1%) and postgraduate qualifications (1.9%). Trade and technical skills are prominent, with 43.7% of residents aged 15+ holding vocational credentials - advanced diplomas (11.4%) and certificates (32.3%).
A substantial 24.2% of the population is actively pursuing formal education, including 8.8% in primary, 7.2% in secondary, and 2.9% in tertiary education.
Frequently Asked Questions - Education
Schools Detail
Nearby Services & Amenities
Transport
Transport servicing is low compared to other areas nationally based on assessment of service frequency, route connectivity and accessibility
Falcon-Wannanup has 69 active public transport stops, all of which are bus stops. These stops are served by six different routes that together facilitate 609 weekly passenger trips. The area's transport accessibility is considered good, with residents typically located 229 meters from the nearest stop.
On average, there are 87 trips per day across all routes, equating to roughly eight weekly trips per individual stop.
Frequently Asked Questions - Transport
Transport Stops Detail
Health
Health performance in Falcon - Wannanup is lower than average with common health conditions somewhat prevalent across both younger and older age cohorts
Falcon-Wannanup faces significant health challenges with common health conditions prevalent across both younger and older age cohorts. The rate of private health cover is very high at approximately 57%, or about 6,271 people, compared to 54.9% across Greater Perth.
The most common medical conditions in the area are arthritis and mental health issues, impacting 10.6% and 8.0% of residents respectively, while 65.3% declare themselves completely clear of medical ailments compared to 63.6% across Greater Perth. As of 2016, the area has 31.6%, or about 3,469 people, aged 65 and over, which is higher than the 27.5% in Greater Perth. Health outcomes among seniors are above average, performing even better than the general population in health metrics.
Frequently Asked Questions - Health
Cultural Diversity
Falcon - Wannanup ranks below the Australian average when compared to other local markets across a number of language and cultural background related metrics
Falcon-Wannanup was found to have a below average cultural diversity, with 73.9% of its population born in Australia, 88.9% being citizens, and 95.5% speaking English only at home. Christianity is the main religion in Falcon-Wannanup, comprising 47.5% of the population. However, Judaism is overrepresented, making up 0.1% compared to 0.0% across Greater Perth.
The top three ancestry groups are English (36.7%), Australian (26.5%), and Scottish (8.3%). Notably, Welsh (1.2%) is overrepresented compared to the regional average of 0.8%, as are Maori (1.1%) and Dutch (1.8%).
Frequently Asked Questions - Diversity
Age
Falcon - Wannanup hosts an older demographic, ranking in the top quartile nationwide
Falcon - Wannanup has a median age of 49, which is higher than Greater Perth's figure of 37 and above the national average of 38. The age profile shows that those aged 65-74 years are prominent (18.1%), while those aged 25-34 years are relatively smaller (7.8%) compared to Greater Perth. This concentration of those aged 65-74 is higher than the national figure of 9.4%. Between the 2021 Census and present, the age group of 75 to 84 has grown from 7.9% to 10.9%, while the age groups of 55 to 64 have declined from 15.8% to 14.5% and those aged 45 to 54 have dropped from 12.8% to 11.6%. By 2041, demographic projections indicate significant shifts in Falcon - Wannanup's age structure. The age group of 75 to 84 is expected to grow by 81%, reaching 2,175 people from 1,200. Notably, the combined age groups of 65 and above will account for 86% of total population growth, reflecting the area's aging demographic profile. In contrast, the age groups of 0 to 4 and 35 to 44 are expected to experience population declines.
