Chart Color Schemes
This analysis uses ABS Statistical Areas Level 2 (SA2) boundaries, which can materially differ from Suburbs and Localities (SAL) even when sharing similar names.
SA2 boundaries are defined by the Australian Bureau of Statistics and are designed to represent communities for statistical reporting (e.g., census and ERP).
Suburbs and Localities (SAL) represent commonly-used suburb/locality names (postal-style areas) and may use different geographic boundaries. For comprehensive analysis, consider reviewing both boundary types if available.
est. as @ -- *
ABS ERP | -- people | --
2021 Census | -- people
Sales Activity
Curious about local property values? Filter the chart to assess the volume and appreciation (including resales) trends and regional comparisons, or scroll to the map below view this information at an individual property level.
Find a Recent Sale
Sales Detail
Population
An assessment of population growth drivers in Roleystone reveals an overall ranking slightly below national averages considering recent, and medium term trends
Roleystone's population was approximately 7,918 as of November 2025. This figure represents an increase of 675 people, a rise of 9.3% since the 2021 Census which recorded a population of 7,243. The change is inferred from ABS estimates showing a resident population of 7,711 in June 2024 and an additional 36 validated new addresses since the Census date. This results in a population density ratio of 105 persons per square kilometer. Roleystone's growth rate exceeded the national average of 8.9%, indicating it as a region leader in growth. Natural growth contributed approximately 51.5% to overall population gains during recent periods.
AreaSearch adopts ABS/Geoscience Australia projections for each SA2 area, released in 2024 with 2022 as the base year. For areas not covered by this data and post-2032 estimates, AreaSearch uses growth rates by age cohort provided by the ABS in its Greater Capital Region projections (released in 2023, based on 2022 data). Future demographic trends project above median population growth for Roleystone. Based on latest annual ERP population numbers, the area is expected to grow by 998 persons by 2041, reflecting a total gain of 9.9% over the 17-year period.
Frequently Asked Questions - Population
Development
AreaSearch analysis of residential development drivers sees Roleystone recording a relatively average level of approval activity when compared to local markets analysed countrywide
Roleystone has seen approximately 19 new homes approved annually over the past five financial years, totalling 96 homes. As of FY26, 10 approvals have been recorded. On average, each home built between FY21 and FY25 accommodates around 3.7 new residents per year. This supply lagging demand indicates heightened buyer competition and pricing pressures, with new homes being constructed at an average cost of $347,000.
In FY26, there have been $1.7 million in commercial approvals, suggesting minimal commercial development activity. Compared to Greater Perth, Roleystone shows significantly reduced construction (77.0% below regional average per person), supporting stronger demand and values for established properties. This limited new supply is also under the national average, indicating the area's established nature and potential planning limitations. Recent building activity consists solely of detached houses, maintaining Roleystone's traditional low density character focused on family homes. The estimated population per dwelling approval is 600 people, reflecting its quiet development environment.
According to AreaSearch quarterly estimates, Roleystone is projected to gain 787 residents by 2041, with construction maintaining a reasonable pace despite growing competition as population increases.
Frequently Asked Questions - Development
Infrastructure
Roleystone has emerging levels of nearby infrastructure activity, ranking in the 25thth percentile nationally
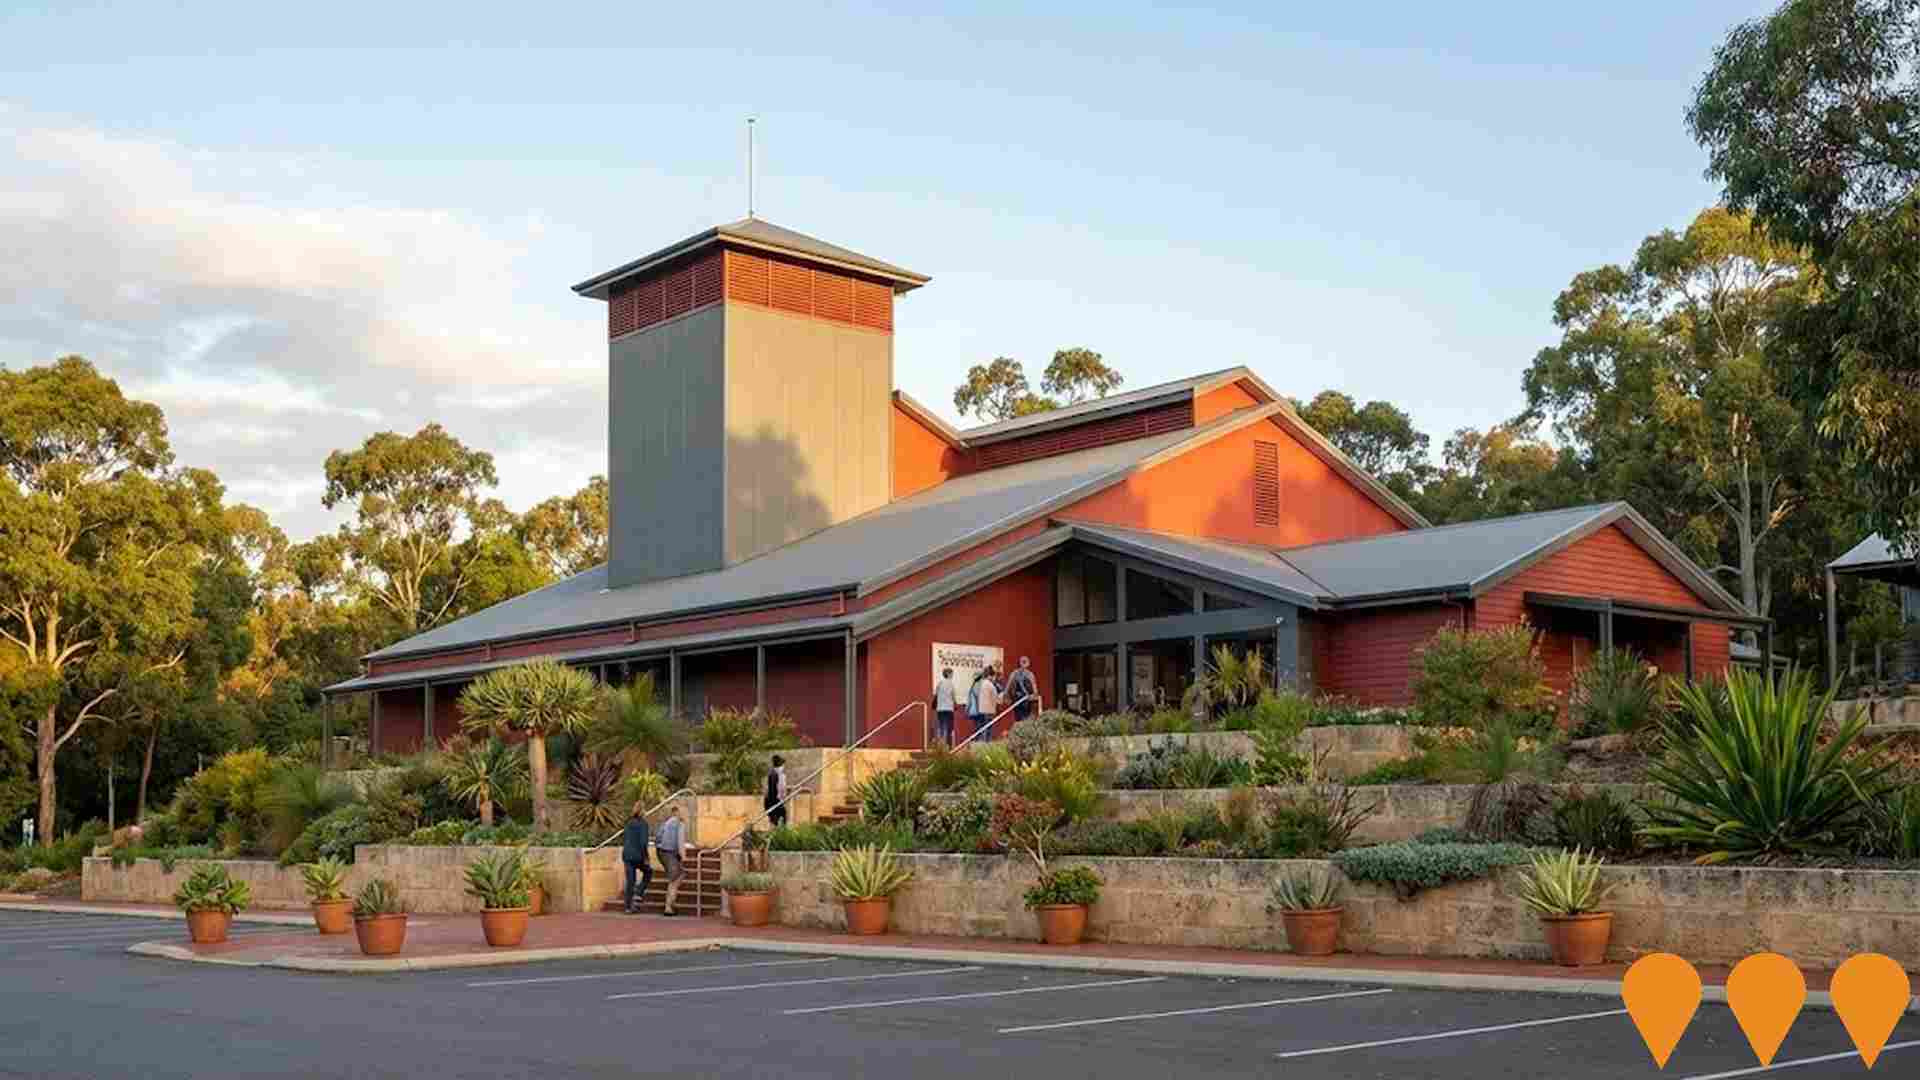
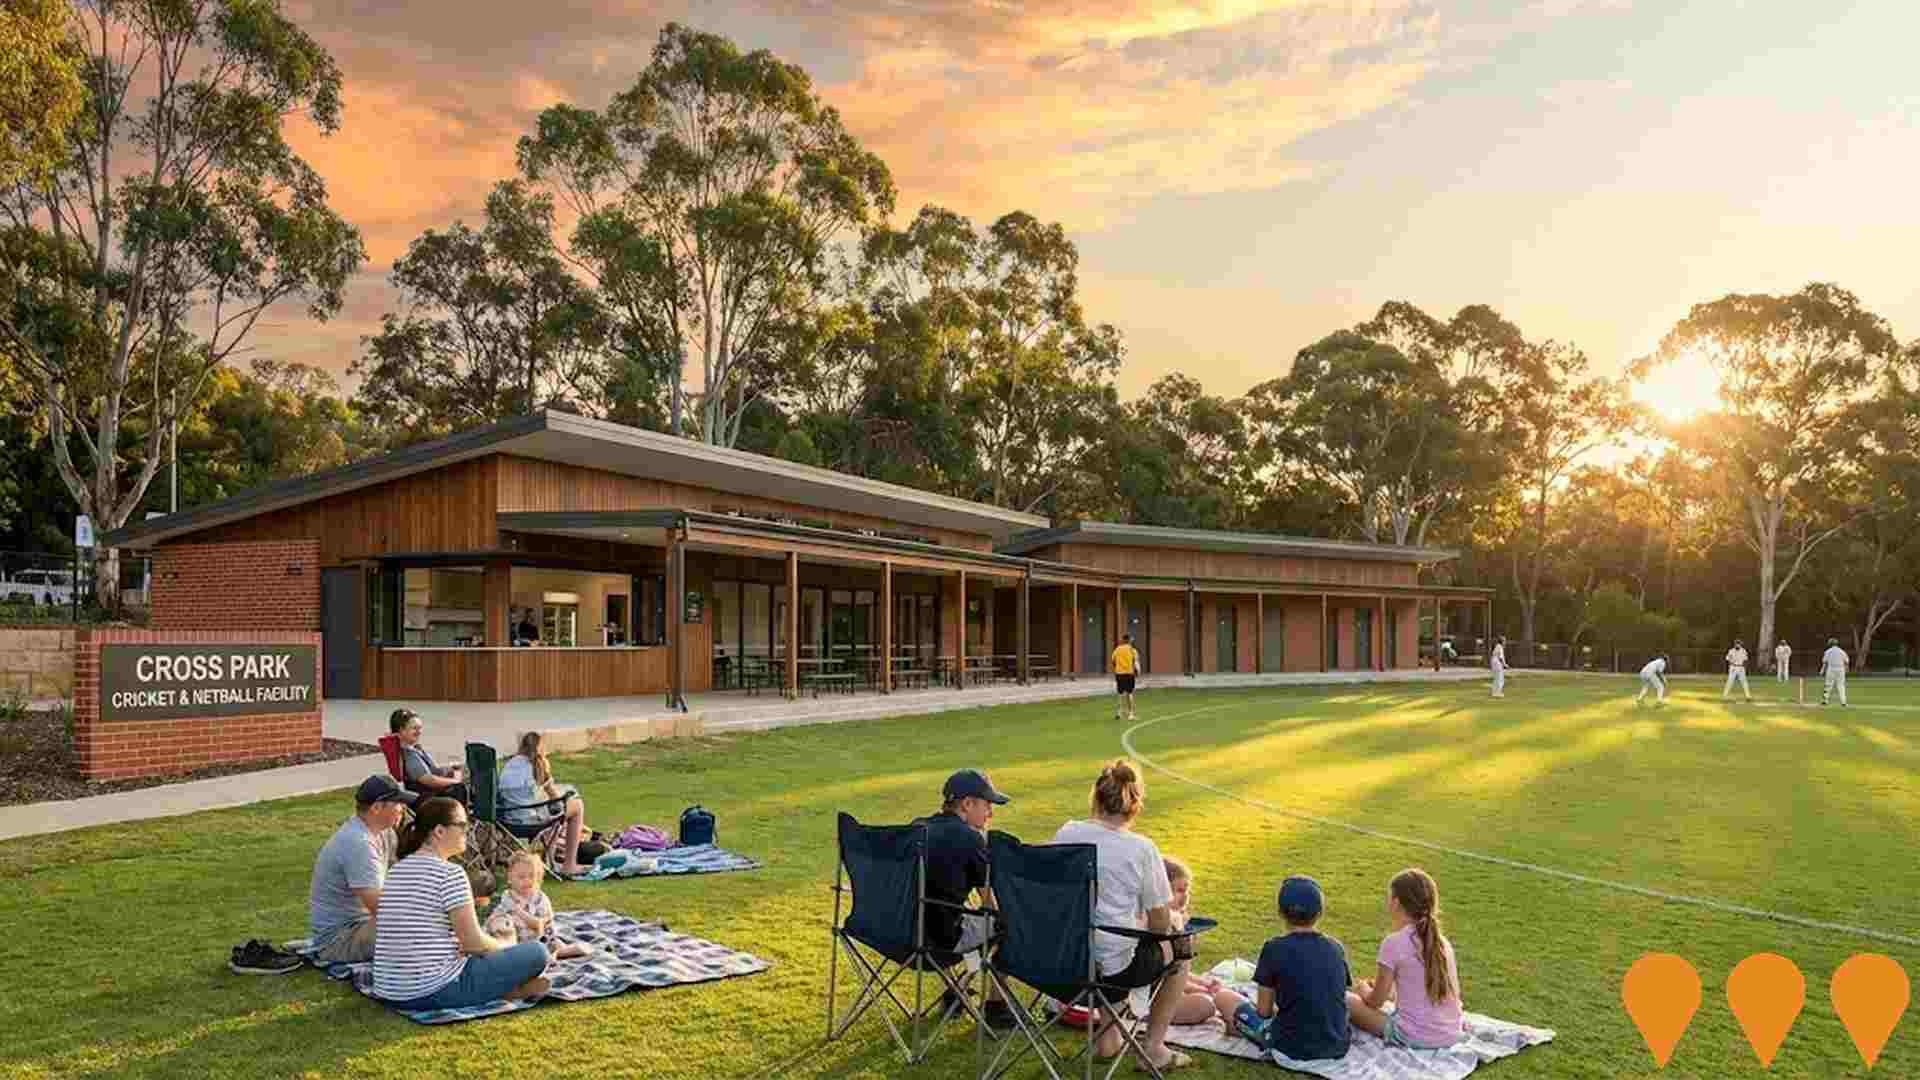
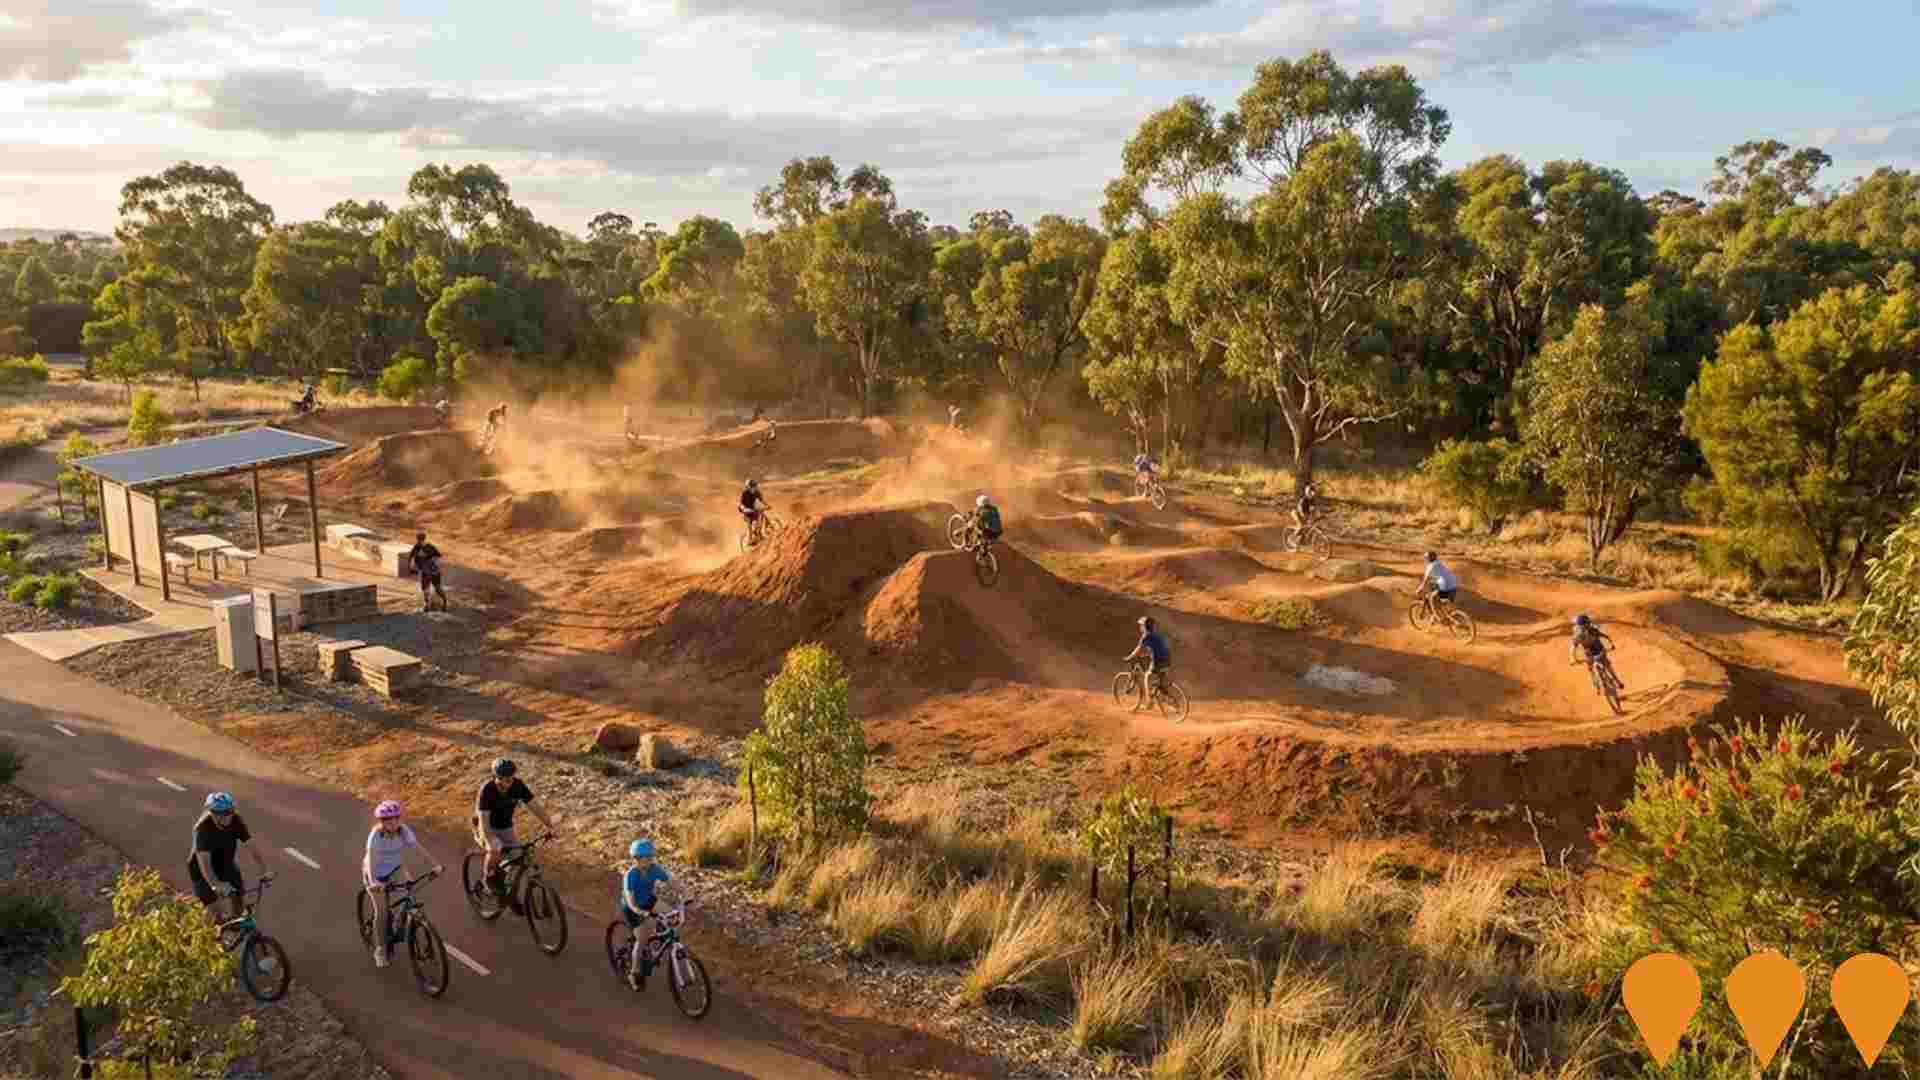
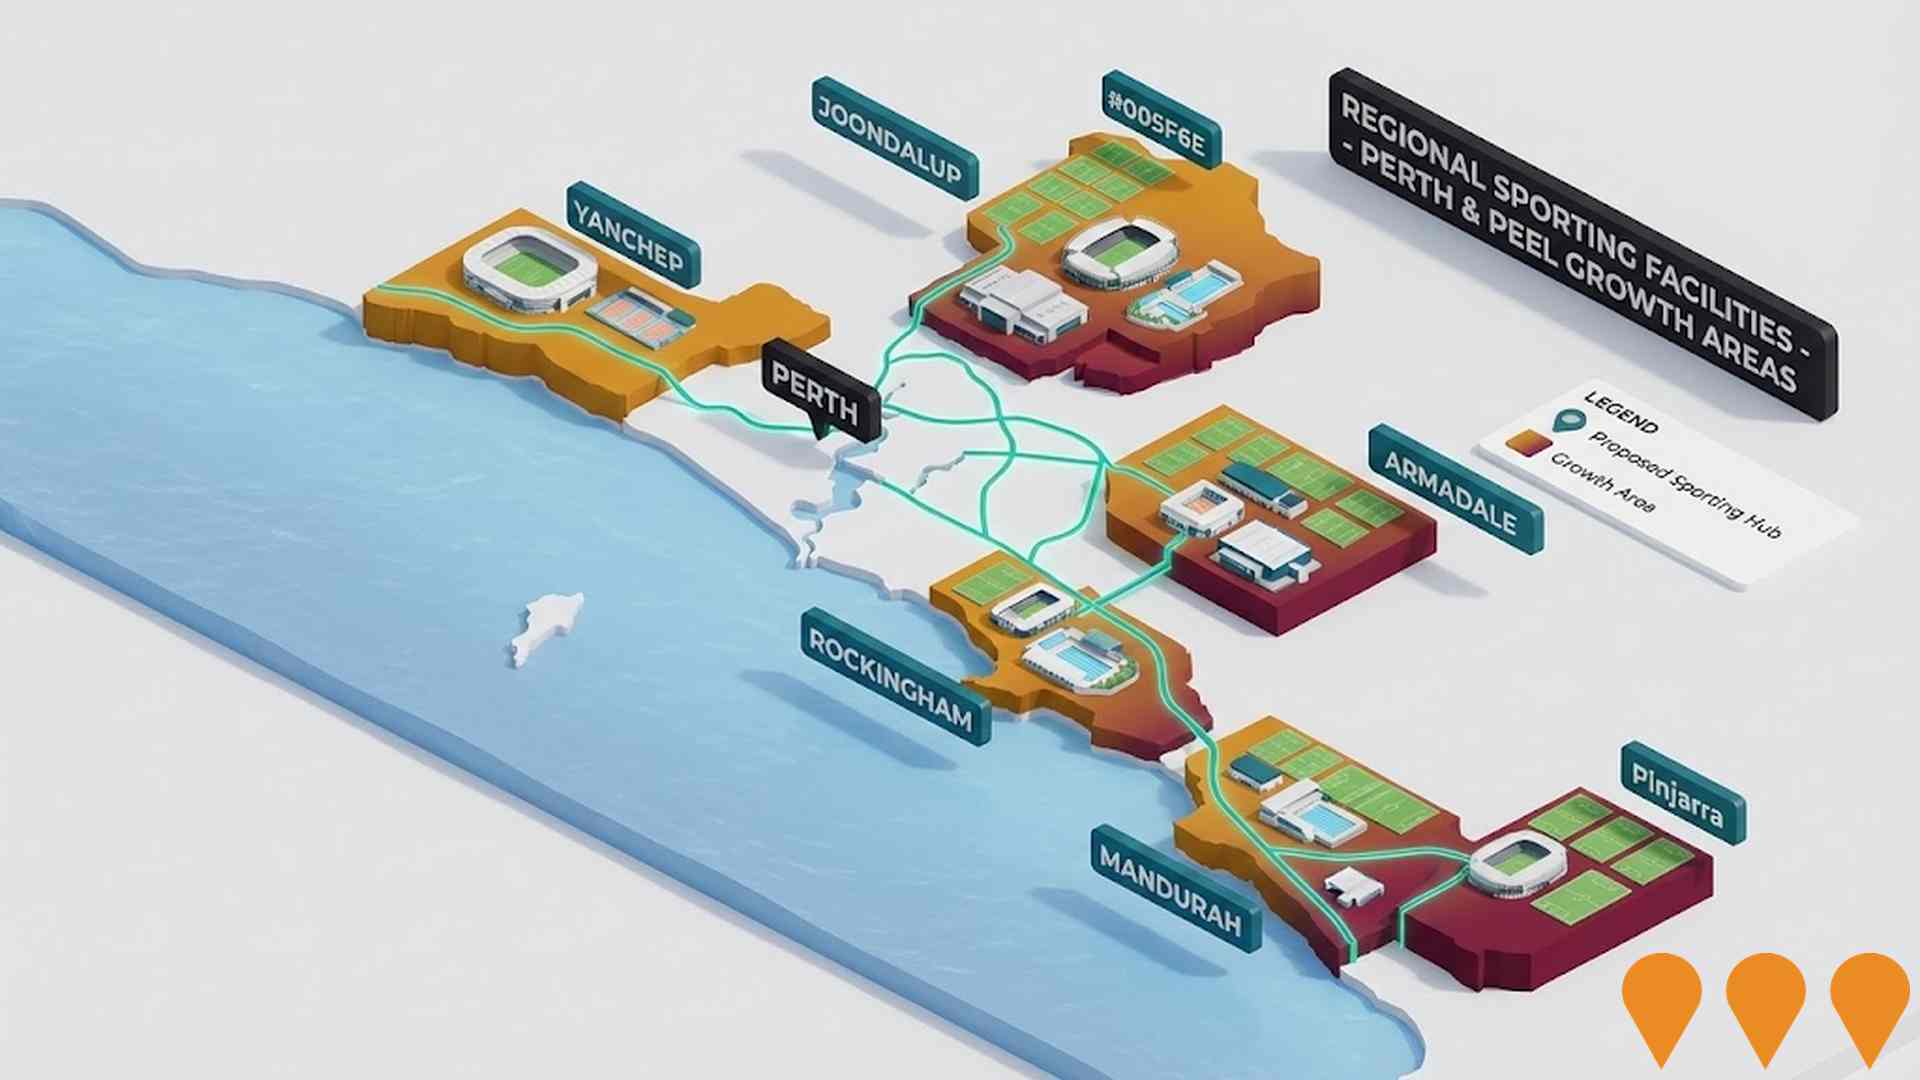
Changes to local infrastructure significantly influence an area's performance. AreaSearch has identified 11 projects that may impact this region. Notable initiatives include Cross Park Cricket and Netball Facility, Roleystone Theatre Redevelopment, Challenge Park Cycle Facility, and Forrestdale Business Park. The following list details those likely to be most relevant.
Professional plan users can use the search below to filter and access additional projects.
INFRASTRUCTURE SEARCH
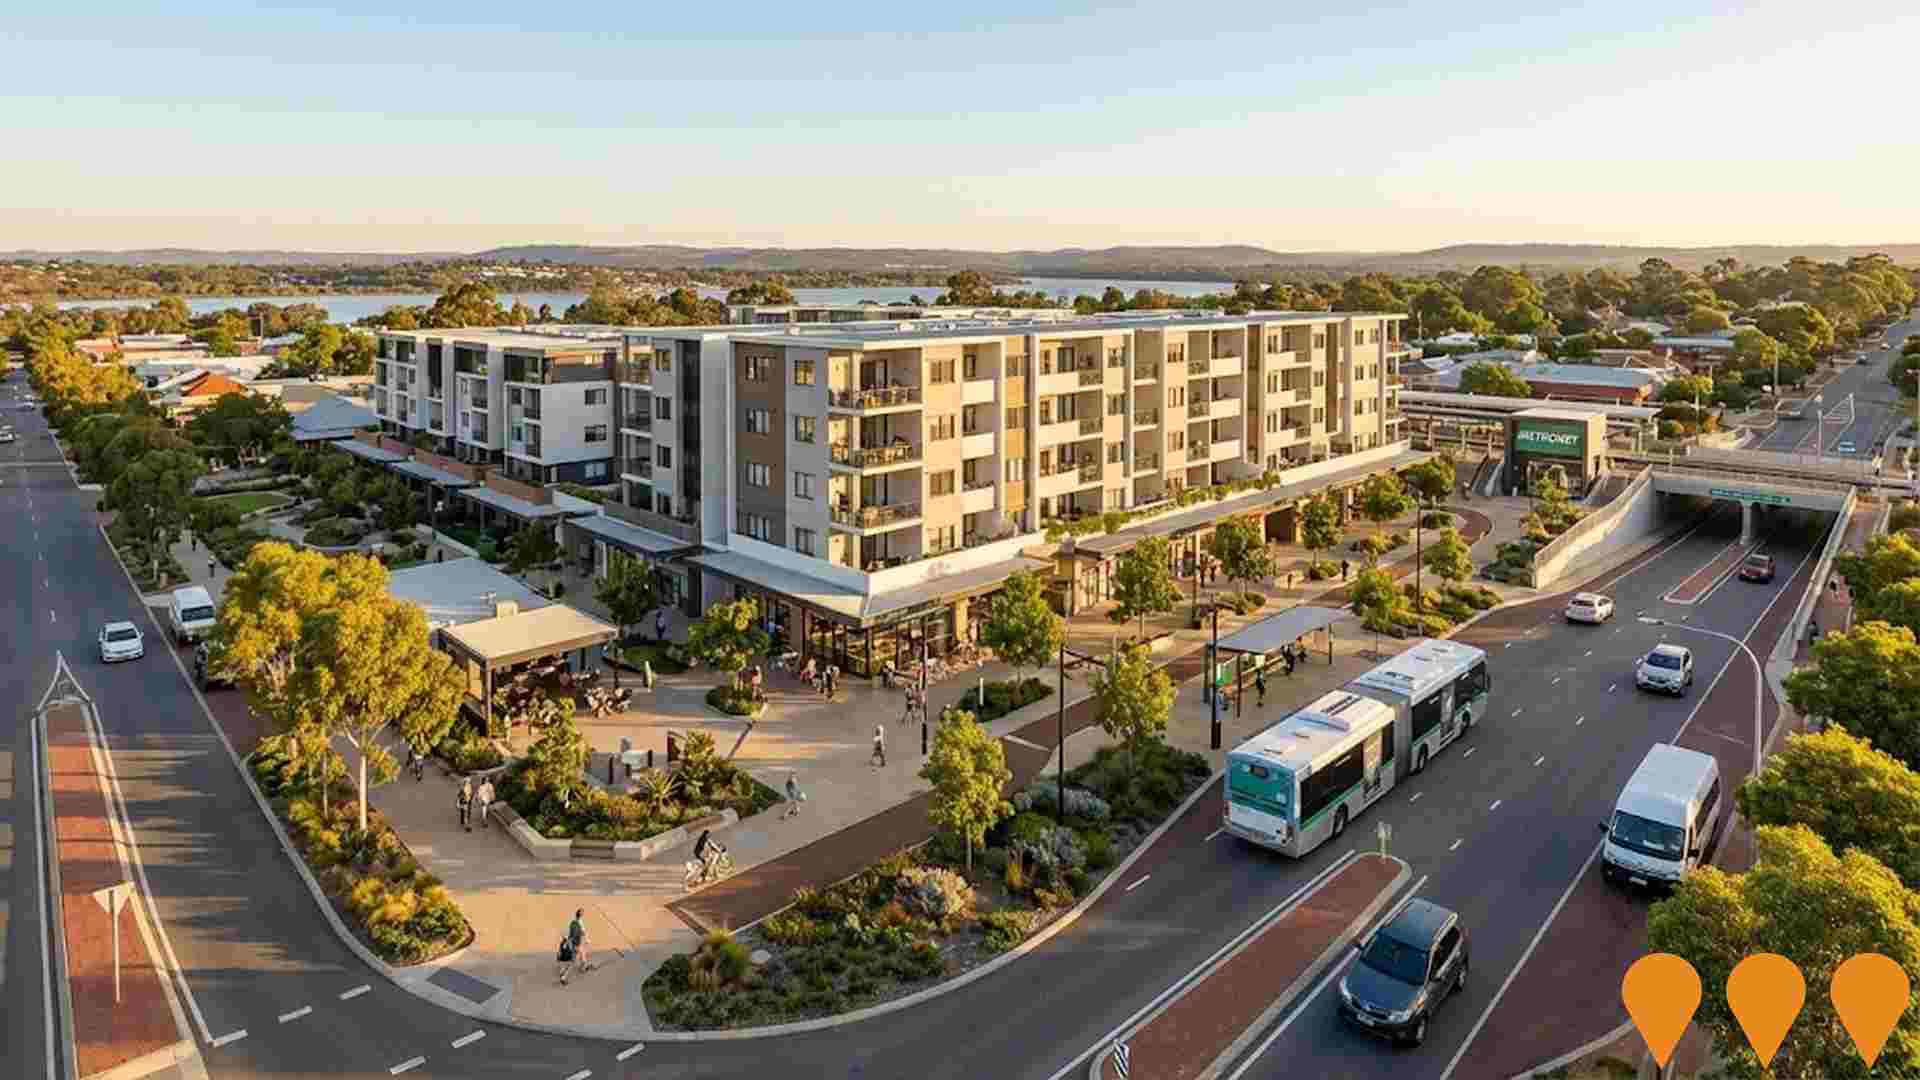
 Denotes AI-based impression for illustrative purposes only, not to be taken as definitive under any circumstances. Please follow links and conduct other investigations from the project's source for actual imagery. Developers and project owners wishing us to use original imagery please Contact Us and we will do so.
Frequently Asked Questions - Infrastructure
METRONET
METRONET is Western Australia's largest-ever public transport infrastructure program, delivering over 72 kilometres of new passenger rail and 23 new stations across the Perth metropolitan area. As of December 2025, multiple stages are complete or nearing completion: Yanchep Rail Extension (opened July 2024), Morley-Ellenbrook Line (opened December 2024), Thornlie-Cockburn Link (opened June 2025), and Byford Rail Extension (opened October 2025). Remaining projects including the Airport Line upgrades, Victoria Park-Canning Level Crossing Removal (six crossings removed by late 2025), Circle Route Bus Priority, and final stages of the Ellenbrook Line are under active construction, with the overall program on track for substantial completion by 2027-2028. The program also includes 246 locally built C-series railcars, high-capacity signalling, and extensive station precinct activation.
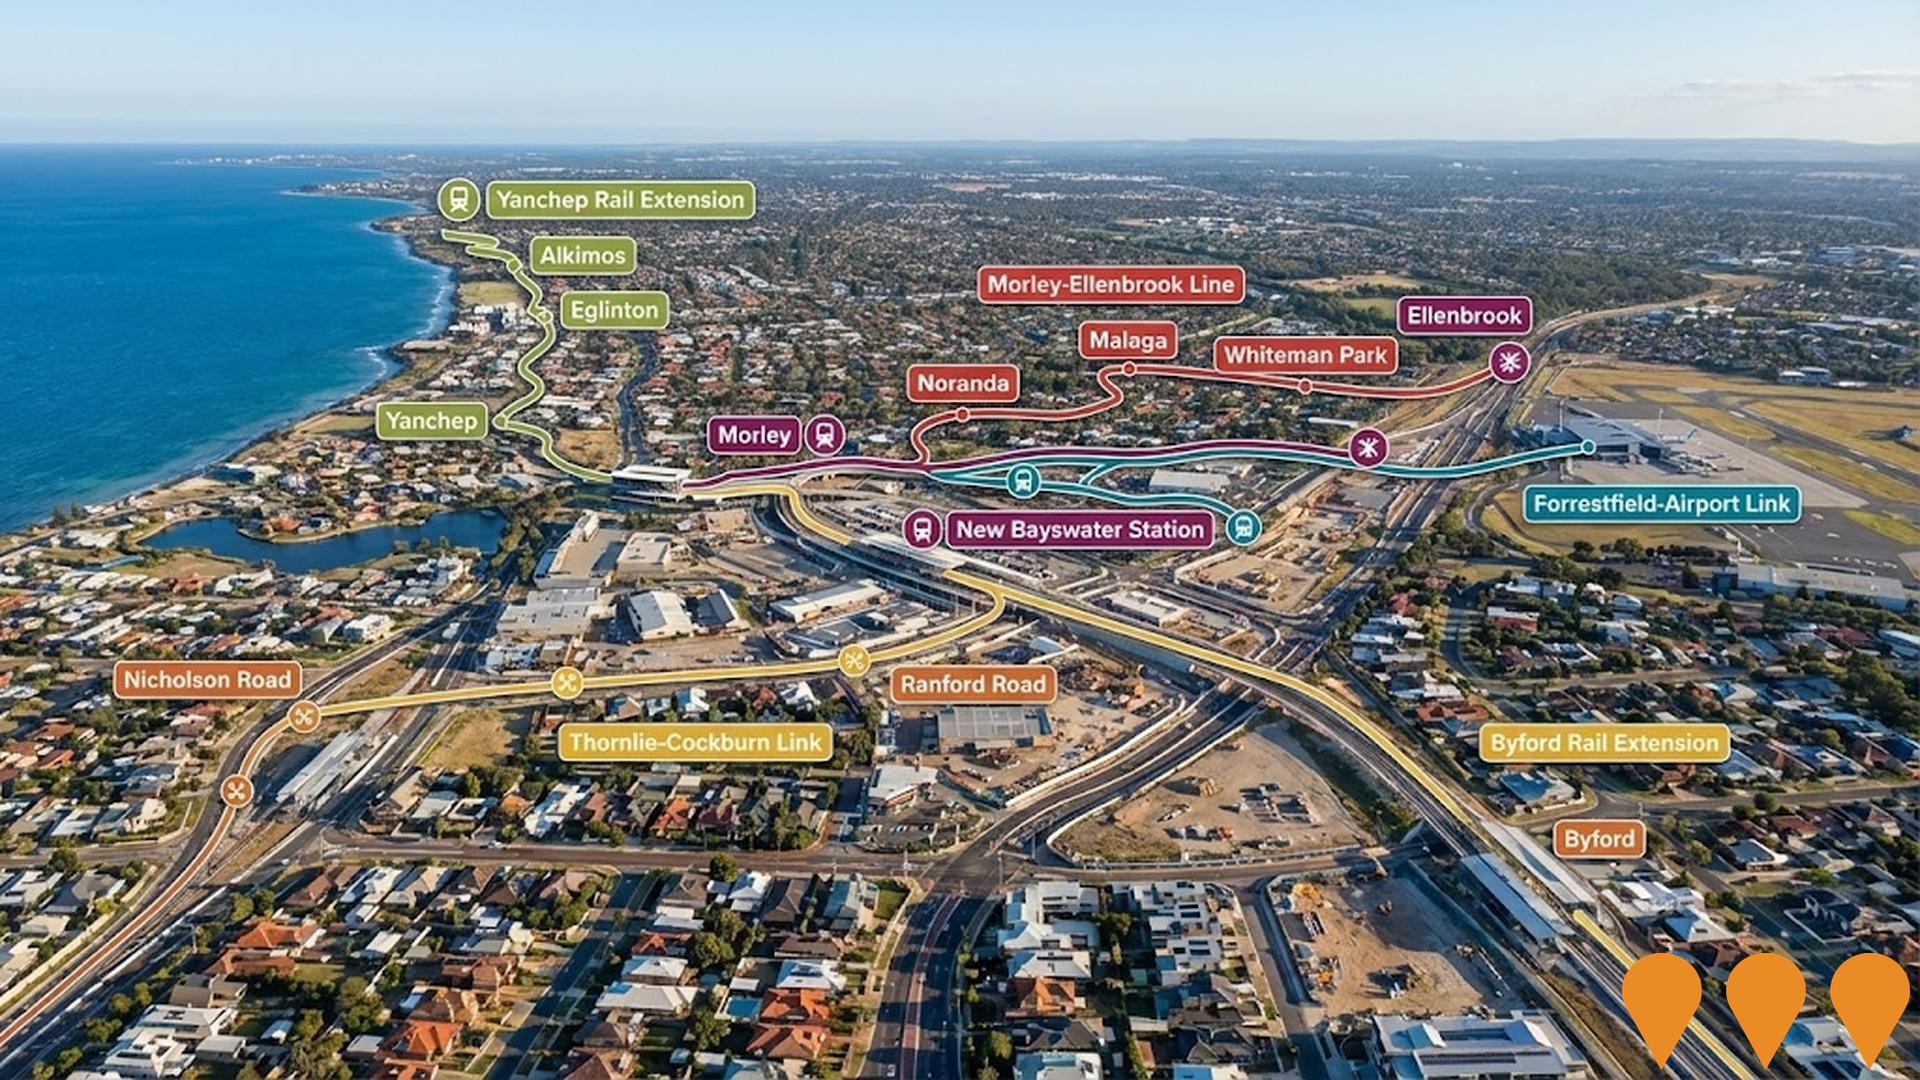
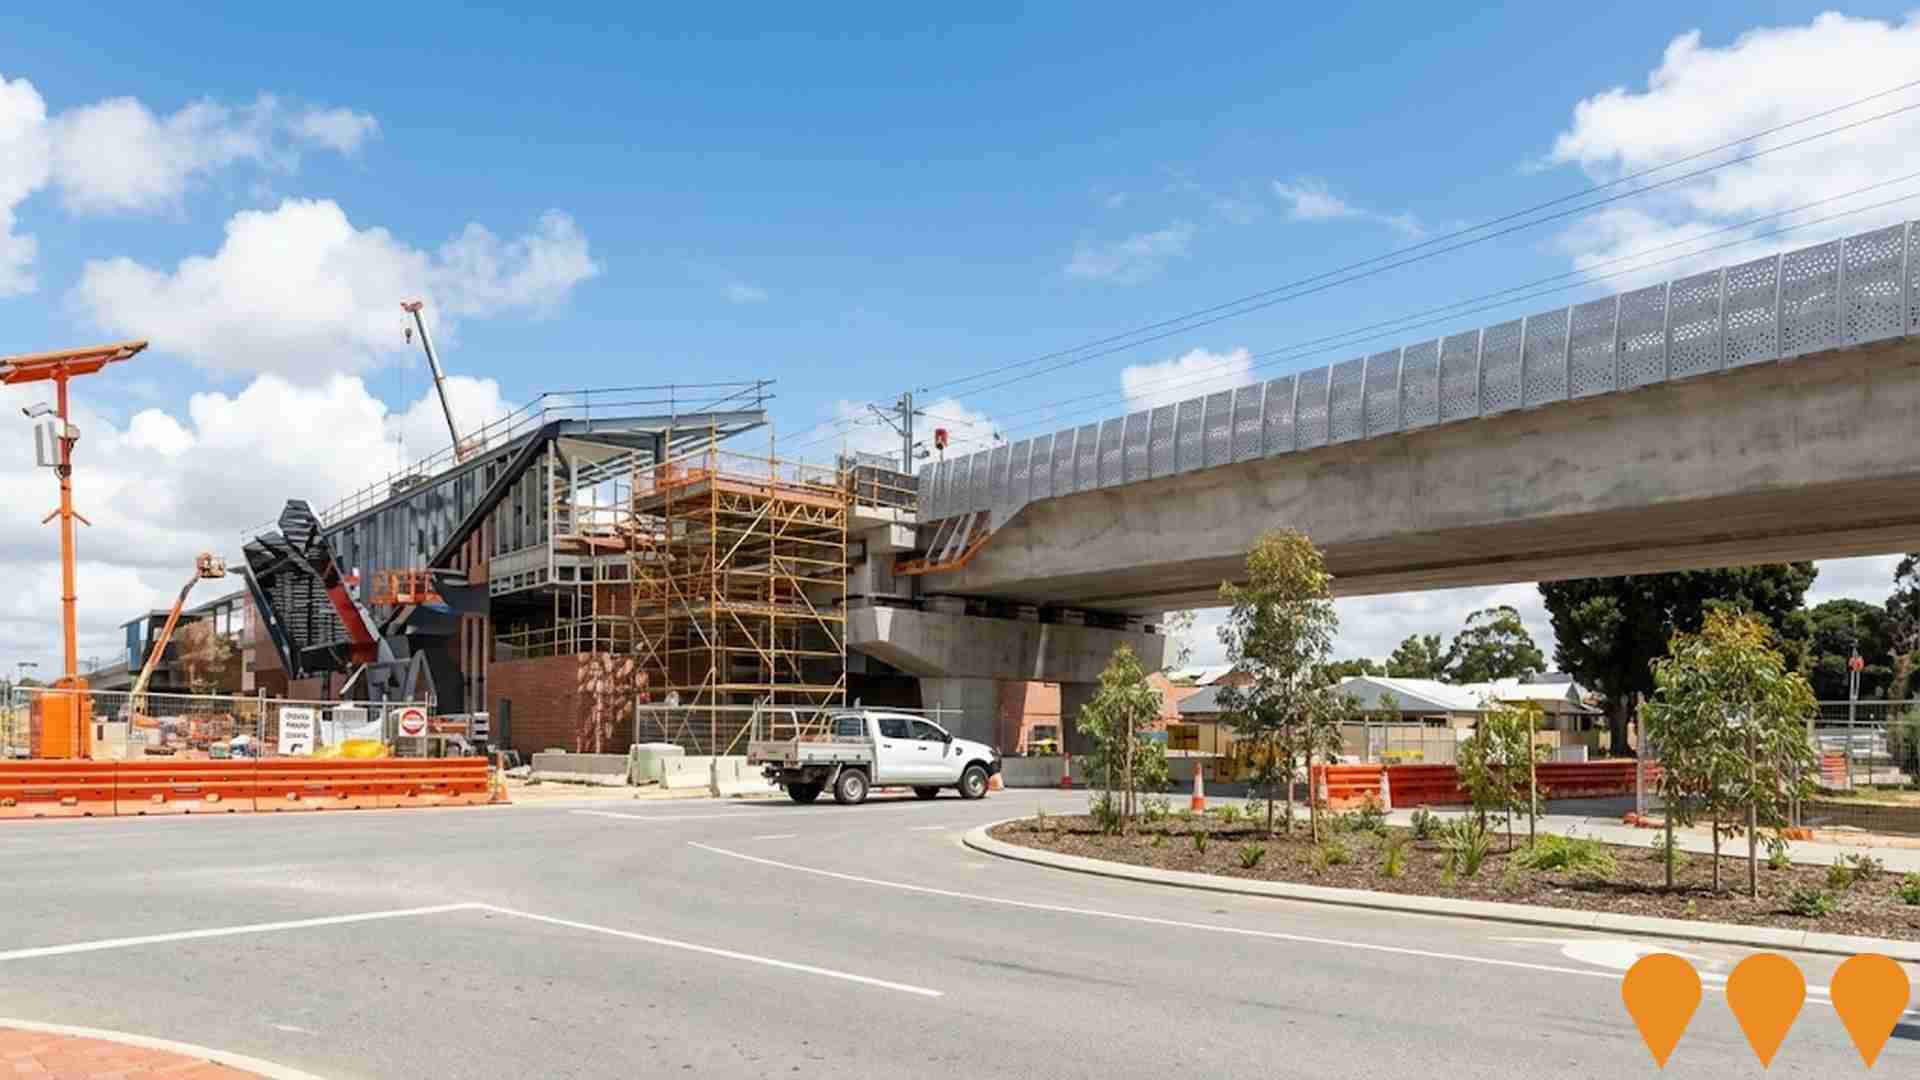
METRONET Armadale Line Transformation
Major upgrade of the Armadale passenger rail corridor in Perths south east, delivering new elevated rail, modern stations, removal of level crossings and an extension of the line from Armadale to Byford. The transformation combines the Victoria Park Canning Level Crossing Removal, Thornlie Cockburn Line and Byford Rail Extension projects to provide faster, more reliable public transport, with seven new or rebuilt stations and improved connections to the CBD and Optus Stadium. The project also delivered Long Park, a seven kilometre linear park with new community spaces, paths and public art beneath the elevated rail, and the full Armadale Line including the Byford extension reopened to passengers in October 2025.
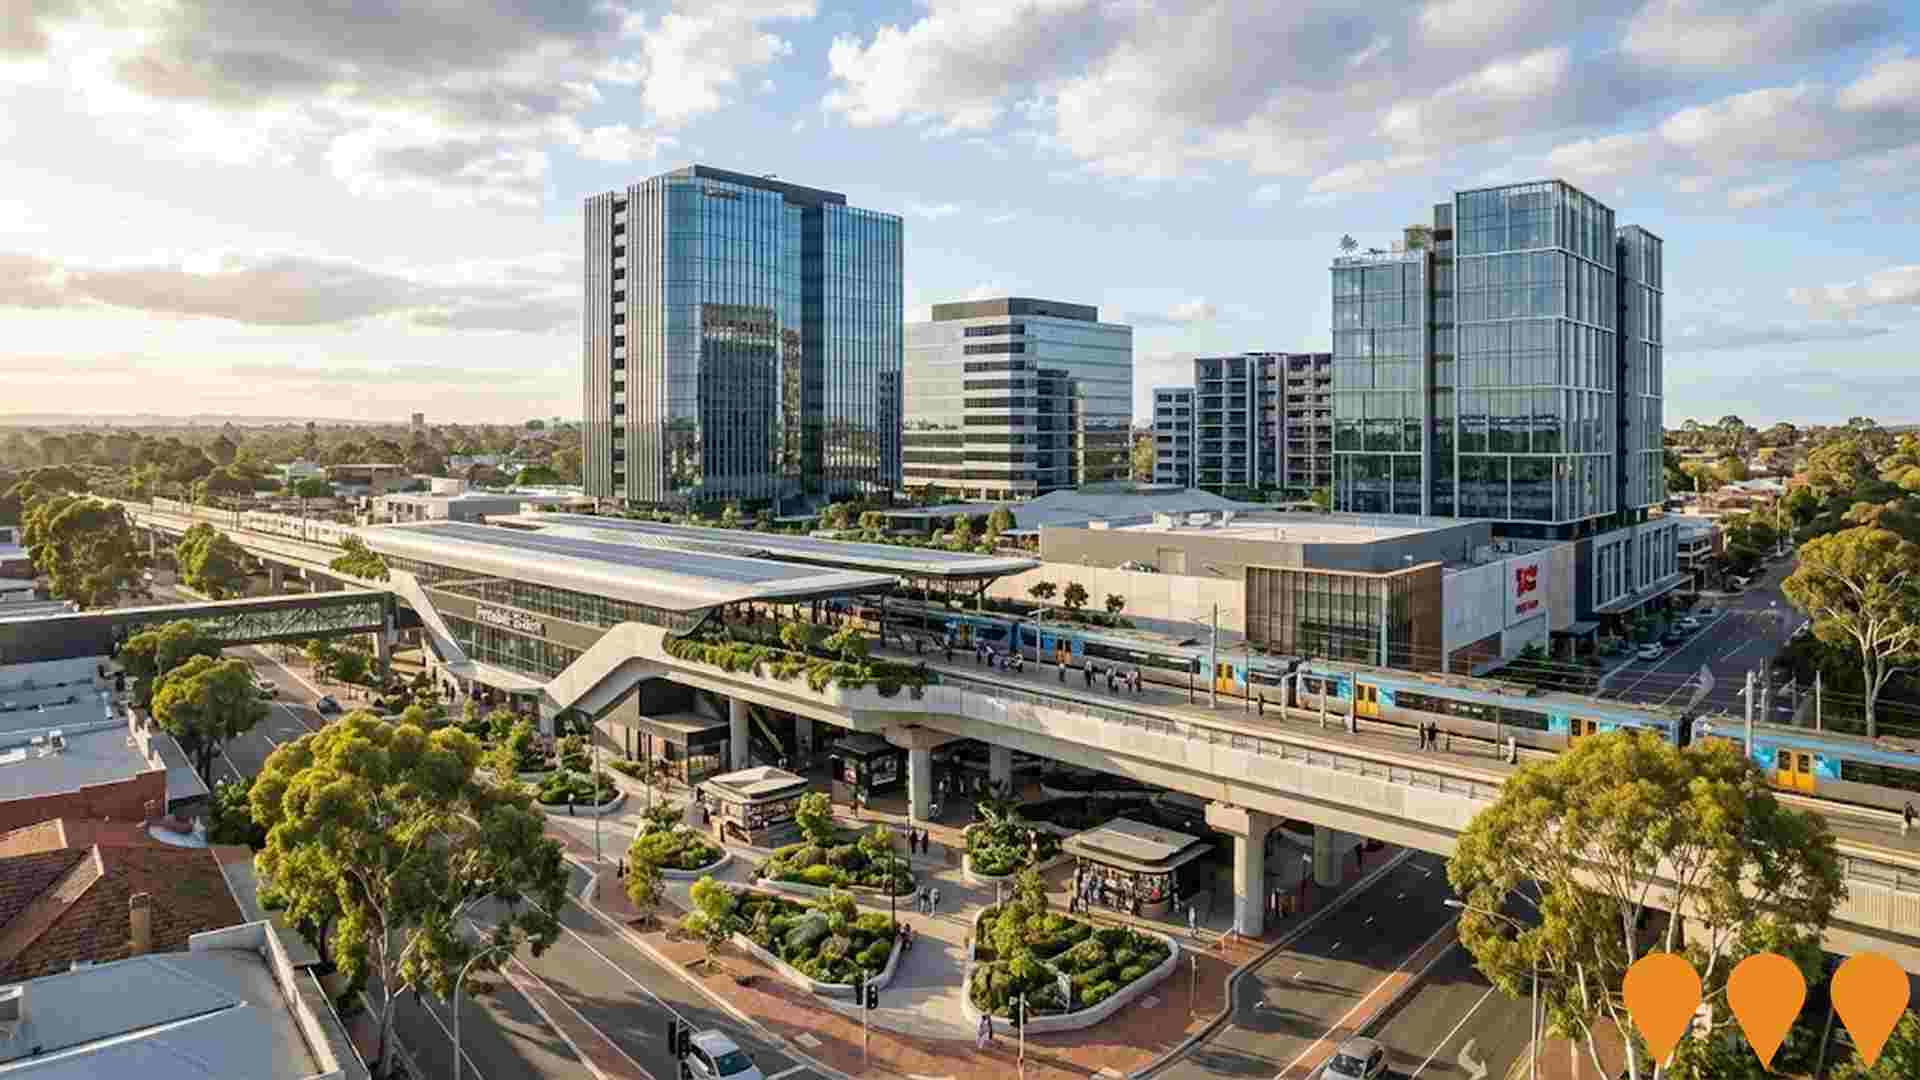
Armadale Strategic Metropolitan Centre Redevelopment
Major State Government-led transformation of Armadale into a Strategic Metropolitan Centre under the Perth and Peel @ 3.5 Million framework. Includes elevation and extension of the Armadale rail line (Byford Extension and Victoria Park-Canning Level Crossing Removal), new Armadale Station, shopping centre expansion, new cinema and entertainment precinct, central civic park, mixed-use commercial and residential towers, and significant public realm upgrades.
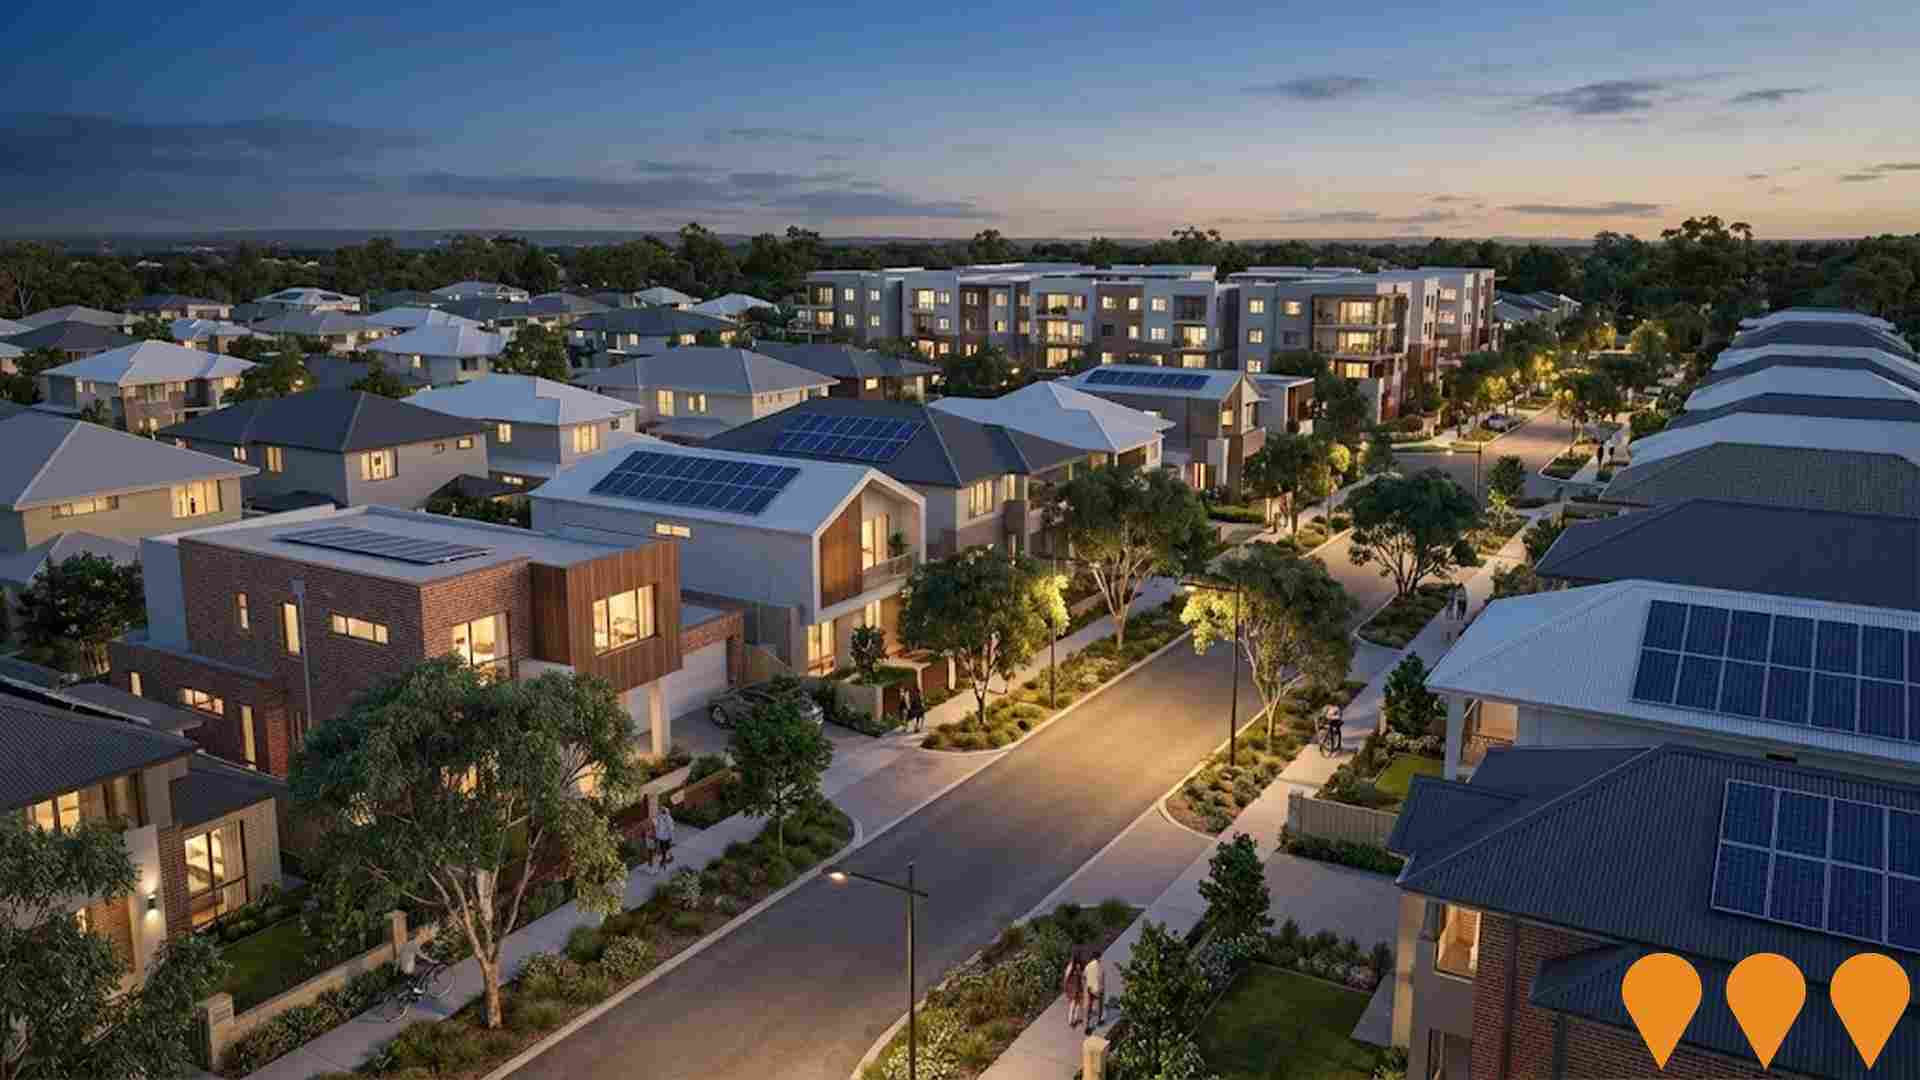
City of Gosnells Local Planning Scheme 24
Local Planning Scheme 24 is the primary statutory planning instrument for the City of Gosnells. Gazetted on 20 May 2025 and fully operational since 3 June 2025, the scheme replaces the previous Local Planning Scheme 17. It facilitates increased residential density around train stations and activity centres (especially Thornlie, Beckenham, Maddington and Gosnells), introduces transit-oriented development provisions, modernises built-form controls, strengthens bushfire and environmental protections, and adds new regulations for short-term rental accommodation. The scheme supports delivery of diverse and affordable housing in line with State planning policy.
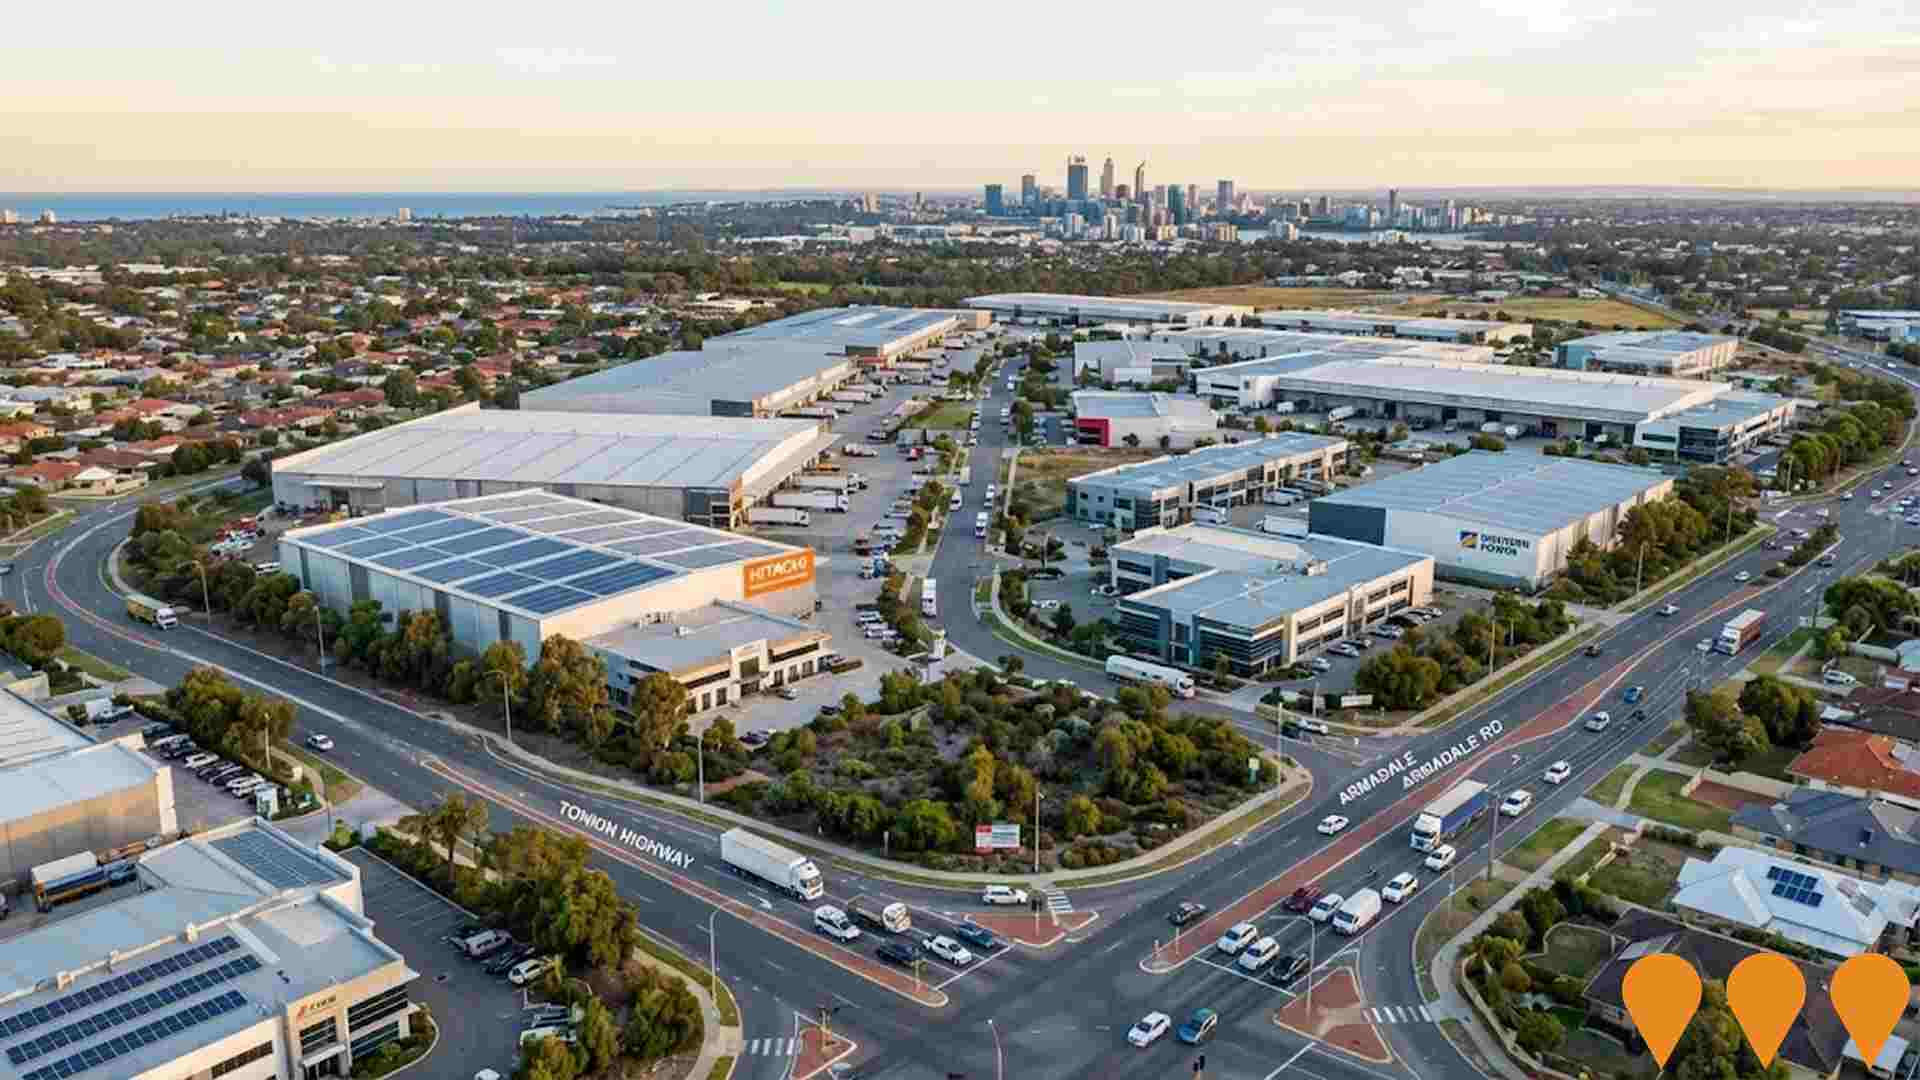
Forrestdale Business Park West
178-hectare master-planned industrial and commercial estate developed by DevelopmentWA. Offers light industry, service commercial and general industry lots with direct access to Tonkin Highway and Ranford Road. Supported by $27 million in State Government infrastructure funding. As of late 2025 approximately 35-40% of stages are sold or under development, with major occupants including Hitachi Construction Machinery, 7-Eleven, Western Power, Cleanaway and multiple other logistics and industrial businesses. Expected to deliver $816 million private investment, 4,478 ongoing jobs and $1.6 billion in annual economic output when complete.
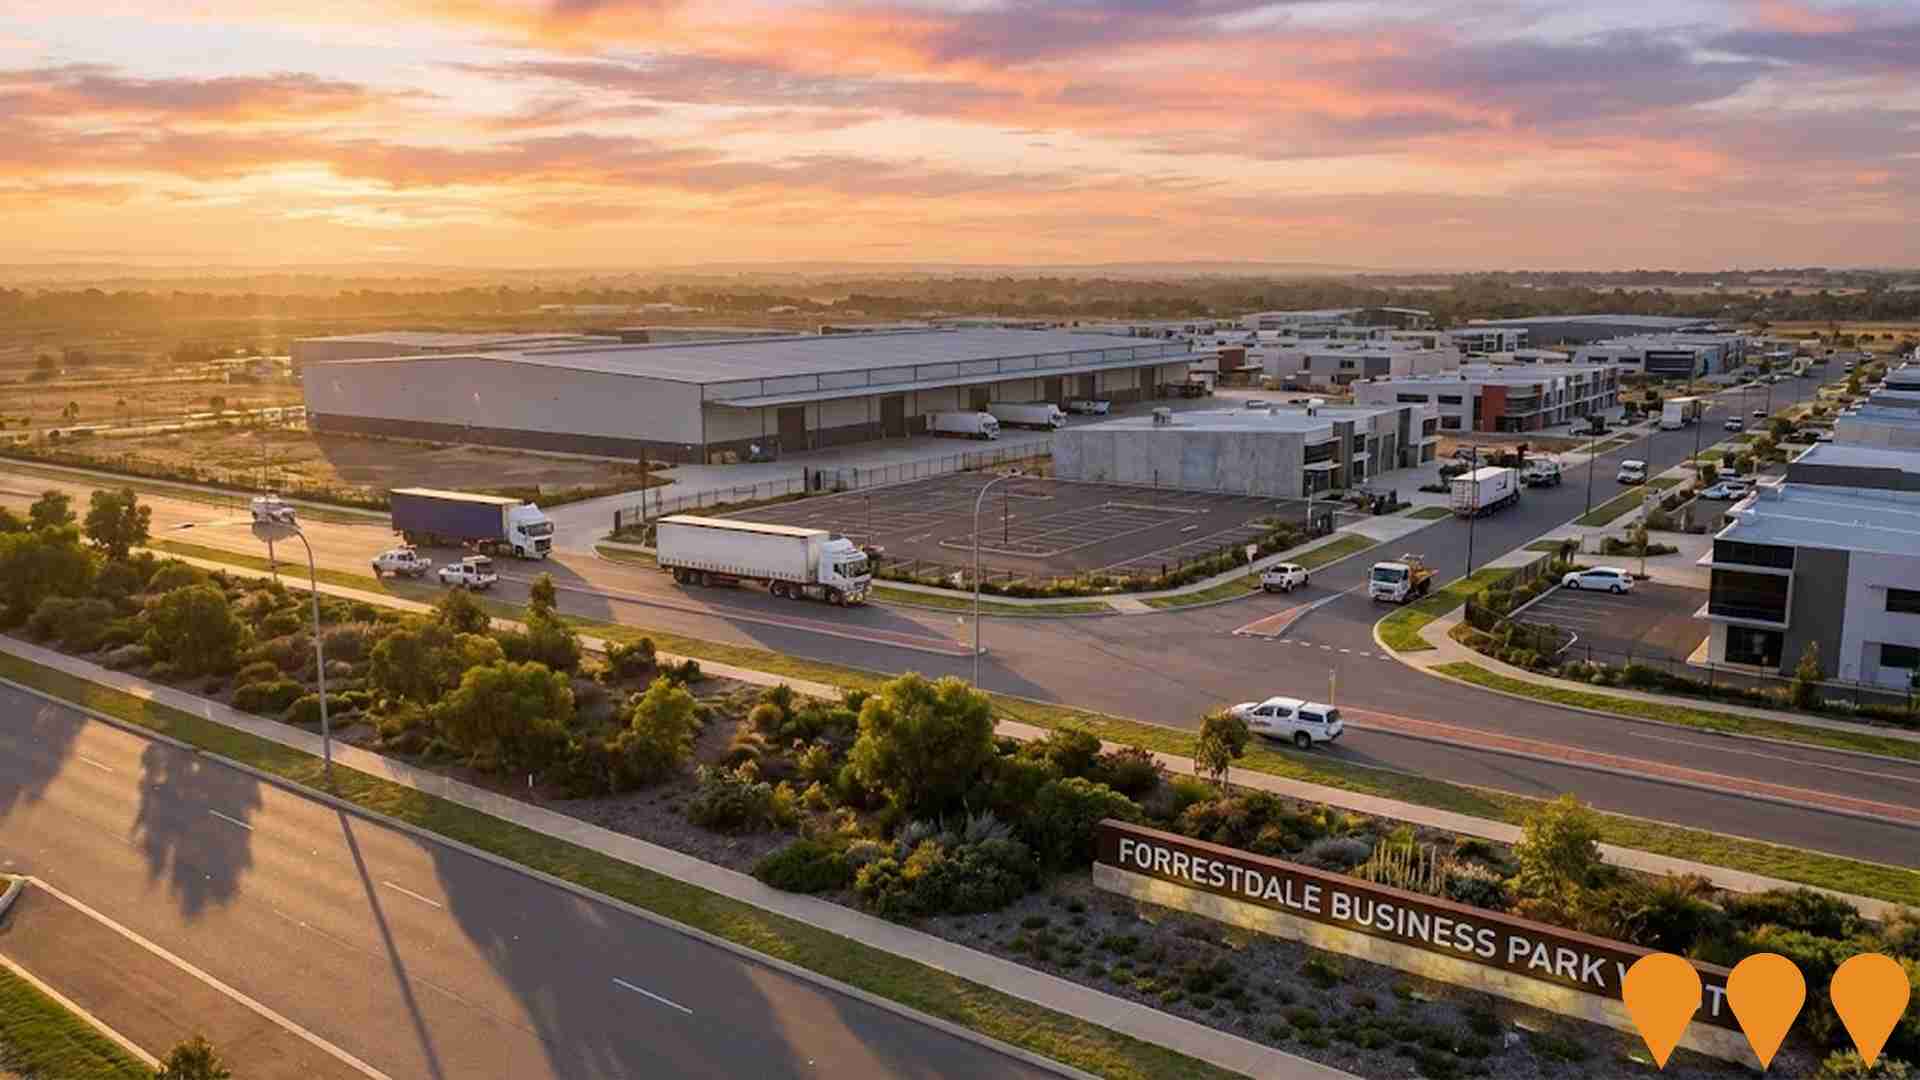
Forrestdale Business Park
A 367-hectare industrial and commercial estate (comprising Forrestdale Business Park West (178ha) and East (190ha)) in Perth's south-east, designed to attract businesses and create employment opportunities. It accommodates service industry, light and general industrial lots, with key infrastructure upgrades completed. Forrestdale Business Park West is expected to unlock $816 million in private investment and create up to 4,478 ongoing full-time jobs when fully developed. Major companies, including Hitachi Construction Machinery, Alita Constructions, and Western Power, are located here. The Transfer of Planning Authority for the East portion to the City of Armadale was finalised in 2022.
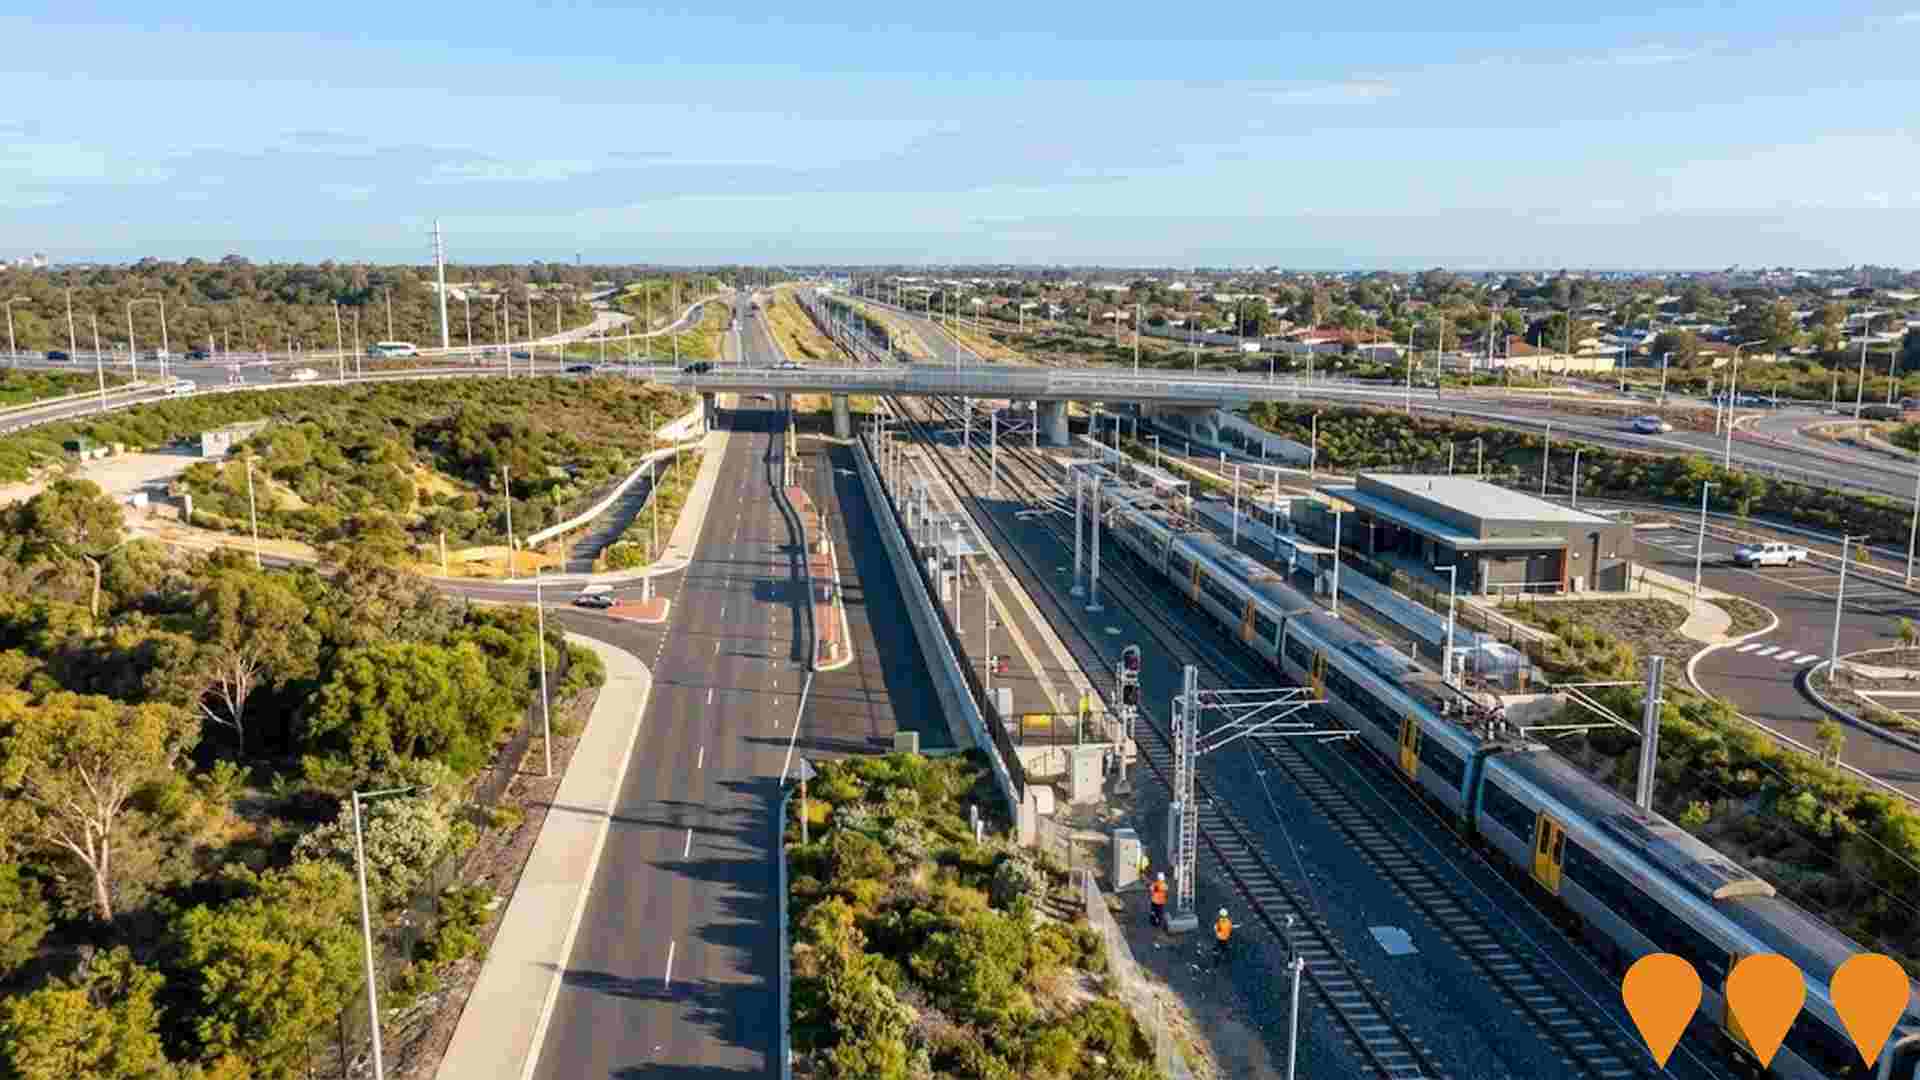
METRONET High Capacity Signalling Project
City wide upgrade of Perth's urban rail signalling and train control systems to a communications based train control automatic train control system across about 500 km of the Transperth network, increasing capacity by up to 40 percent and supporting more frequent, reliable METRONET passenger services. Works include new in cab signalling, trackside equipment, integration with the Public Transport Operations Control Centre and digital radio, delivered progressively over about a decade.
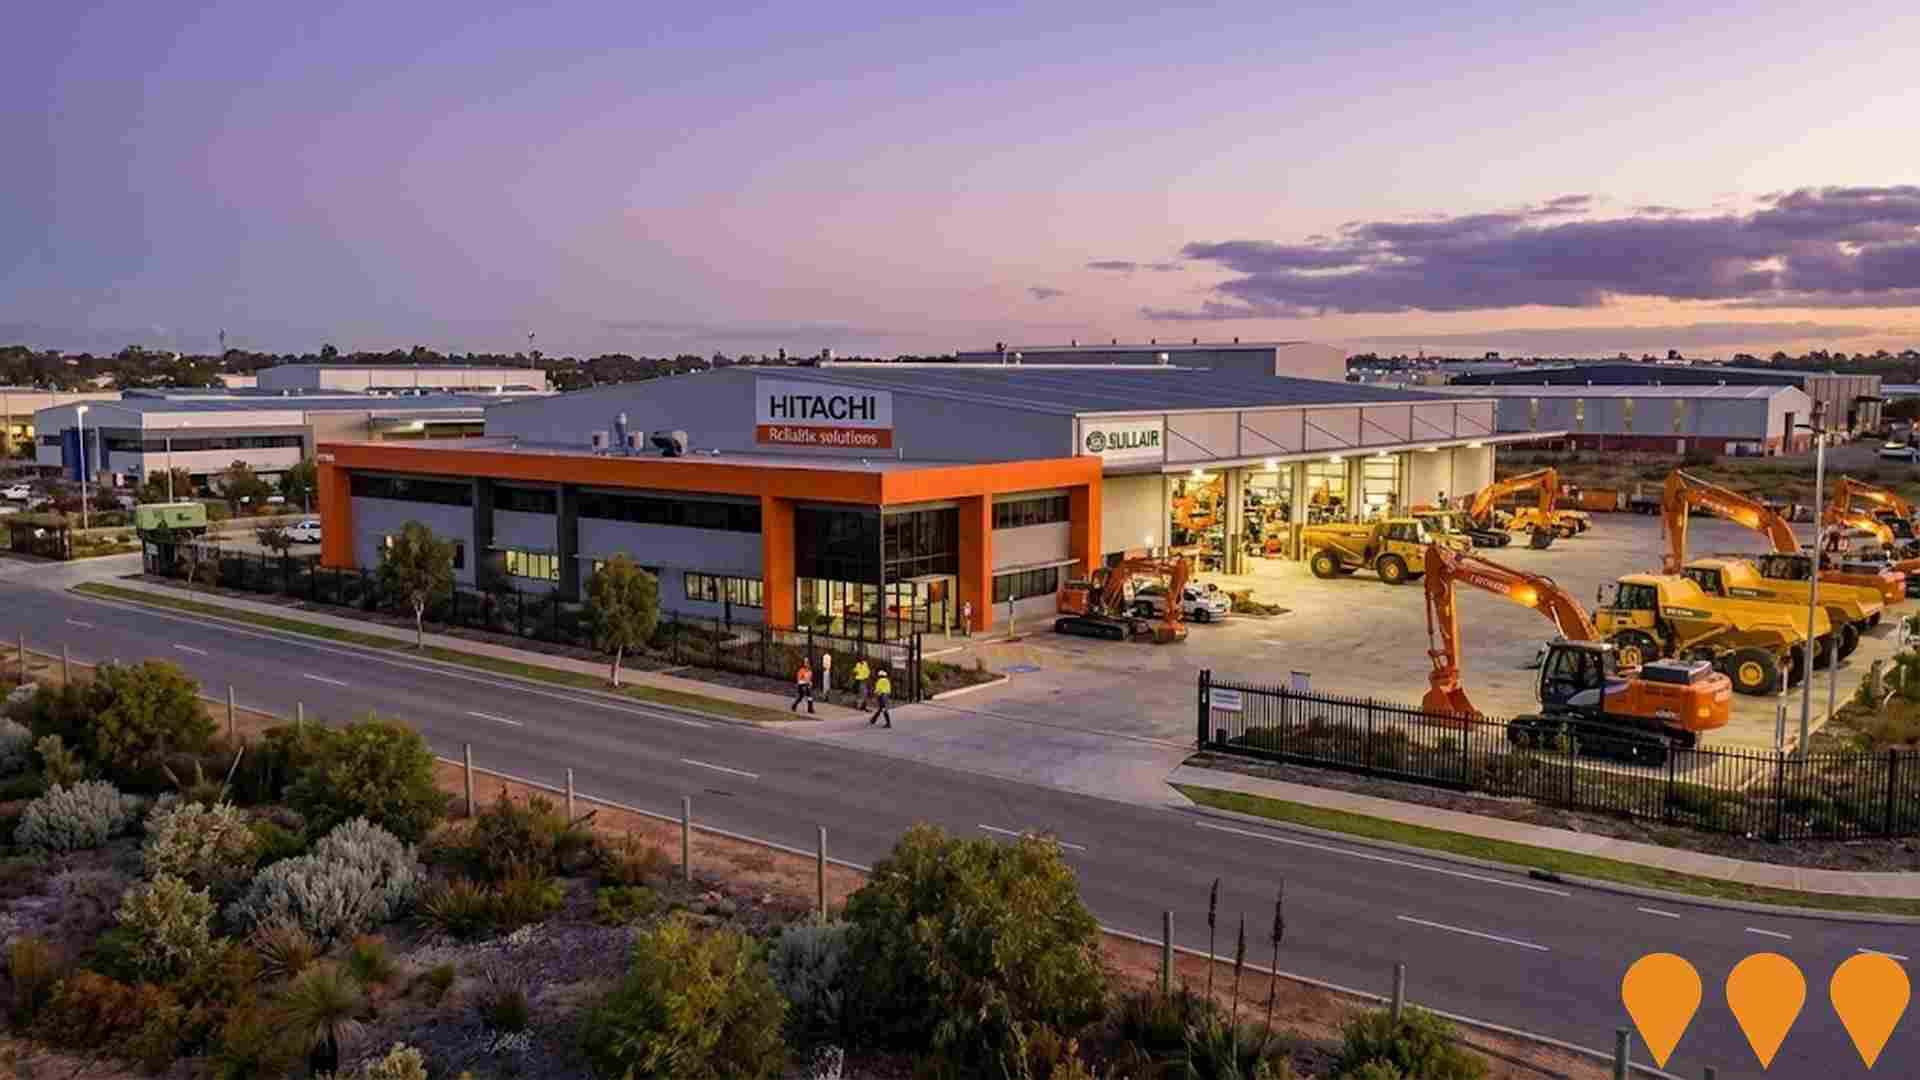
Hitachi Construction Machinery Australia Facility
Hitachi Construction Machinery Australia's headquarters and manufacturing facility in Forrestdale, completed in 2023 at a cost of approximately $100 million. The 13,000m2 facility includes remanufacturing and mining equipment assembly capabilities, with heavy-duty cranes and supports 350 employees. In 2024, Hitachi purchased adjacent land for $15-17 million to expand operations, with project management ongoing in 2025.
Employment
Employment conditions in Roleystone demonstrate strong performance, ranking among the top 35% of areas assessed nationally
Roleystone has a skilled workforce with strong representation in manufacturing and industrial sectors. Its unemployment rate is 2.7%, with an estimated employment growth of 1.5% over the past year as of September 2025.
There are 4,331 residents employed, with an unemployment rate of 1.3%, lower than Greater Perth's rate of 4.0%. Workforce participation is similar to Greater Perth's at 65.2%. The dominant employment sectors among residents include construction, health care & social assistance, and education & training. Construction has a particularly strong presence with an employment share of 1.2 times the regional level, while health care & social assistance has limited presence at 11.0% compared to the regional average of 14.8%.
The area appears to offer limited local employment opportunities based on Census data. In the year to September 2025, employment levels increased by 1.5%, labour force by 1.9%, causing unemployment rate to rise by 0.3 percentage points. By comparison, Greater Perth recorded higher employment growth of 2.9%. State-level data as of 25-Nov shows WA employment contracted by 0.27% with an unemployment rate of 4.6%, compared to the national rate of 4.3%. National employment forecasts suggest a 6.6% increase over five years and 13.7% over ten years, with varying growth rates across sectors. Applying these projections to Roleystone's employment mix suggests local employment should increase by 5.9% over five years and 12.6% over ten years.
Frequently Asked Questions - Employment
Income
Income metrics indicate excellent economic conditions, with the area achieving higher performance than 75% of national locations assessed by AreaSearch
According to AreaSearch's aggregation of ATO data released on June 30, 2022, Roleystone SA2 had a median income among taxpayers of $59,836 and an average income of $75,325. These figures are higher than the national averages of $58,380 and $78,020 respectively for Greater Perth. Based on Wage Price Index growth of 14.2% since June 30, 2022, estimated median income is approximately $68,333 and average income is around $86,021 as of September 2025. Census data shows that incomes in Roleystone cluster around the 69th percentile nationally. The earnings profile indicates that 32% of residents earn between $1,500 and $2,999 per week (2,533 people), similar to metropolitan patterns. Notably, 33.4% of residents are high earners, indicating strong economic capacity in the suburb. After housing costs, residents retain 87.1% of their income, reflecting strong purchasing power and placing Roleystone in the 7th decile according to SEIFA income rankings.
Frequently Asked Questions - Income
Housing
Roleystone is characterized by a predominantly suburban housing profile, with above-average rates of outright home ownership
Roleystone's dwelling structure, as per the latest Census, consisted of 98.3% houses and 1.7% other dwellings (semi-detached, apartments, 'other' dwellings). In contrast, Perth metro had 90.0% houses and 10.0% other dwellings. Home ownership in Roleystone stood at 38.9%, with mortgaged dwellings at 54.3% and rented ones at 6.9%. The median monthly mortgage repayment was $2,056, higher than Perth metro's average of $1,750. The median weekly rent in Roleystone was $350, compared to Perth metro's $305. Nationally, Roleystone's mortgage repayments were higher at $2,056 versus the Australian average of $1,863, while rents were lower at $350 compared to the national figure of $375.
Frequently Asked Questions - Housing
Household Composition
Roleystone features high concentrations of family households, with a lower-than-average median household size
Family households constitute 82.5% of all households, including 37.5% couples with children, 36.2% couples without children, and 8.3% single parent families. Non-family households comprise the remaining 17.5%, with lone person households at 16.1% and group households making up 1.4%. The median household size is 2.7 people, smaller than the Greater Perth average of 2.8.
Frequently Asked Questions - Households
Local Schools & Education
Roleystone performs slightly above the national average for education, showing competitive qualification levels and steady academic outcomes
Roleystone trail's educational qualifications compare to regional benchmarks with 25.0% of residents aged 15+ holding university degrees compared to the national average of 30.4%. University degrees are most common at 17.6%, followed by postgraduate qualifications (4.5%) and graduate diplomas (2.9%). Vocational credentials are prominent, with 41.5% of residents aged 15+ holding them, including advanced diplomas (11.8%) and certificates (29.7%). Educational participation is high at 26.8%, with 9.3% in primary education, 8.3% in secondary education, and 4.2% pursuing tertiary education.
Educational participation is notably high, with 26.8% of residents currently enrolled in formal education. This includes 9.3% in primary education, 8.3% in secondary education, and 4.2% pursuing tertiary education.
Frequently Asked Questions - Education
Schools Detail
Nearby Services & Amenities
Transport
Transport servicing is low compared to other areas nationally based on assessment of service frequency, route connectivity and accessibility
Roleystone has 42 active public transport stops. These are served by buses only, with a total of 175 weekly passenger trips provided by one route. The accessibility is moderate, with residents on average 569 meters from the nearest stop.
There are approximately 25 trips per day across all routes, which translates to about 4 weekly trips per individual stop.
Frequently Asked Questions - Transport
Transport Stops Detail
Health
Roleystone's residents are healthier than average in comparison to broader Australia with prevalence of common health conditions quite low across both younger and older age cohorts
Roleystone residents show favourable health outcomes with low prevalence rates for common conditions across both younger and older age groups. Private health cover stands at approximately 57% of the total population (~4,521 people), compared to 53.3% in Greater Perth.
The most prevalent medical conditions are arthritis (8.7%) and mental health issues (7.6%). Around 69.7% of residents report no medical ailments, slightly lower than the 72.1% across Greater Perth. Roleystone has a higher proportion of seniors aged 65 and over at 22.0% (1,740 people), compared to 12.8% in Greater Perth. Health outcomes among seniors are notably strong, outperforming general population metrics.
Frequently Asked Questions - Health
Cultural Diversity
In terms of cultural diversity, Roleystone records figures broadly comparable to the national average, as found in AreaSearch's assessment of a number of language and cultural background related metrics
Roleystone had a higher than average cultural diversity, with 7.0% speaking a language other than English at home and 29.6% born overseas. Christianity was the predominant religion, comprising 41.9%. Judaism was overrepresented at 0.2%, compared to 0.0% in Greater Perth.
The top three ancestry groups were English (36.7%), Australian (24.4%), and Scottish (7.7%). Notable divergences included Dutch (2.7% vs regional 2.4%), Welsh (0.9% vs 0.6%), and South African (0.8% vs 1.0%).
Frequently Asked Questions - Diversity
Age
Roleystone hosts a notably older demographic compared to the national average
Roleystone's median age is 44, higher than Greater Perth's figure of 37 and the national norm of 38. The 65-74 age group comprises 12.3% of Roleystone's population, compared to Greater Perth's figure. Meanwhile, the 25-34 cohort makes up 8.1%. Post-2021 Census, the 75-84 age group grew from 5.2% to 8.2%, while the 45-54 cohort declined from 15.3% to 13.9%, and the 25-34 group dropped from 9.3% to 8.1%. By 2041, demographic modeling indicates Roleystone's age profile will change significantly. Leading this shift, the 75-84 group is projected to grow by 56% (360 people), reaching 1,006 from 645. The aging population trend is evident, with those aged 65 and above accounting for 77% of projected growth. Conversely, the 0-4 and 5-14 age groups are expected to experience population declines.
