Chart Color Schemes
est. as @ -- *
ABS ERP | -- people | --
2021 Census | -- people
Sales Activity
Curious about local property values? Filter the chart to assess the volume and appreciation (including resales) trends and regional comparisons, or scroll to the map below view this information at an individual property level.
Find a Recent Sale
Sales Detail
Population
An assessment of population growth drivers in Mount Lawley - Inglewood reveals an overall ranking slightly below national averages considering recent, and medium term trends
Mount Lawley - Inglewood's population was around 18,712 as of November 2025. This reflected an increase of 1,778 people (10.5%) since the 2021 Census, which reported a population of 16,934 people. The change was inferred from the estimated resident population of 18,675 from the ABS as of June 2024 and an additional 110 validated new addresses since the Census date. This level of population equated to a density ratio of 2,642 persons per square kilometer, placing it in the upper quartile relative to national locations assessed by AreaSearch. Mount Lawley - Inglewood's 10.5% growth since the 2021 census exceeded the national average (8.9%), marking it as a growth leader in the region. Population growth for the area was primarily driven by overseas migration, contributing approximately 85.9% of overall population gains during recent periods.
AreaSearch adopted ABS/Geoscience Australia projections for each SA2 area, released in 2024 with 2022 as the base year. For any SA2 areas not covered by this data, and to estimate growth across all areas post-2032, AreaSearch utilised the growth rates by age cohort provided by the ABS in its latest Greater Capital Region projections (released in 2023, based on 2022 data). Examining future population trends projected an above median population growth for national statistical areas. The area was expected to grow by 2,651 persons to 2041 based on the latest population numbers, with an increase of 14.0% in total over the 17 years.
Frequently Asked Questions - Population
Development
Recent residential development output has been above average within Mount Lawley - Inglewood when compared nationally
Mount Lawley - Inglewood has seen approximately 56 dwelling approvals per year over the past five financial years, totalling 284 homes. As of FY-26, there have been 11 approvals recorded. On average, 4.6 people move to the area annually for each dwelling built between FY-21 and FY-25, indicating significant demand outstripping supply, which typically leads to heightened buyer competition and pricing pressures. New properties are constructed at an average expected cost of $356,000, somewhat higher than regional norms due to quality-focused development.
This financial year has seen $100.5 million in commercial development approvals, reflecting high local commercial activity. Compared to Greater Perth, Mount Lawley - Inglewood has significantly less development activity, with 58.0% below the regional average per person. This constrained new construction usually reinforces demand and pricing for existing dwellings. Nationally, this is also lower, indicating market maturity and possible development constraints. New development consists of 59.0% detached houses and 41.0% townhouses or apartments, offering a mix of medium-density options across various price brackets.
With around 555 people per dwelling approval, Mount Lawley - Inglewood reflects a highly mature market. By 2041, the area is projected to grow by 2,614 residents. At current development rates, housing supply may struggle to keep pace with population growth, potentially intensifying buyer competition and supporting price increases.
Frequently Asked Questions - Development
Infrastructure
Mount Lawley - Inglewood has limited levels of nearby infrastructure activity, ranking in the 13thth percentile nationally
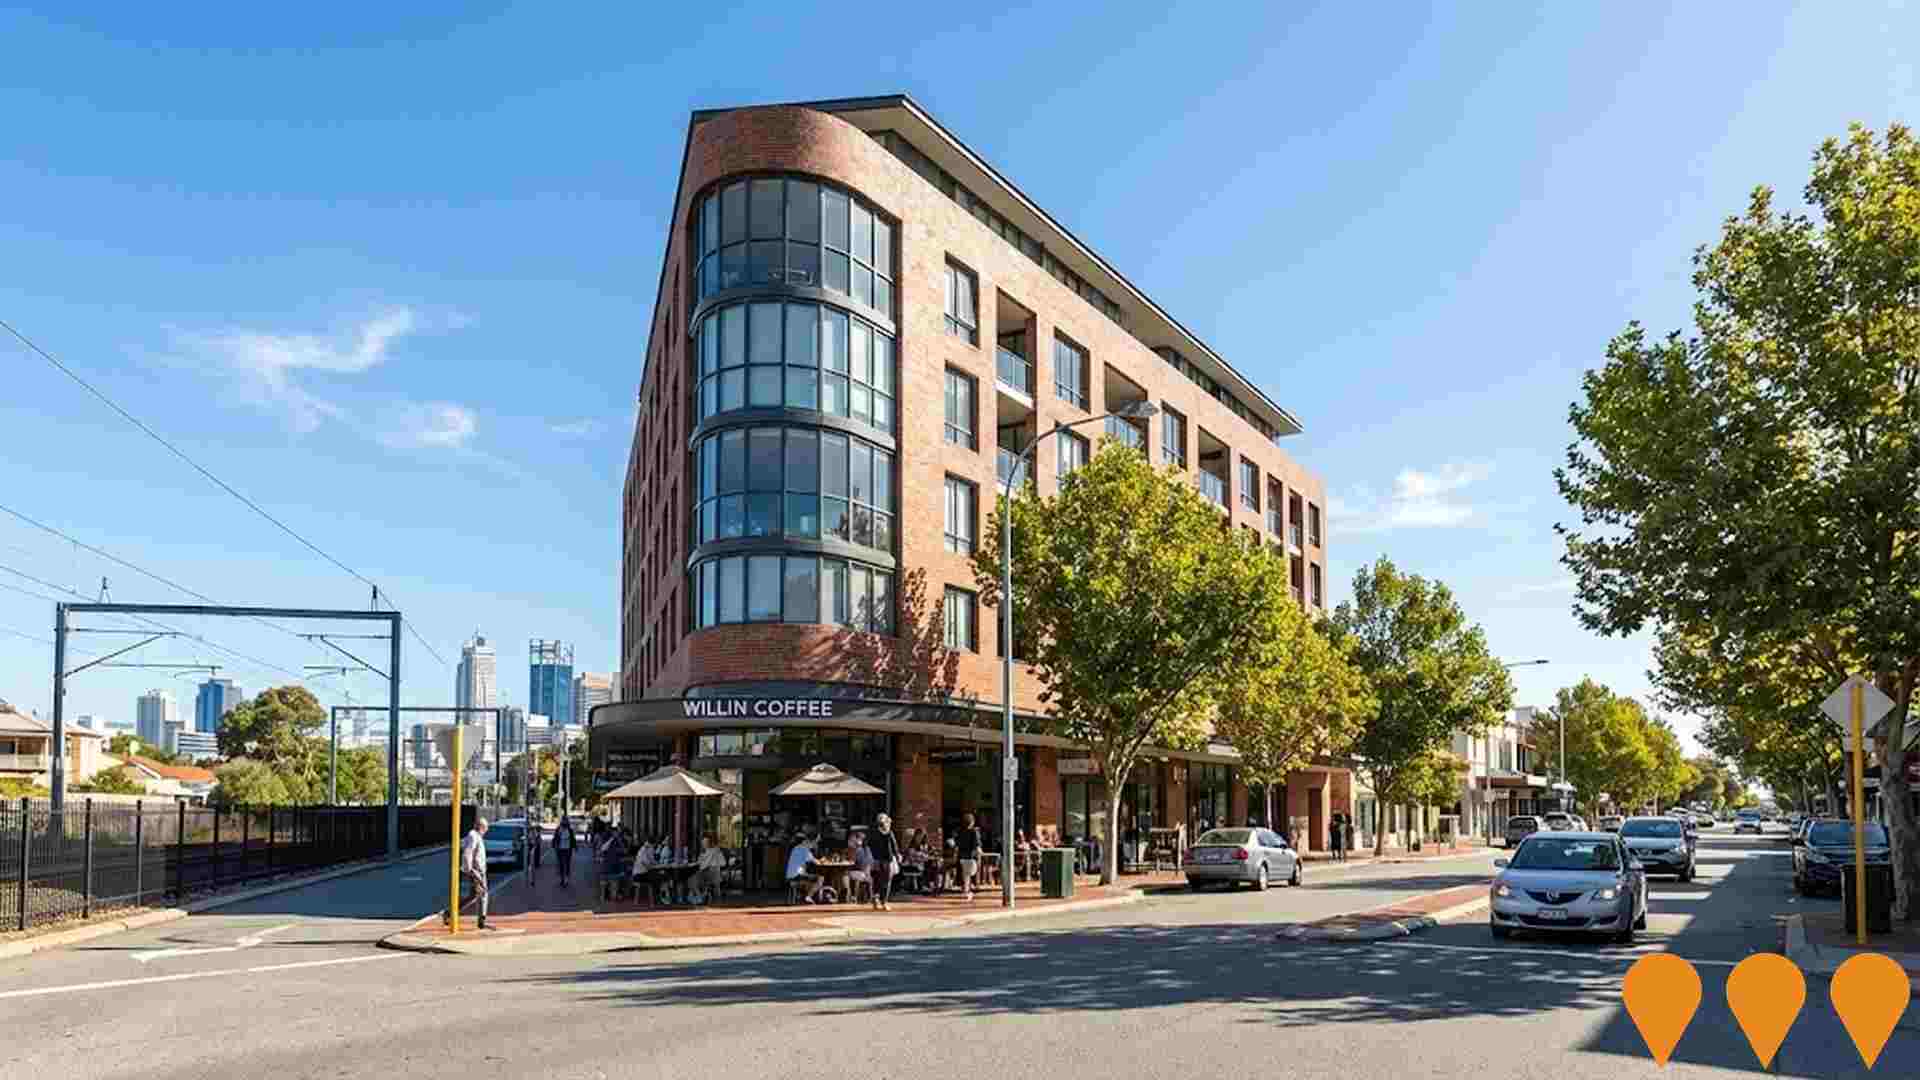
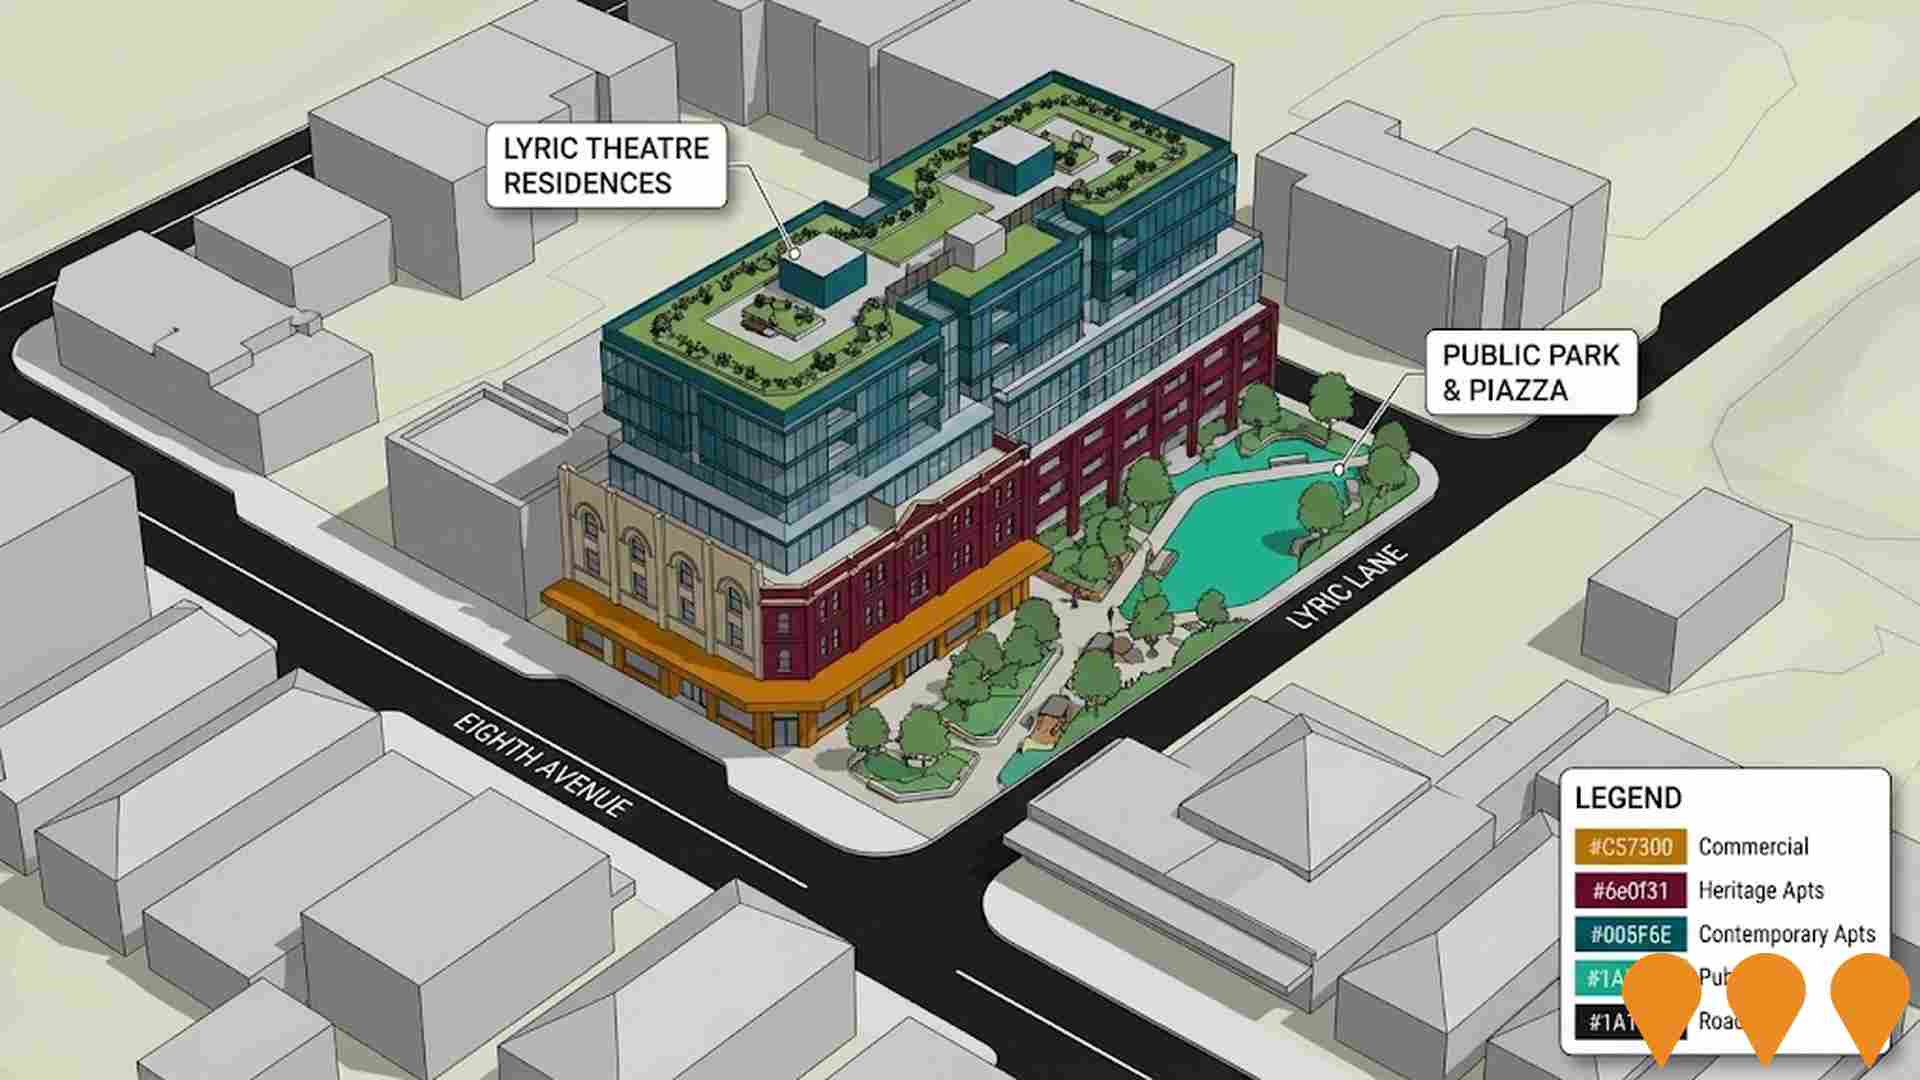
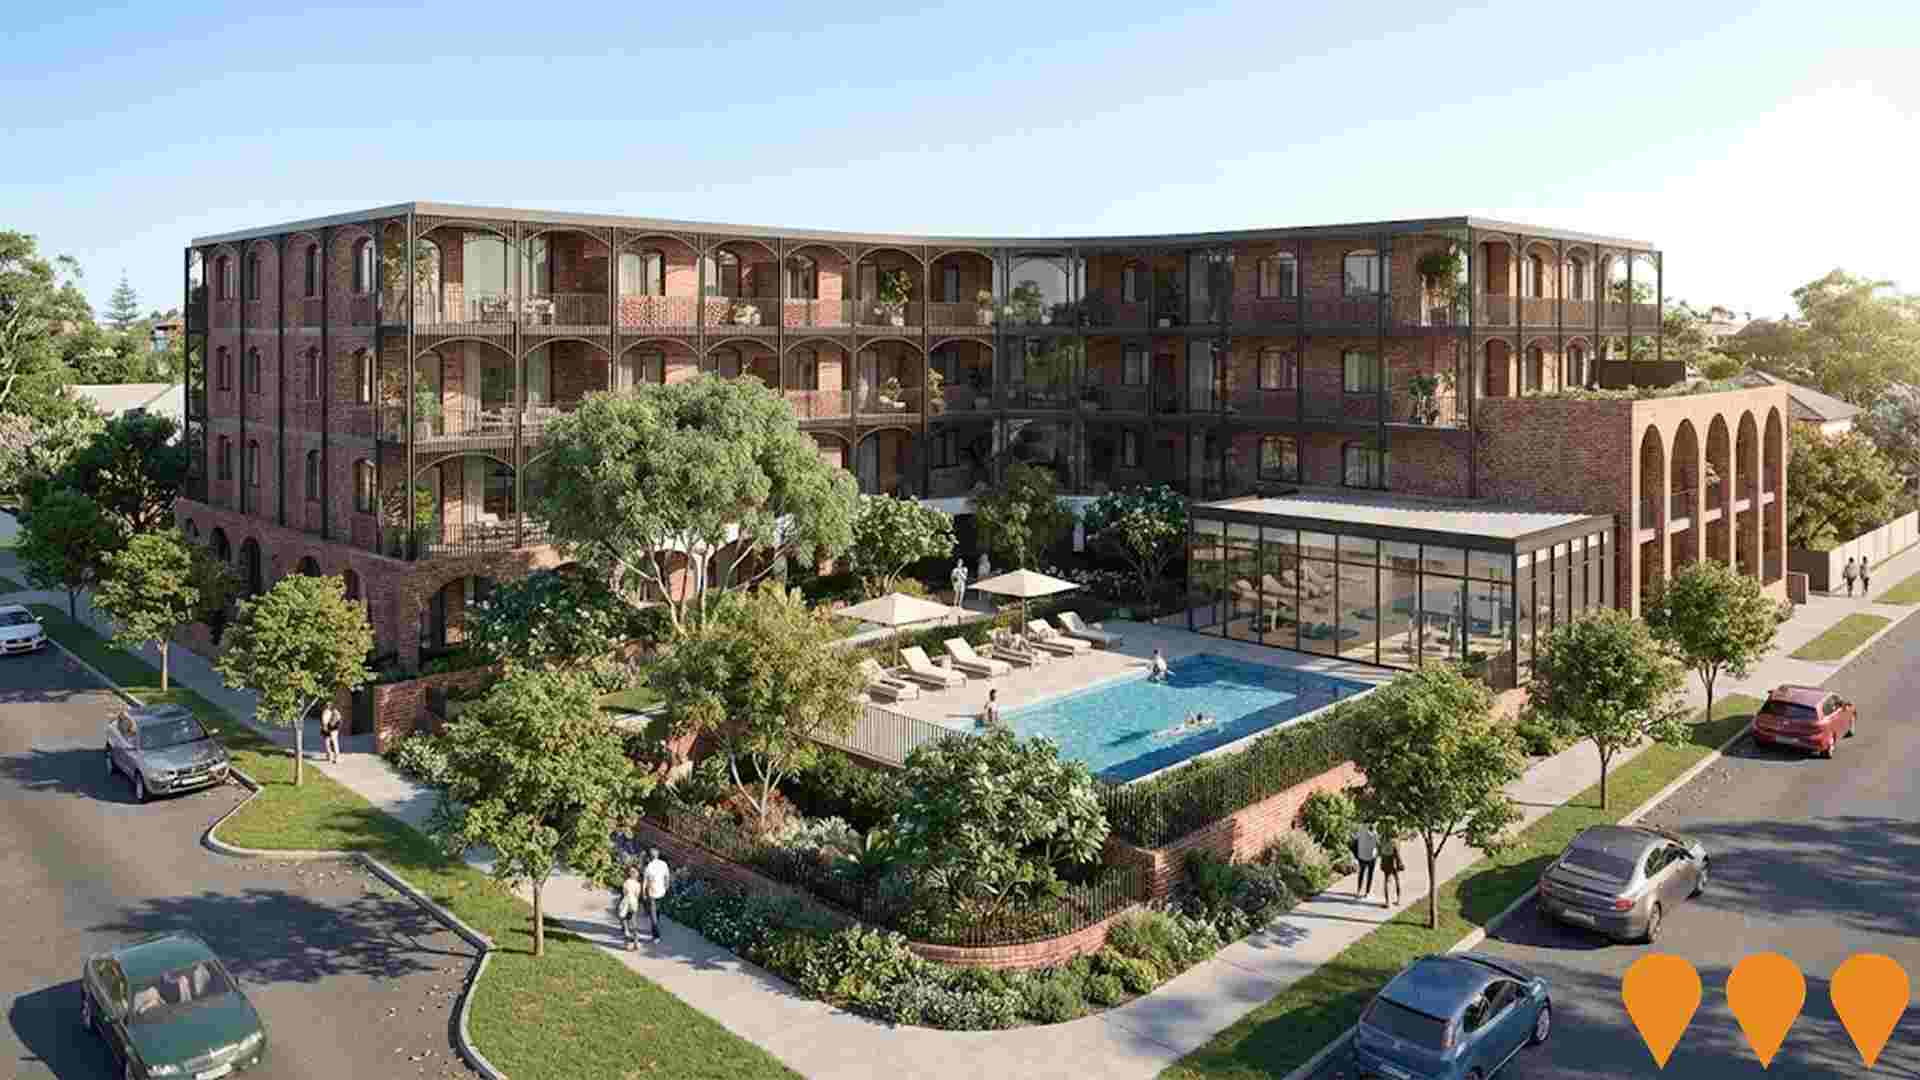
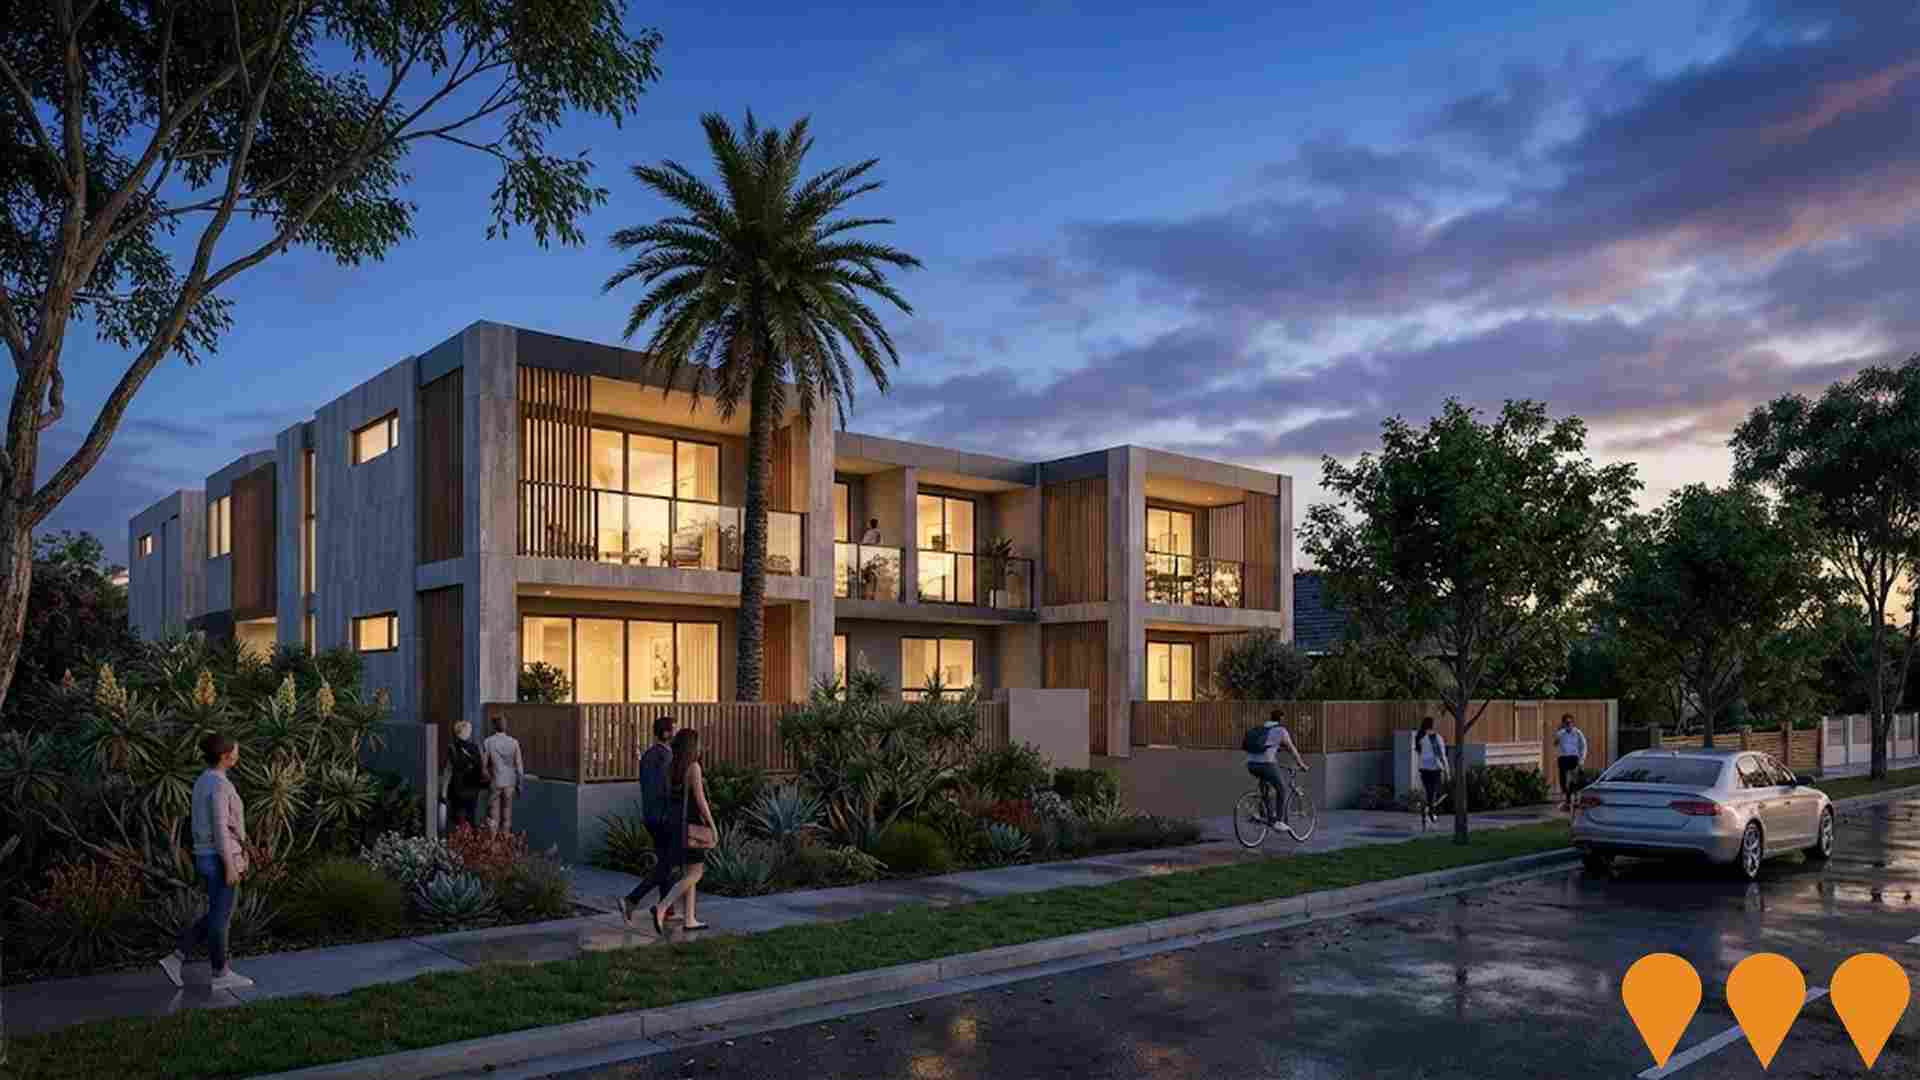
A total of 34 projects have been identified by AreaSearch that are likely to impact the area. Key projects include St John of God Mt Lawley Hospital - Intensive Care Unit and Upgrades, Alma Square (387 Fitzgerald Street), West Residences Mount Lawley, and No. 7 Field Street Mount Lawley. The following list details those most relevant.
Professional plan users can use the search below to filter and access additional projects.
INFRASTRUCTURE SEARCH
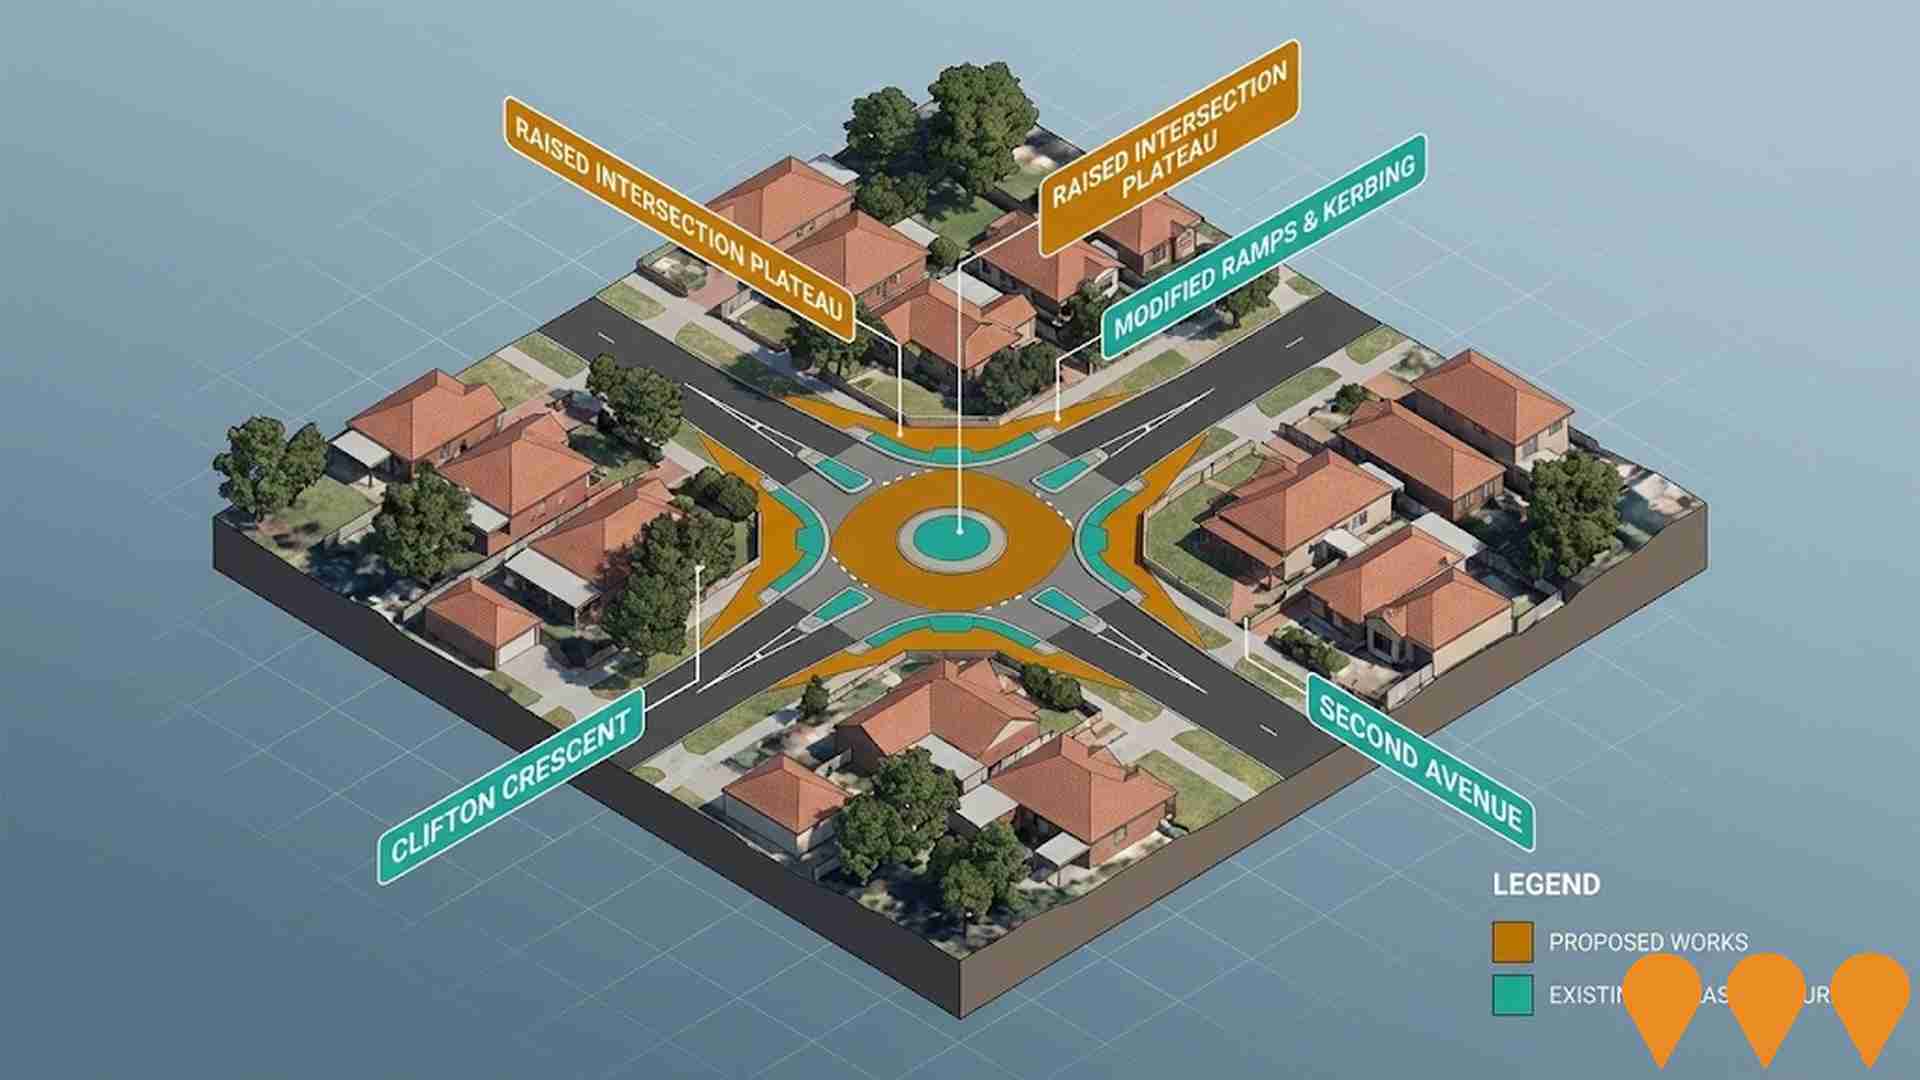
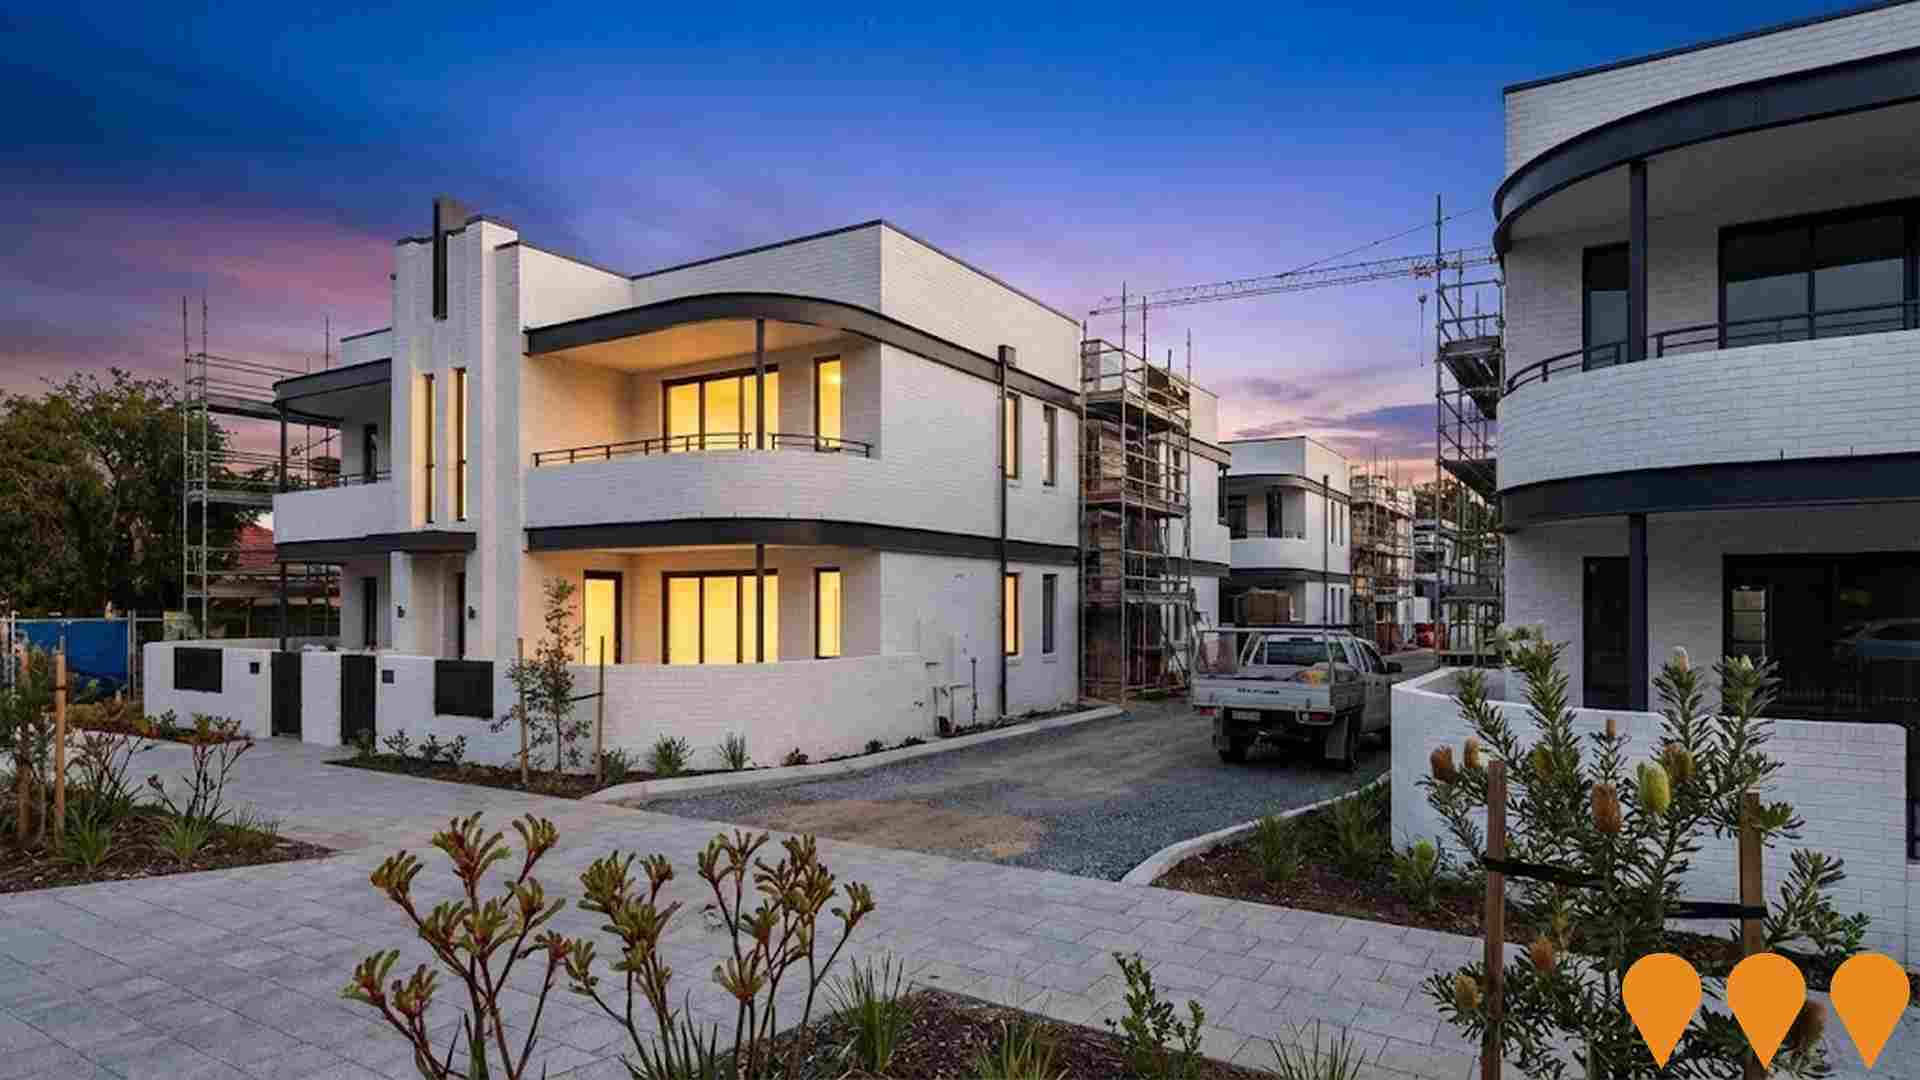
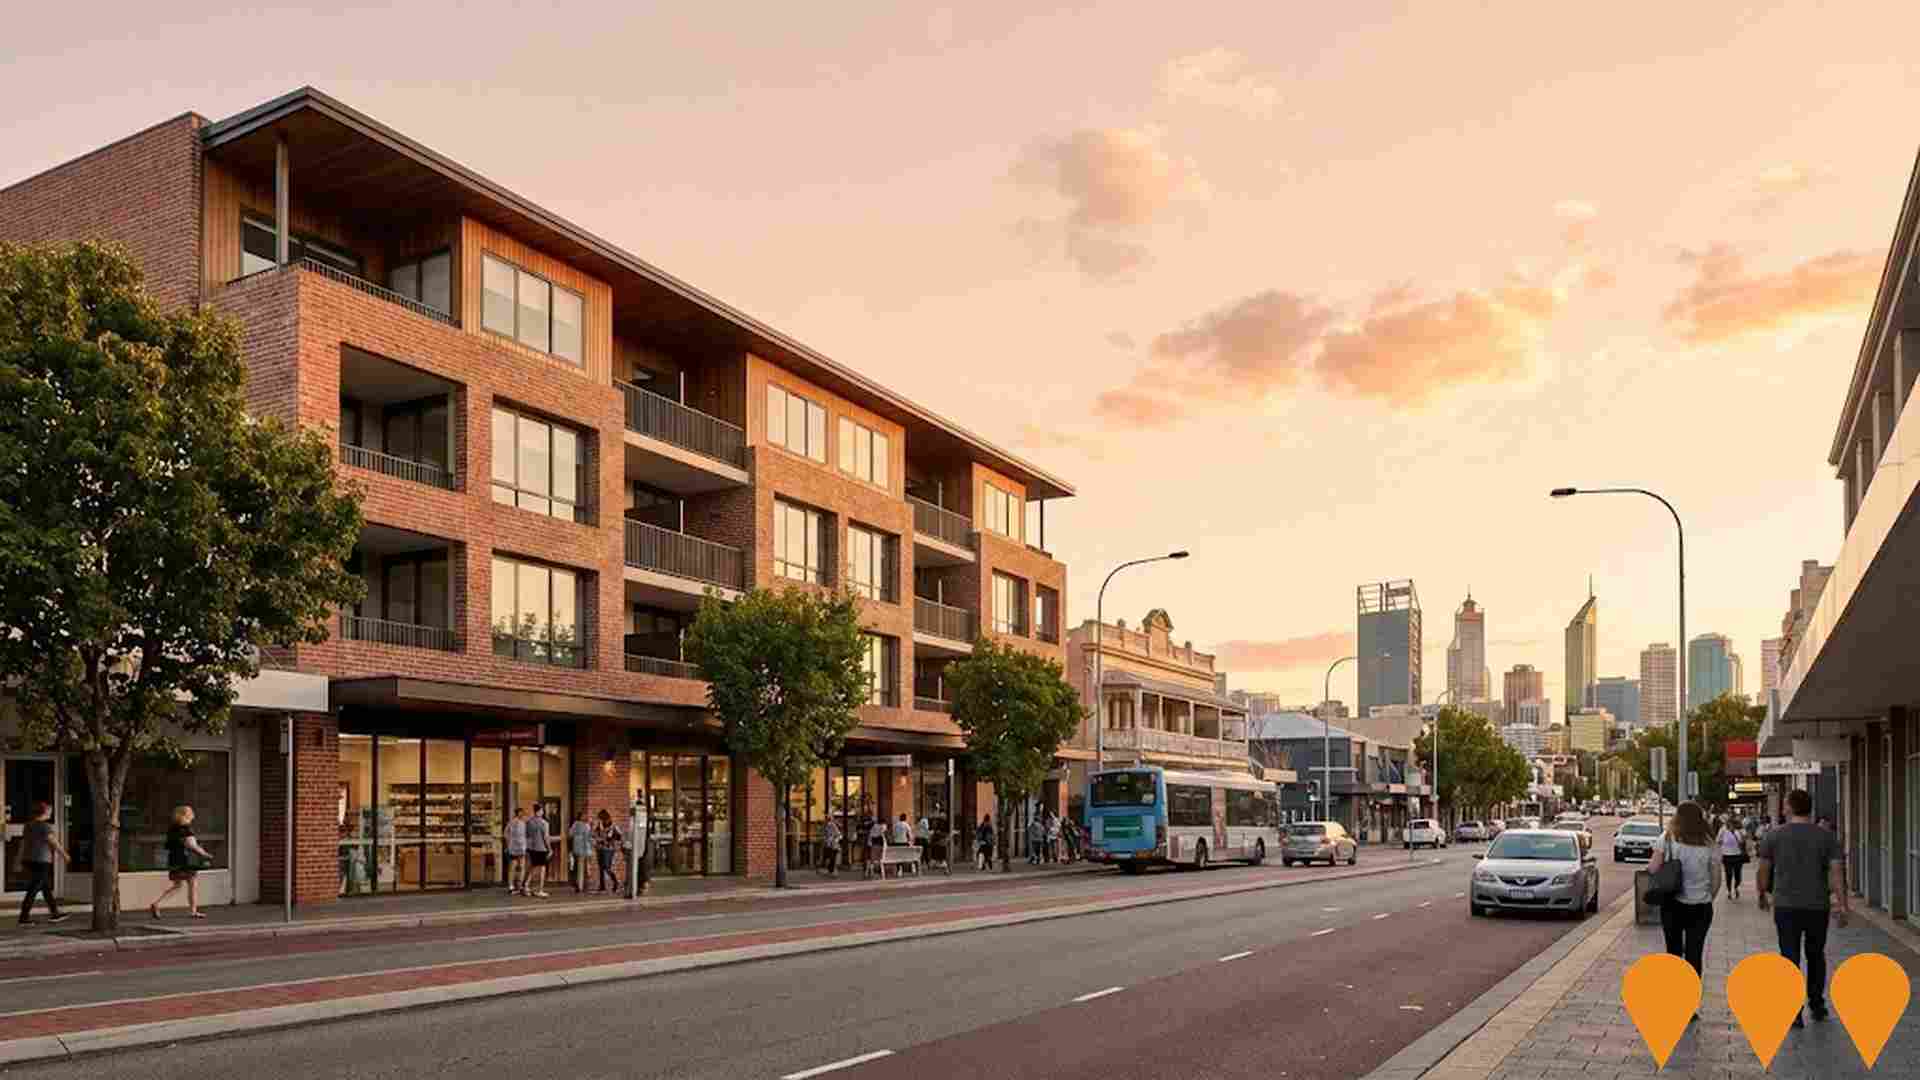
 Denotes AI-based impression for illustrative purposes only, not to be taken as definitive under any circumstances. Please follow links and conduct other investigations from the project's source for actual imagery. Developers and project owners wishing us to use original imagery please Contact Us and we will do so.
Frequently Asked Questions - Infrastructure
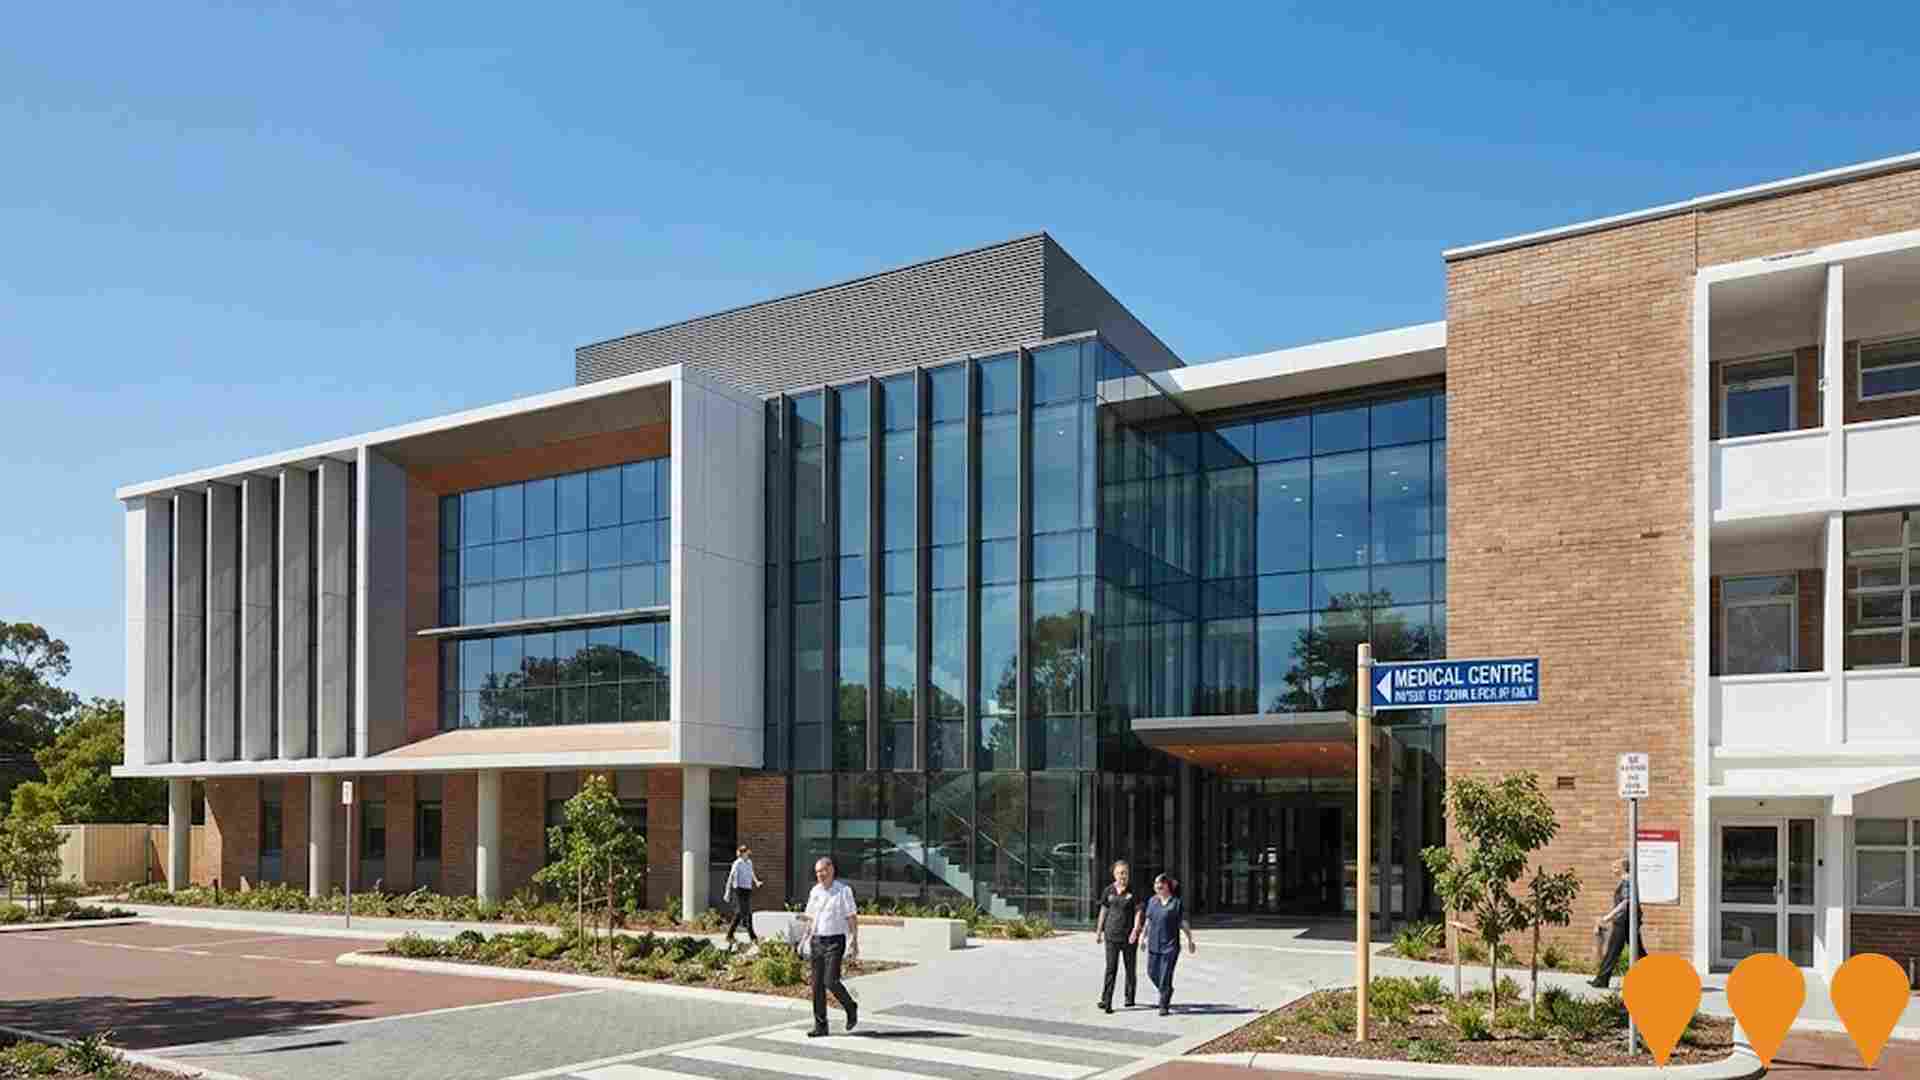
St John of God Mt Lawley Hospital - Intensive Care Unit and Upgrades
Expansion of St John of God Mt Lawley Hospital including a new seven-bed Intensive Care Unit (ICU) opened in mid-2025, increased theatre capacity, upgraded endoscopy suites, and enhanced diagnostic imaging services.
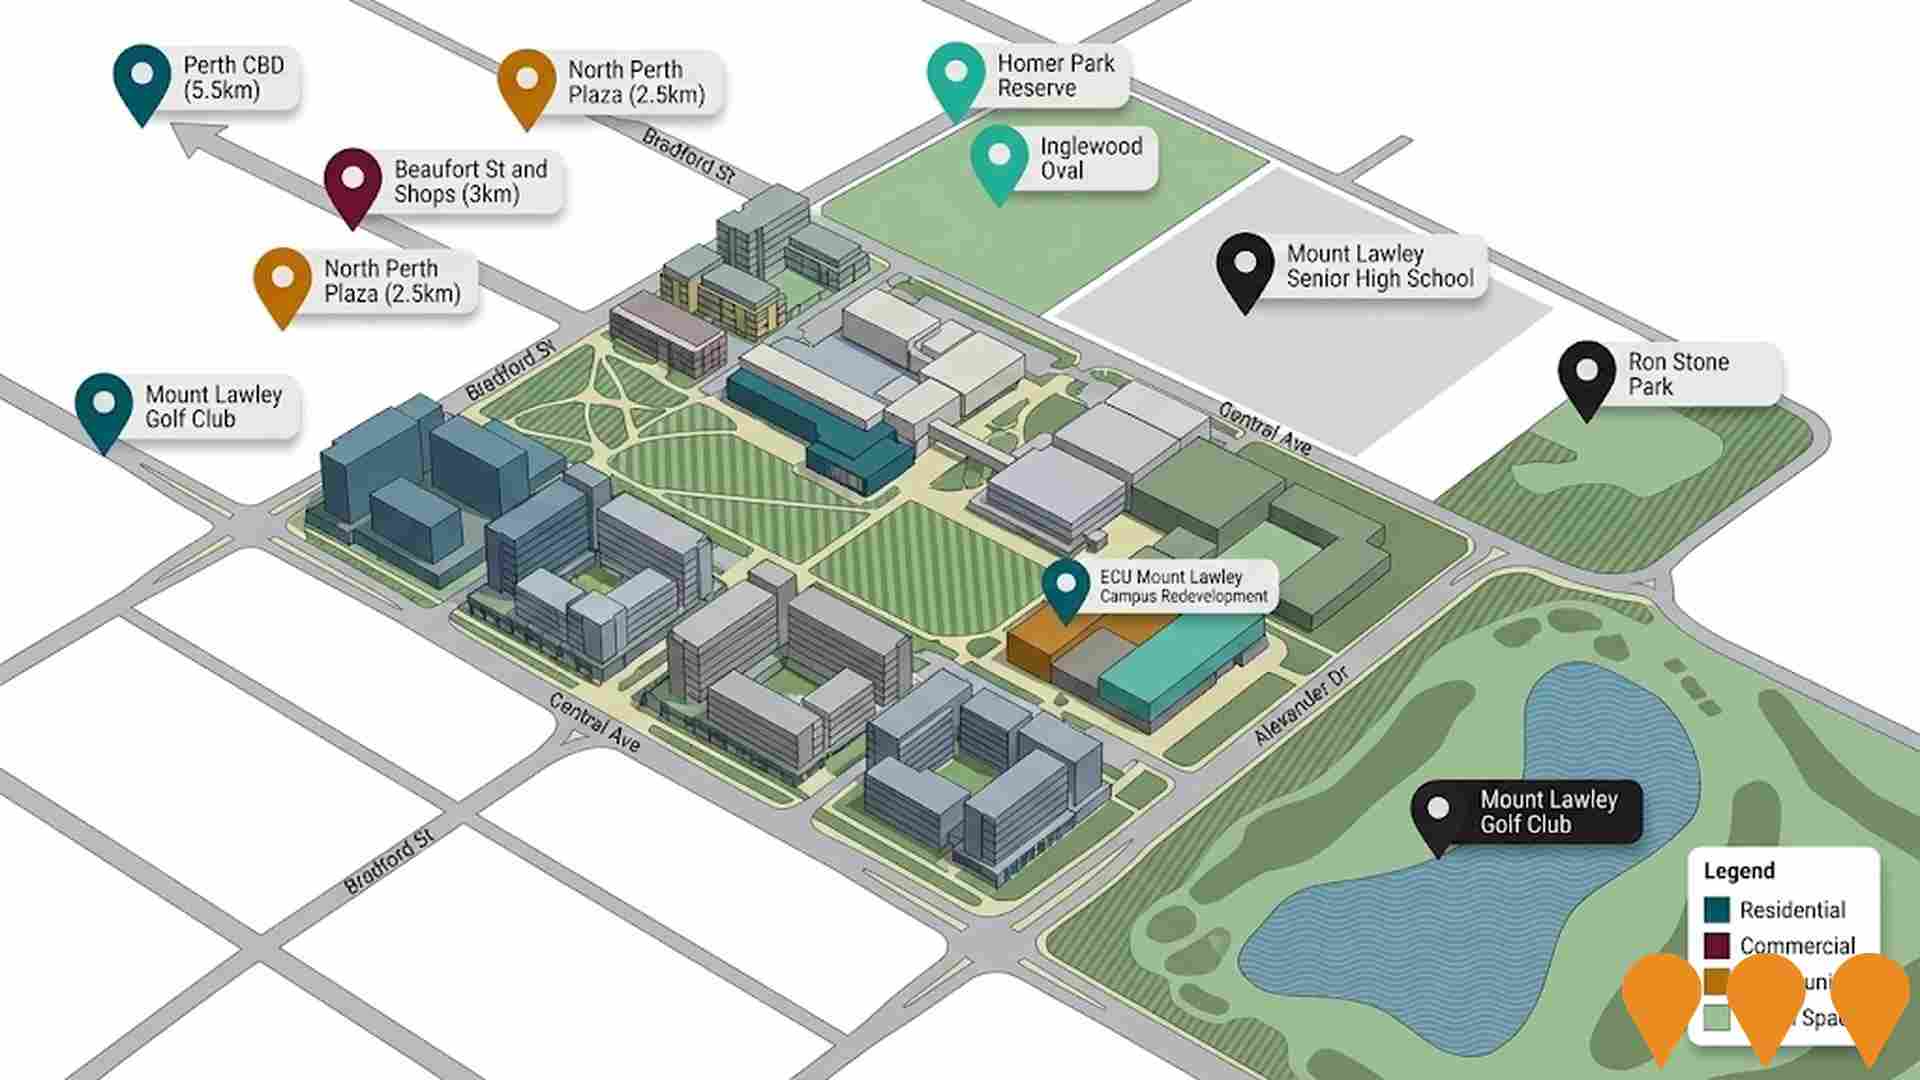
ECU Mount Lawley Campus Redevelopment
Comprehensive redevelopment of the 18.6-hectare former ECU Mount Lawley campus into a mixed-use precinct featuring diverse residential living options, commercial and community facilities. Following university relocation to Perth CBD in 2026, DevelopmentWA is leading master planning to transform this heritage site while maintaining key heritage elements and modernizing infrastructure. Community consultation was completed in 2024.
Alma Square (387 Fitzgerald Street)
Mixed-use development featuring 104 apartments, 1,000m2 of office space and over 1,500m2 ground floor retail. Nine-level building reducing to 6 levels and stepping down to 3 levels, creating a new heart for North Perth town centre with north-facing alfresco dining.

The East Parade Project
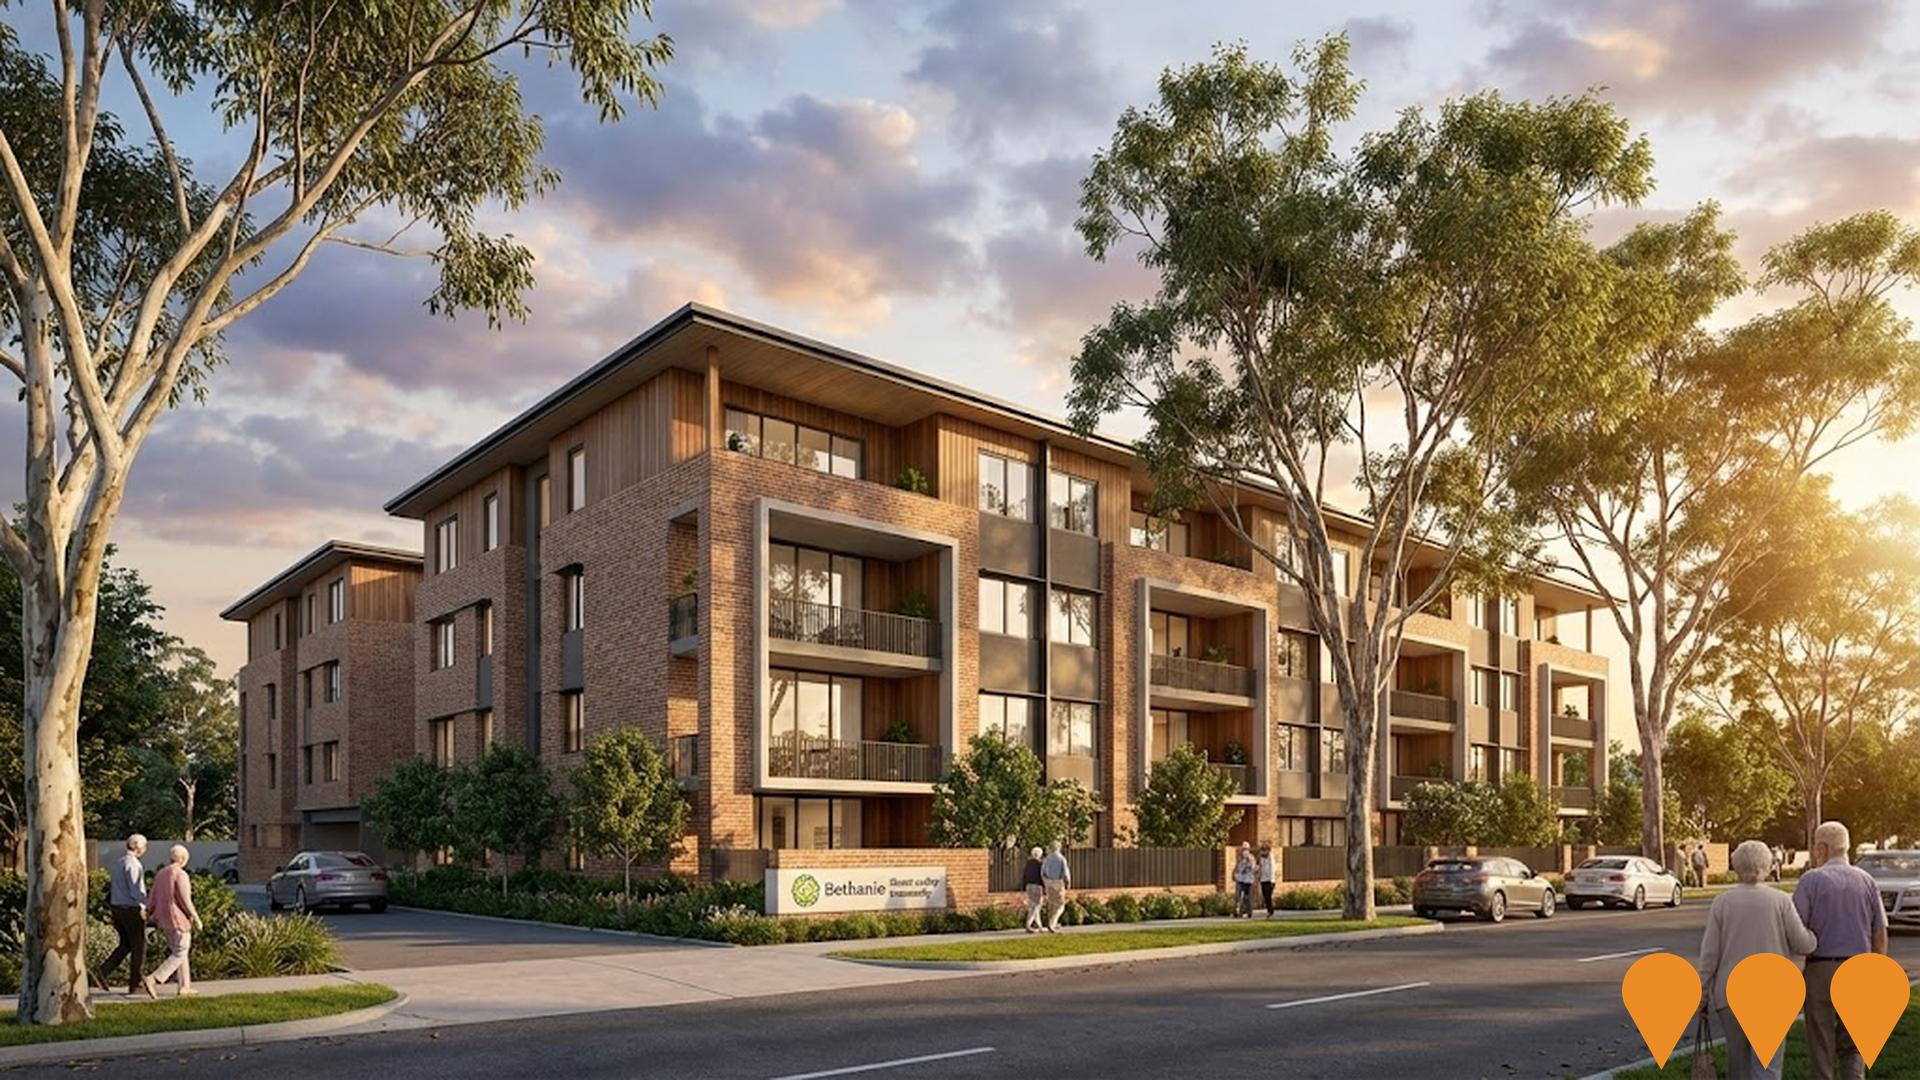
Development of a 90-dwelling community housing project for over 55's on a 1.4 ha state-owned site. Works to date include asbestos soil remediation and land assembly to create development lots. Bethanie Housing Limited is the preferred proponent to develop and operate the project. A development application is anticipated around Q3 2025, with further minor remediation and selective demolition scheduled in late 2025.
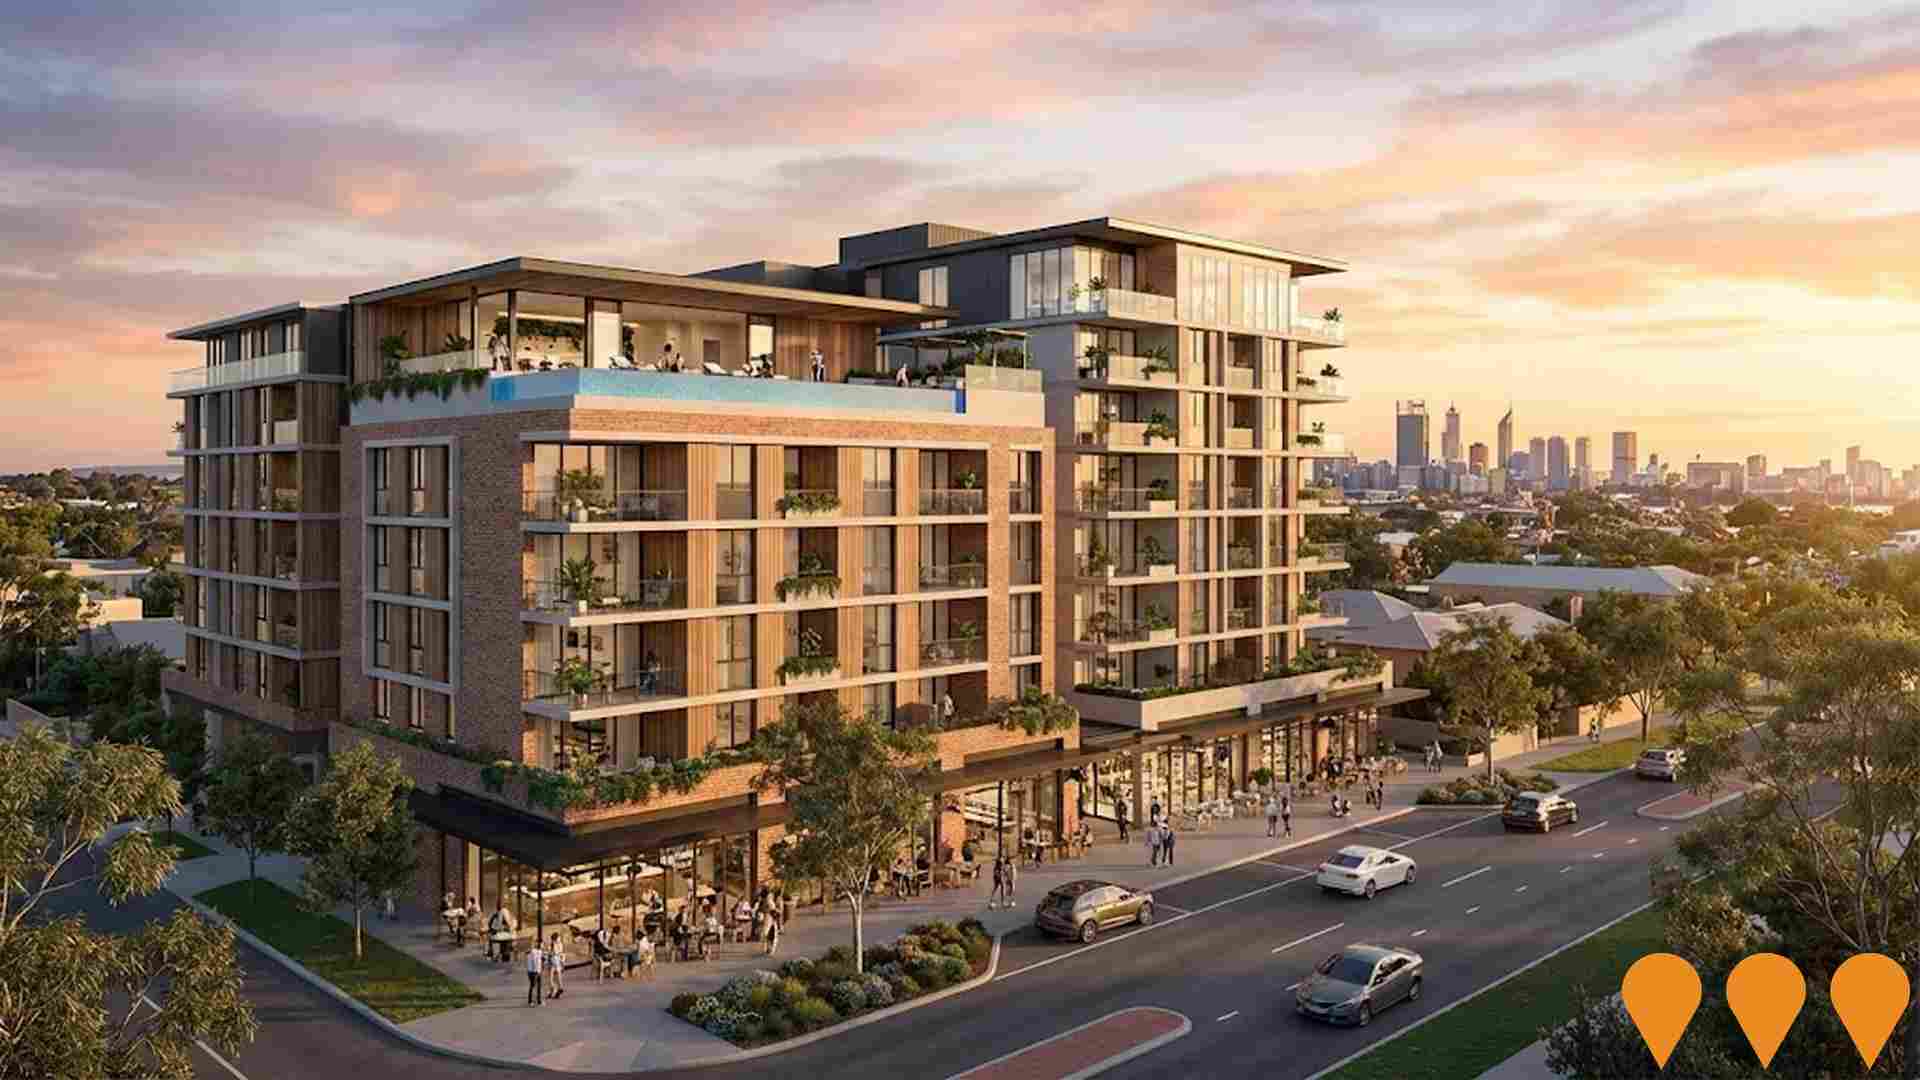
Alma Square
Alma Square is a landmark mixed-use development transforming North Perth's town centre, featuring 108 residential apartments across 40 floor plans, over 1,500 square metres of ground-floor retail and hospitality venues, and 7 commercial tenancies. The 8-level development offers resort-style amenities including a swimming pool, gym, sauna, cinema, and rooftop sky lounge with panoramic CBD views. Designed by Space Collective Architects and Place Fabric, the project blends modern design with North Perth's heritage character. With a 7-star NatHERS rating, solar power, EV charging infrastructure, and sustainable features, construction commenced September 2025 with completion expected Q1 2028.
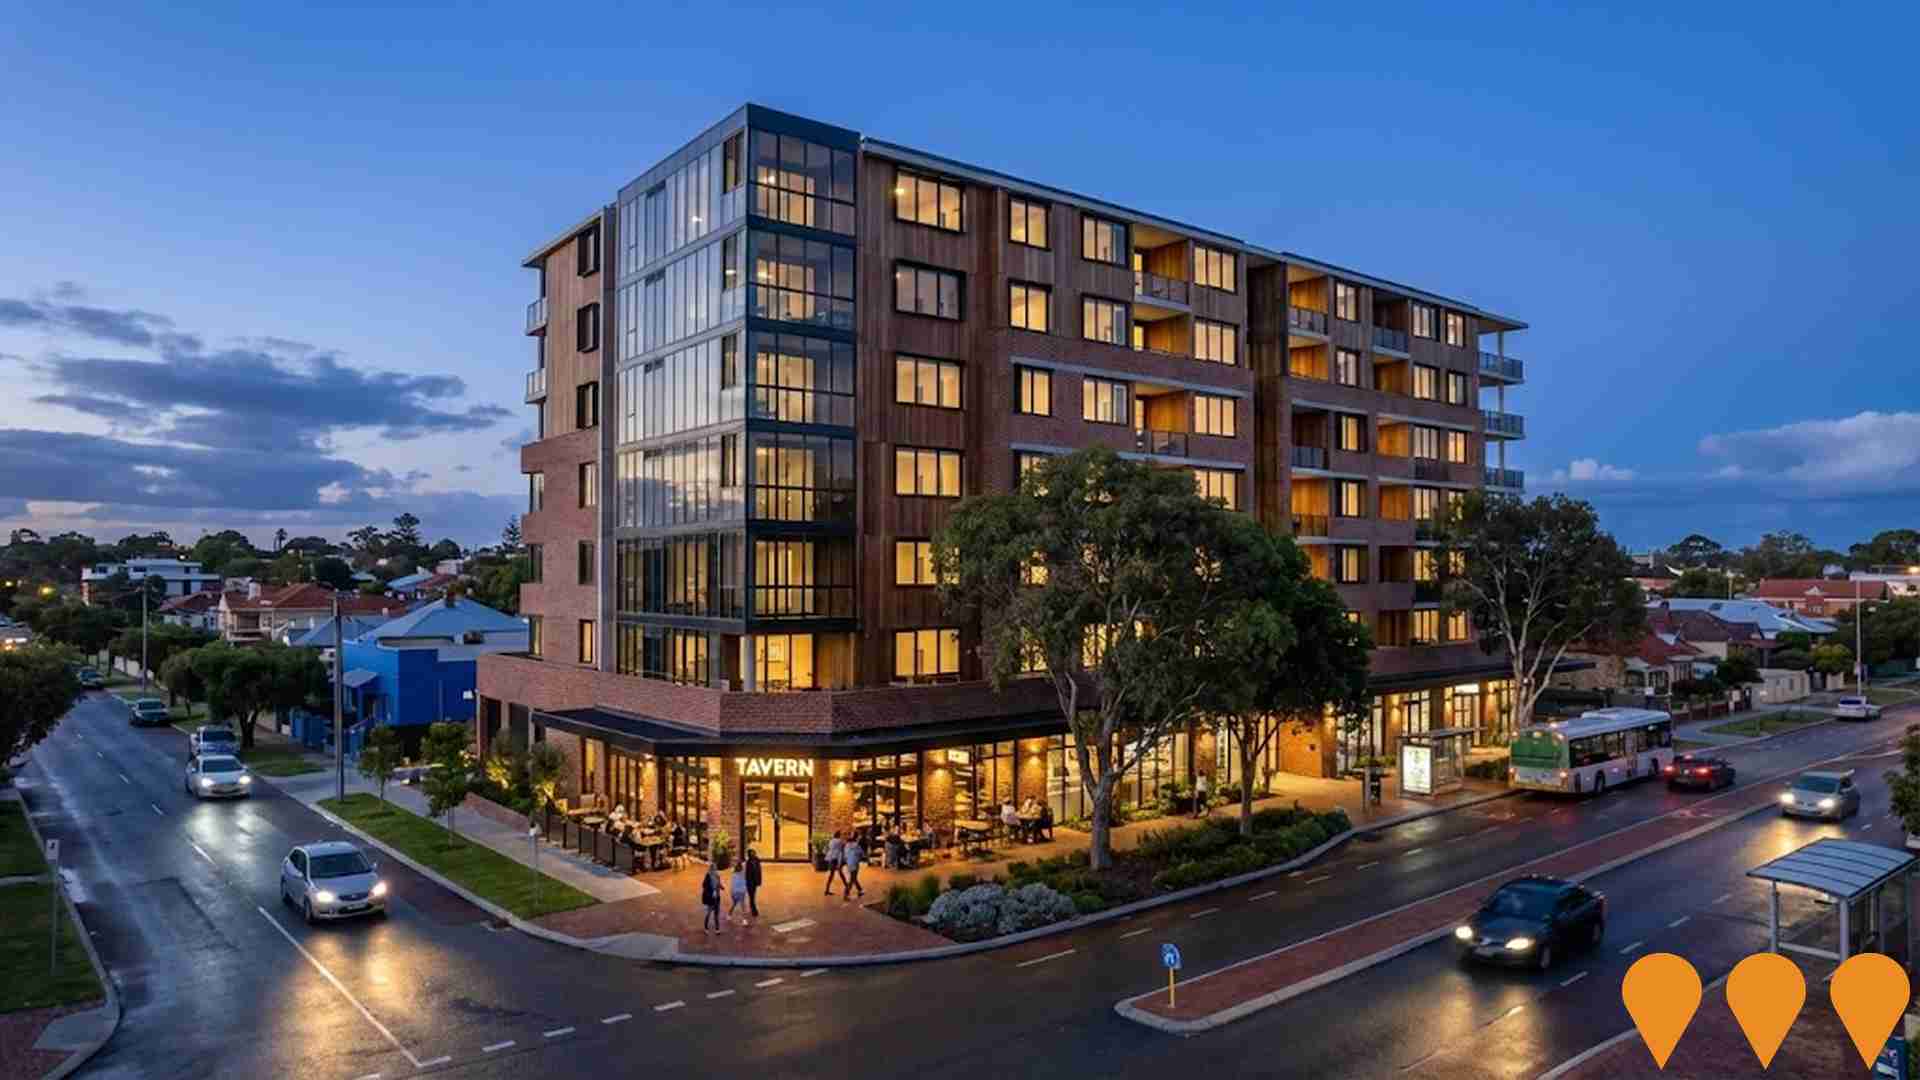
299 Charles Street North Perth
8-storey mixed-use development featuring 117 apartments including 15 x 2-bedroom apartments for aged or dependent persons, 42 studio apartments for co-living, and diverse residential options across levels 3-6. Includes tavern/brewery, private gym and retail spaces at ground level.
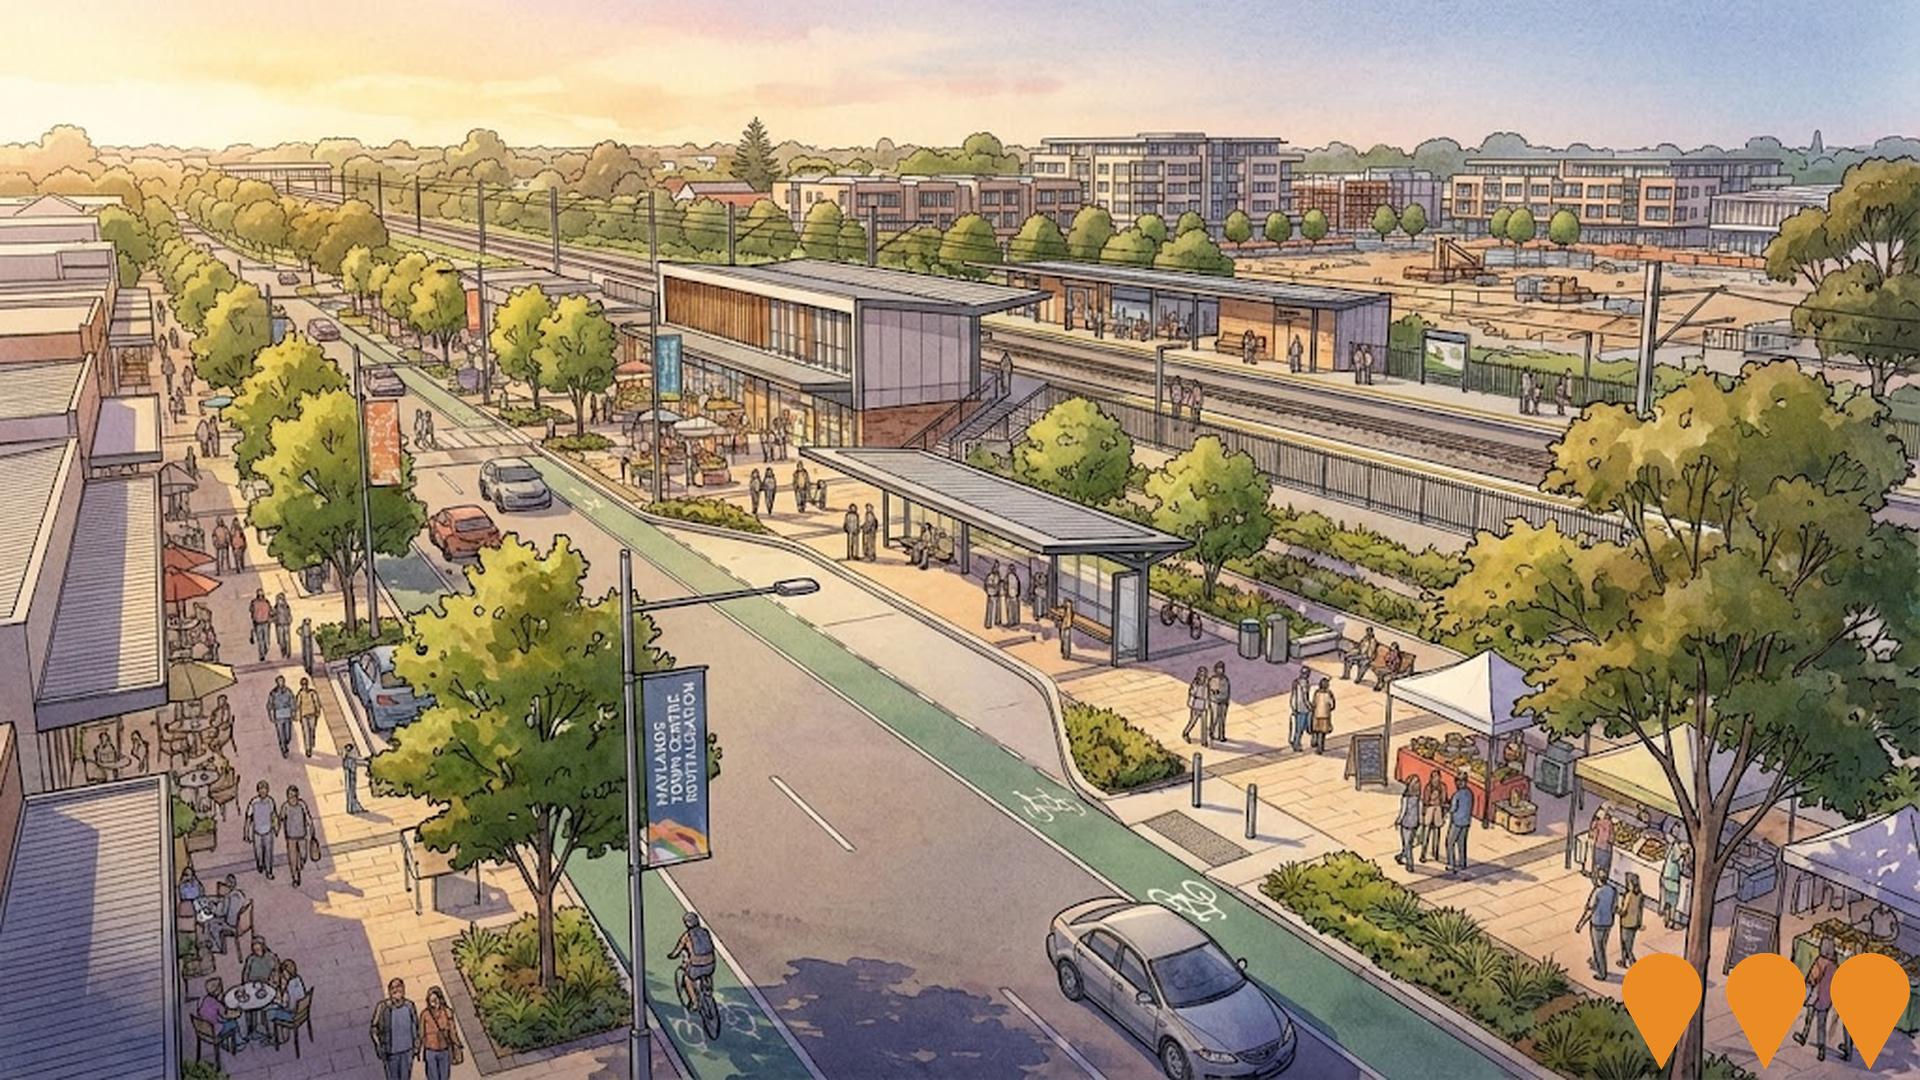
Maylands Town Centre Revitalisation
Comprehensive revitalisation of Maylands town centre around Maylands Station, combining Main Roads WA street and intersection upgrades with City of Bayswater activity centre planning. The $25 million State Government-funded project aims to create a more walkable, pedestrian-friendly mixed-use precinct with enhanced amenity, connectivity and safety. Completed works include Hotham Bridge traffic signals at Railway Parade/Whatley Crescent intersection (April 2025), protected bike lanes on Railway Parade (late 2022), and interim safety treatment at Guildford Road/Seventh Avenue (May 2023). Future works include new traffic signals at Guildford Road intersections with Seventh and Eighth Avenues, traffic calming measures, streetscape upgrades, wider footpaths, tree planting, and potential bus station, all funded for construction in 2026-27.
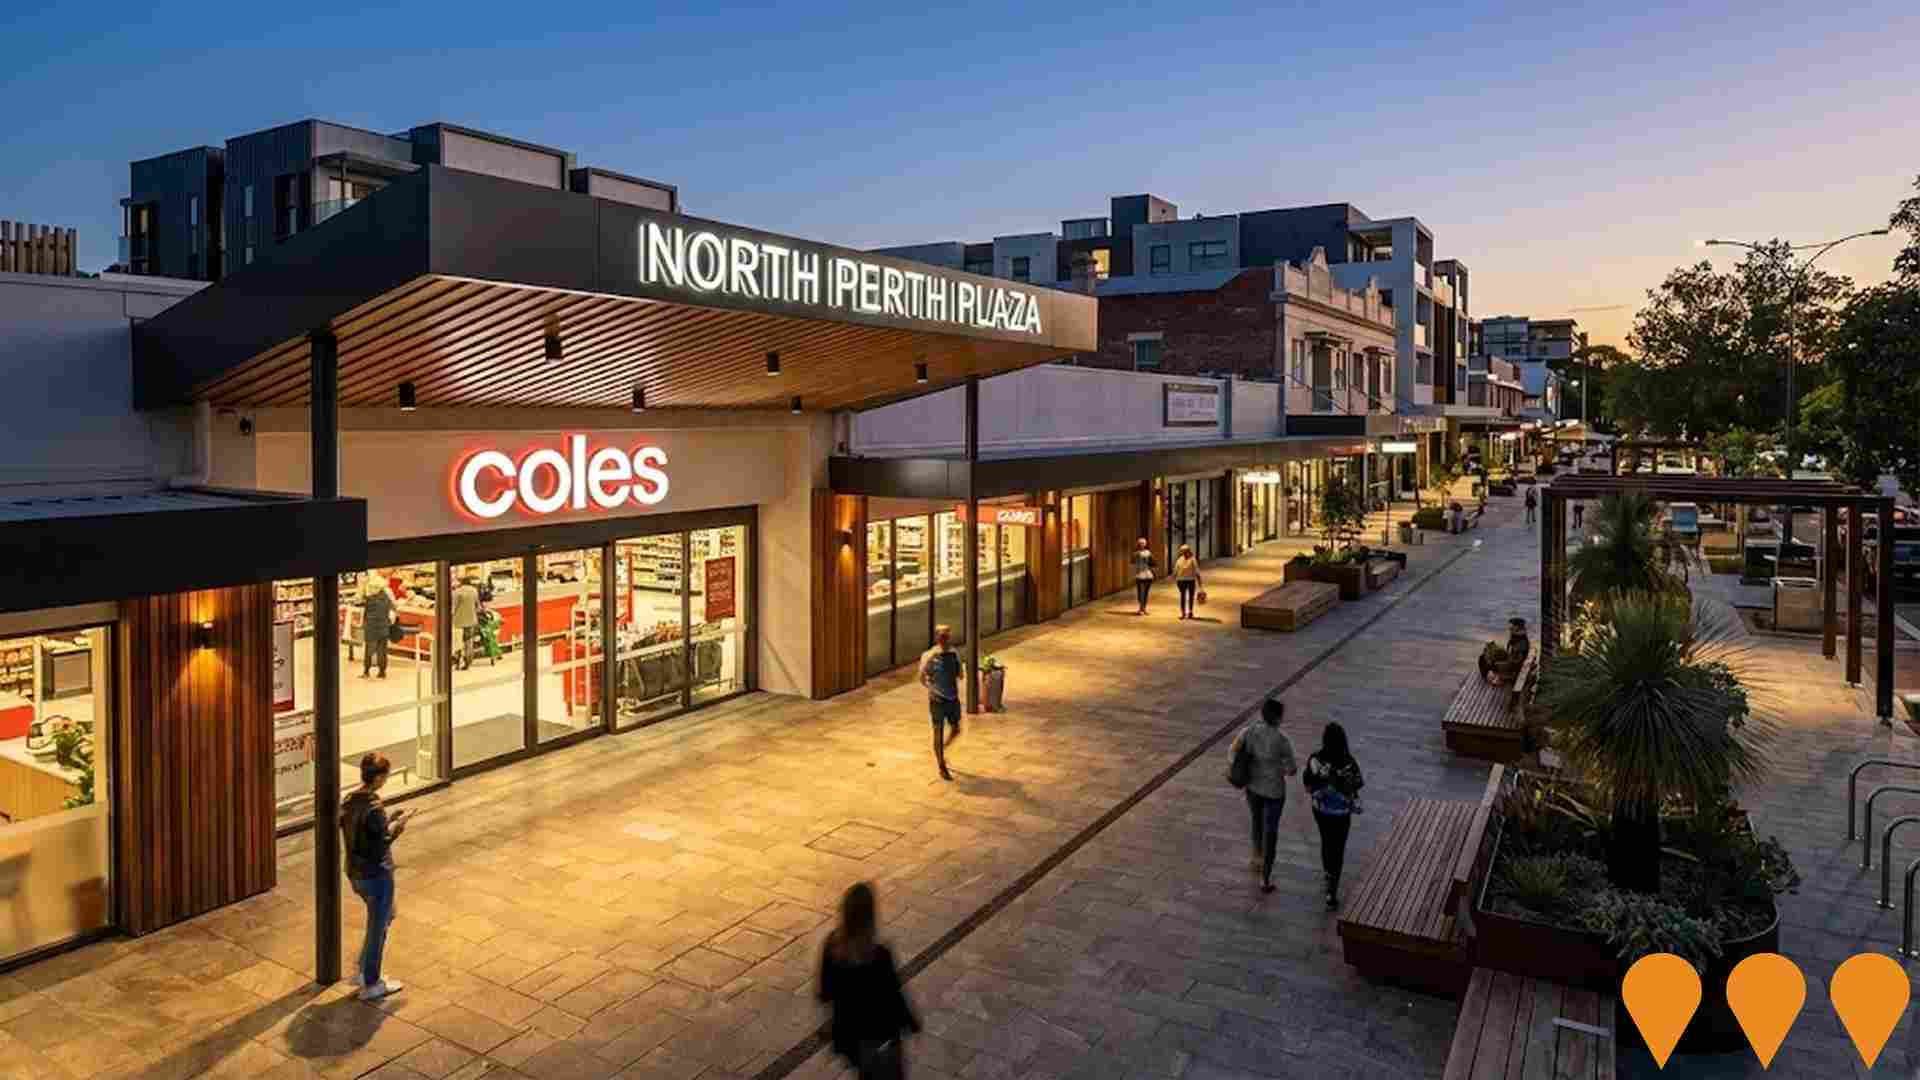
North Perth Plaza Redevelopment
Future redevelopment of North Perth Plaza shopping centre to create enhanced retail and community facilities. Proposed to work in conjunction with surrounding urban renewal initiatives to revitalize the North Perth town centre. Current centre anchored by Coles supermarket.
Employment
The employment landscape in Mount Lawley - Inglewood presents a mixed picture: unemployment remains low at 3.5%, yet recent job losses have affected its comparative national standing
Mount Lawley - Inglewood has a highly educated workforce with strong representation in professional services. Its unemployment rate is 3.5%.
As of June 2025, it has 11,547 residents employed, with an unemployment rate of 3.9%, which is 0.4% below Greater Perth's rate. Workforce participation in the area is 70.5%, compared to Greater Perth's 65.2%. Residents' employment is concentrated in professional & technical, health care & social assistance, and education & training sectors. The area has a particular specialization in professional & technical services, with an employment share of 1.8 times the regional level.
Conversely, construction shows lower representation at 5.8% compared to the regional average of 9.3%. The area appears to offer limited local employment opportunities, as indicated by the count of Census working population versus resident population. Between June 2024 and June 2025, the labour force decreased by 1.4%, with employment decreasing by 2.6%, resulting in an unemployment rate rise of 1.2 percentage points. This contrasts with Greater Perth where employment rose by 3.7% and unemployment rose by 0.1 percentage points. National employment forecasts from Jobs and Skills Australia, published in May 2025, suggest potential future demand within Mount Lawley - Inglewood. These projections estimate national employment growth of 6.6% over five years and 13.7% over ten years. Applying these industry-specific projections to the local employment mix suggests a potential local growth of approximately 6.9% over five years and 14.1% over ten years, though this is a simple weighting extrapolation for illustrative purposes only.
Frequently Asked Questions - Employment
Income
Income metrics indicate excellent economic conditions, with the area achieving higher performance than 75% of national locations assessed by AreaSearch
Mount Lawley - Inglewood has an exceptionally high income level nationally, according to latest ATO data aggregated by AreaSearch for financial year 2022. Its median income among taxpayers is $66,160 and average income stands at $101,249, compared to Greater Perth's figures of $58,380 and $78,020 respectively. Based on Wage Price Index growth of 14.2% since financial year 2022, current estimates would be approximately $75,555 (median) and $115,626 (average) as of September 2025. Census data reveals individual earnings stand out at the 87th percentile nationally ($1,118 weekly). Looking at income distribution, 27.2% of the population (5,089 individuals) fall within the $1,500 - 2,999 income range, consistent with broader trends across regional levels showing 32.0% in the same category. The substantial proportion of high earners (35.5% above $3,000/week) indicates strong economic capacity throughout Mount Lawley - Inglewood. Housing accounts for 14.3% of income while strong earnings rank residents within the 74th percentile for disposable income and the area's SEIFA income ranking places it in the 9th decile.
Frequently Asked Questions - Income
Housing
Mount Lawley - Inglewood displays a diverse mix of dwelling types, with above-average rates of outright home ownership
Mount Lawley-Inglewood's dwelling structure, as per the latest Census, consisted of 54.8% houses and 45.2% other dwellings (semi-detached, apartments, 'other' dwellings). This compares to Perth metro's 37.1% houses and 62.9% other dwellings. Home ownership in Mount Lawley-Inglewood was at 29.5%, with mortgaged dwellings at 33.9% and rented ones at 36.6%. The median monthly mortgage repayment was $2,200, higher than Perth metro's average of $2,167. Median weekly rent in the area was $340, lower than Perth metro's $390. Nationally, Mount Lawley-Inglewood's mortgage repayments were significantly higher at $2,200 compared to Australia's average of $1,863, while rents were lower at $340 compared to the national figure of $375.
Frequently Asked Questions - Housing
Household Composition
Mount Lawley - Inglewood features high concentrations of lone person households and group households, with a higher-than-average median household size
Family households constitute 60.3% of all households, including 25.3% couples with children, 27.0% couples without children, and 6.9% single parent families. Non-family households account for the remaining 39.7%, with lone person households making up 34.4% and group households comprising 5.3%. The median household size is 2.2 people, larger than the Greater Perth average of 2.1.
Frequently Asked Questions - Households
Local Schools & Education
Educational achievement in Mount Lawley - Inglewood places it within the top 10% nationally, reflecting strong academic performance and high qualification levels across the community
In Mount Lawley - Inglewood, educational attainment significantly exceeds regional averages. Among residents aged 15 and above, 49.1% hold university qualifications, compared to 27.9% in Western Australia (WA) and 30.1% in Greater Perth. Bachelor degrees are the most prevalent at 32.6%, followed by postgraduate qualifications at 11.5% and graduate diplomas at 5.0%. Vocational pathways account for 24.5% of qualifications, with advanced diplomas at 10.9% and certificates at 13.6%.
Educational participation is high, with 29.6% of residents currently enrolled in formal education. This includes 10.2% in tertiary education, 7.1% in primary education, and 6.6% pursuing secondary education. The area's five schools have a combined enrollment of 4,734 students. Mount Lawley - Inglewood demonstrates significant socio-educational advantages and academic achievement, with an ICSEA score of 1124. The educational mix includes three primary schools, one secondary school, and one K-12 school. School capacity exceeds typical residential needs, with 25.3 places per 100 residents compared to the regional average of 17.2, indicating that the area serves as an educational center for the broader region.
Frequently Asked Questions - Education
Schools Detail
Nearby Services & Amenities
Transport
Transport servicing is high compared to other areas nationally based on assessment of service frequency, route connectivity and accessibility
Public transport analysis shows 81 active transport stops operating within Mount Lawley - Inglewood. These include a mix of train and bus services. There are 25 individual routes servicing these stops, collectively providing 6,572 weekly passenger trips.
Transport accessibility is rated as good, with residents typically located 204 meters from the nearest transport stop. Service frequency averages 938 trips per day across all routes, equating to approximately 81 weekly trips per individual stop.
Frequently Asked Questions - Transport
Transport Stops Detail
Health
The level of general health in Mount Lawley - Inglewood is notably higher than the national average with both young and old age cohorts seeing low prevalence of common health conditions
Mount Lawley - Inglewood shows superior health outcomes for both young and elderly residents, with low prevalence of common health conditions. Private health cover is exceptionally high, at approximately 72% of the total population of 13,416 people, compared to the national average of 55.3%.
The most prevalent medical conditions are mental health issues (9.6%) and asthma (7.1%), while 71.4% of residents report being completely free from medical ailments, slightly lower than the Greater Perth average of 74.5%. The area has a higher proportion of seniors aged 65 and over, at 16.6% or 3,096 people, compared to 15.1% in Greater Perth. Despite this, health outcomes among seniors are strong and largely align with the general population's health profile.
Frequently Asked Questions - Health
Cultural Diversity
Mount Lawley - Inglewood was found to be more culturally diverse than the vast majority of local markets in Australia, upon assessment of a range of language and cultural background related metrics
Mount Lawley-Inglewood had a higher cultural diversity than most local areas, with 16.8% speaking a language other than English at home and 31.3% born overseas. Christianity was the predominant religion, comprising 42.5%. Judaism was overrepresented at 0.9%, compared to 0.6% in Greater Perth.
The top three ancestry groups were English (26.9%), Australian (19.8%), and Other (9.7%). Polish (1.3%) and Italian (7.1%) were notably overrepresented, while Welsh was slightly higher at 0.8%.
Frequently Asked Questions - Diversity
Age
Mount Lawley - Inglewood's population is slightly younger than the national pattern
The median age in Mount Lawley - Inglewood was 38 years as of a certain date, close to Greater Perth's average of 37 years and equivalent to Australia's median of 38 years. Compared to Greater Perth, Mount Lawley - Inglewood had a higher percentage of residents aged 25-34 (16.9%) but fewer residents aged 5-14 (9.4%). Between the 2021 Census and a certain later date, the population of those aged 75 to 84 grew from 4.1% to 5.2%, while the population of those aged 45 to 54 decreased from 13.1% to 12.2%. By a certain future date in 2041, Mount Lawley - Inglewood is projected to experience significant shifts in its age composition. The 75 to 84 age group is expected to grow by 87%, reaching 1,803 from 963. Those aged 65 and above are projected to comprise 57% of the population growth, while declines are projected for those aged 0 to 4 and 35 to 44.
