Chart Color Schemes
est. as @ -- *
ABS ERP | -- people | --
2021 Census | -- people
Sales Activity
Curious about local property values? Filter the chart to assess the volume and appreciation (including resales) trends and regional comparisons, or scroll to the map below view this information at an individual property level.
Find a Recent Sale
Sales Detail
Population
East Perth lies within the top quartile of areas nationally for population growth performance according to AreaSearch analysis of recent, and medium to long-term trends
As of Aug 2025, East Perth's population is around 14,220. This reflects an increase since the 2021 Census, which reported a population of 11,798 people. The estimated resident population in June 2024 was 14,213, with an additional 9 validated new addresses since the Census date. East Perth's population density is approximately 4,170 persons per square kilometer, placing it in the top 10% of national locations assessed by AreaSearch. Between Aug 2025 and Jun 2024, East Perth experienced a growth rate of 20.5%, exceeding both the national average (8.6%) and the state's growth rate. Overseas migration contributed approximately 92.8% of overall population gains during this period.
AreaSearch is adopting ABS/Geoscience Australia projections for each SA2 area, released in 2024 with a base year of 2022. For areas not covered by this data and to estimate growth post-2032, AreaSearch uses growth rates by age cohort provided by the ABS in its latest Greater Capital Region projections (released in 2023, based on 2022 data). By 2041, East Perth's population is forecasted to increase by 4,124 persons, reflecting a total increase of 28.9% over the 17 years.
Frequently Asked Questions - Population
Development
The level of residential development activity in East Perth was found to be higher than 90% of real estate markets across the country
East Perth has received approximately 187 dwelling approvals annually. The Australian Bureau of Statistics (ABS) produces development approval data on a financial year basis, totalling 936 approvals from FY20 to FY25, with none recorded yet in FY26. On average, East Perth gains 3.6 new residents per year for every dwelling built over the past five financial years. This demand outpaces supply, exerting upward pressure on prices and intensifying competition among buyers.
The average construction cost of dwellings is $1,033,000, indicating that developers target the premium market segment with high-end properties. In FY26, commercial development approvals amount to $5.6 million, reflecting the area's residential character. Compared to Greater Perth, East Perth has slightly more development activity, with 31.0% above the regional average per person over the past five years. This maintains good buyer choice while supporting existing property values.
New building activity shows a skew towards compact living, with 99.0% townhouses or apartments and only 1.0% detached houses. This offers affordable entry pathways, attracting downsizers, investors, and first-time purchasers. East Perth has around 1441 people per dwelling approval, reflecting a highly mature market. Looking ahead, East Perth is projected to grow by 4,117 residents by 2041. With current construction levels, housing supply should meet demand adequately, creating favourable conditions for buyers and potentially enabling growth that exceeds current forecasts.
Frequently Asked Questions - Development
Infrastructure
East Perth has limited levels of nearby infrastructure activity, ranking in the 13thth percentile nationally
Changes in local infrastructure significantly affect an area's performance. AreaSearch has identified 51 projects that may impact this region. Notable projects include Garden Towers East Perth, Riverside Redevelopment, East Perth Affordable and Social Housing Project, and Royal Perth Hospital ICU Redevelopment. The following list details those likely to be most relevant.
Professional plan users can use the search below to filter and access additional projects.
INFRASTRUCTURE SEARCH
Frequently Asked Questions - Infrastructure
METRONET
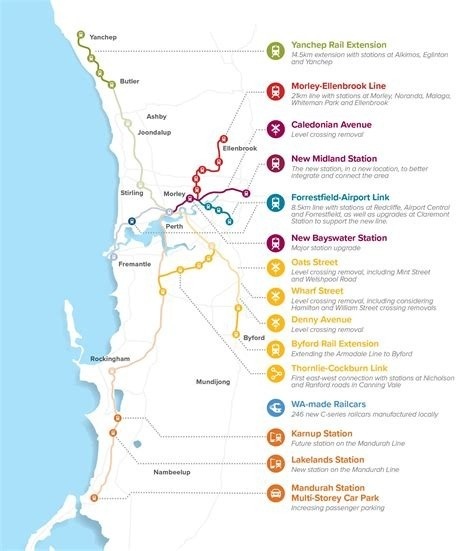
METRONET is Western Australia's transformational public transport program, constructing approximately 72 kilometres of new passenger rail and 23 new stations across Perth's network. The program includes multiple completed and ongoing projects including the Thornlie-Cockburn Link (opened June 2025), Byford Rail Extension (opening October 2025), Yanchep Rail Extension (opened July 2024), Morley-Ellenbrook Line (opened December 2024), and Victoria Park-Canning Level Crossing Removal. METRONET represents the single largest investment in public transport Perth has seen, with a total value of $10.5 billion, and includes high capacity signalling upgrades, 246 new C-series railcars manufactured locally, and multiple level crossing removals.
Riverside Redevelopment
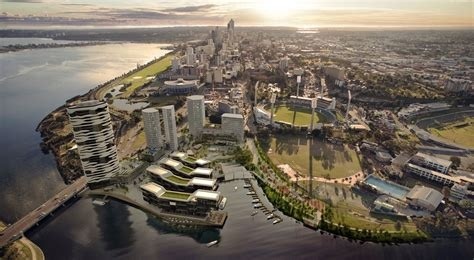
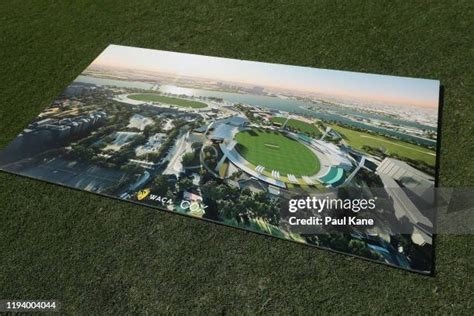
Prime riverfront location offering around 4,500 new apartments and townhouses with sustainable designs. Around 7,000 new residents planned. Includes 80,000m2 commercial space and 100,000m2 retail space.
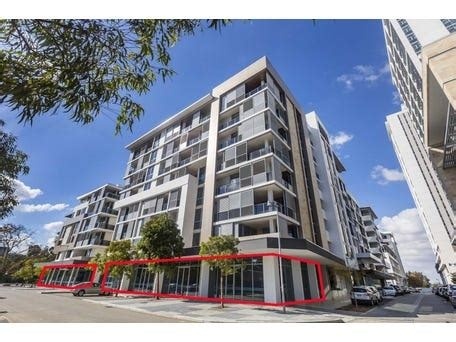
Edith Cowan University City Campus
Australia's first comprehensive inner-city university campus spanning 11 super-levels and 65,000 square metres. Houses Western Australian Academy of Performing Arts (WAAPA), School of Business and Law, creative industries programs, and emerging technology faculties. Features six world-class WAAPA performance venues hosting 300+ public performances annually, dynamic digital facade, integrates Perth Busport, and will accommodate 10,000+ students and staff. $853M joint investment by Australian Government, WA Government, and ECU.
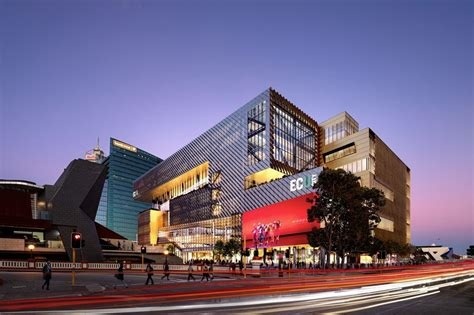
Shoppe on Langley Park Retail Precinct Redevelopment
Redevelopment of a waterfront retail and entertainment precinct with restaurants, medical centre, health and wellness clinics, childcare, pharmacy, supermarket, liquor store, and entertainment areas, linked to Residence on Langley Park hotel and serviced apartments. Car park open with 435 bays. Precinct is in leasing phase with completion forecast in 2025.
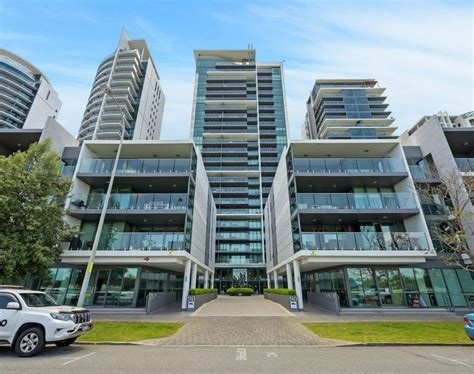
Perth City Link Redevelopment
13.5-hectare transformative urban redevelopment reconnecting CBD with Northbridge. Features ECU City campus, mixed-use residential towers by Oceania Capital Group and Erben Place. Major boost to Perth's long-term housing supply with thousands of new apartments.
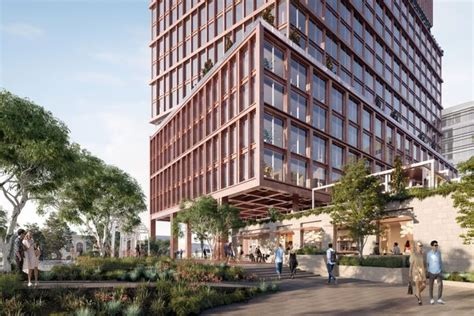
East Perth Power Station Redevelopment
$218 million redevelopment of heritage-listed power station by Swan River. Joint venture between Andrew Forrest's companies to create 8.5-hectare waterfront precinct redevelopment with mixed-use development featuring residential, commercial, recreational, tourism, retail, hospitality, and cultural facilities while preserving heritage elements. Site preparation works commenced with masterplanning underway.
Garden Towers East Perth
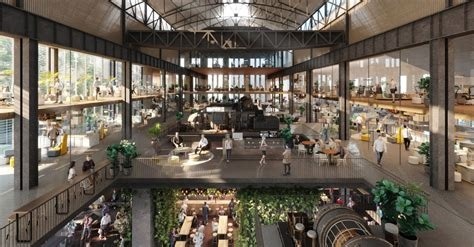
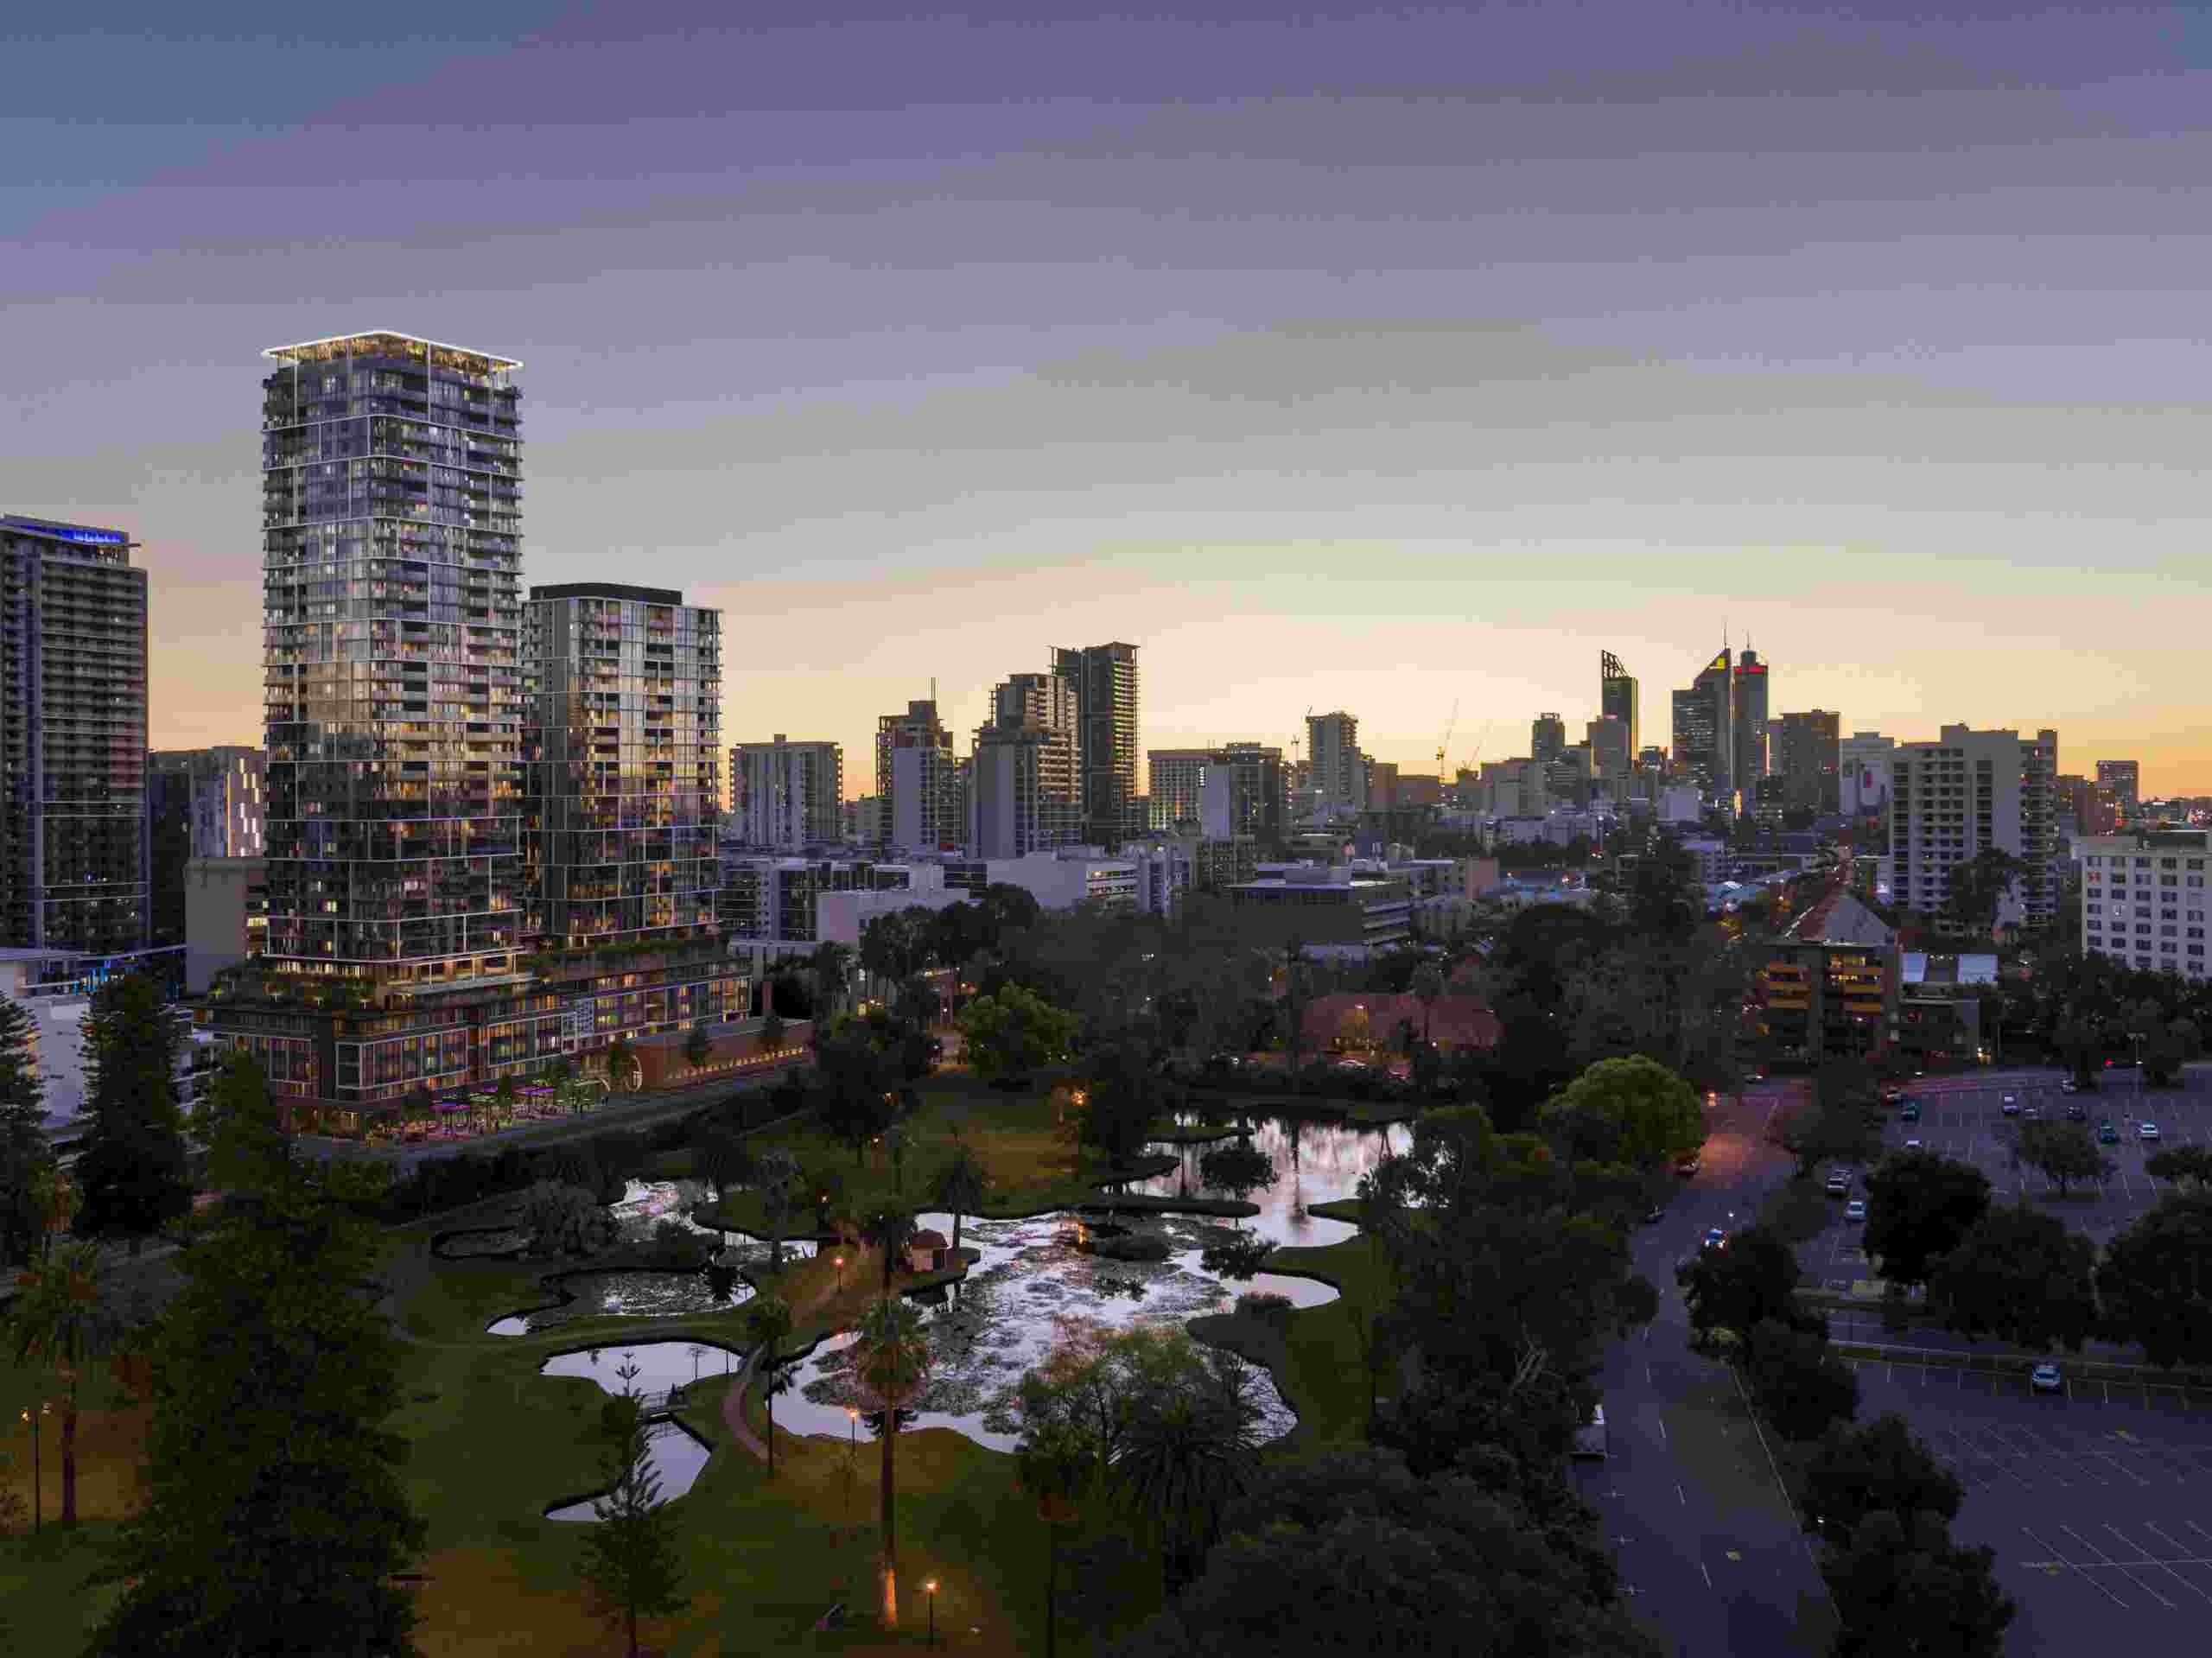
Finbar Group's $243 million Garden Towers comprises 331 apartments across two towers (27 and 38 storeys) with ground floor retail, sky deck, bar, pool, gym, and entertainment hub. 70% sold with construction commenced, featuring luxury amenities, sweeping curves design and repurposing of former Materials Science Building. Mixed-use development transforming underutilised industrial land into vibrant residential and commercial precinct incorporating heritage Chemistry Centre building with resort-style facilities including pools, gyms, gardens and rooftop terraces.
East Perth Primary School
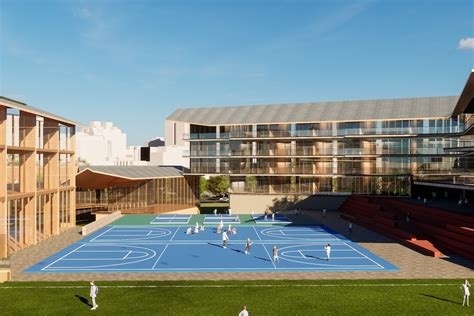
First public primary school in Perth CBD for over 100 years. $165 million fully funded vertical design school with capacity for 600 students, expandable to 800. Opening planned for 2029 school year.
Employment
While East Perth retains a healthy unemployment rate of 3.9%, recent employment declines have impacted its national performance ranking
East Perth has a highly educated workforce with strong representation in professional services. Its unemployment rate is 3.9%.
As of June 2025, 9,766 residents are employed, aligning with Greater Perth's 3.9% unemployment rate and 70.0% workforce participation compared to Greater Perth's 65.2%. Employment is concentrated in professional & technical (1.8 times the regional average), health care & social assistance, and accommodation & food services. Construction employment stands at 5.8%, lower than the regional average of 9.3%. The area hosts more jobs than residents, with a worker-to-resident ratio of 1.5, functioning as an employment hub attracting workers from surrounding areas.
Over the year to June 2025, labour force levels decreased by 1.4% and employment fell by 1.6%, leading to a rise in unemployment rate by 0.2 percentage points. In contrast, Greater Perth saw employment grow by 3.7%. State-level data to Sep-25 shows WA employment contracted by 0.82%, with an unemployment rate of 4.3% compared to the national rate of 4.5%. Jobs and Skills Australia's forecasts from May 2025 project national employment growth of 6.6% over five years and 13.7% over ten years, but local growth patterns differ by industry sector. Applying these projections to East Perth's employment mix suggests local growth of approximately 6.7% over five years and 13.9% over ten years.
Frequently Asked Questions - Employment
Income
Income metrics indicate excellent economic conditions, with the area achieving higher performance than 75% of national locations assessed by AreaSearch
East Perth's median income among taxpayers was $63,262 in financial year 2022. The average income stood at $86,719 during the same period. This compares to figures for Greater Perth of $58,380 and $78,020 respectively. Based on Wage Price Index growth of 11.61% since financial year 2022, current estimates would be approximately $70,607 (median) and $96,787 (average) as of March 2025. According to census data, individual earnings stood out at the 90th percentile nationally ($1,175 weekly). Income brackets indicated that the largest segment comprised 34.4% earning $1,500 - $2,999 weekly (4,891 residents), consistent with broader trends across the broader area showing 32.0% in the same category. High housing costs consumed 17.4% of income, though strong earnings still placed disposable income at the 64th percentile. The area's SEIFA income ranking placed it in the 8th decile.
Frequently Asked Questions - Income
Housing
East Perth features a more urban dwelling mix with significant apartment living, with a higher proportion of rental properties than the broader region
East Perth's dwelling structures, as per the latest Census, consisted of 4.6% houses and 95.4% other dwellings (semi-detached, apartments, 'other' dwellings). In contrast, Perth metro had 37.1% houses and 62.9% other dwellings. Home ownership in East Perth was at 16.7%, with mortgaged dwellings at 21.0% and rented ones at 62.4%. The median monthly mortgage repayment in the area was $1,950, lower than Perth metro's average of $2,167. The median weekly rent figure for East Perth was $410, compared to Perth metro's $390. Nationally, East Perth's mortgage repayments exceeded the Australian average of $1,863, while rents were higher than the national figure of $375.
Frequently Asked Questions - Housing
Household Composition
East Perth features high concentrations of lone person households and group households, with a lower-than-average median household size
Family households compose 50.8% of all households, including 11.5% couples with children, 33.5% couples without children, and 4.5% single parent families. Non-family households constitute the remaining 49.2%, with lone person households at 40.5% and group households comprising 8.7%. The median household size is 1.9 people, which is smaller than the Greater Perth average of 2.1.
Frequently Asked Questions - Households
Local Schools & Education
East Perth demonstrates exceptional educational outcomes, ranking among the top 5% of areas nationally based on AreaSearch's comprehensive analysis of qualification and performance metrics
East Perth has higher educational attainment than broader benchmarks. 54.7% of residents aged 15 and above hold university qualifications, compared to 27.9% in Western Australia and 30.1% in Greater Perth. Bachelor degrees are the most common at 35.3%, followed by postgraduate qualifications (16.3%) and graduate diplomas (3.1%). Vocational pathways account for 24.7% of qualifications among those aged 15 and above, with advanced diplomas at 11.9% and certificates at 12.8%.
Educational participation is high, with 27.1% of residents currently enrolled in formal education. This includes 11.9% in tertiary education, 3.3% in primary education, and 2.7% pursuing secondary education. East Perth's three schools have a combined enrollment of 1,306 students. The area demonstrates significant socio-educational advantages and academic achievement, with an ICSEA score of 1118. The educational mix includes one primary school, one secondary school, and one K-12 school. School places per 100 residents (9.2) are below the regional average (17.2), indicating some students may attend schools in adjacent areas.
Frequently Asked Questions - Education
Schools Detail
Nearby Services & Amenities
Transport
Transport servicing is high compared to other areas nationally based on assessment of service frequency, route connectivity and accessibility
East Perth has 61 active public transport stops offering a mix of train and bus services. These stops are served by 67 routes providing 19,572 weekly passenger trips in total. Residents' accessibility to transport is excellent, with an average distance of 133 meters to the nearest stop.
On average, there are 2,796 trips per day across all routes, equating to approximately 320 weekly trips per individual stop.
Frequently Asked Questions - Transport
Transport Stops Detail
Health
East Perth's residents boast exceedingly positive health performance metrics with very low prevalence of common health conditions across all age groups
East Perth shows excellent health outcomes across all age groups, with very low prevalence of common health conditions. Private health cover is exceptionally high at approximately 64% (9,072 people), compared to Greater Perth's 69.8%. Nationally, this figure stands at 55.3%.
Mental health issues and asthma are the most common medical conditions in East Perth, affecting 7.3% and 5.3% of residents respectively. 78.4% of residents report being completely clear of medical ailments, compared to Greater Perth's 74.5%. The area has 12.9% (1,828 people) of residents aged 65 and over, lower than Greater Perth's 15.1%. Health outcomes among seniors are particularly strong, mirroring the general population's health profile closely.
Frequently Asked Questions - Health
Cultural Diversity
East Perth is among the most culturally diverse areas in the country based on AreaSearch assessment of a range of language and cultural background related metrics
East Perth has a culturally diverse population, with 41.4% speaking a language other than English at home and 60.5% born overseas as of the latest data. Christianity is the predominant religion in East Perth, making up 36.6% of its population. However, Buddhism is more prevalent here compared to Greater Perth, comprising 5.5% versus 4.3%.
The top three ancestry groups are English at 20.8%, Other at 18.7%, and Australian at 11.8%. Notably, the 'Other' group is substantially higher than the regional average of 12.6%, while the Australian group is lower at 11.8% compared to the regional average of 18.0%. Some ethnic groups show notable divergences in representation: Spanish at 1.0% versus 0.6% regionally, Korean at 1.4% versus 0.6%, and Russian at 0.6% versus 0.4%.
Frequently Asked Questions - Diversity
Age
East Perth's population is younger than the national pattern
At 34 years, East Perth's median age is lower than Greater Perth's average of 37 years and considerably younger than Australia's median age of 38 years. Compared to Greater Perth, East Perth has a higher percentage of residents aged 25-34 (30.1%) but fewer residents aged 5-14 (3.2%). This concentration of residents aged 25-34 is well above the national average of 14.5%. Between June 2021 and June 2026, the percentage of East Perth's population in the 75 to 84 age group grew from 3.0% to 4.1%, while the percentage of residents aged 0 to 4 declined from 3.8% to 3.0%. Population forecasts for 2041 indicate significant demographic changes for East Perth, with the strongest projected growth in the 25 to 34 age group (19%), adding 793 residents to reach a total of 5,069. In contrast, the 5 to 14 age group shows minimal growth of just 7%, with an increase of 31 people.
