Chart Color Schemes
est. as @ -- *
ABS ERP | -- people | --
2021 Census | -- people
Sales Activity
Curious about local property values? Filter the chart to assess the volume and appreciation (including resales) trends and regional comparisons, or scroll to the map below view this information at an individual property level.
Find a Recent Sale
Sales Detail
Population
Rivervale lies within the top quartile of areas nationally for population growth performance according to AreaSearch analysis of recent, and medium to long-term trends
Rivervale's population is approximately 12,852 as of November 2025. This figure represents an increase of 1,955 people since the 2021 Census, which recorded a population of 10,897. The rise is inferred from the estimated resident population of 12,481 in June 2024 and the addition of 223 validated new addresses post-Census. This results in a population density ratio of 3,847 persons per square kilometer, placing Rivervale in the top 10% nationally according to AreaSearch's assessments. The area's growth rate of 17.9% since the 2021 Census exceeds both national (8.9%) and state averages, positioning it as a regional growth leader. Overseas migration contributed approximately 74.7% of Rivervale's population gains during recent periods.
AreaSearch uses ABS/Geoscience Australia projections for each SA2 area, released in 2024 with a base year of 2022. For areas not covered by this data and post-2032 growth estimation, AreaSearch employs age cohort growth rates provided by the ABS in its latest Greater Capital Region projections (released in 2023, based on 2022 data). Future population trends indicate a significant increase in Rivervale's top quartile of statistical areas. By 2041, the area is forecasted to gain an additional 3,752 persons, reflecting a total increase of 26.3% over the 17-year period based on current population numbers.
Frequently Asked Questions - Population
Development
AreaSearch assessment of residential development activity positions Rivervale among the top 25% of areas assessed nationwide
Rivervale has received approximately 89 dwelling approvals annually over the past five financial years, totalling 448 homes. As of FY26163 approvals have been recorded. On average, each home built between FY21 and FY25 accommodates three new residents per year. This demand outpaces supply, typically leading to price growth and increased buyer competition.
The average construction cost for new homes is $334,000. In the current financial year, commercial approvals amount to $7.4 million, reflecting Rivervale's primarily residential character. Compared to Greater Perth, Rivervale has seen 38.0% more development per person over the past five years, maintaining good buyer choice while supporting existing property values. However, development activity has slowed in recent periods.
New building activity consists of 40.0% detached houses and 60.0% townhouses or apartments, catering to affordable entry pathways and attracting downsizers, investors, and first-time purchasers. With around 251 people per dwelling approval, Rivervale indicates a developing market. By 2041, Rivervale is projected to grow by 3,381 residents. Construction pace aligns with projected growth, but increasing population may intensify buyer competition.
Frequently Asked Questions - Development
Infrastructure
Rivervale has moderate levels of nearby infrastructure activity, ranking in the top 50% nationally
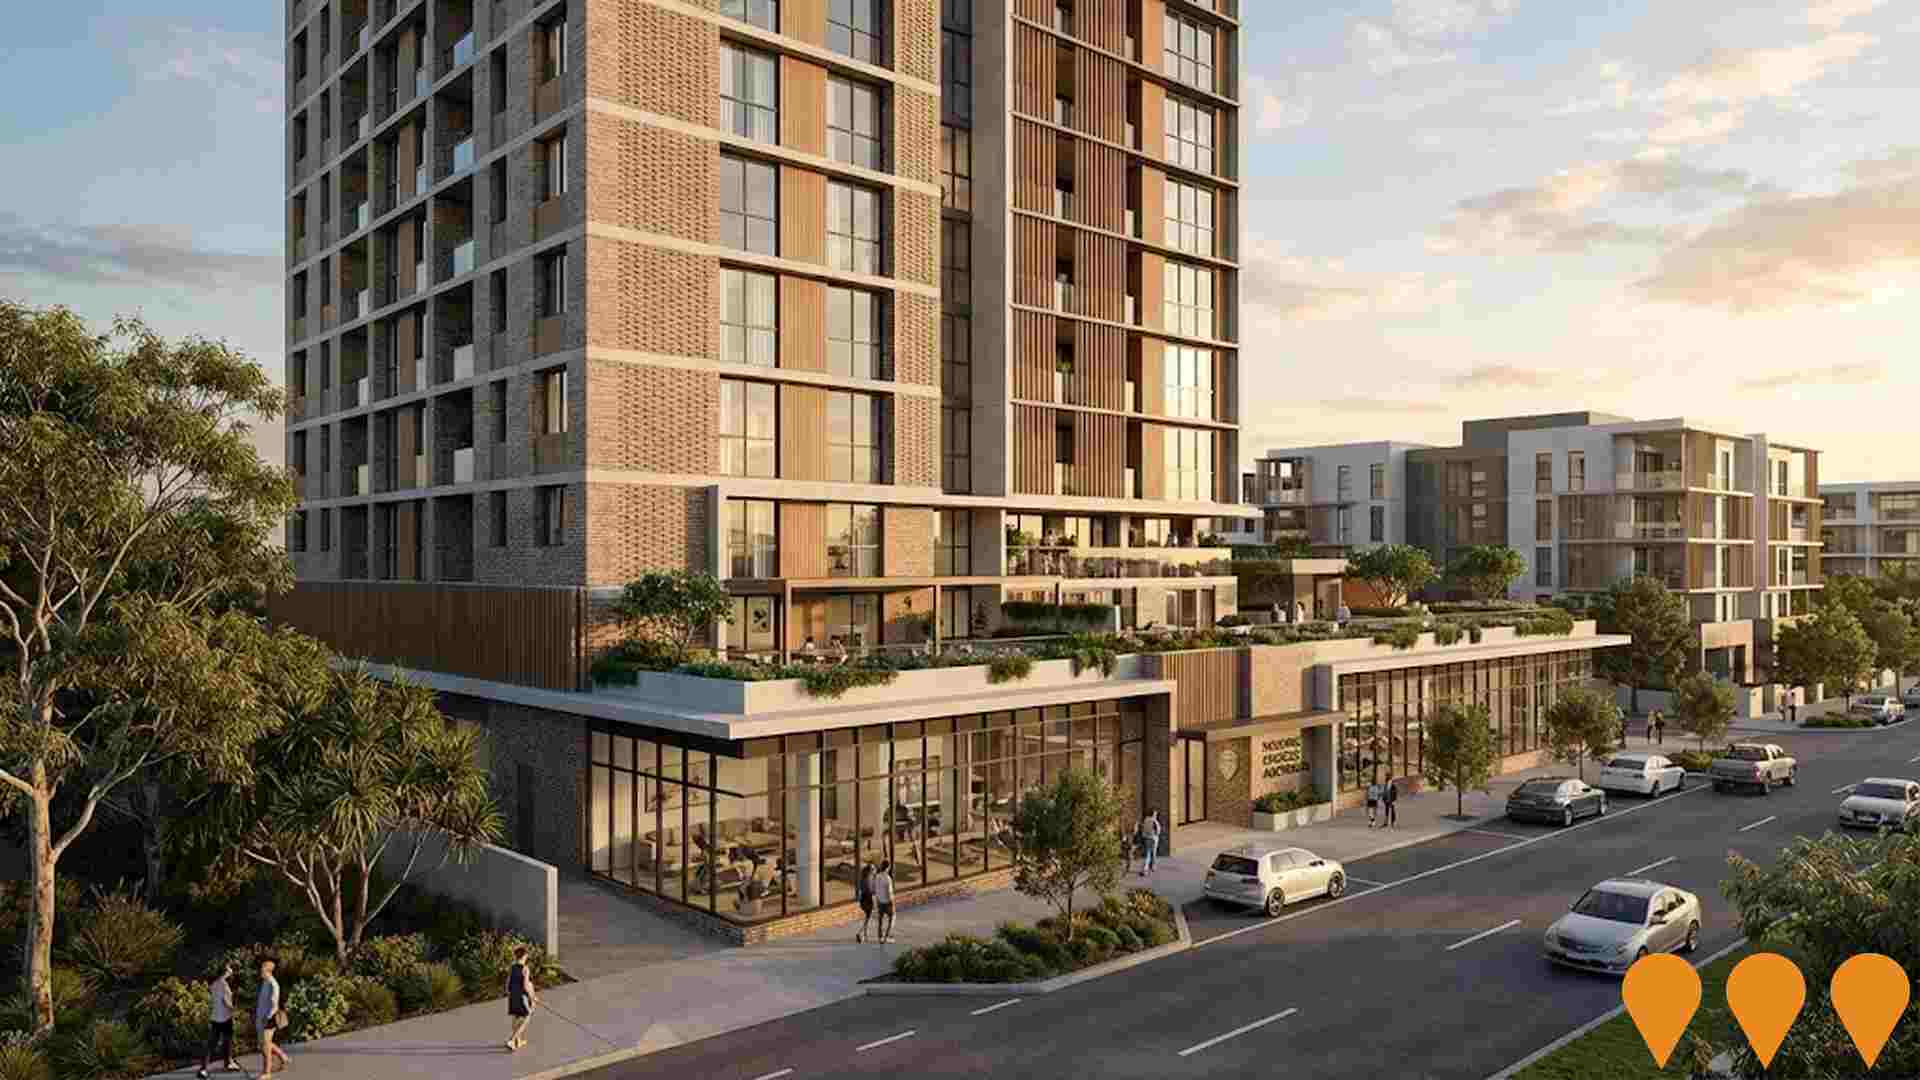
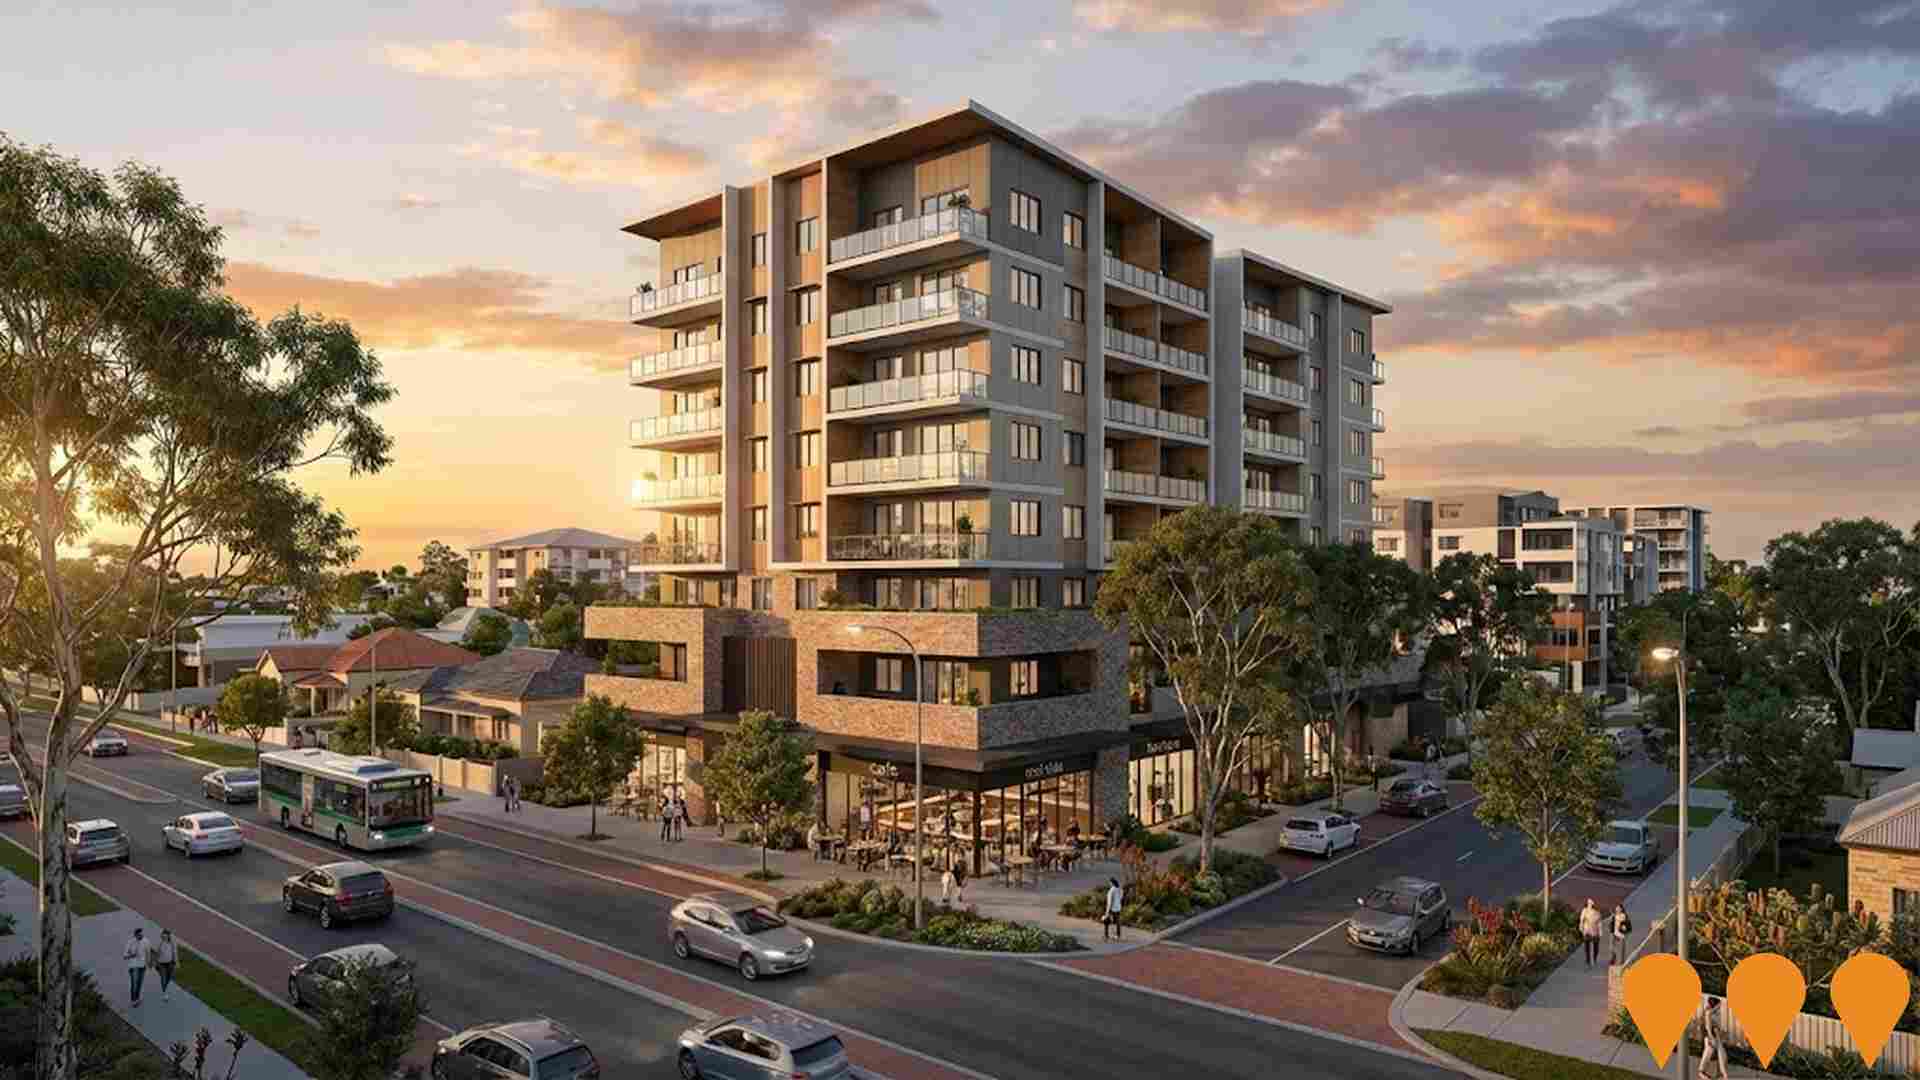
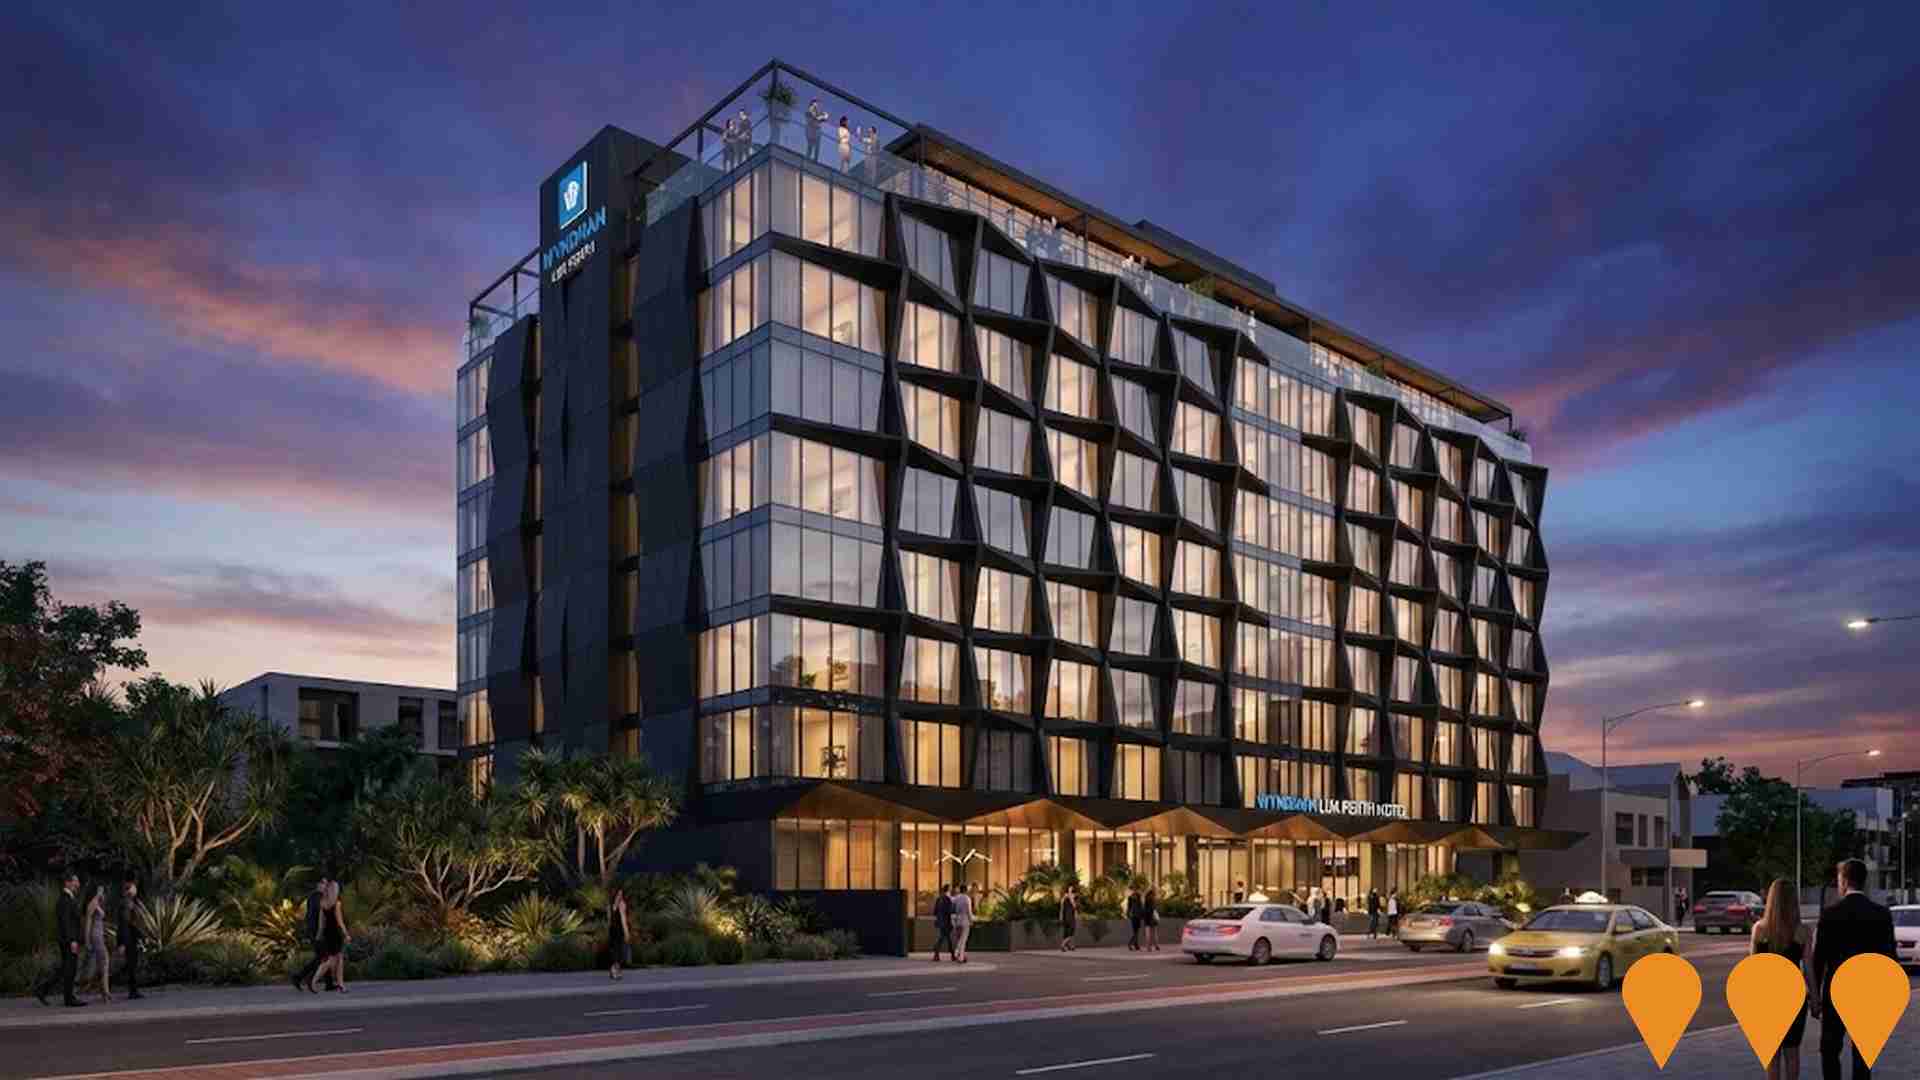
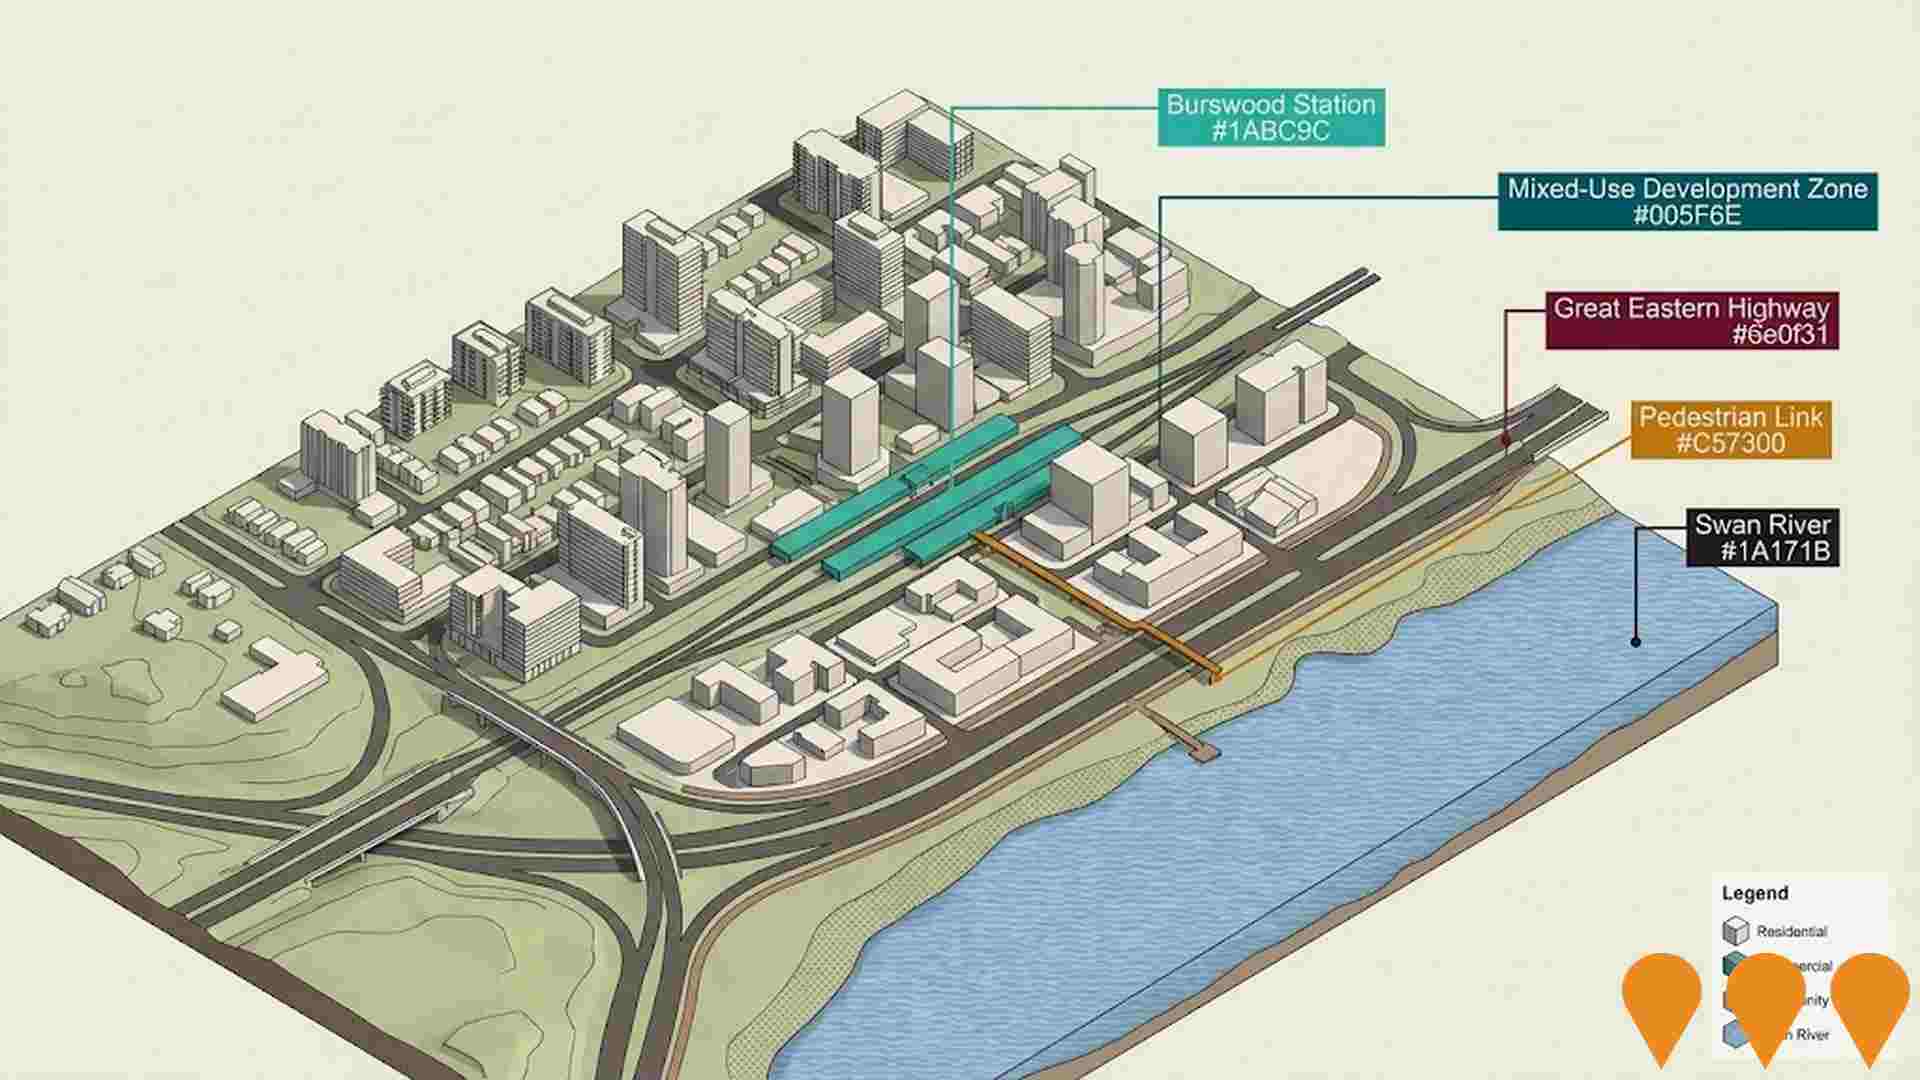
The performance of an area is significantly influenced by changes to local infrastructure, major projects, and planning initiatives. AreaSearch has identified a total of 31 such projects that are likely to impact the area. Notable projects include Wyndham LUX Perth Hotel at 61-65 Great Eastern Highway, Burswood Station East Planning Framework, 6 Homelea Court Build-to-Rent Development, and Lathlain Precinct Redevelopment Project. The following list details those projects considered most relevant.
Professional plan users can use the search below to filter and access additional projects.
INFRASTRUCTURE SEARCH
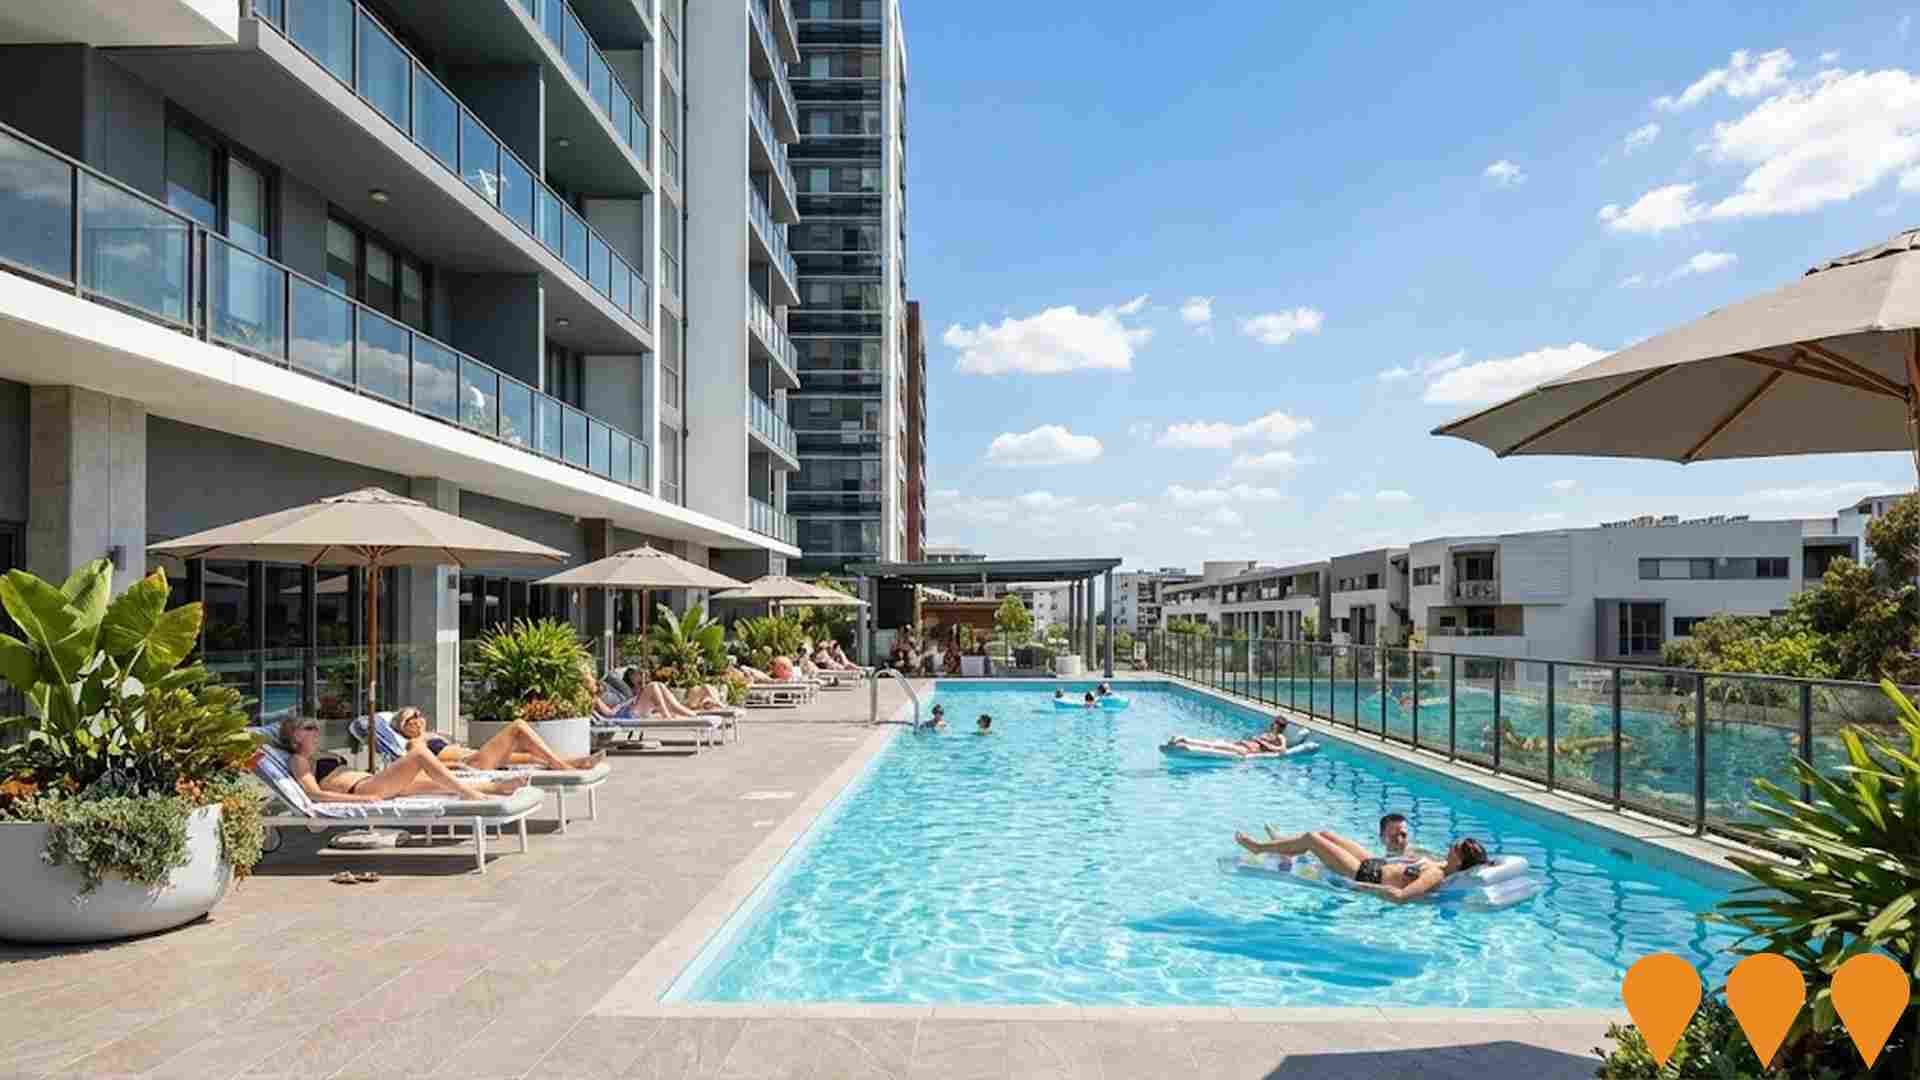
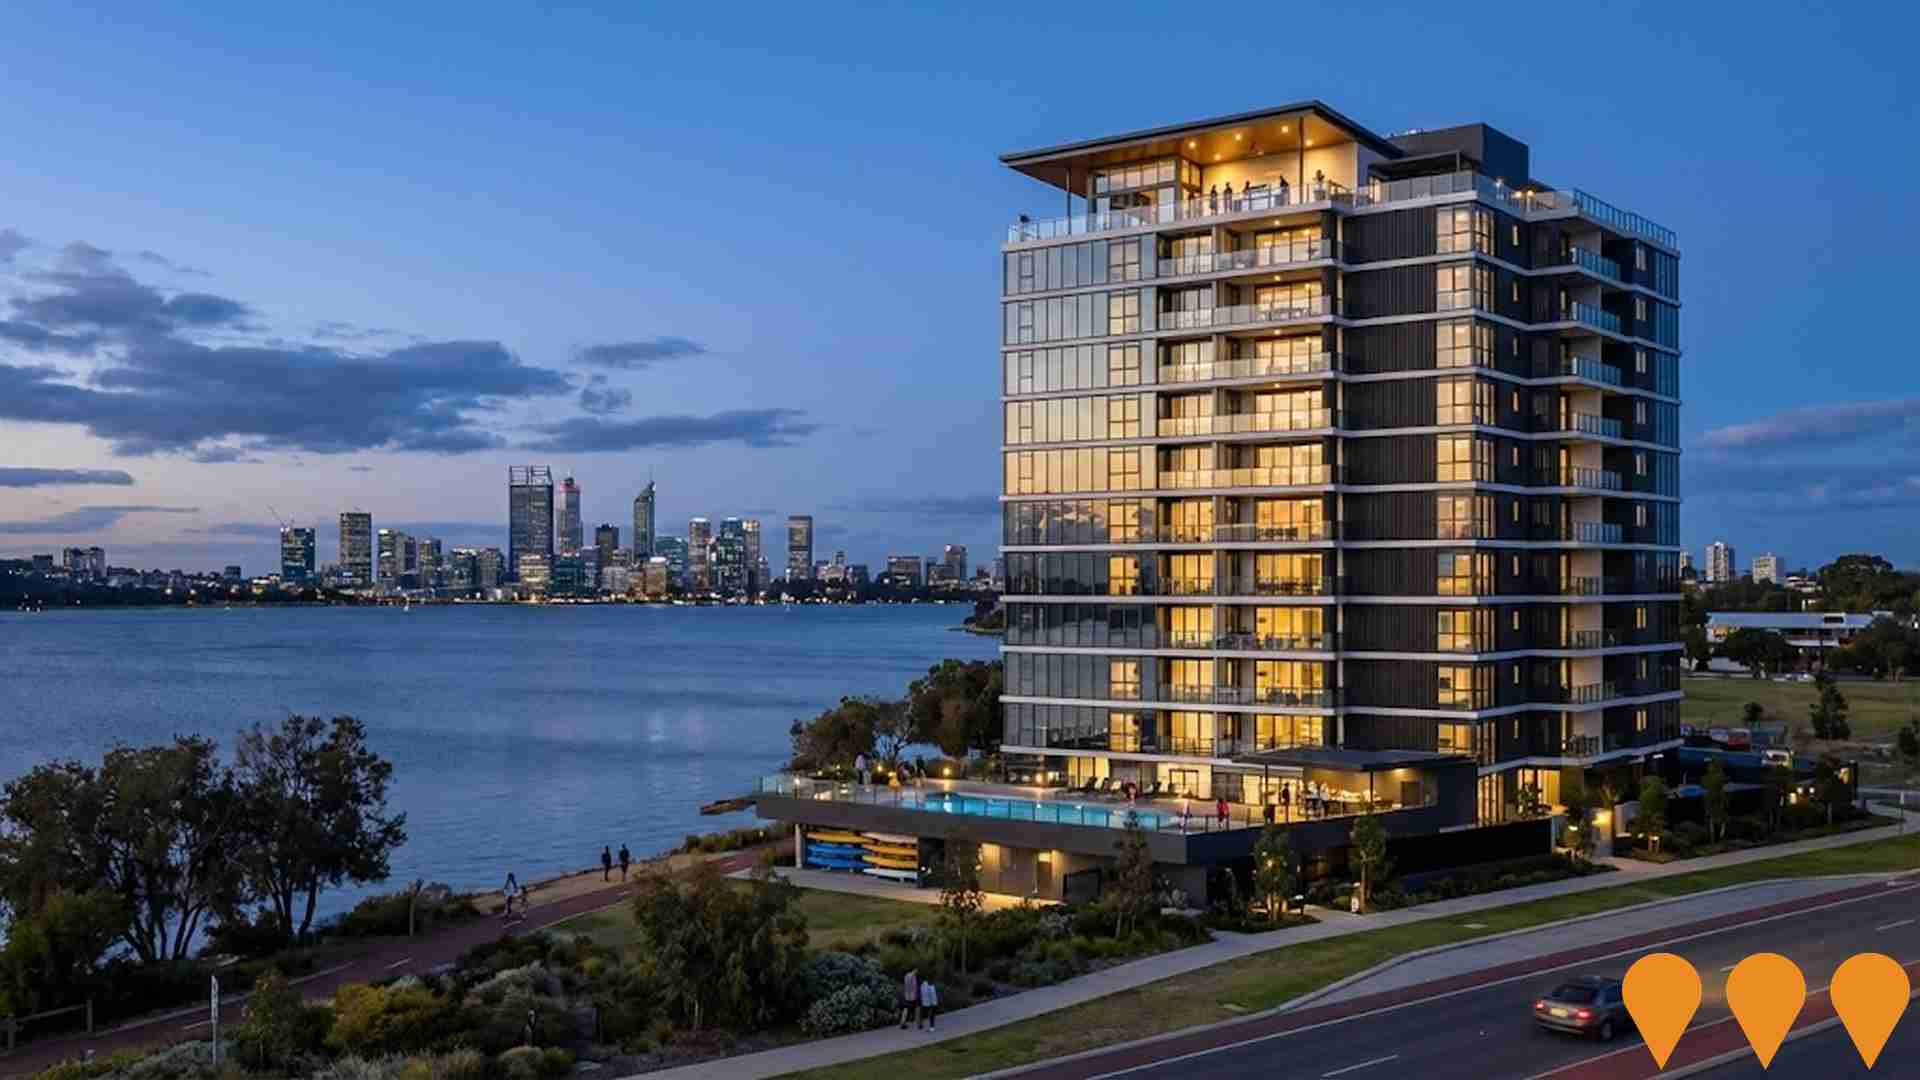
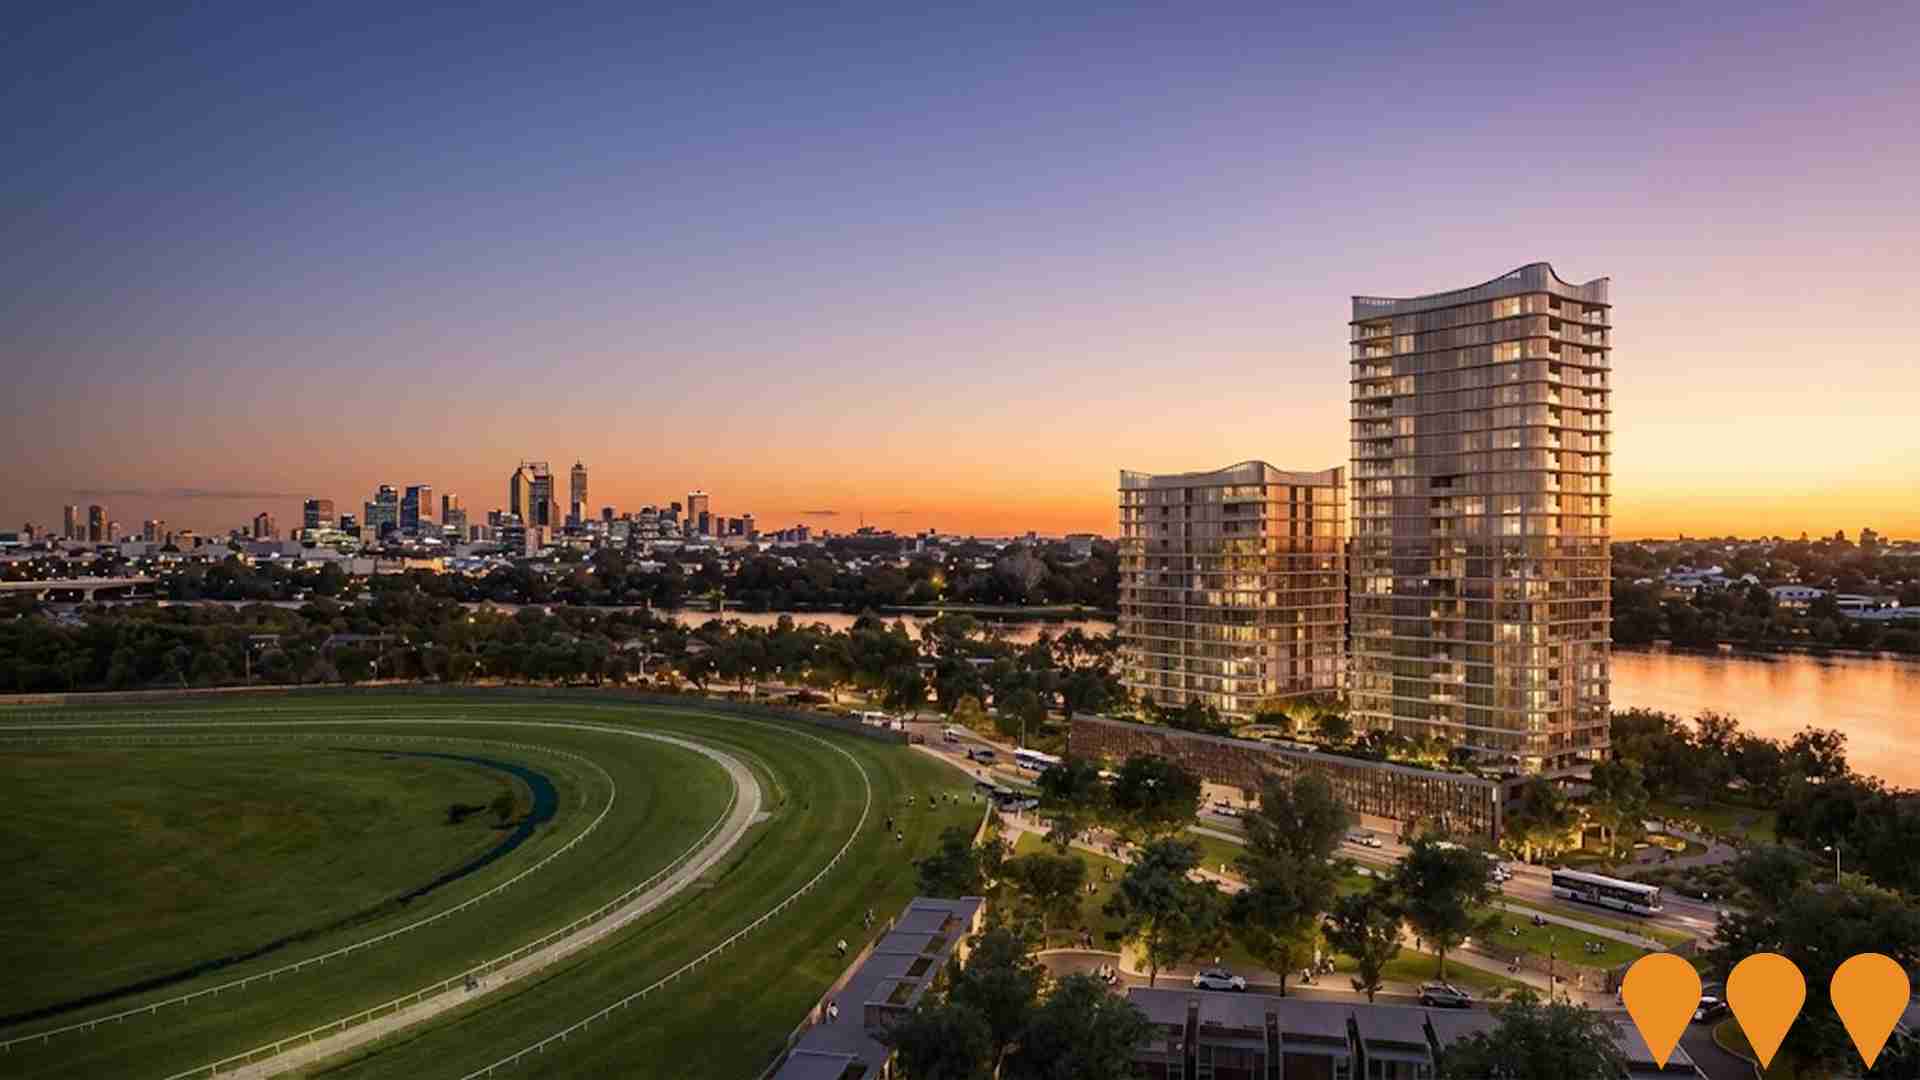
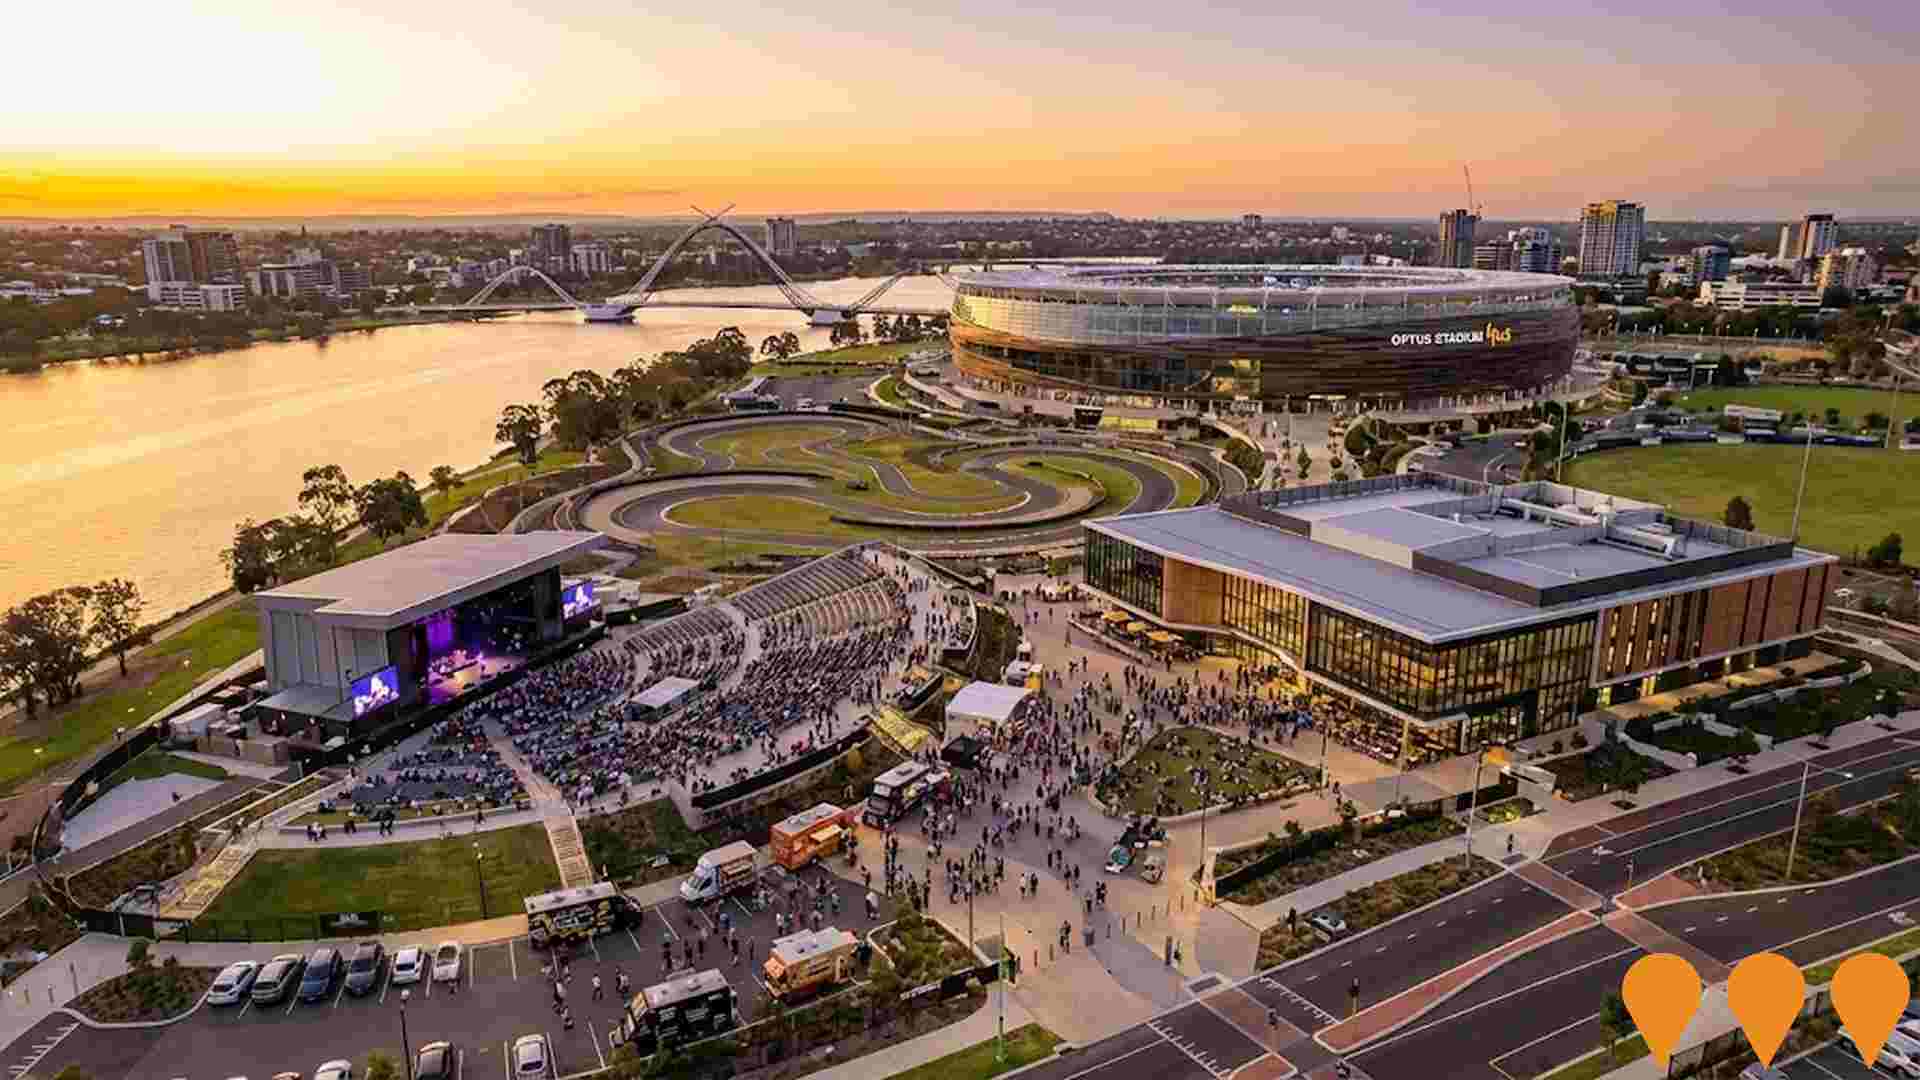
 Denotes AI-based impression for illustrative purposes only, not to be taken as definitive under any circumstances. Please follow links and conduct other investigations from the project's source for actual imagery. Developers and project owners wishing us to use original imagery please Contact Us and we will do so.
Frequently Asked Questions - Infrastructure
Burswood Point
Burswood Point is Perths largest mixed-use urban development transforming 38 hectares around Belmont Racecourse into a vibrant riverfront community. The $3.8 billion project will deliver 4,500 new homes including luxury apartments and green-title residences, 91,000 sqm of retail and commercial space, a five-star hotel, restaurants, and 110,000 sqm of parkland along 2.5km of Swan River foreshore. Construction is underway on Somerset East and West, the first two apartment towers comprising 200+ residences, with completion expected Q4 2027. Infrastructure upgrades including road networks, pedestrian bridges over Graham Farmer Freeway, and new bridge connections to Victoria Park Drive have been completed.
Perth Entertainment and Sporting Precinct (PESP)
A $217.5 million multi purpose entertainment and sporting precinct in Burswood Park adjacent to Optus Stadium. The project will deliver a 15,000 to 20,000 seat outdoor amphitheatre for live music and events, a multi use FIA approved motorsport and cycling track, a multi purpose building with event and function spaces, and improved public spaces and transport links. An alliance of Seymour Whyte, Civmec and Aurecon is working with the Office of Major Transport Infrastructure Delivery to progress detailed planning, design, approvals and early works, with construction targeted for 2026 to 2027 and year round community access once complete.
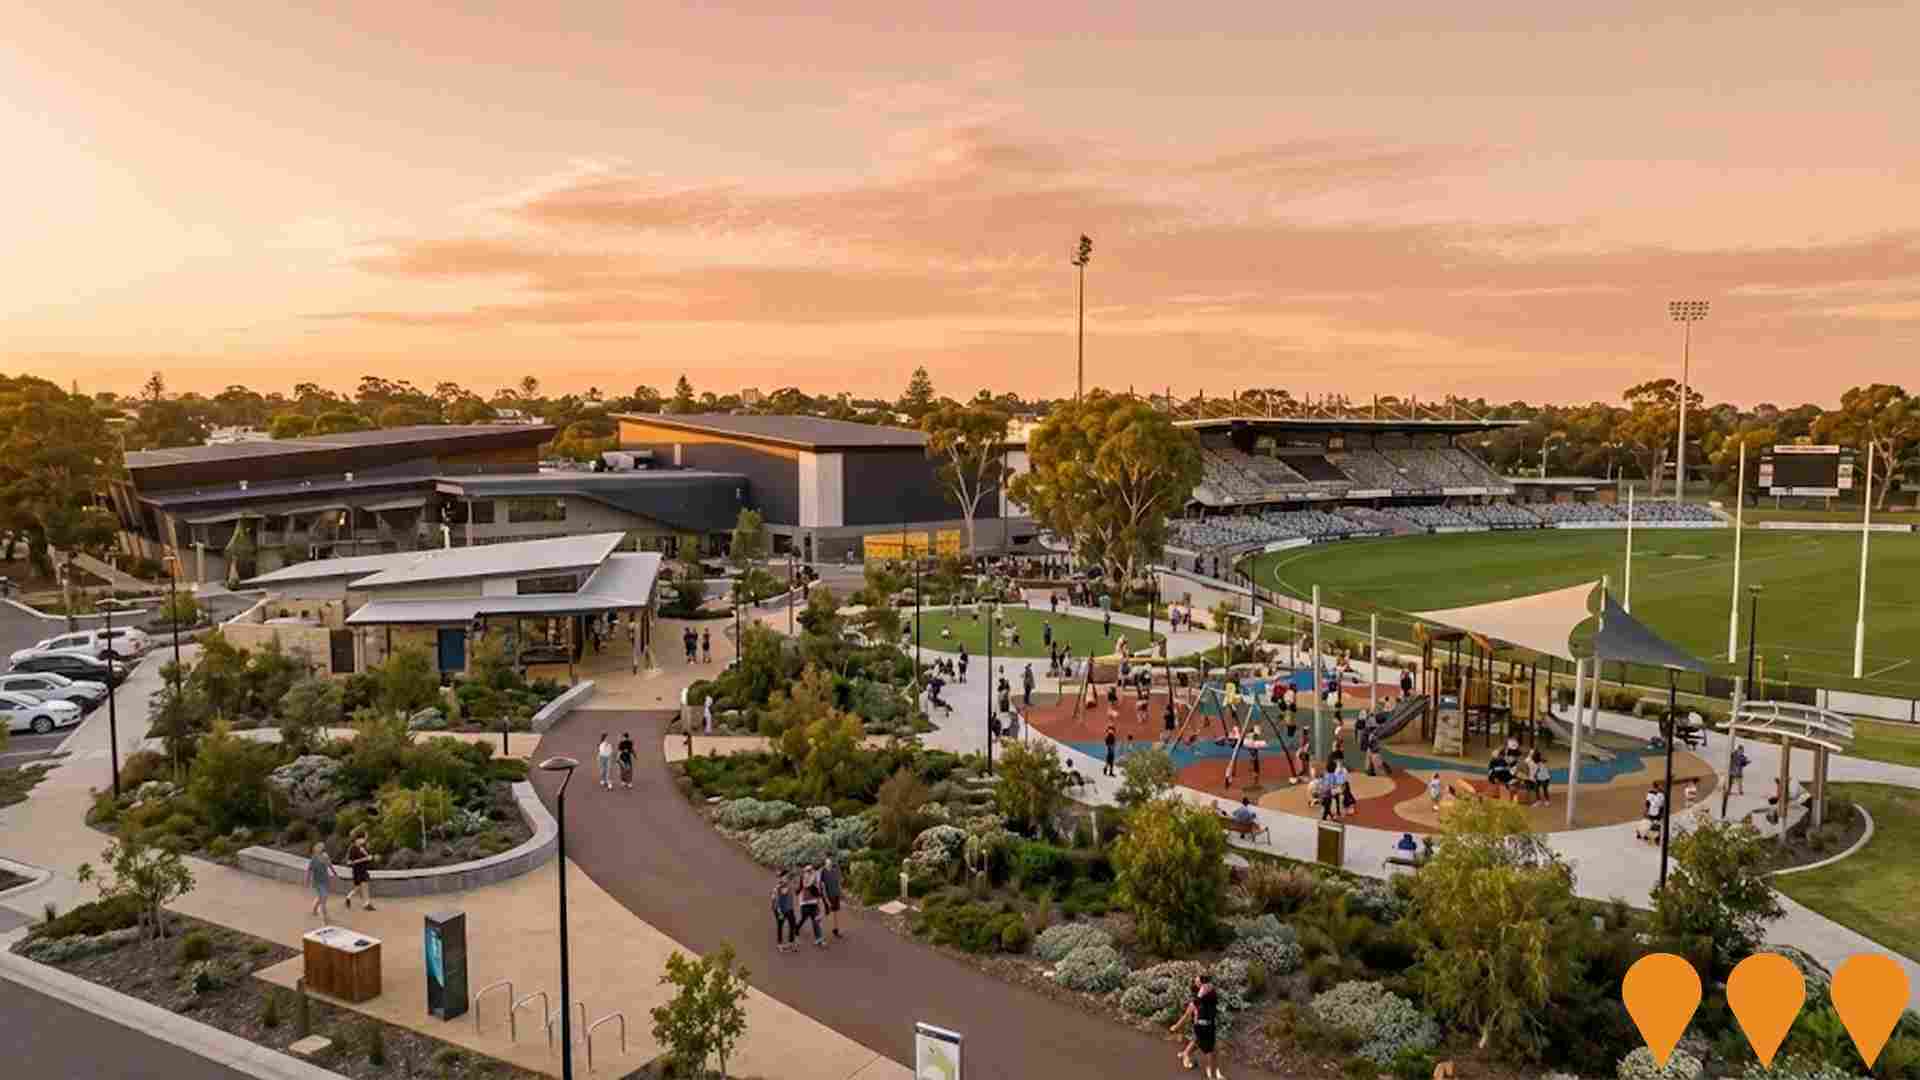
Lathlain Precinct Redevelopment Project
A $100 million revitalisation project creating a world-class sporting and community precinct in Lathlain. The project includes redevelopment of Mineral Resources Park (home to West Coast Eagles and Perth Football Club), community facilities, new public open spaces, and an all-abilities playground.
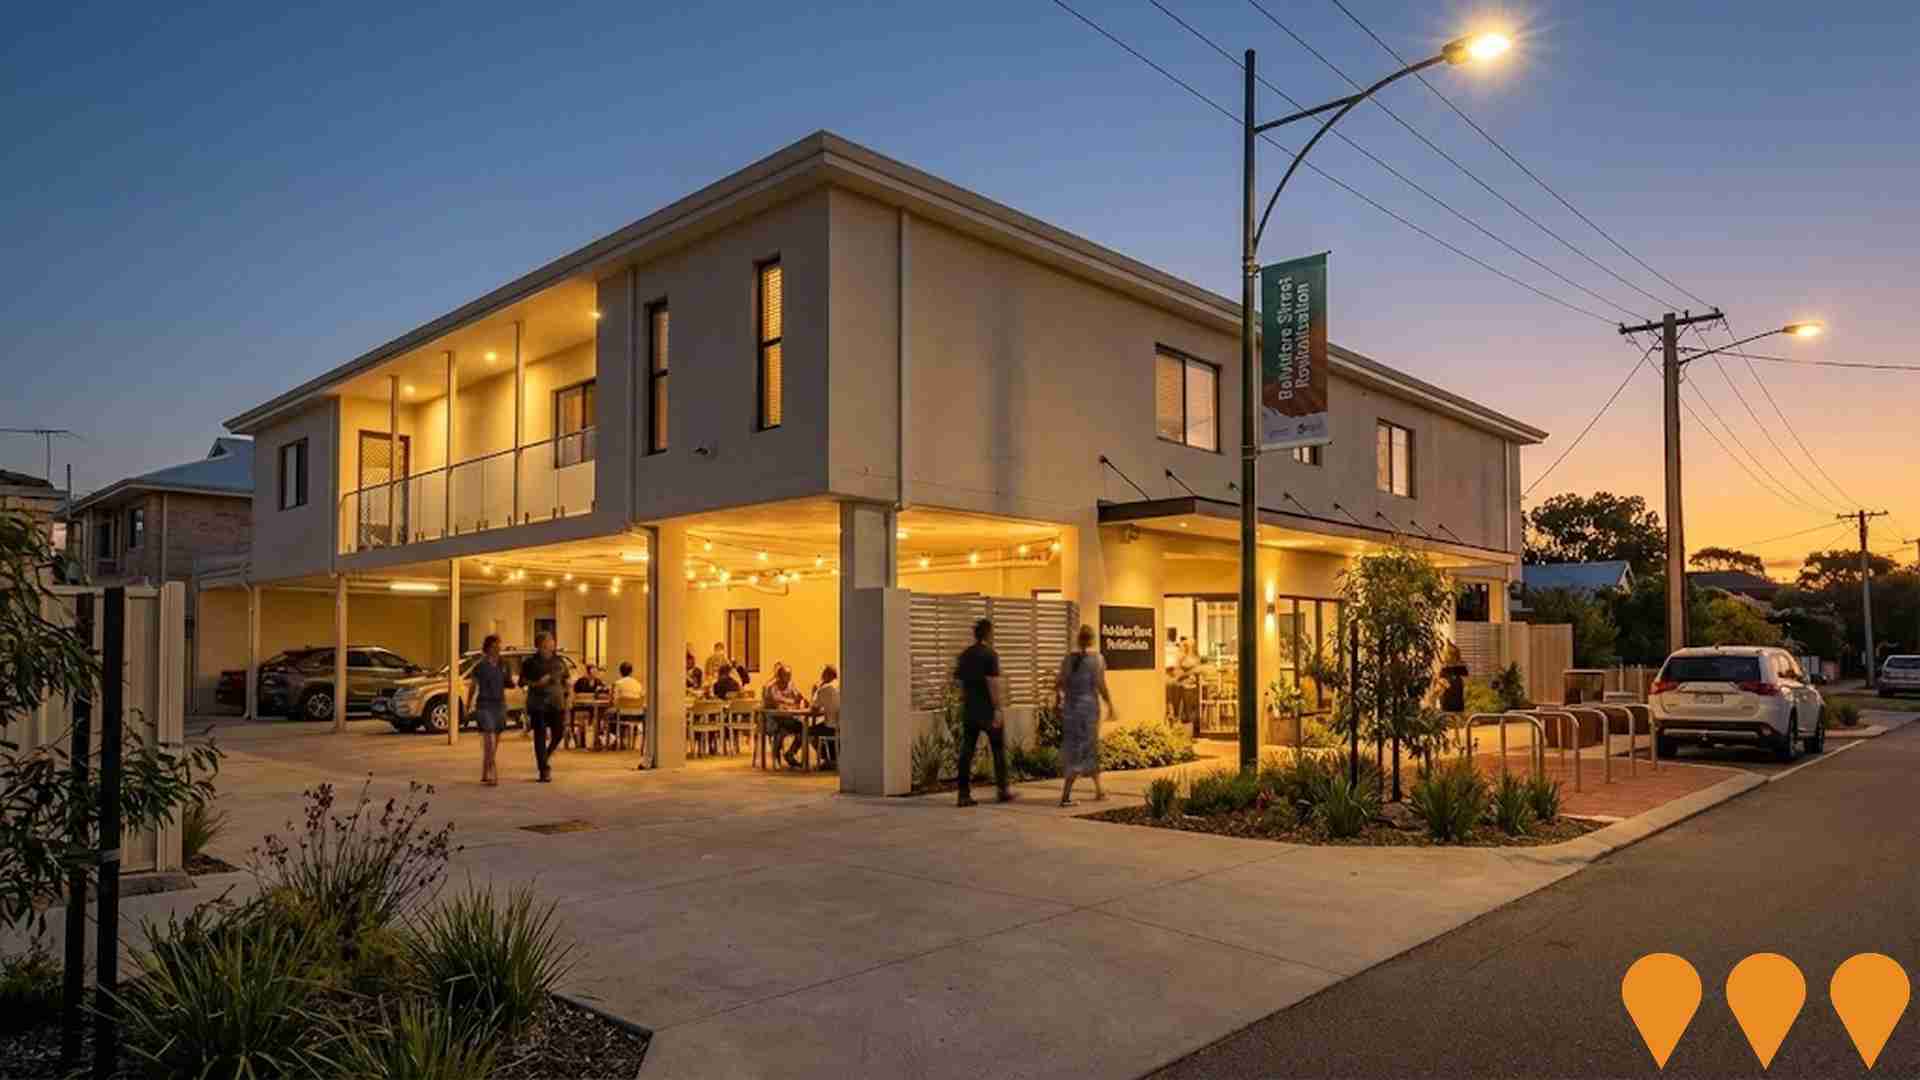
Belvidere Street Revitalisation Project
Streetscape revitalisation project transforming the Belvidere Street Shopping Precinct and Activity Centre to enhance the public realm. The project features alfresco dining areas, green spaces, enhanced lighting, improved pedestrian and cyclist amenities, underground power, and potential small park or community focal point. Project consultants Hatch RobertsDay developed the design with Scenario 3 selected through community consultation. Talis Consulting awarded detailed design and documentation contract in February 2024. Detailed design reached 50% completion milestone in February 2025. Construction tender to be advertised late 2025 with works commencing mid-2026. Project aims to create a vibrant main street that attracts private investment.
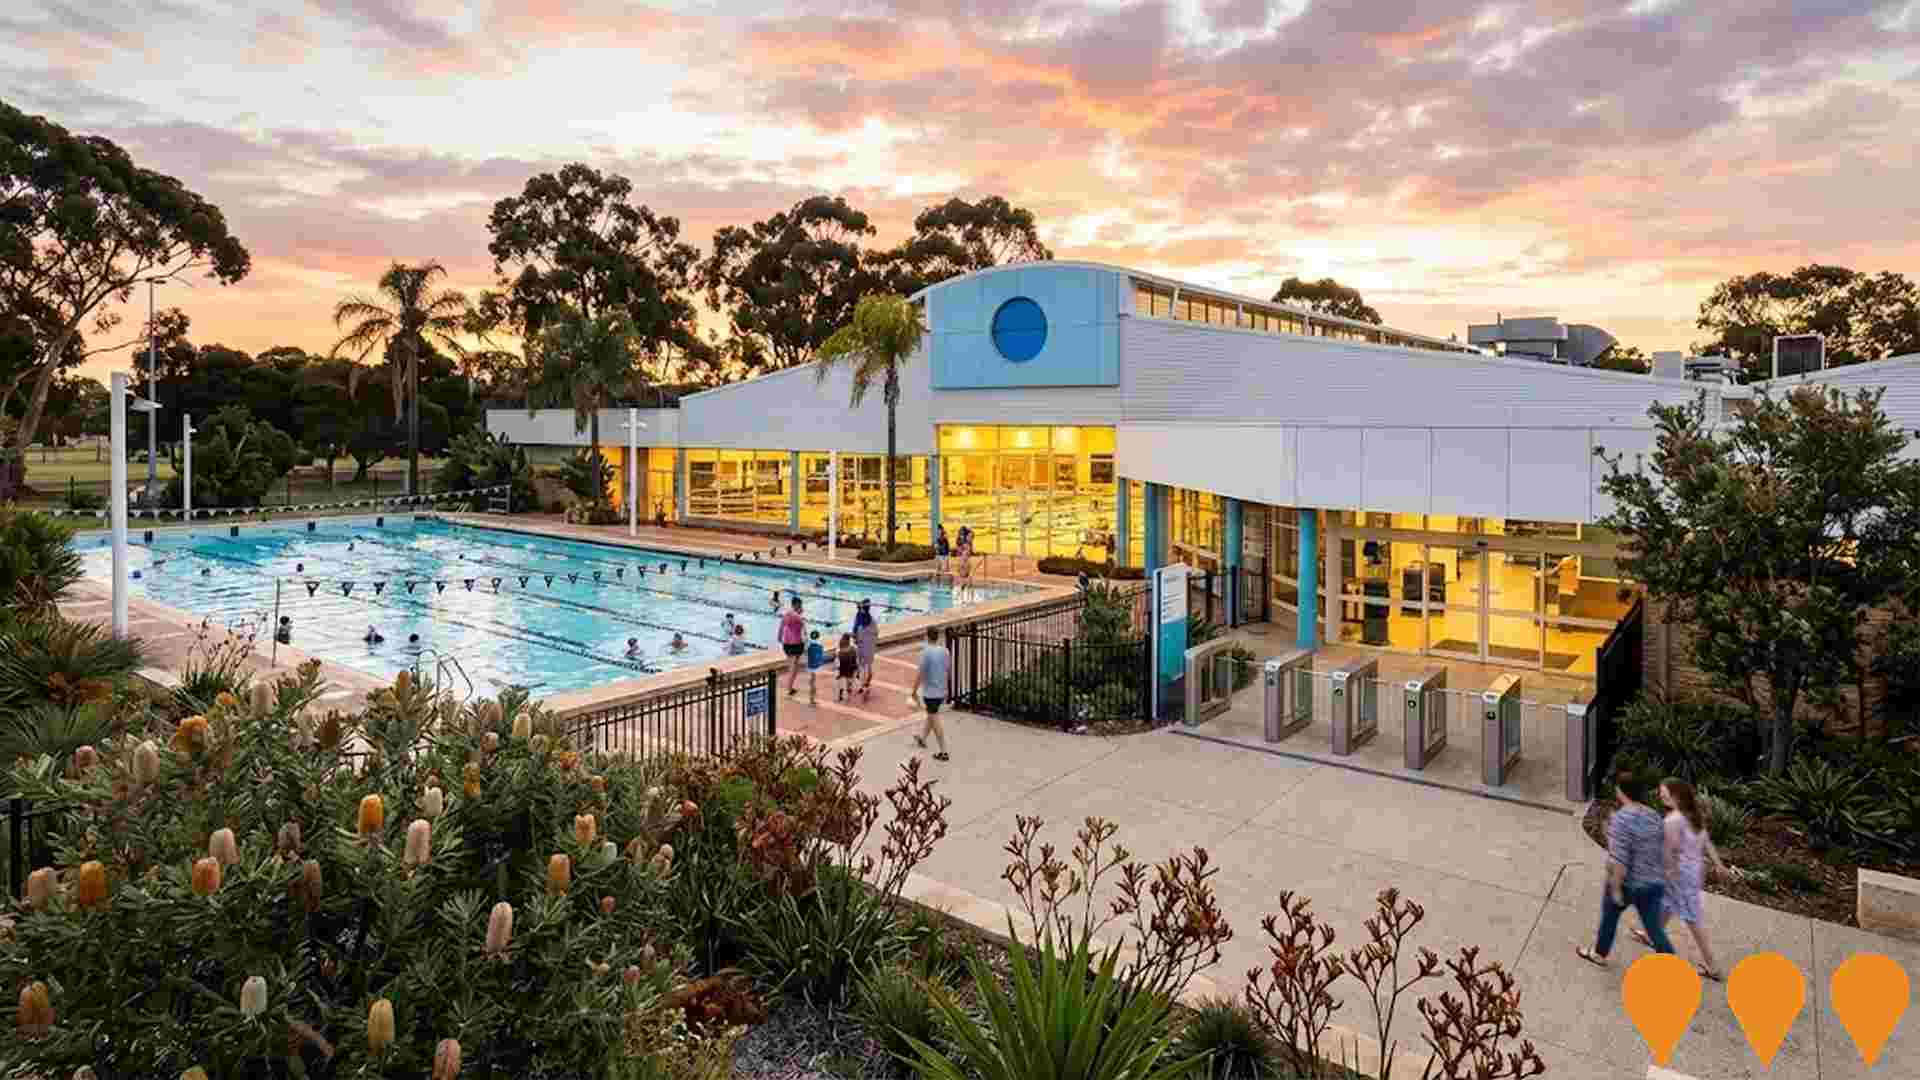
Belmont Oasis Leisure Centre Redevelopment and Upgrades
Ongoing upgrade and refurbishment works at the Belmont Oasis Leisure Centre. The project has included a $1.7 million investment by the City of Belmont for upgrades such as the refurbishment of the health club, group fitness rooms, change rooms, reception, and the installation of a new pool filter and access gates. Earlier feasibility studies also explored the replacement of the outdoor 25m pool with a new contemporary multi-use pool.
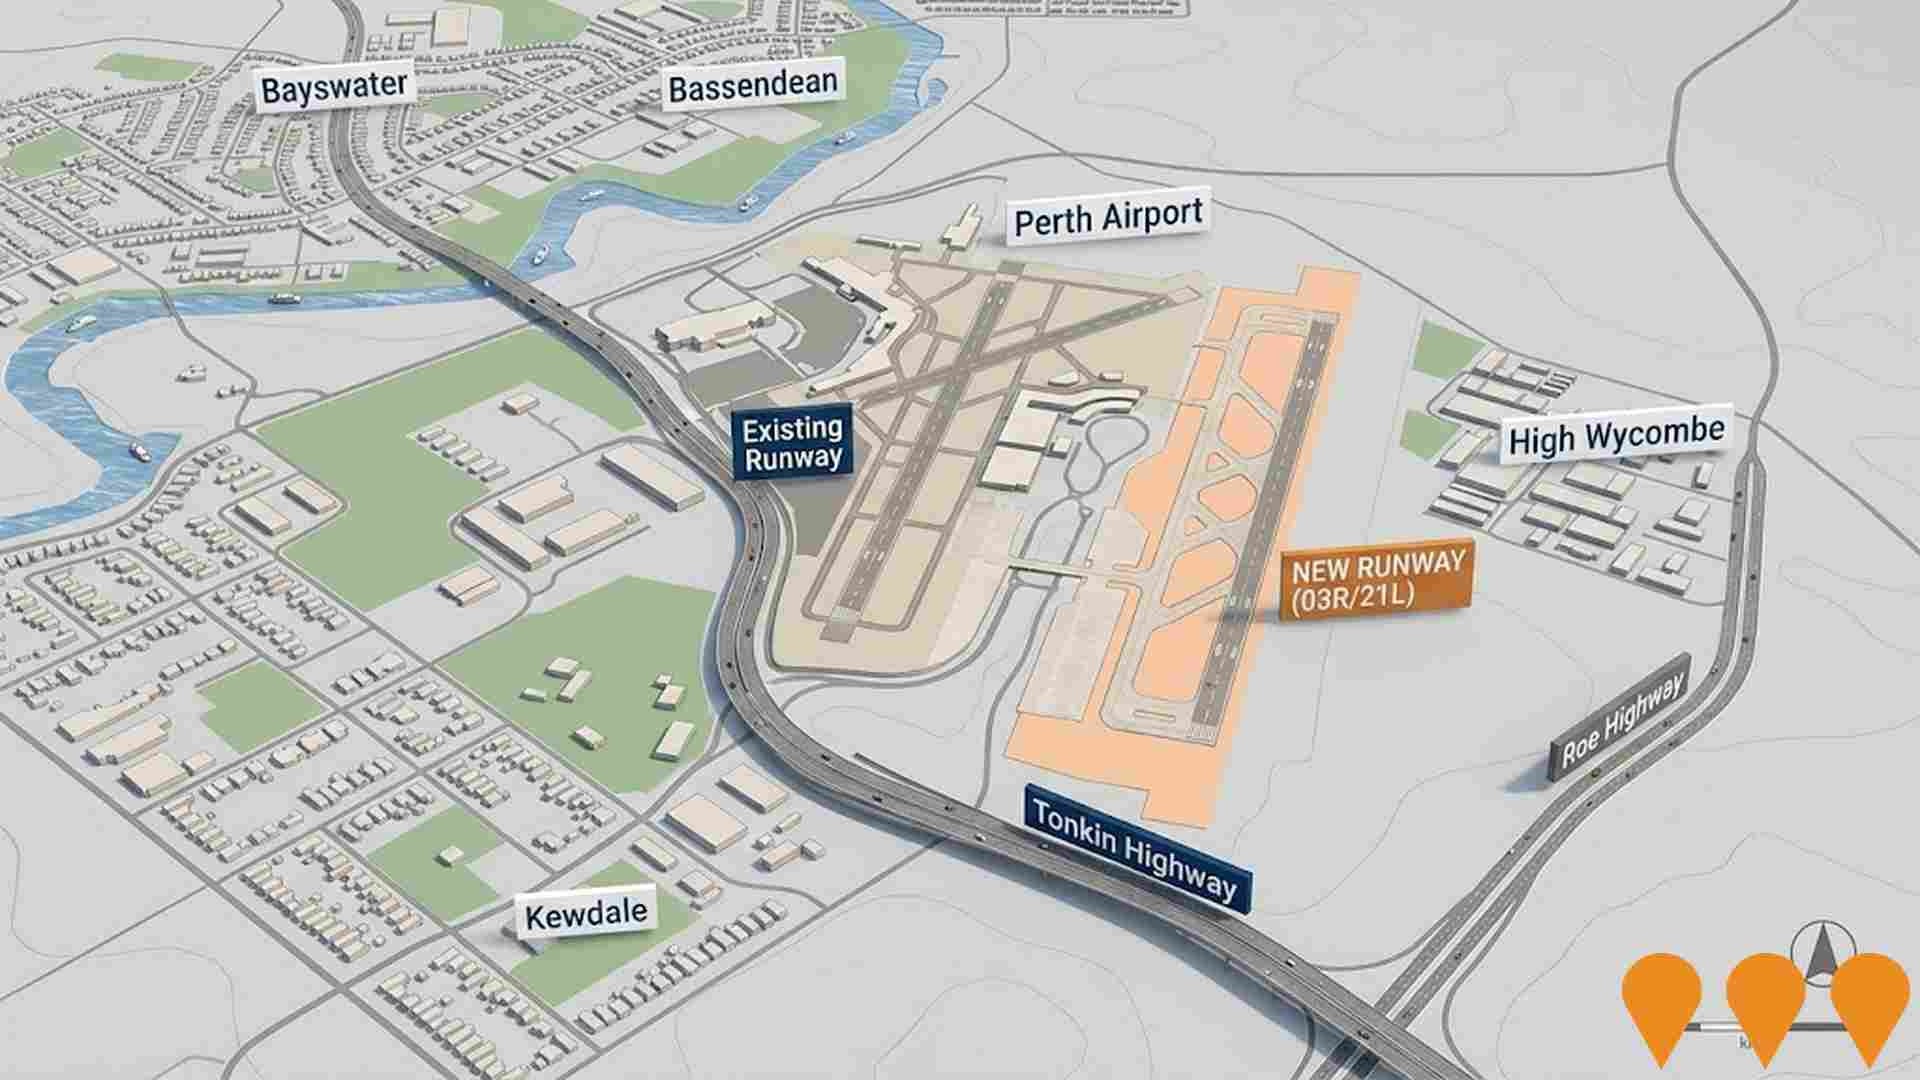
Perth Airport New Runway
Perths New Runway will deliver a new 3,000m long, 45m wide runway (03R/21L) parallel to the existing main runway at Perth Airport. The project includes associated taxiways, lighting, navigational aids, drainage and airfield infrastructure to increase capacity, reduce congestion at peak periods and improve operational efficiency for domestic and international services. The Major Development Plan and environmental offsets have been approved, early works are underway and procurement for major landside works is progressing as part of Perth Airports wider 5 billion dollar One Airport expansion program, with the new runway scheduled to be operational around 2028.
The Esplanade Foreshore Stabilisation and Landscaping
Restoration of the riverbank and enhancement of the open space at The Esplanade foreshore in Ascot, which is currently undergoing natural erosion. The works include maintenance of existing gabion and retaining walls, installation of a rock revetment and brush mattress, upgrades to stormwater facilities, a viewing deck, walkways, extensive native revegetation, and a nature play area. The project aims to create safe, accessible, and sustainable riverbanks and accessways.

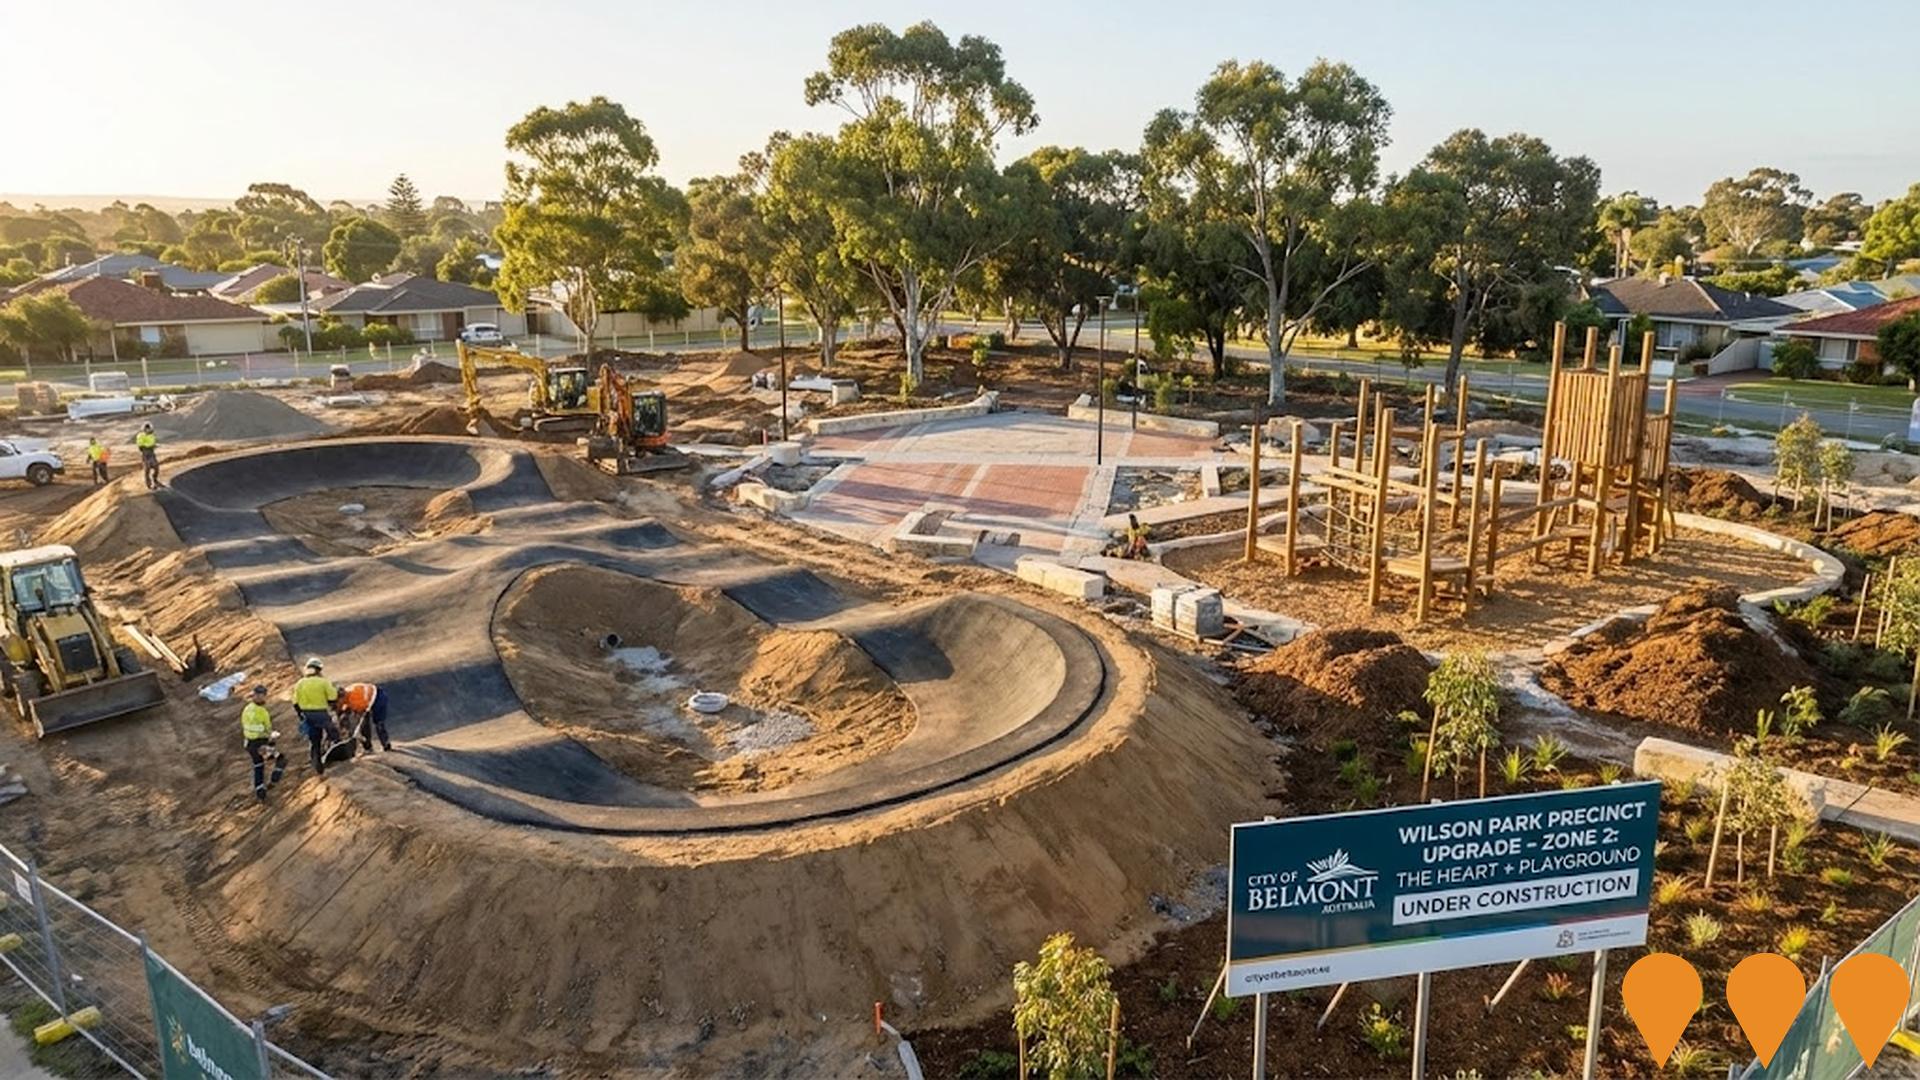
Wilson Park Precinct Upgrade - Zone 2 Heart + Playground
The multi-zone upgrade of Wilson Park is being delivered in stages. Zone 1 (Netball Courts and lighting) was completed in March 2023. Zone 2, 'The Heart + Playground', is currently under construction and includes a pump track, youth play area, nature playground, town square, and a social connection space. This stage is estimated at $8.3 million.
Employment
The employment environment in Rivervale shows above-average strength when compared nationally
Rivervale has a highly educated workforce with strong representation in manufacturing and industrial sectors. Its unemployment rate is 3.7%, below Greater Perth's rate of 3.9%.
Over the past year, employment grew by an estimated 3.2%. As of June 2025, 8,129 residents are employed, with an unemployment rate of 2.8% and workforce participation at 71.1%, higher than Greater Perth's 65.2%. Major industries include health care & social assistance, professional & technical services, and mining. Mining employment is particularly high, at 1.3 times the regional level.
Conversely, education & training has lower representation, at 6.1% compared to the regional average of 9.2%. Over the year to June 2025, employment increased by 3.2%, while labour force and unemployment remained stable. National employment forecasts from Jobs and Skills Australia (May 2025) project growth of 6.6% over five years and 13.7% over ten years. Applying these projections to Rivervale's industry mix suggests local growth of approximately 6.4% over five years and 13.4% over ten years.
Frequently Asked Questions - Employment
Income
Income analysis reveals strong economic positioning, with the area outperforming 60% of locations assessed nationally by AreaSearch
Rivervale had a median taxpayer income of $60,922 and an average of $71,989 in financial year 2022, according to postcode level ATO data aggregated by AreaSearch. This is higher than the national averages at the time, which were a median income of $58,380 and an average income of $78,020 in Greater Perth. By September 2025, estimated incomes would be approximately $69,573 (median) and $82,211 (average), based on Wage Price Index growth of 14.2% since financial year 2022. Individual earnings at the 80th percentile nationally were $1,015 weekly in Rivervale, but household income ranked lower at the 48th percentile. The data shows that 34.9% of the community (4,485 individuals) fell into the $1,500 - 2,999 earnings band, which is consistent with broader trends across regional levels showing 32.0% in the same category. Housing affordability pressures were severe, with only 82.0% of income remaining after housing costs, ranking at the 47th percentile. The area's SEIFA income ranking placed it in the 6th decile.
Frequently Asked Questions - Income
Housing
Rivervale displays a diverse mix of dwelling types, with a higher proportion of rental properties than the broader region
Rivervale's dwelling structure, as per the latest Census, consisted of 42.6% houses and 57.3% other dwellings (semi-detached, apartments, 'other' dwellings). This compares to Perth metro's figures of 60.5% houses and 39.6% other dwellings. Home ownership in Rivervale stood at 16.3%, with mortgaged dwellings at 29.5% and rented ones at 54.2%. The median monthly mortgage repayment was $1,760, below Perth metro's average of $1,842. The median weekly rent in Rivervale was $350, matching the Perth metro figure. Nationally, Rivervale's mortgage repayments were lower than the Australian average of $1,863, and rents were less than the national figure of $375.
Frequently Asked Questions - Housing
Household Composition
Rivervale features high concentrations of lone person households and group households, with a lower-than-average median household size
Family households constitute 54.3% of all households, including 18.1% couples with children, 26.4% couples without children, and 7.5% single parent families. Non-family households comprise the remaining 45.7%, with lone person households at 38.4% and group households comprising 7.4%. The median household size is 2.1 people, which is smaller than the Greater Perth average of 2.3.
Frequently Asked Questions - Households
Local Schools & Education
Rivervale shows strong educational performance, ranking in the upper quartile nationally when assessed across multiple qualification and achievement indicators
The area's university qualification rate is 36.7%, higher than the WA average of 27.9% and the SA4 region's 29.9%. Bachelor degrees are most common at 25.4%, followed by postgraduate qualifications (8.4%) and graduate diplomas (2.9%). Vocational credentials are held by 33.0% of residents aged 15+, with advanced diplomas at 12.7% and certificates at 20.3%.
Current educational participation is high at 27.0%, including 8.3% in tertiary, 6.8% in primary, and 4.2% in secondary education. Rivervale Primary School and St Augustine's Primary School serve a total of 508 students. The area has above-average socio-educational conditions (ICSEA: 1060). Both schools focus on primary education; secondary options are available nearby. Local school capacity is limited at 4.0 places per 100 residents, compared to the regional average of 12.0.
Frequently Asked Questions - Education
Schools Detail
Nearby Services & Amenities
Transport
Transport servicing is good compared to other areas nationally based on assessment of service frequency, route connectivity and accessibility
Rivervale has 33 active public transport stops, all of which are bus stops. These stops are served by 7 different routes, together offering 2,178 weekly passenger trips. The transport accessibility is rated excellent, with residents usually located 195 meters from the nearest stop.
On average, there are 311 trips per day across all routes, translating to about 66 weekly trips per individual stop.
Frequently Asked Questions - Transport
Transport Stops Detail
Health
Rivervale's residents are extremely healthy with prevalence of common health conditions low among the general population though higher than the nation's average across older, at risk cohorts
Analysis of health metrics indicates strong performance throughout Rivervale.
Prevalence of common health conditions is low among the general population but higher than the national average among older, at-risk cohorts. The rate of private health cover is very high at approximately 55% of the total population (~7,107 people). Mental health issues and asthma are the most common medical conditions in the area, impacting 8.1 and 6.4% of residents respectively. A total of 74.8% of residents declare themselves completely clear of medical ailments compared to 73.7% across Greater Perth. The area has 13.5% of residents aged 65 and over (1,740 people).
Frequently Asked Questions - Health
Cultural Diversity
Rivervale is among the most culturally diverse areas in the country based on AreaSearch assessment of a range of language and cultural background related metrics
Rivervale's cultural diversity is notable, with 33.5% speaking a language other than English at home and 43.8% born overseas. Christianity is the predominant religion in Rivervale, comprising 39.0%. Buddhism's representation in Rivervale is higher at 4.9%, compared to Greater Perth's 4.1%.
The top three ancestral groups are English (22.7%), Australian (18.4%), and Other (17.7%). Korean (1.0%) and Chinese (7.2%) populations are notably higher in Rivervale than regionally (Korean: 0.7%, Chinese: 6.1%). Spanish representation is also slightly higher at 0.6% compared to the regional average of 0.4%.
Frequently Asked Questions - Diversity
Age
Rivervale hosts a young demographic, positioning it in the bottom quartile nationwide
Rivervale's median age is 34 years, which is lower than Greater Perth's average of 37 and Australia's national average of 38 years. Compared to Greater Perth, Rivervale has a higher proportion of residents aged 25-34 at 24.2%, but fewer residents aged 5-14 at 8.0%. This concentration of 25-34 year-olds is significantly higher than the national average of 14.5%. Between the 2021 Census and the present, the proportion of Rivervale's population aged 65 to 74 has increased from 7.0% to 8.1%, while the proportion of residents aged 25 to 34 has decreased from 25.8% to 24.2%. By 2041, demographic forecasts indicate substantial changes in Rivervale's population structure. The 45-54 age group is projected to grow by 47%, adding 684 residents to reach a total of 2,130. In contrast, the 5-14 age group shows minimal growth of just 4%, with an increase of only 37 people.
