Chart Color Schemes
This analysis uses ABS Statistical Areas Level 2 (SA2) boundaries, which can materially differ from Suburbs and Localities (SAL) even when sharing similar names.
SA2 boundaries are defined by the Australian Bureau of Statistics and are designed to represent communities for statistical reporting (e.g., census and ERP).
Suburbs and Localities (SAL) represent commonly-used suburb/locality names (postal-style areas) and may use different geographic boundaries. For comprehensive analysis, consider reviewing both boundary types if available.
est. as @ -- *
ABS ERP | -- people | --
2021 Census | -- people
Sales Activity
Curious about local property values? Filter the chart to assess the volume and appreciation (including resales) trends and regional comparisons, or scroll to the map below view this information at an individual property level.
Find a Recent Sale
Sales Detail
Population
Population growth drivers in Cloverdale are strong compared to national averages based on AreaSearch's ranking of recent, and medium to long-term trends
Cloverdale's population, as of November 2025, is approximately 9,979, indicating a rise of 1,115 individuals since the 2021 Census. This increase represents a 12.6% growth from the previous figure of 8,864 people. The change is inferred from ABS's estimated resident population of 9,931 in June 2024 and an additional 96 validated new addresses since the Census date. This results in a population density ratio of 2,513 persons per square kilometer, placing Cloverdale in the upper quartile compared to other locations assessed by AreaSearch. The area's growth rate exceeded the national average of 8.9%, demonstrating its status as a growth leader in the region. Overseas migration contributed approximately 72.2% of overall population gains during recent periods.
AreaSearch employs ABS/Geoscience Australia projections for each SA2 area, released in 2024 with a base year of 2022. For areas not covered by this data and to estimate growth post-2032, AreaSearch uses the growth rates by age cohort provided by the ABS in its latest Greater Capital Region projections (released in 2023, based on 2022 data). Future population trends suggest an above median growth for national areas, with Cloverdale projected to increase by 2,172 persons to 2041, reflecting a total increase of 21.3% over the 17-year period.
Frequently Asked Questions - Population
Development
AreaSearch assessment of residential development activity positions Cloverdale among the top 25% of areas assessed nationwide
Cloverdale has received approximately 57 dwelling approvals annually over the past five financial years, totalling 288 homes. In FY-26 to date, 30 approvals have been recorded. On average, each home built between FY-21 and FY-25 accommodates around 3.9 new residents per year. This has led to a significant demand exceeding supply, typically resulting in price growth and increased buyer competition.
The average construction cost of new homes is approximately $243,000, aligning with broader regional development trends. In the current financial year, Cloverdale has registered around $1.9 million in commercial approvals, indicating minimal commercial development activity compared to residential. When contrasted with Greater Perth, Cloverdale maintains similar development levels per capita, preserving market balance consistent with the broader area.
Recent construction comprises 64% detached dwellings and 36% townhouses or apartments, offering diverse housing options across various price points. With around 180 people per approval, Cloverdale reflects a developing area. By 2041, Cloverdale is projected to gain approximately 2,124 residents, based on the latest AreaSearch quarterly estimate. Development progress appears to keep pace with projected growth, although increasing population expansion may intensify buyer competition.
Frequently Asked Questions - Development
Infrastructure
Cloverdale has emerging levels of nearby infrastructure activity, ranking in the 36thth percentile nationally
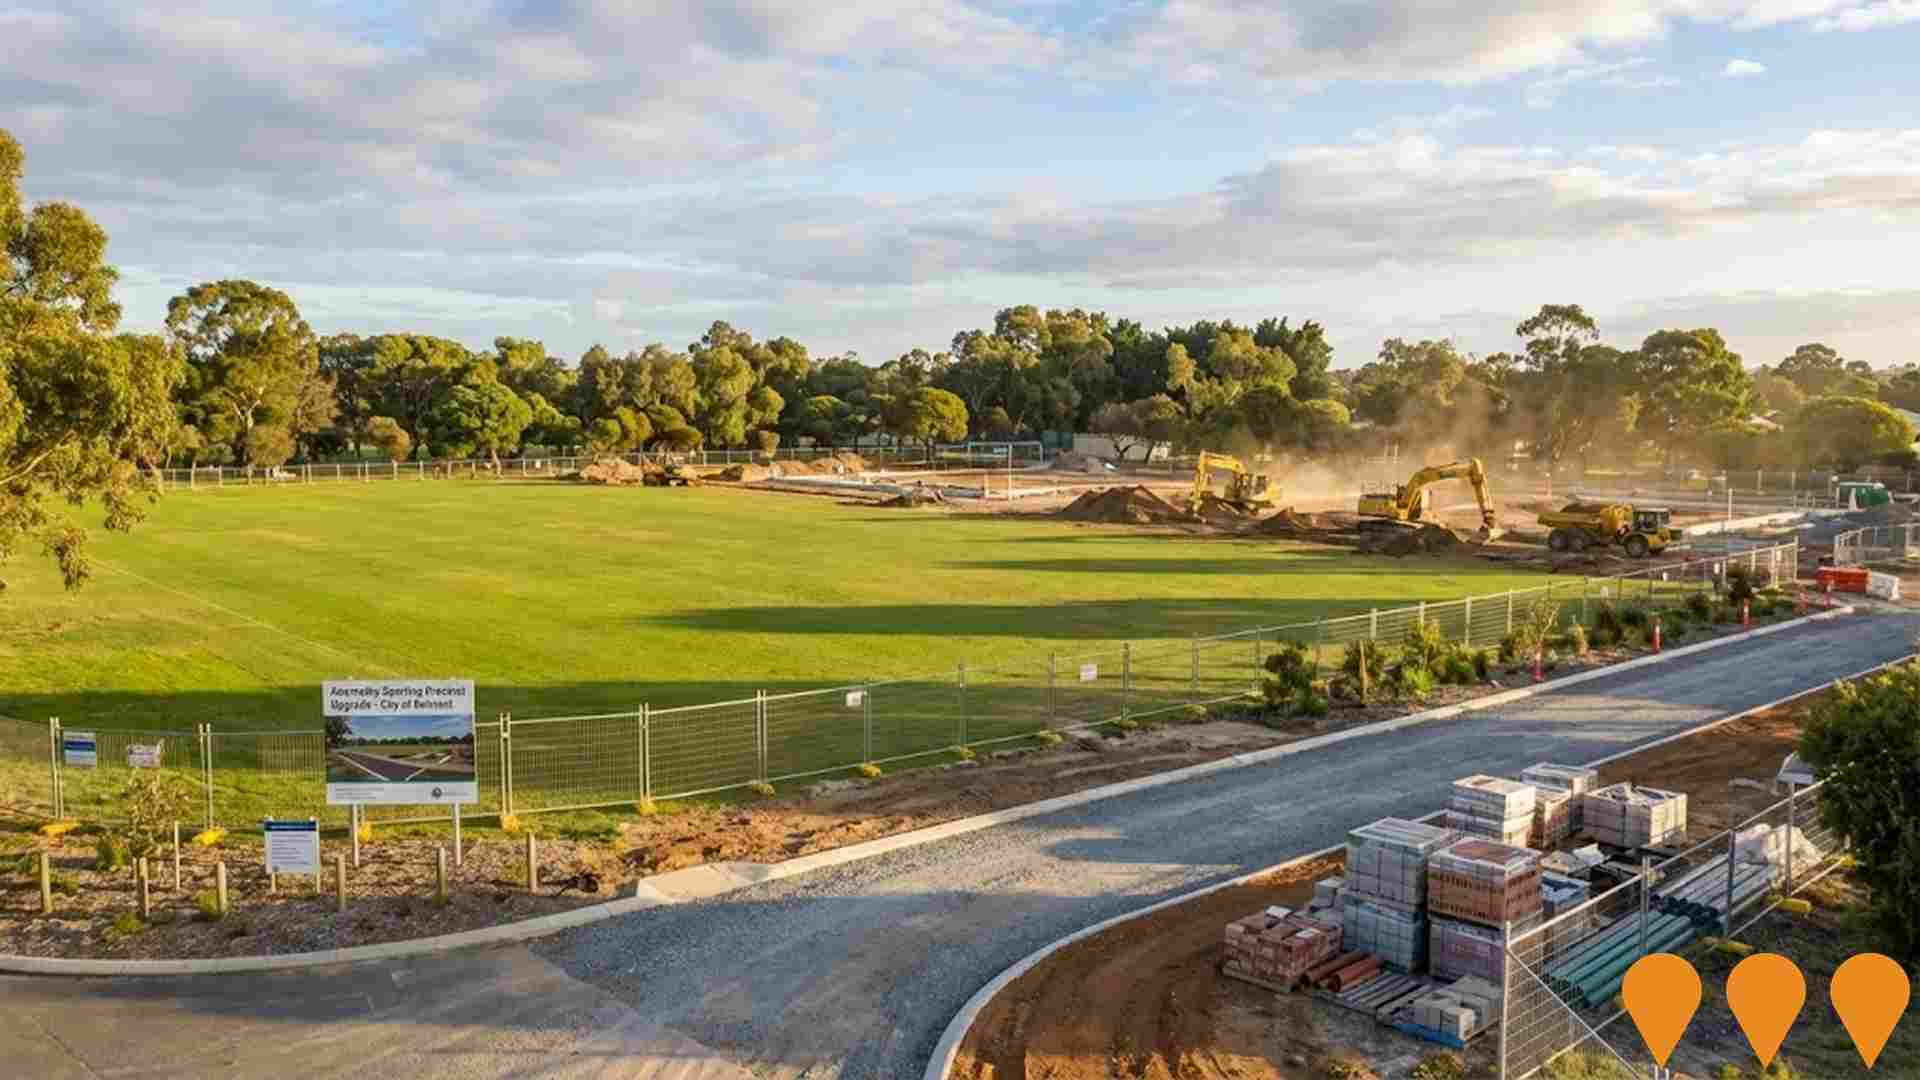
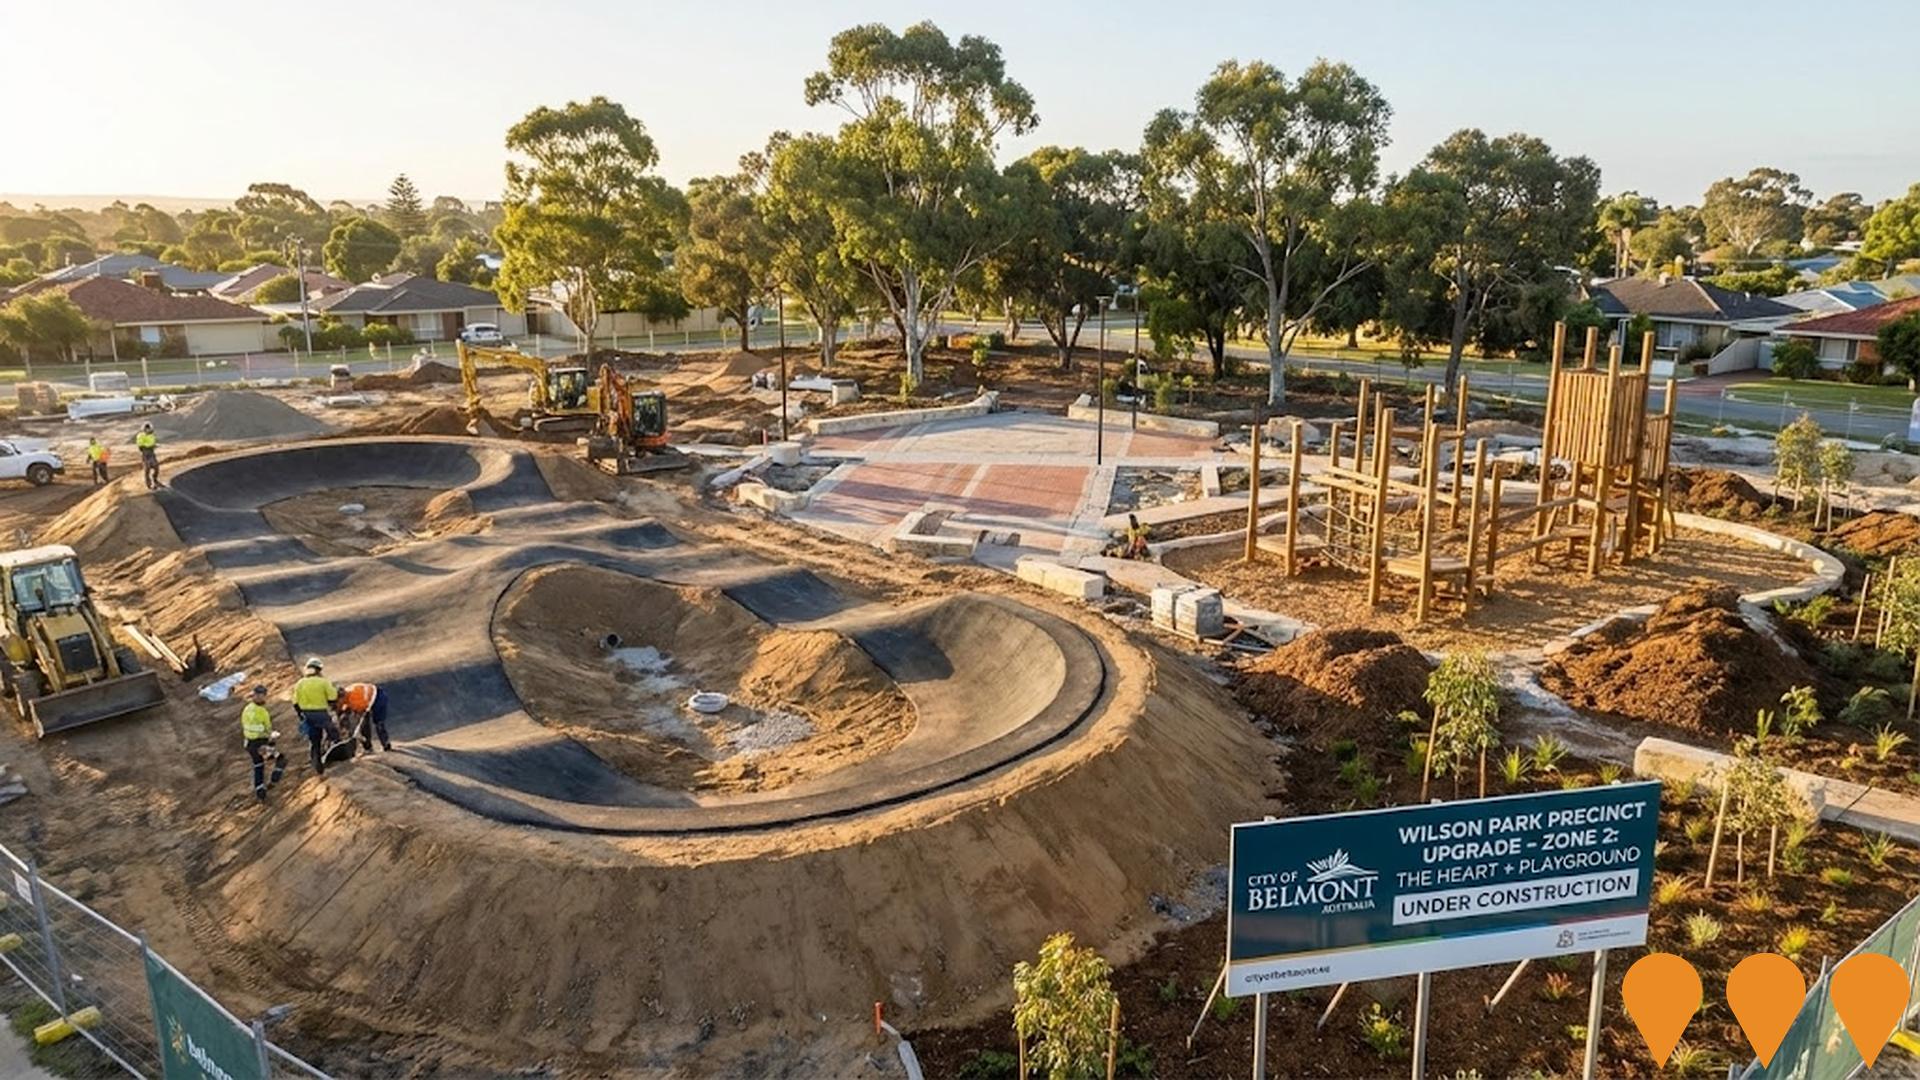
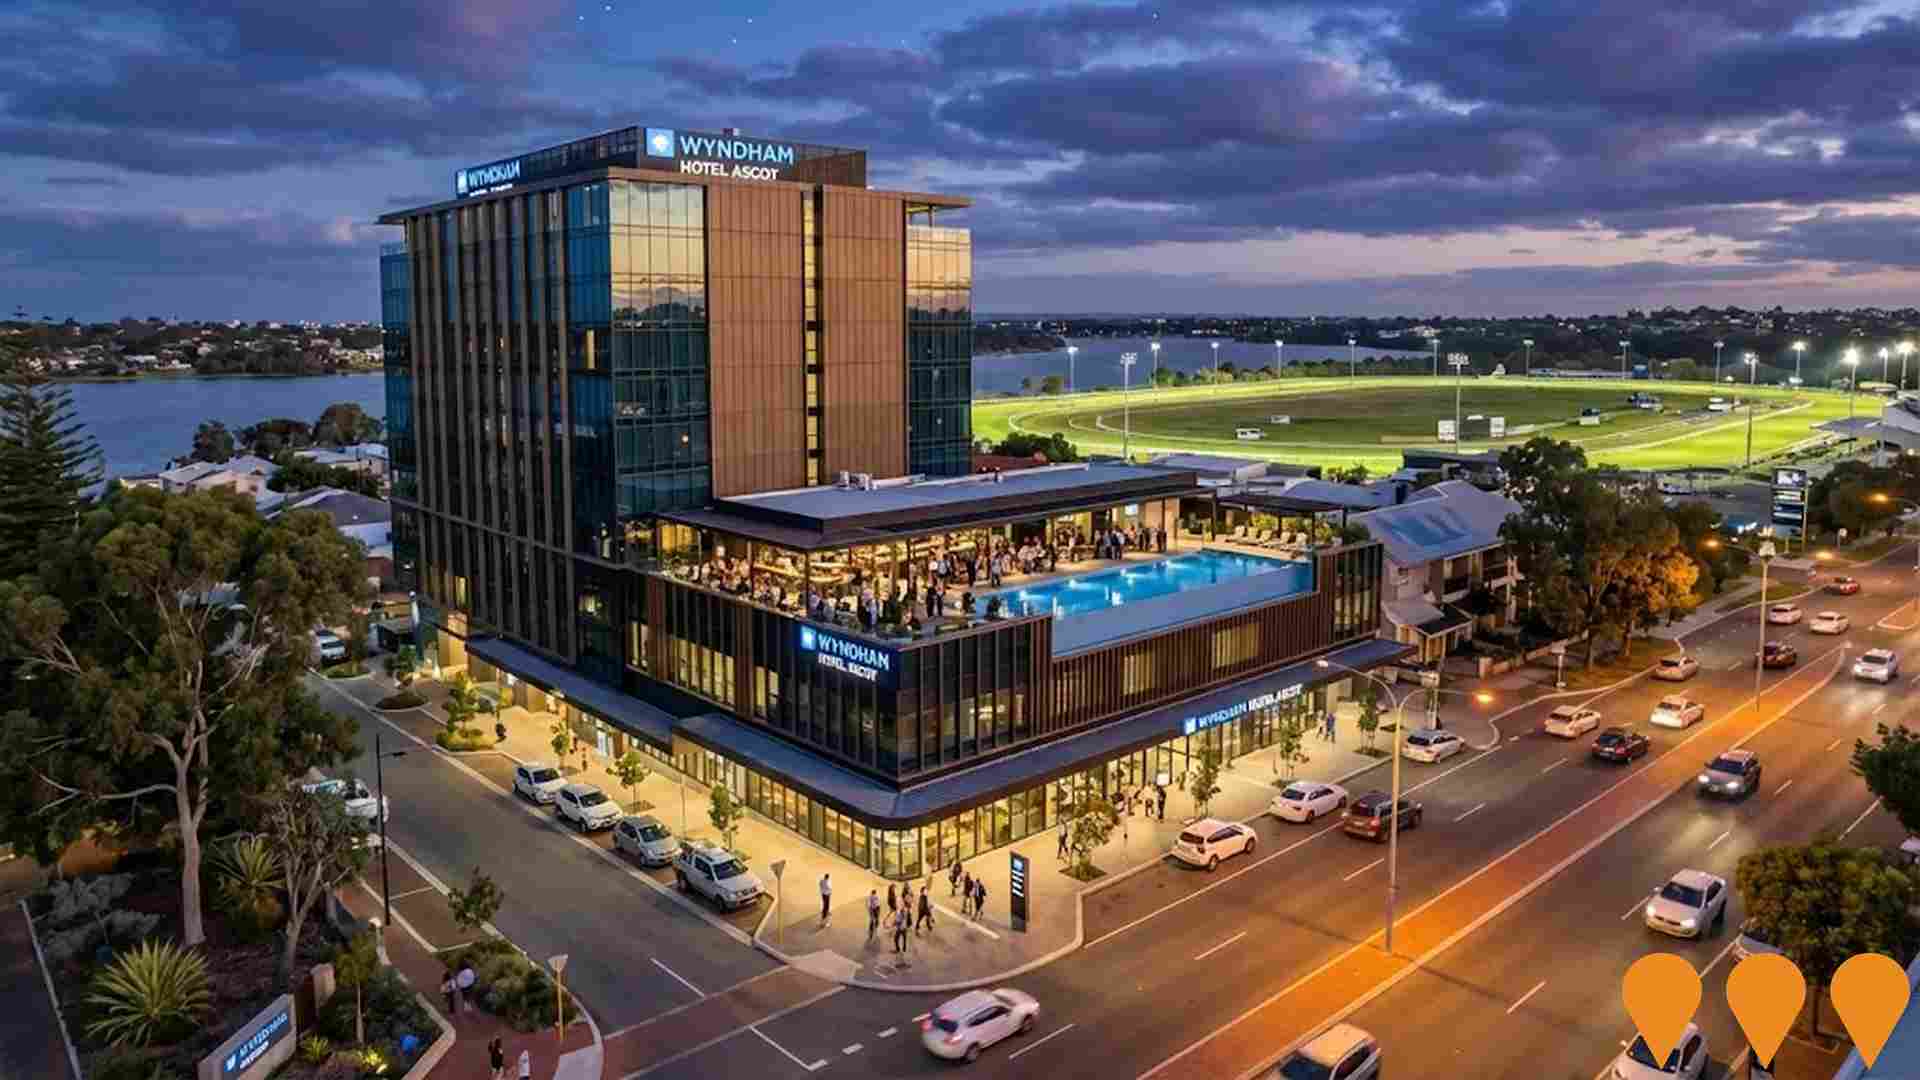
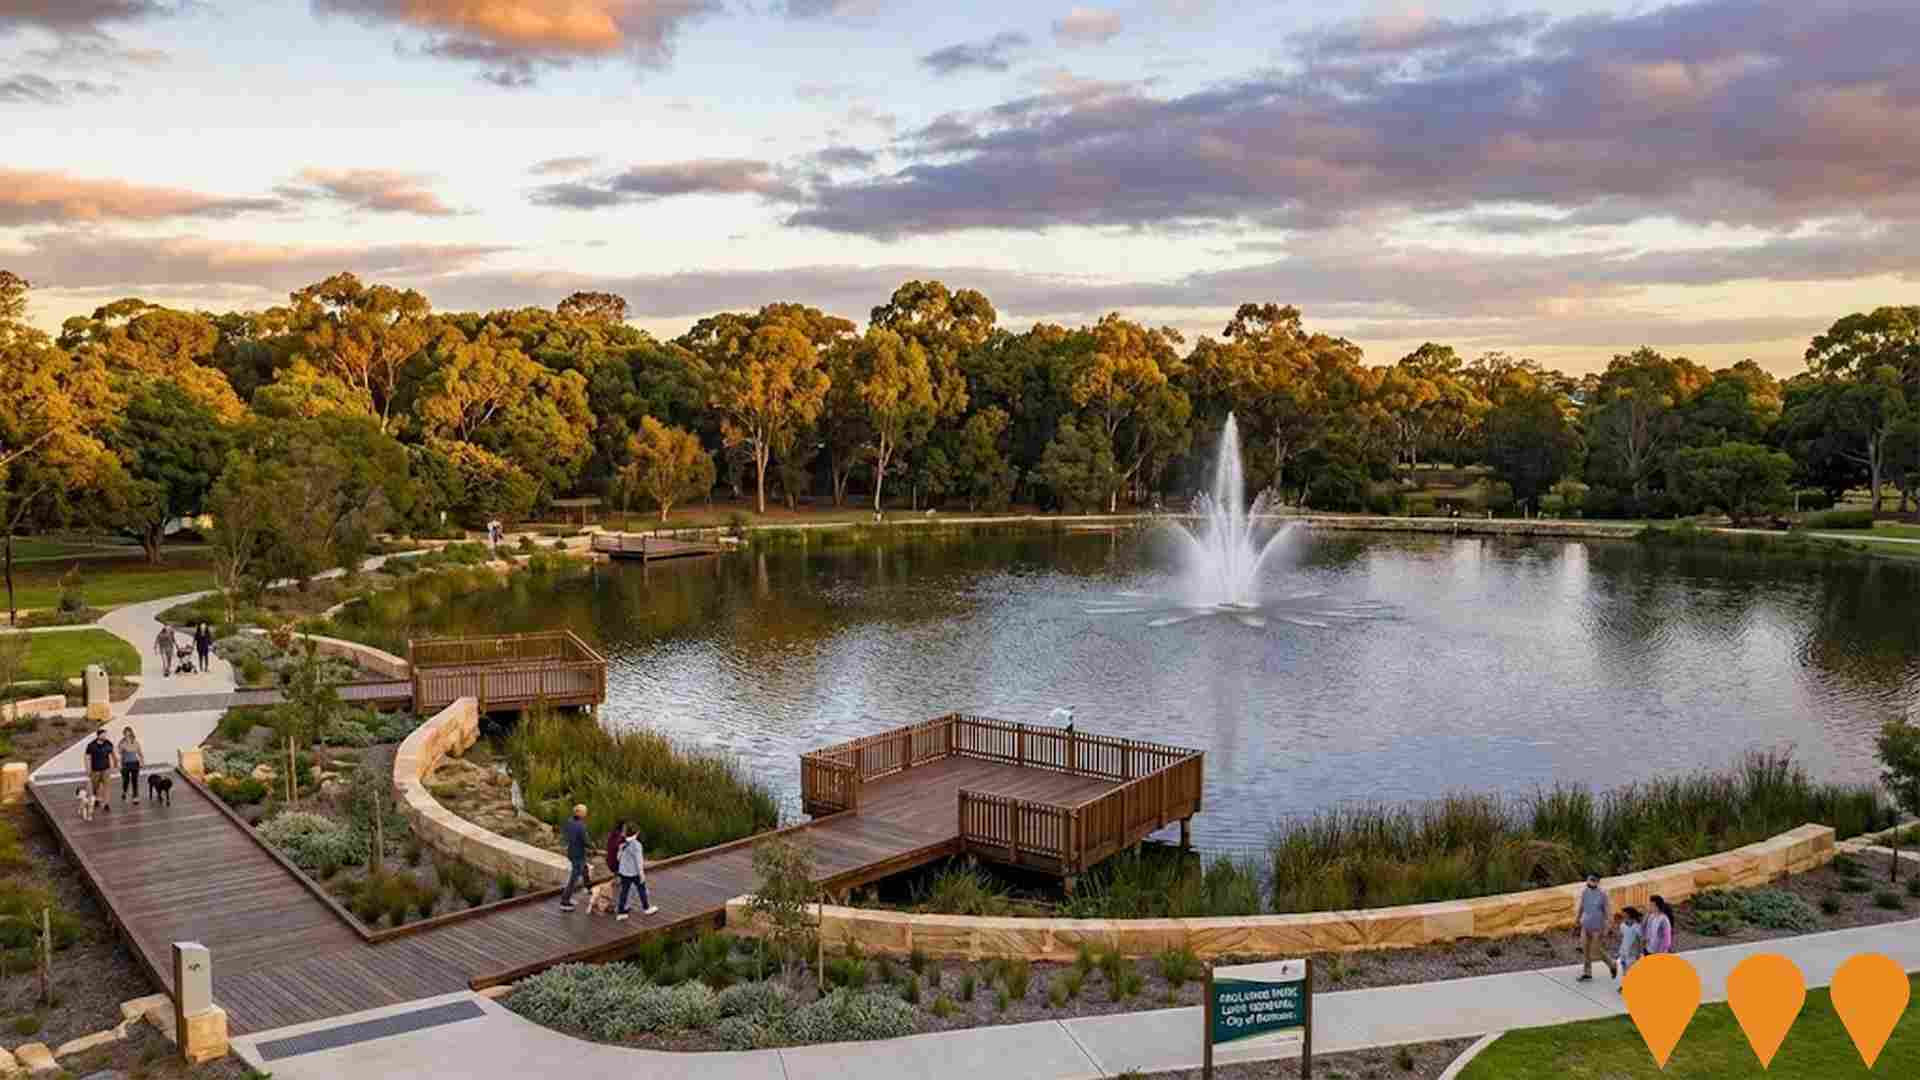
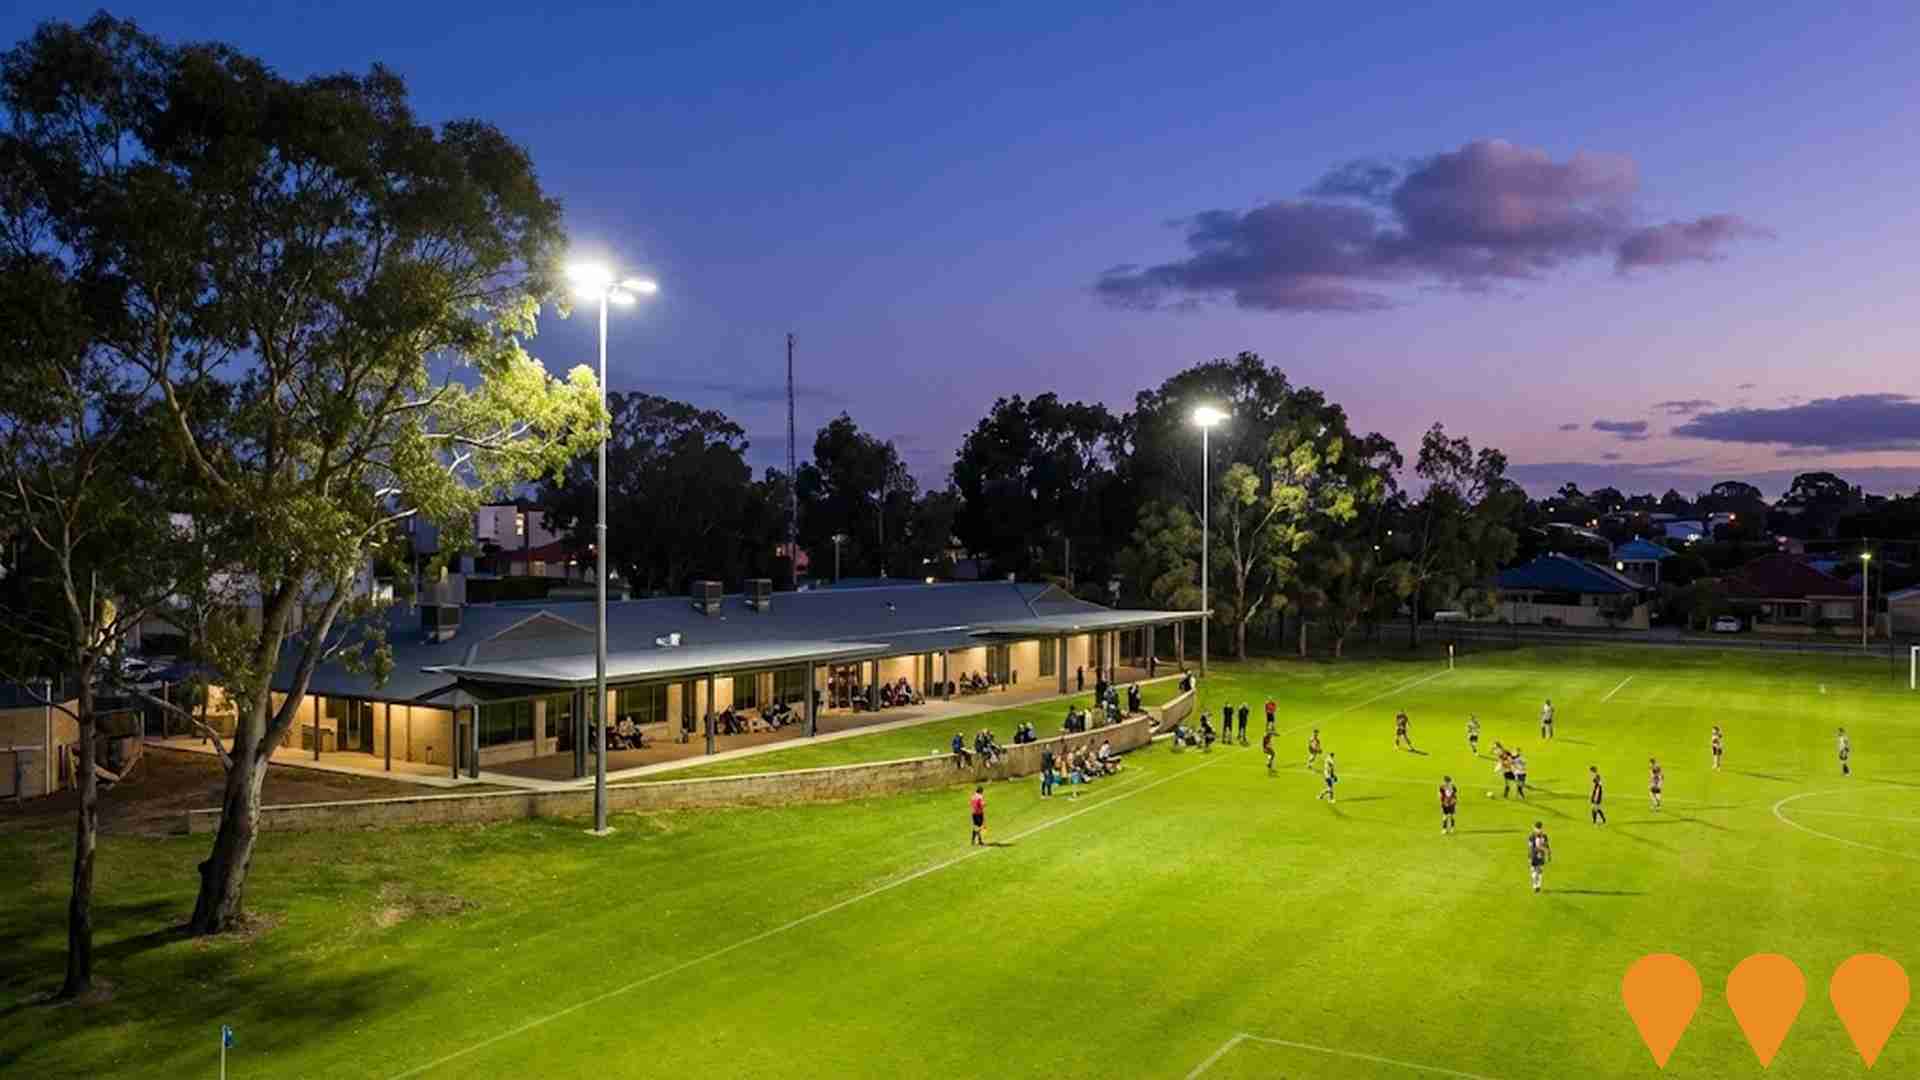
Changes to local infrastructure significantly influence an area's performance. AreaSearch identified 16 projects likely impacting the area. Notable ones are Forrestfield/High Wycombe Industrial Area, Abernethy Sporting Precinct Upgrade, Redcliffe Station Precinct Development, and Centenary Park Sports Lighting Upgrade. The following list details those most relevant.
Professional plan users can use the search below to filter and access additional projects.
INFRASTRUCTURE SEARCH
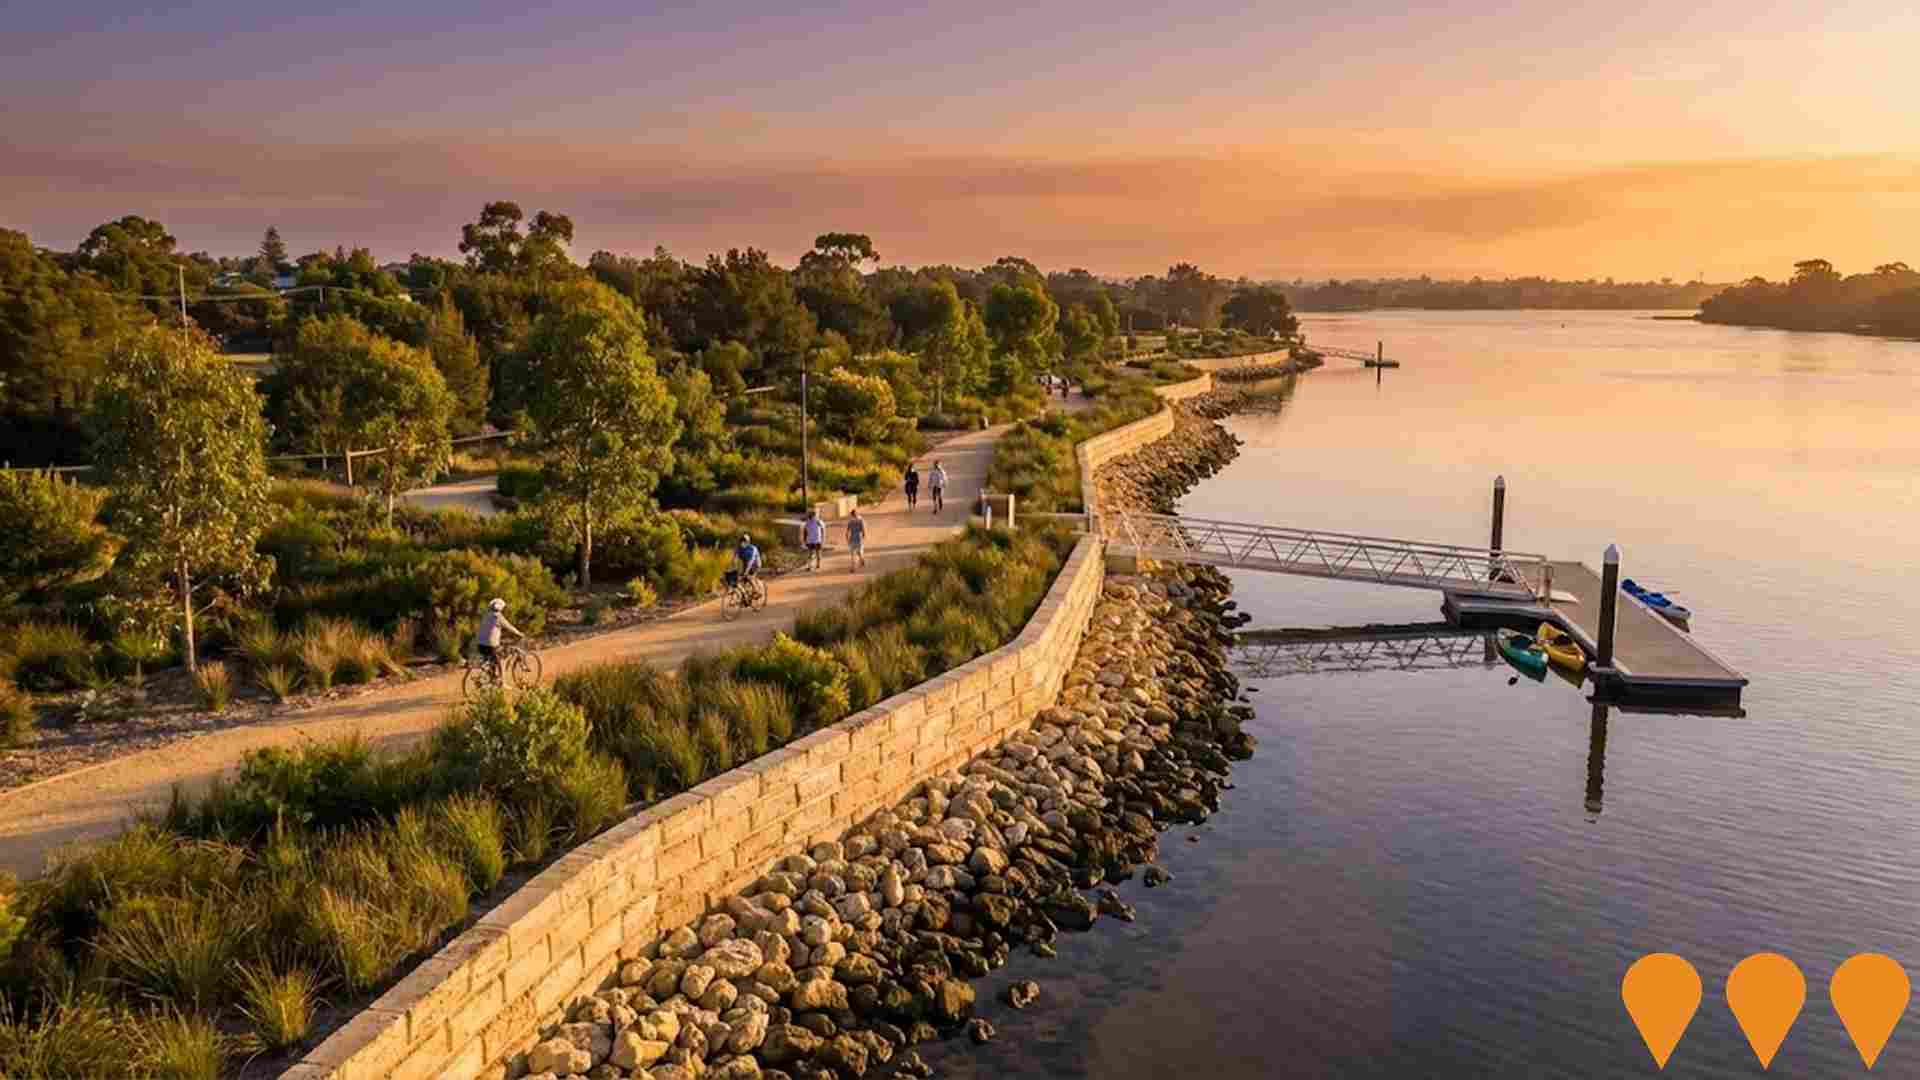
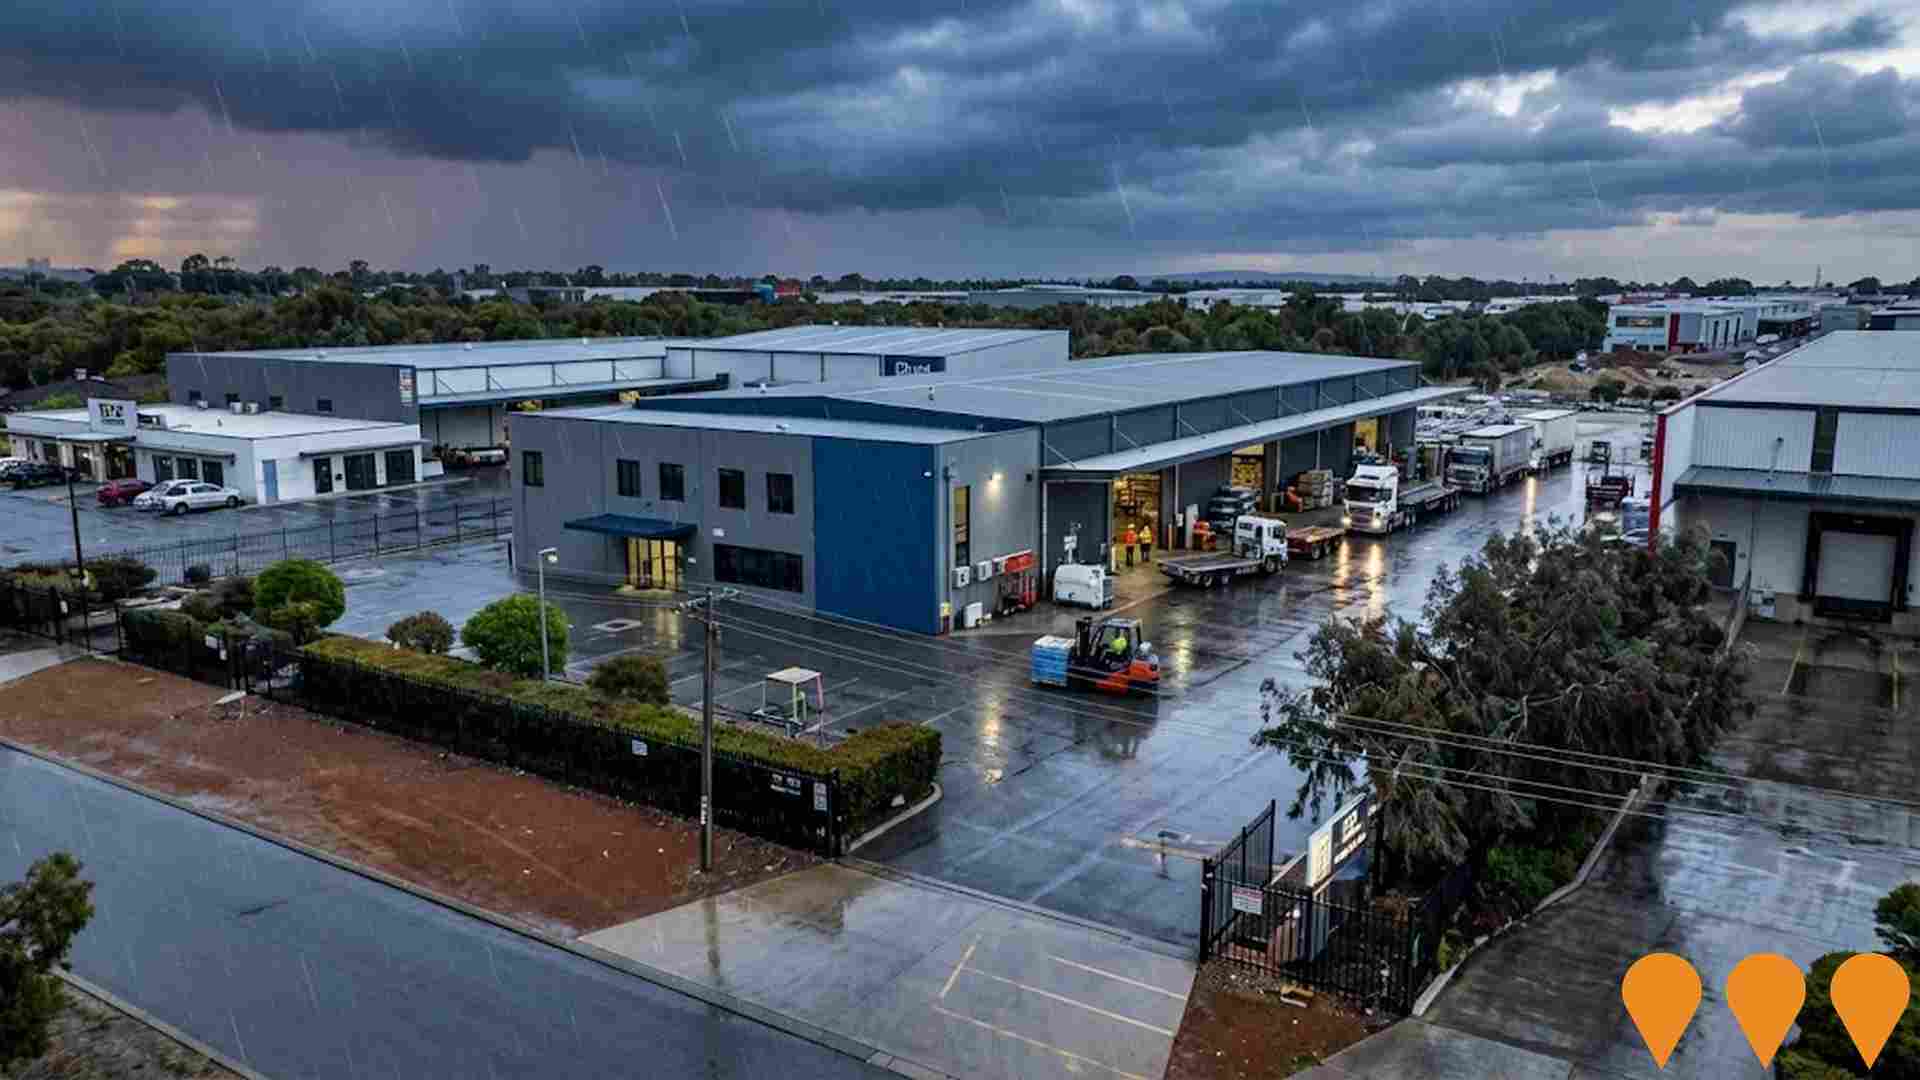
 Denotes AI-based impression for illustrative purposes only, not to be taken as definitive under any circumstances. Please follow links and conduct other investigations from the project's source for actual imagery. Developers and project owners wishing us to use original imagery please Contact Us and we will do so.
Frequently Asked Questions - Infrastructure
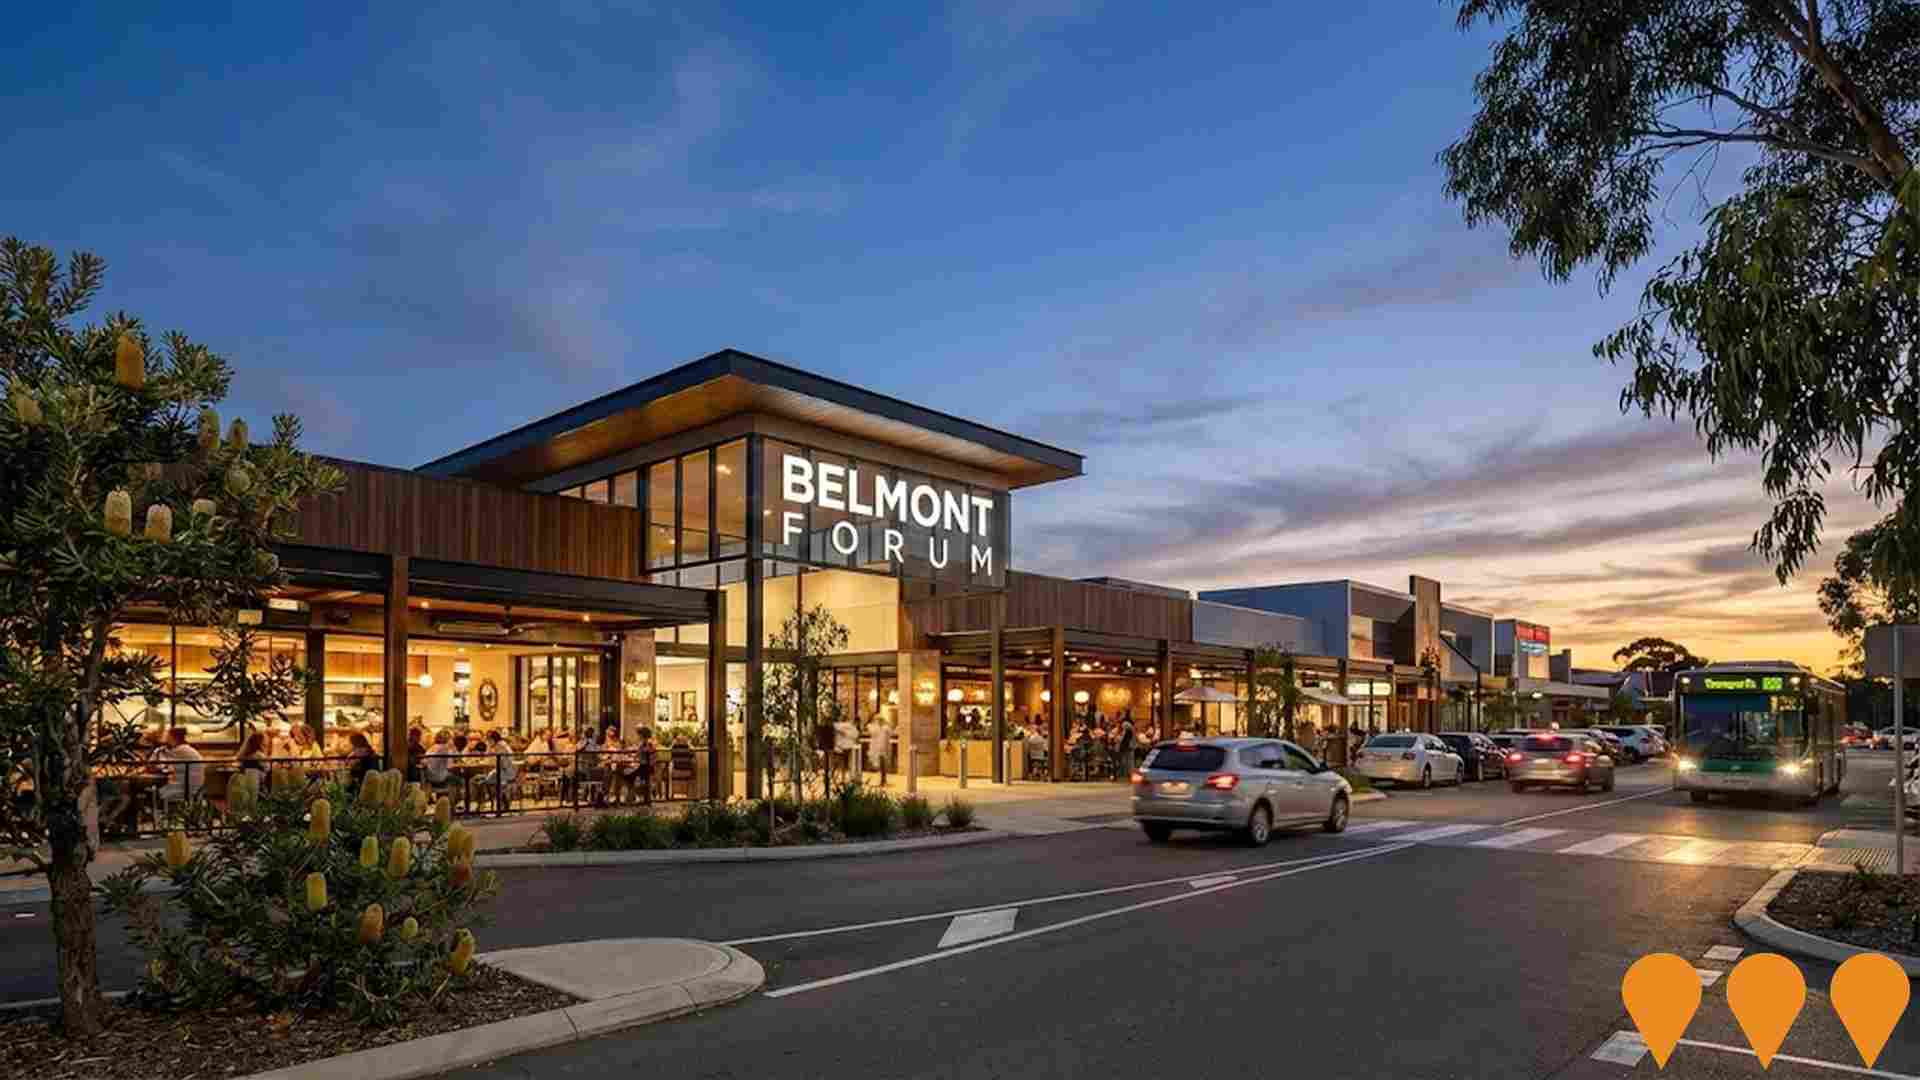
Belmont Forum Redevelopment Stage 2
Stage 2 of the Belmont Forum redevelopment delivered a major upgrade to the existing sub regional shopping centre at 227 Belmont Avenue, including a new dining precinct fronting Belmont Avenue, expanded fresh food and retail tenancies, upgraded mall interiors and entries, and reconfigured car parking to improve access and customer amenity. The approximately 65 million dollar program of works, completed around 2018, has since been supported by further refurbishments and amenity upgrades that reinforce Belmont Forum as a key retail hub for Perths eastern metropolitan area.
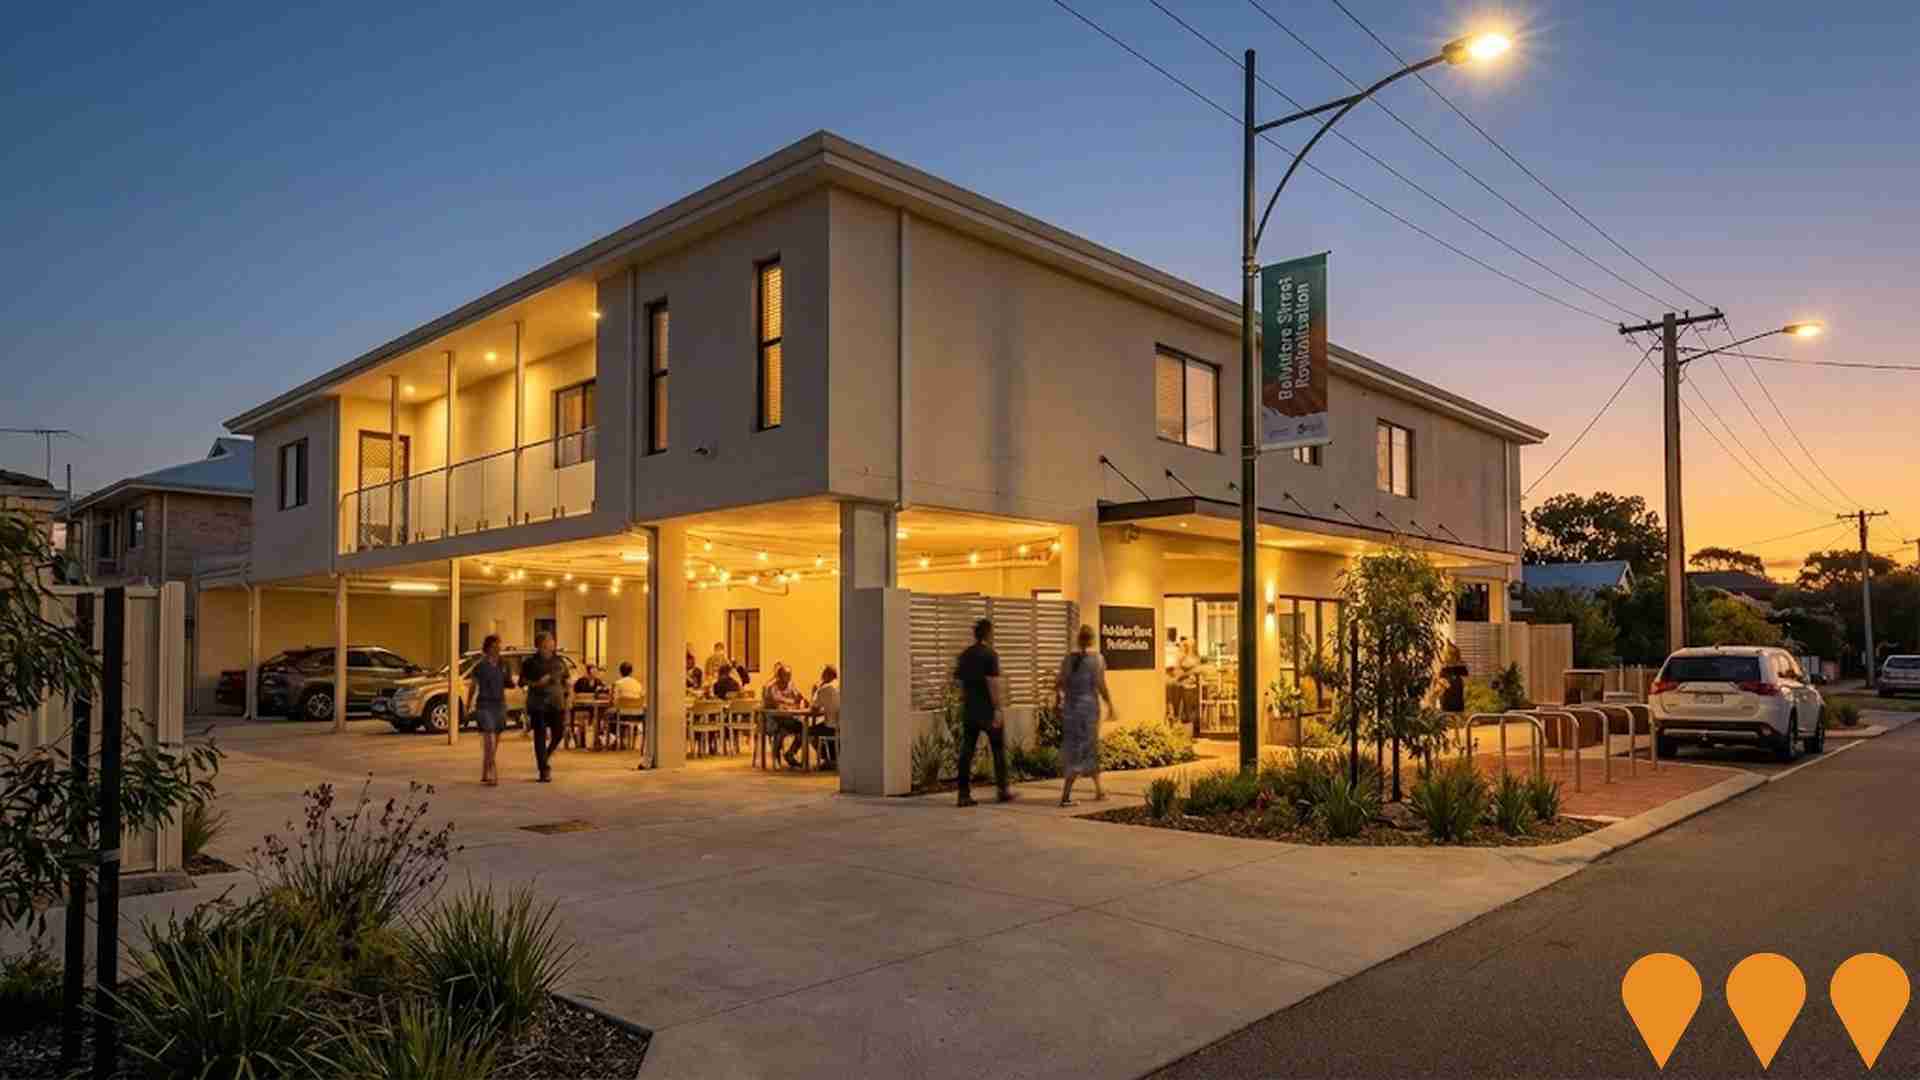
Belvidere Street Revitalisation Project
Streetscape revitalisation project transforming the Belvidere Street Shopping Precinct and Activity Centre to enhance the public realm. The project features alfresco dining areas, green spaces, enhanced lighting, improved pedestrian and cyclist amenities, underground power, and potential small park or community focal point. Project consultants Hatch RobertsDay developed the design with Scenario 3 selected through community consultation. Talis Consulting awarded detailed design and documentation contract in February 2024. Detailed design reached 50% completion milestone in February 2025. Construction tender to be advertised late 2025 with works commencing mid-2026. Project aims to create a vibrant main street that attracts private investment.
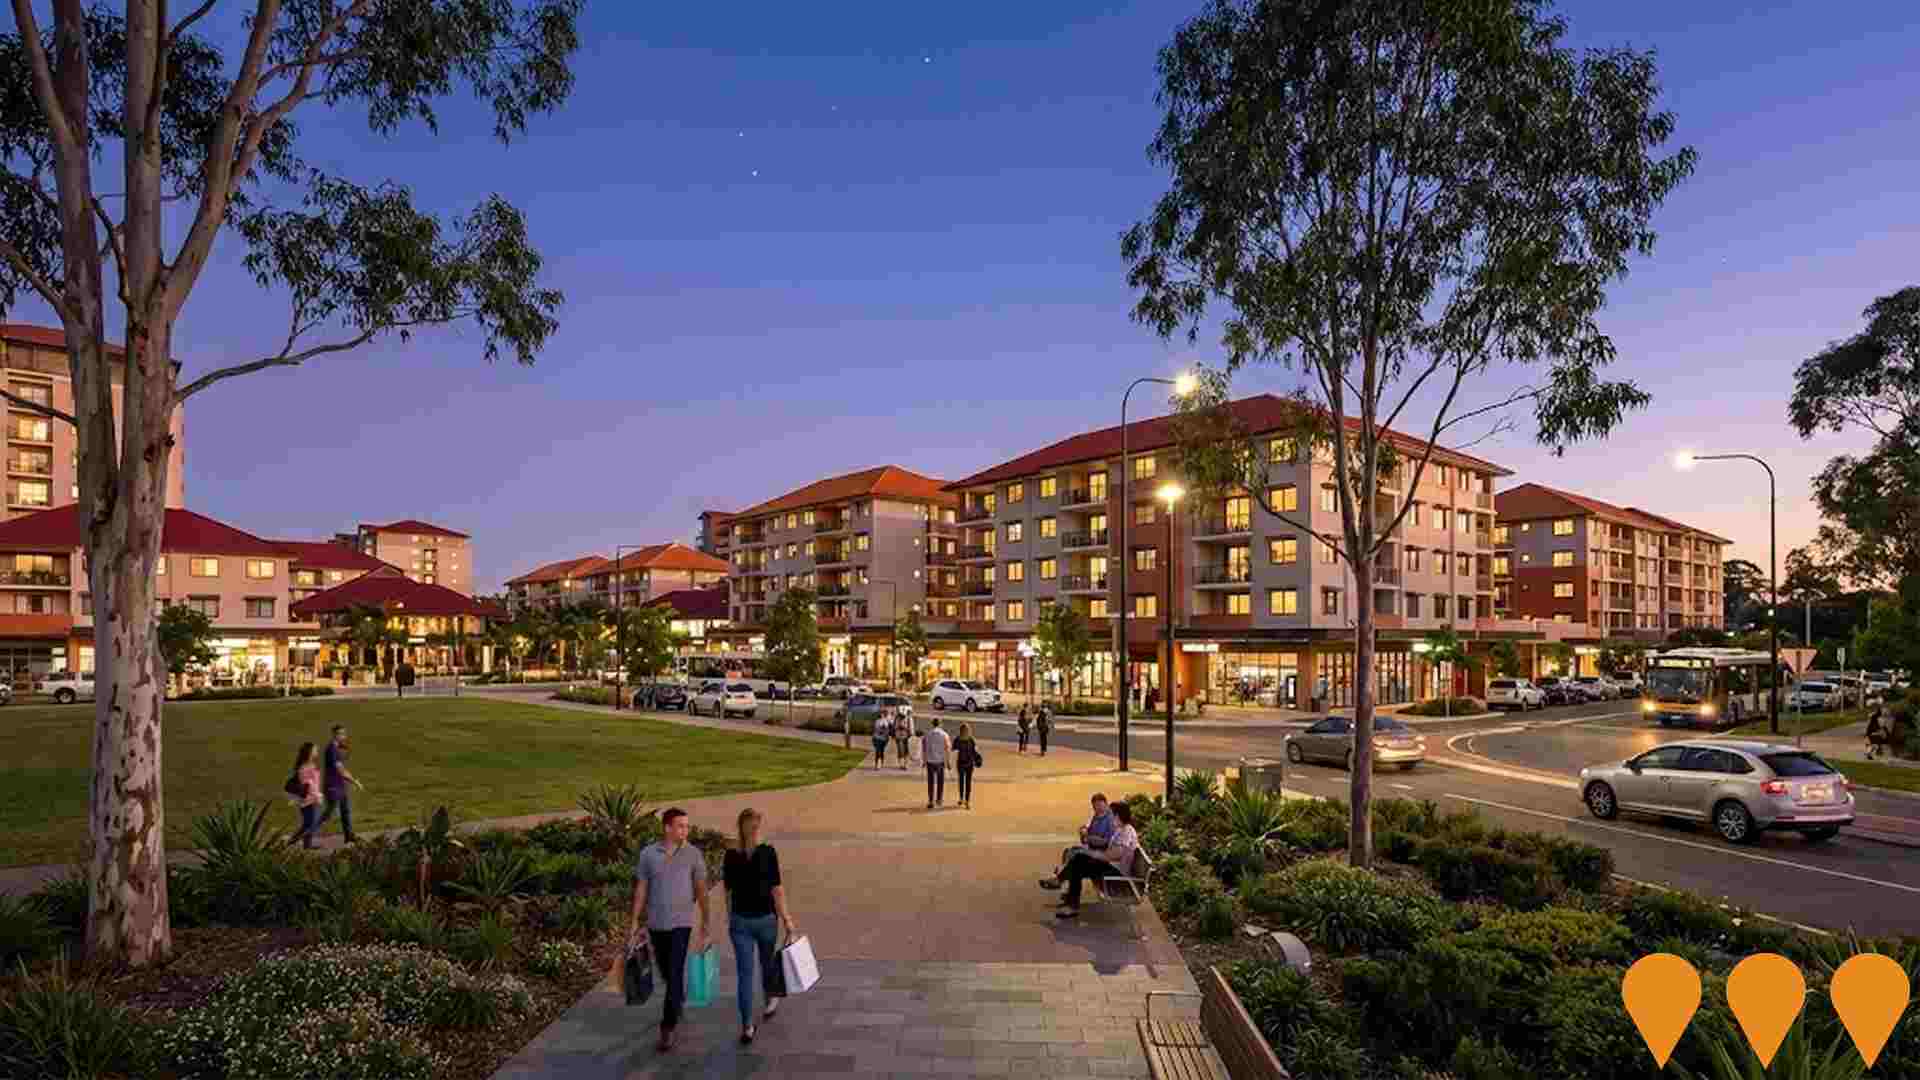
Redcliffe Station Precinct Development
Transit Oriented Development around Redcliffe Station creating an urban village with multi-storey apartments, businesses, public spaces, shops, housing, cafes and community services. Collaborative planning between City of Belmont and METRONET.
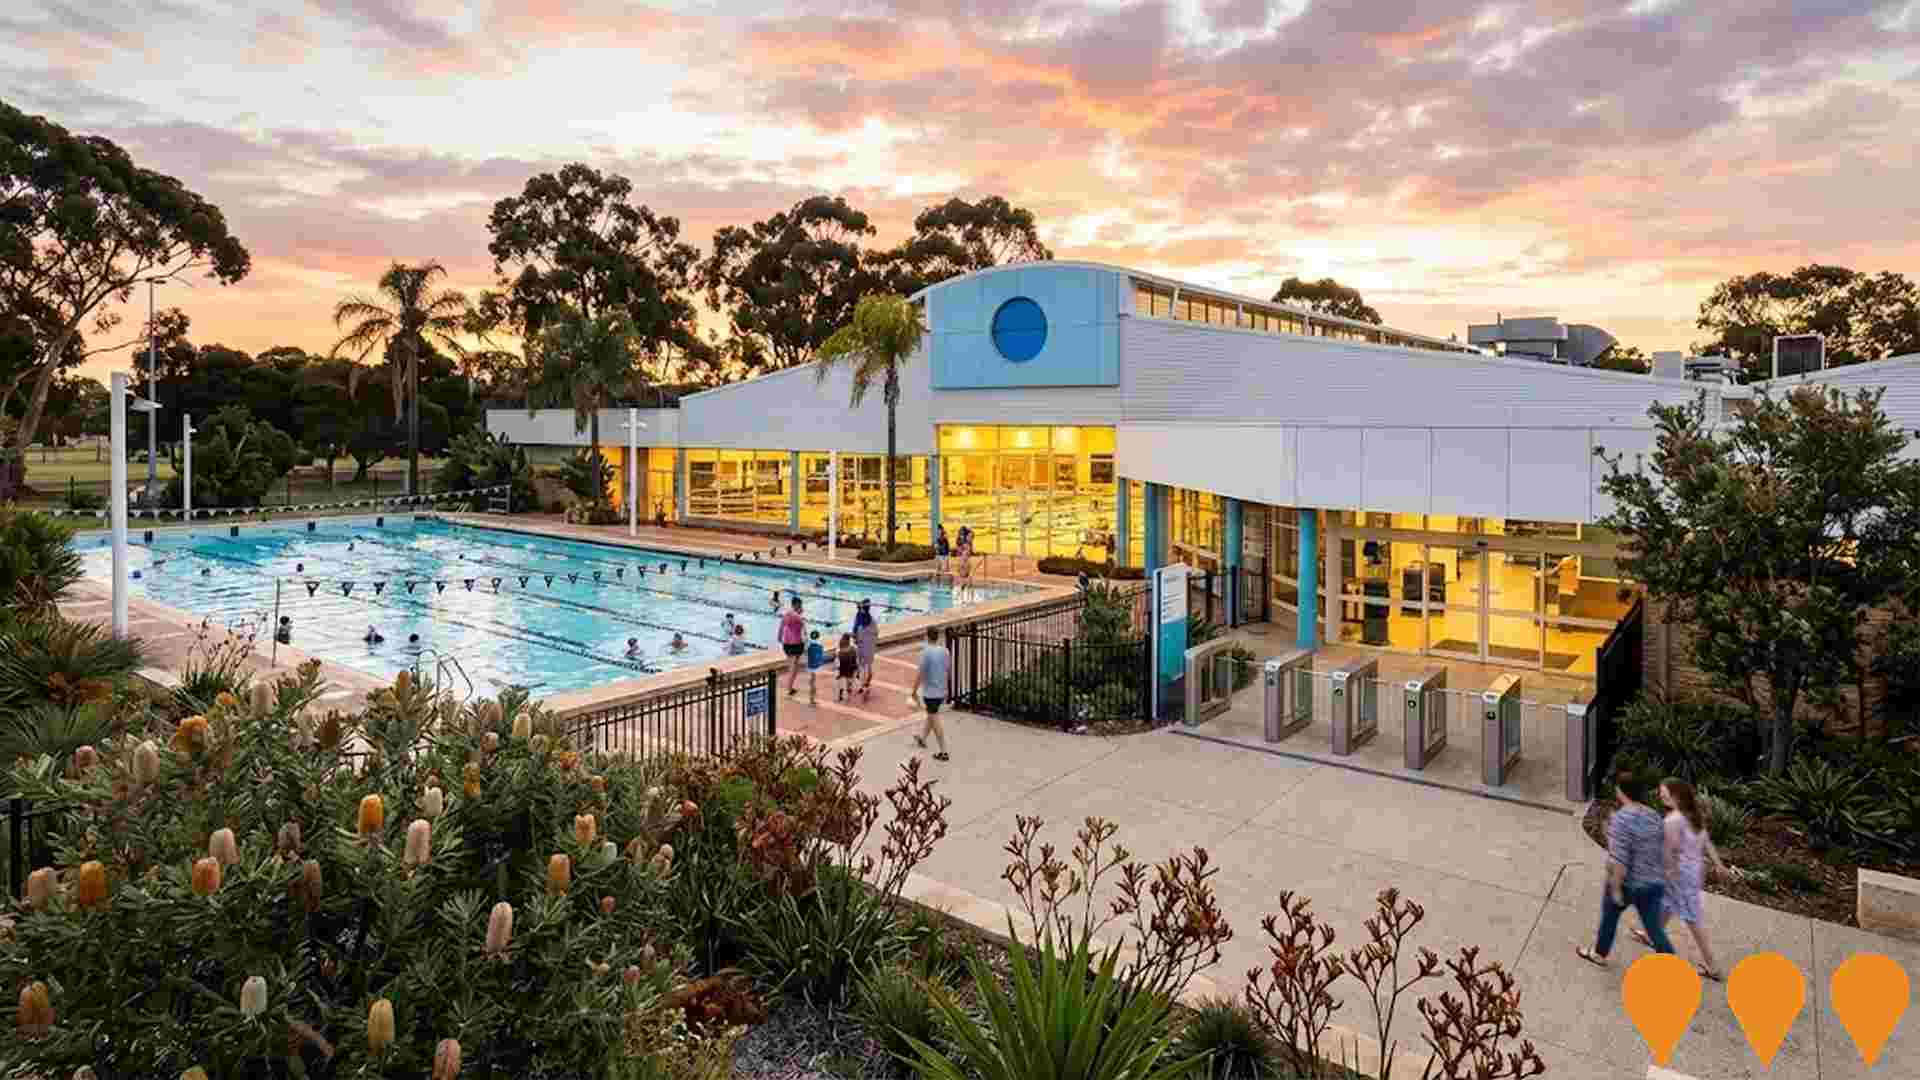
Belmont Oasis Leisure Centre Redevelopment and Upgrades
Ongoing upgrade and refurbishment works at the Belmont Oasis Leisure Centre. The project has included a $1.7 million investment by the City of Belmont for upgrades such as the refurbishment of the health club, group fitness rooms, change rooms, reception, and the installation of a new pool filter and access gates. Earlier feasibility studies also explored the replacement of the outdoor 25m pool with a new contemporary multi-use pool.
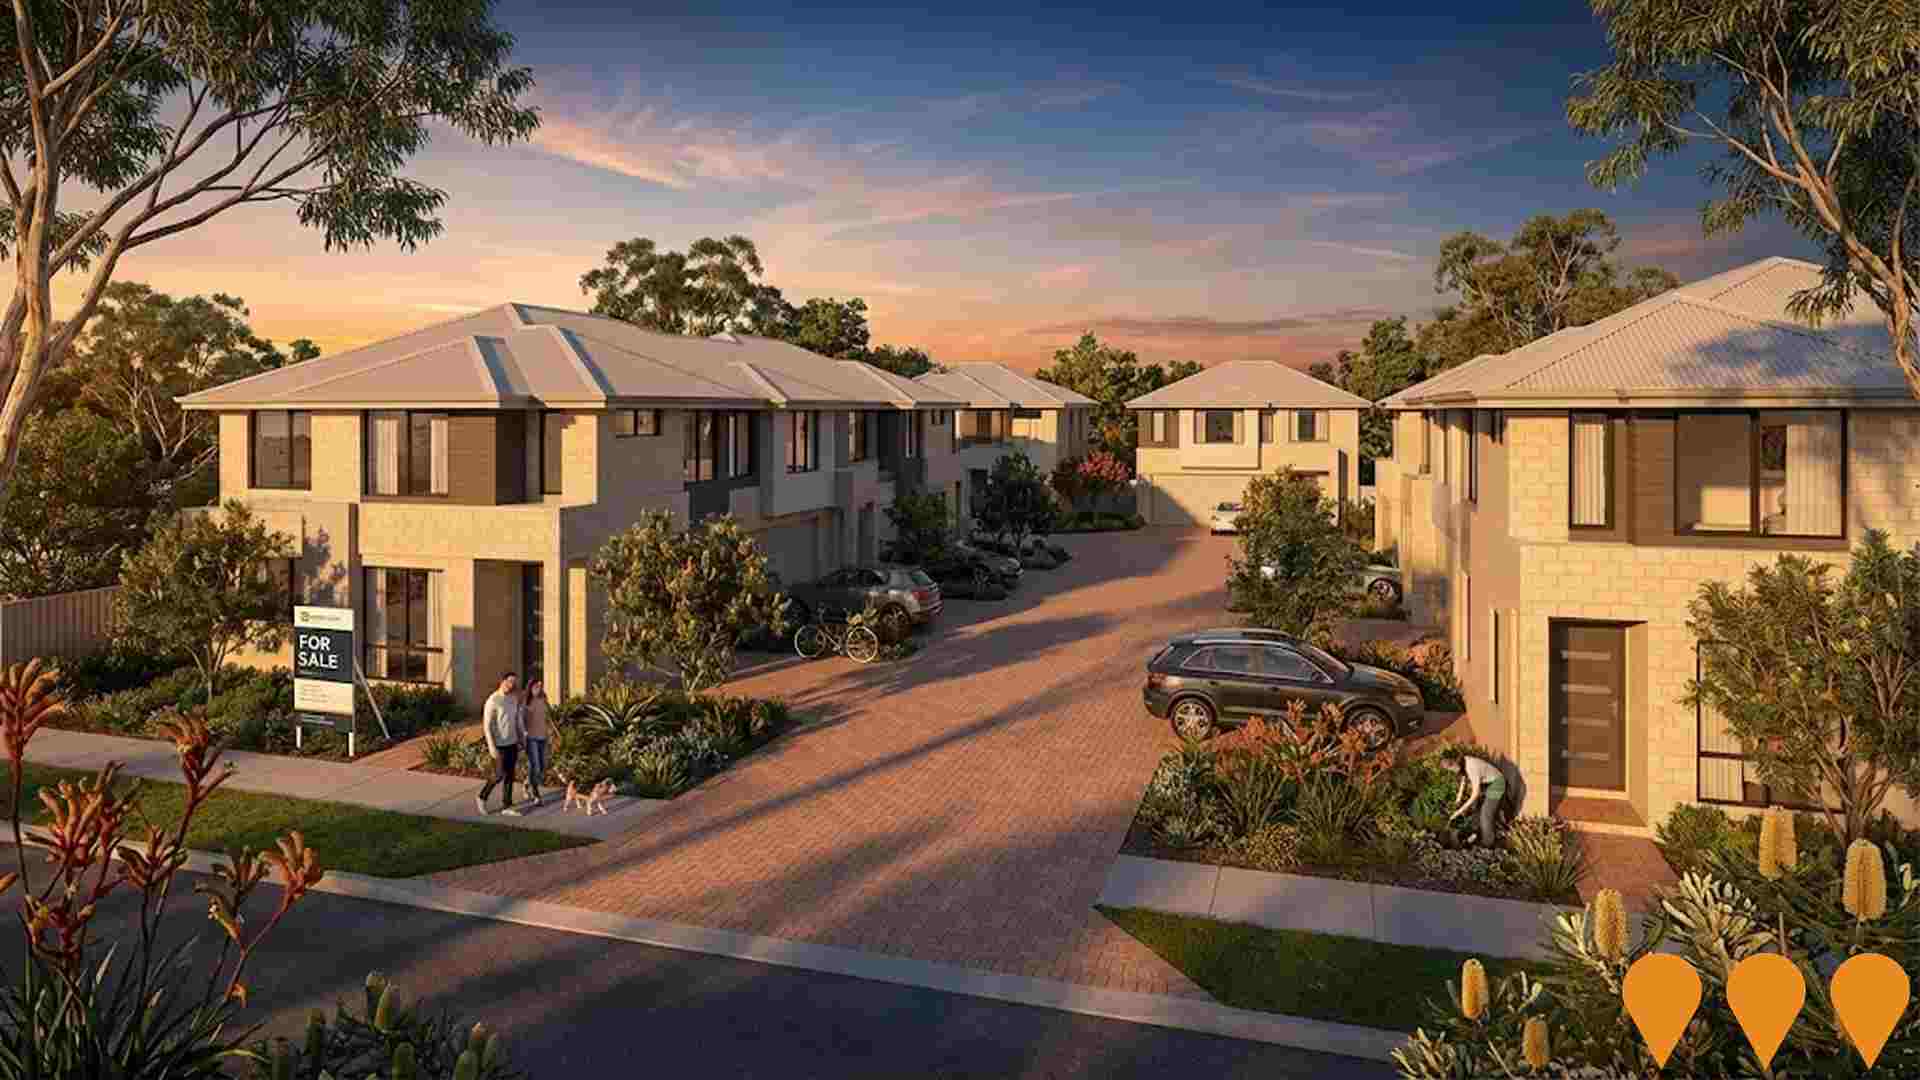
Forrestfield North Residential Precinct
Major residential development surrounding the new High Wycombe train station. Part of broader District Structure Plan including high density housing, activity centre and commercial precinct. Leveraging proximity to new airport rail link.
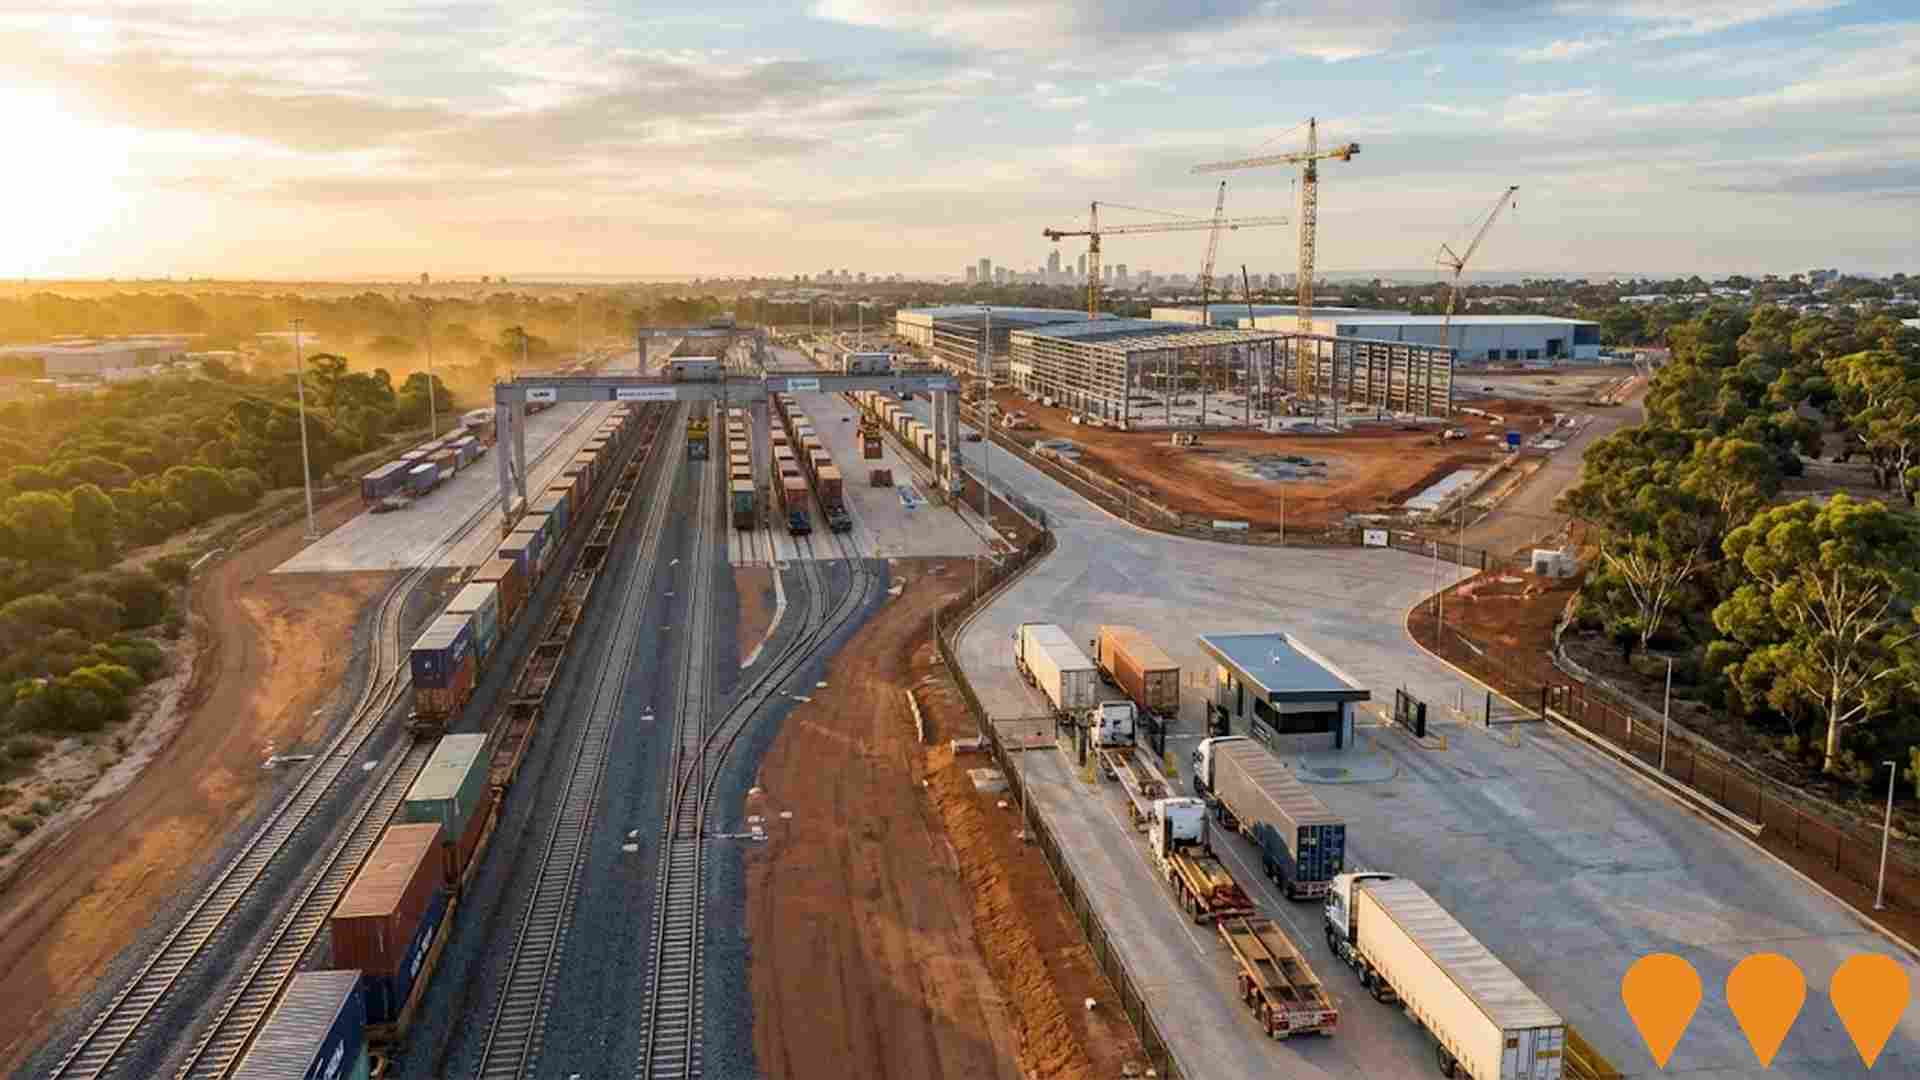
Kewdale Freight Terminal Expansion
Major expansion and modernisation of the Kewdale Freight Terminal as part of the Westport container trade supply chain, including upgrades to rail connections and a new intermodal terminal at Kewdale to increase container volumes on rail, reduce heavy truck movements on key freight routes and create a long term logistics hub east of Perth.
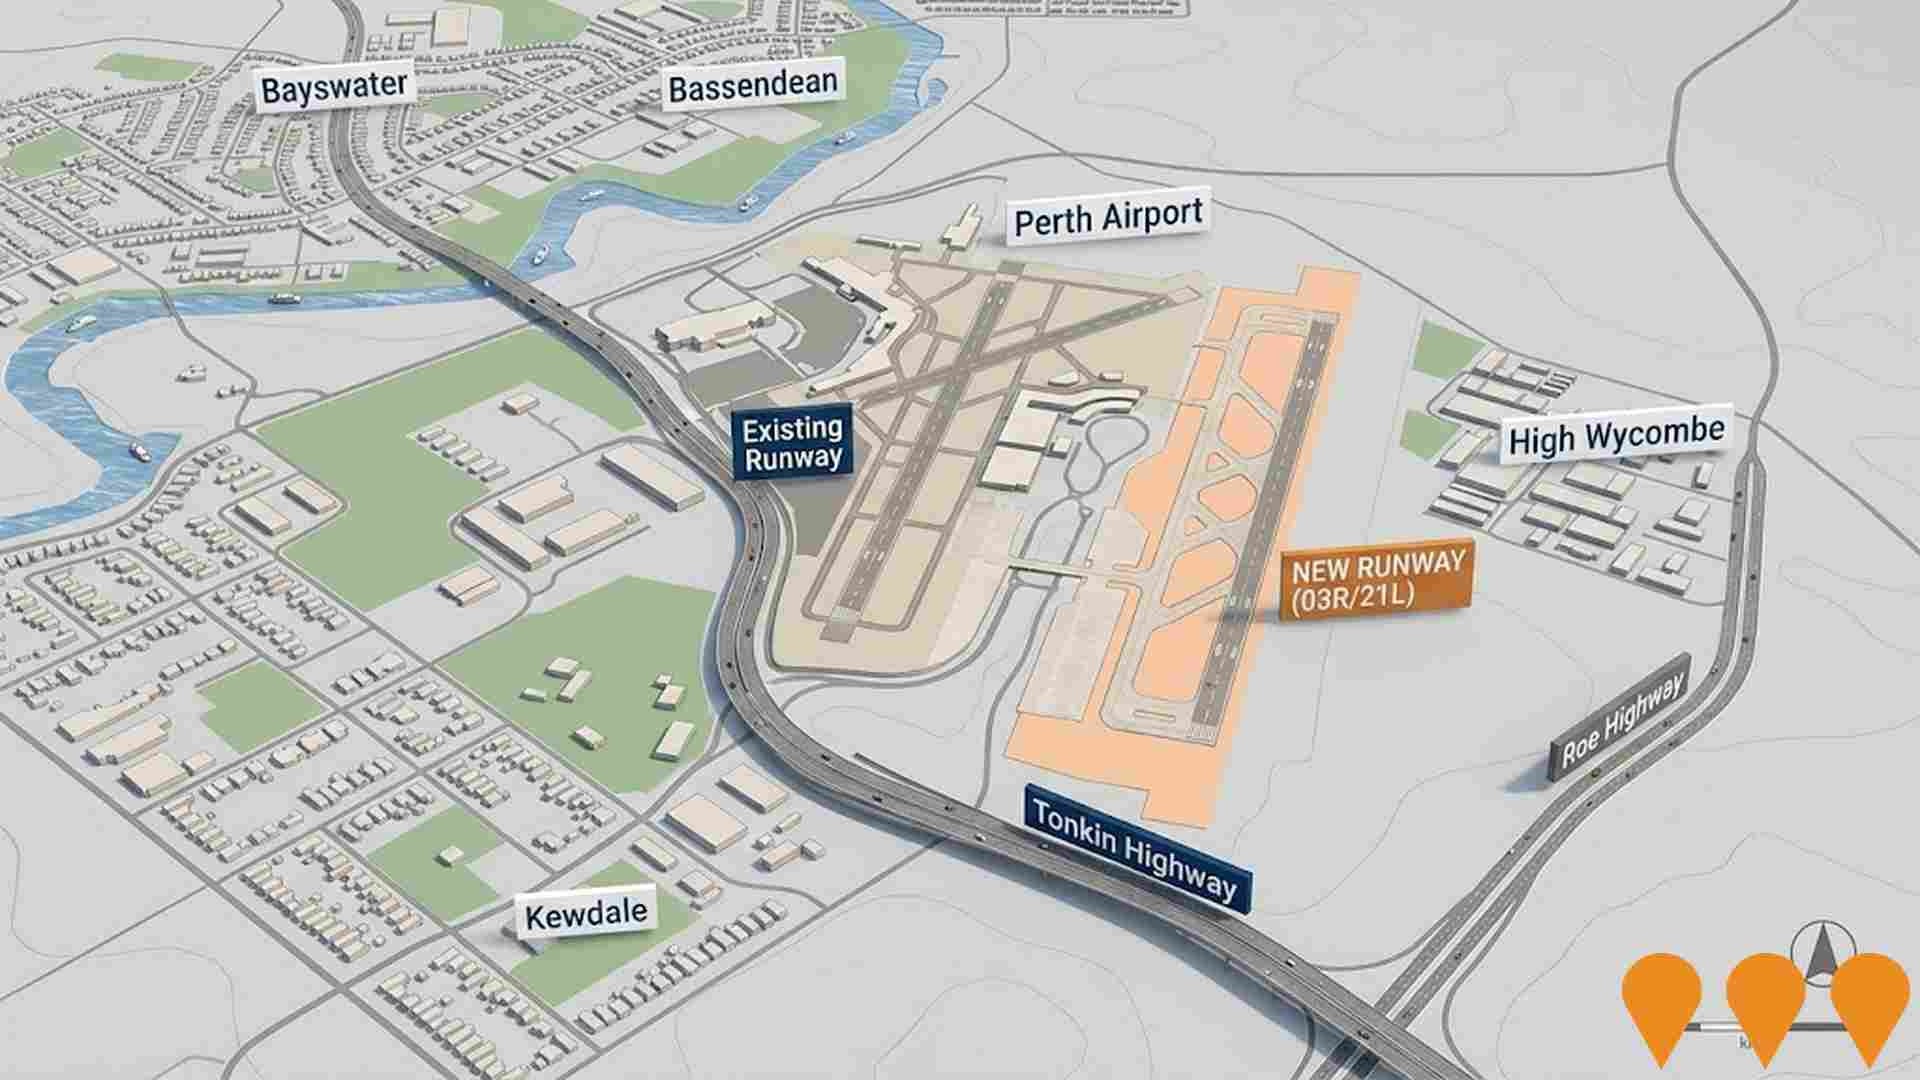
Perth Airport New Runway
Perths New Runway will deliver a new 3,000m long, 45m wide runway (03R/21L) parallel to the existing main runway at Perth Airport. The project includes associated taxiways, lighting, navigational aids, drainage and airfield infrastructure to increase capacity, reduce congestion at peak periods and improve operational efficiency for domestic and international services. The Major Development Plan and environmental offsets have been approved, early works are underway and procurement for major landside works is progressing as part of Perth Airports wider 5 billion dollar One Airport expansion program, with the new runway scheduled to be operational around 2028.
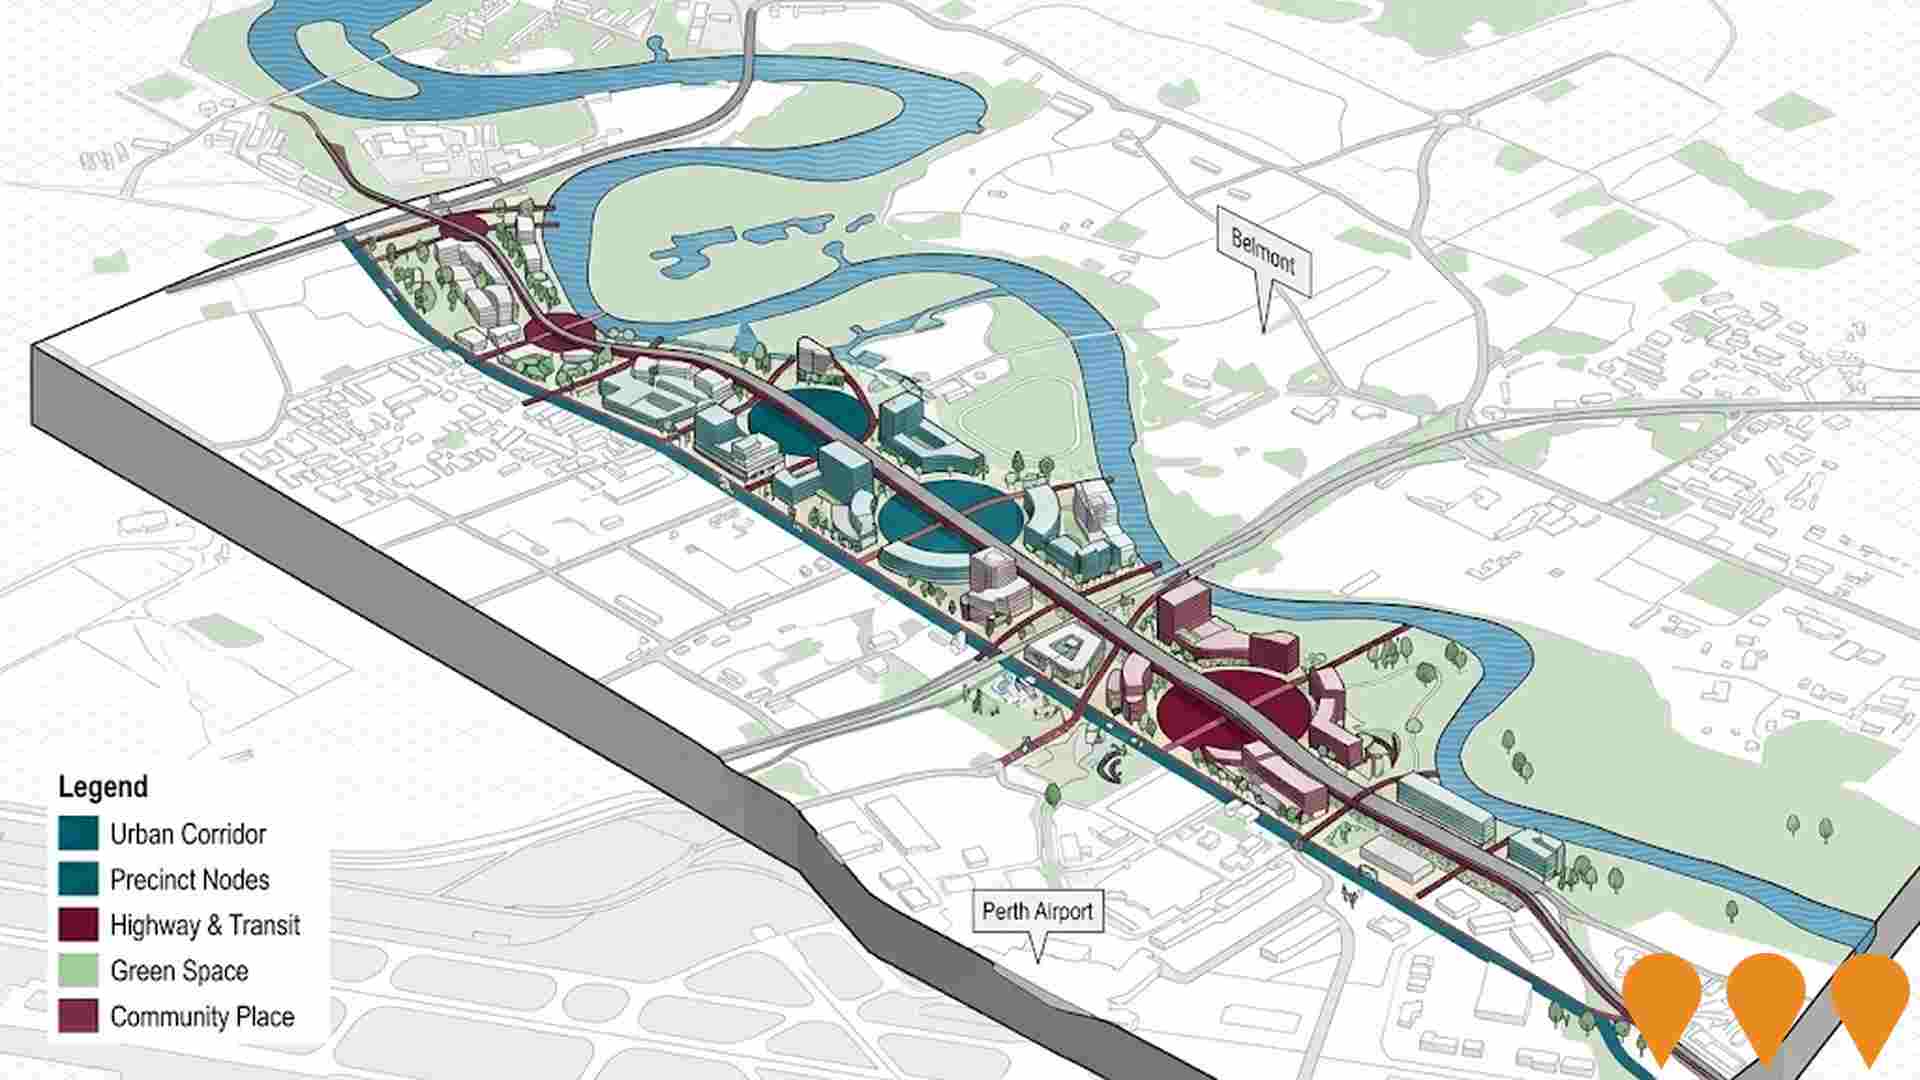
Great Eastern Highway Urban Corridor Strategy
Strategic framework for development along Great Eastern Highway dividing the corridor into four precincts. Addresses land use, built form, public realm and access with mixed-use development opportunities, enhanced pedestrian/cyclist amenity, and community places at major intersections.
Employment
AreaSearch analysis reveals Cloverdale recording weaker employment conditions than most comparable areas nationwide
Cloverdale has a skilled workforce with manufacturing and industrial sectors prominently represented. The unemployment rate was 5.7% in the past year, with an estimated employment growth of 2.7%.
As of September 2025, 5,555 residents are employed, with an unemployment rate of 6.7%, slightly higher than Greater Perth's rate of 4.0%. Workforce participation is similar to Greater Perth's at 65.2%. Employment is concentrated in health care & social assistance, accommodation & food, and retail trade. The area has a strong specialization in accommodation & food, with an employment share of 1.4 times the regional level.
Conversely, education & training shows lower representation at 6.1% compared to the regional average of 9.2%. Over the year to September 2025, employment increased by 2.7%, while labour force increased by 2.3%, reducing the unemployment rate by 0.4 percentage points. Greater Perth recorded employment growth of 2.9% and a marginal rise in unemployment. State-level data from 25-Nov shows WA employment contracted by 0.27%, with an unemployment rate of 4.6%, compared to the national rate of 4.3%. National employment forecasts from May-25 project overall growth of 6.6% over five years and 13.7% over ten years, but growth rates vary significantly between sectors. Applying these projections to Cloverdale's employment mix suggests local employment should increase by 6.1% over five years and 12.9% over ten years.
Frequently Asked Questions - Employment
Income
Income levels align closely with national averages, indicating typical economic conditions for Australian communities according to AreaSearch analysis
The Cloverdale SA2 had a median taxpayer income of $55,287 and an average income of $64,807 in the financial year 2022, according to postcode level ATO data aggregated by AreaSearch. This is roughly in line with national averages, while Greater Perth's median income was $58,380 and average income was $78,020 during the same period. By September 2025, estimated incomes would be approximately $63,138 (median) and $74,010 (average), based on Wage Price Index growth of 14.2% since financial year 2022. Census data indicates that household, family, and personal incomes in Cloverdale are modest, ranking between the 36th and 51st percentiles. The $1,500 - $2,999 earnings band includes 33.8% of the community (3,372 individuals), similar to broader trends across regional levels at 32.0%. Income pressures are severe due to housing affordability, with only 81.5% of income remaining after expenses, ranking at the 34th percentile.
Frequently Asked Questions - Income
Housing
Cloverdale is characterized by a predominantly suburban housing profile, with ownership patterns similar to the broader region
In Cloverdale, houses constituted 74.1% of dwellings according to the latest Census data, with other dwelling types making up 25.8%. This compares to Perth metro's figures of 60.5% for houses and 39.6% for other dwellings. Home ownership in Cloverdale stood at 22.6%, mirroring Perth metro's level, with mortgaged dwellings at 32.5% and rented ones at 45.0%. The median monthly mortgage repayment was $1,700, below the Perth metro average of $1,842. The median weekly rent in Cloverdale was recorded as $340, compared to Perth metro's figure of $350. Nationally, Cloverdale's median monthly mortgage repayments were lower at $1,700 than the Australian average of $1,863, and its median weekly rents were less at $340 than the national figure of $375.
Frequently Asked Questions - Housing
Household Composition
Cloverdale features high concentrations of group households and lone person households, with a higher-than-average median household size
Family households constitute 63.6% of all households, including 26.2% couples with children, 22.8% couples without children, and 12.5% single parent families. Non-family households account for the remaining 36.4%, with lone person households at 30.4% and group households comprising 6.0%. The median household size is 2.4 people, which is larger than the Greater Perth average of 2.3.
Frequently Asked Questions - Households
Local Schools & Education
Educational attainment in Cloverdale aligns closely with national averages, showing typical qualification patterns and performance metrics
The area's university qualification rate is 26.3%, significantly lower than the SA3 area average of 36.6%. Bachelor degrees are most common at 19.0%, followed by postgraduate qualifications (5.2%) and graduate diplomas (2.1%). Vocational credentials are prevalent, with 36.0% of residents aged 15+ holding such qualifications, including advanced diplomas (11.7%) and certificates (24.3%). Educational participation is high, with 30.6% of residents currently enrolled in formal education, including primary (9.4%), secondary (6.9%), and tertiary (6.3%) levels.
Educational participation is notably high, with 30.6% of residents currently enrolled in formal education. This includes 9.4% in primary education, 6.9% in secondary education, and 6.3% pursuing tertiary education.
Frequently Asked Questions - Education
Schools Detail
Nearby Services & Amenities
Transport
Transport servicing is high compared to other areas nationally based on assessment of service frequency, route connectivity and accessibility
Cloverdale has 63 active public transport stops, all of which are bus stops. These stops are served by 15 different routes that collectively facilitate 2,994 weekly passenger trips. The average distance from residents' homes to the nearest transport stop is 161 meters, indicating excellent accessibility.
On average, there are 427 daily trips across all routes, which translates to approximately 47 weekly trips per individual stop.
Frequently Asked Questions - Transport
Transport Stops Detail
Health
Cloverdale's residents are healthier than average in comparison to broader Australia with prevalence of common health conditions quite low among the general population though higher than the nation's average across older, at risk cohorts
Health data shows Cloverdale residents have relatively positive health outcomes. Prevalence of common health conditions is low among the general population but higher than the national average in older, at-risk cohorts.
Private health cover rate is approximately 52% (around 5,179 people), slightly higher than the average SA2 area's 46%. This compares to Greater Perth's 56.5%. The most common conditions are mental health issues (7.4%) and arthritis (6.8%), while 73.0% report no medical ailments, compared to Greater Perth's 73.7%. Cloverdale has 13.5% residents aged 65 and over (1,343 people). Health outcomes among seniors require more attention than the broader population.
Frequently Asked Questions - Health
Cultural Diversity
Cloverdale is among the most culturally diverse areas in the country based on AreaSearch assessment of a range of language and cultural background related metrics
Cloverdale's cultural diversity is notable, with 36.3% speaking a language other than English at home and 46.1% born overseas. Christianity is the dominant religion in Cloverdale, comprising 42.8%. Islam is overrepresented compared to Greater Perth, at 8.7% versus 6.6%.
The top three ancestry groups are English (21.8%), Australian (18.1%), and Other (17.8%). Filipino, Maori, and Sri Lankan ethnicities are notably more prevalent in Cloverdale than regionally, at 4.5%, 1.4%, and 0.5% respectively versus 2.0%, 0.8%, and 0.4%.
Frequently Asked Questions - Diversity
Age
Cloverdale hosts a young demographic, positioning it in the bottom quartile nationwide
Cloverdale's median age is 34 years, which is lower than Greater Perth's average of 37 and Australia's national average of 38 years. Compared to Greater Perth, Cloverdale has a higher percentage of residents aged 25-34 at 20.4%, but fewer residents aged 5-14 at 10.7%. This concentration of 25-34 year-olds is significantly higher than the national average of 14.5%. Between the 2021 Census and now, the population percentage for those aged 35 to 44 has increased from 15.2% to 15.9%, while the percentage for those aged 15 to 24 has decreased from 13.2% to 12.2%. By 2041, demographic forecasts indicate substantial changes in Cloverdale's population structure. The 45 to 54 age group is projected to grow by 33%, adding 383 residents to reach a total of 1,530. Conversely, the 5 to 14 age group shows minimal growth of just 2% (23 people).
