Chart Color Schemes
This analysis uses ABS Statistical Areas Level 2 (SA2) boundaries, which can materially differ from Suburbs and Localities (SAL) even when sharing similar names.
SA2 boundaries are defined by the Australian Bureau of Statistics and are designed to represent communities for statistical reporting (e.g., census and ERP).
Suburbs and Localities (SAL) represent commonly-used suburb/locality names (postal-style areas) and may use different geographic boundaries. For comprehensive analysis, consider reviewing both boundary types if available.
est. as @ -- *
ABS ERP | -- people | --
2021 Census | -- people
Sales Activity
Curious about local property values? Filter the chart to assess the volume and appreciation (including resales) trends and regional comparisons, or scroll to the map below view this information at an individual property level.
Find a Recent Sale
Sales Detail
Population
Manjimup is positioned among the lower quartile of areas assessed nationally for population growth based on AreaSearch's assessment of recent, and medium term trends
Manjimup's population is approximately 5,646 as of November 2025. This represents an increase of 199 people, a growth rate of 3.7%, since the 2021 Census which recorded a population of 5,447. The change is inferred from the estimated resident population of 5,630 in June 2024 and an additional 26 validated new addresses since the Census date. This results in a population density ratio of 17.4 persons per square kilometer. Population growth was primarily driven by overseas migration during recent periods.
AreaSearch is adopting ABS/Geoscience Australia projections for each SA2 area, released in 2024 with a base year of 2022. For areas not covered and post-2032 estimations, AreaSearch uses ABS' Greater Capital Region projections released in 2023 based on 2022 data. Considering projected demographic shifts, the area is expected to grow by 773 persons to 2041, reflecting a total gain of 13.4%.
Frequently Asked Questions - Population
Development
Residential development activity is lower than average in Manjimup according to AreaSearch's national comparison of local real estate markets
Manjimup has seen approximately 14 new homes approved annually. Over the past five financial years, from FY21 to FY25, 73 homes were approved, with an additional 5 approved in FY26 so far. On average, 1.4 people moved to the area each year for each dwelling built during this period. This balance between supply and demand has created stable market conditions.
However, recent figures show that this ratio has eased to 0 people per dwelling over the past two financial years, indicating better supply availability. New properties are constructed at an average expected cost of $250,000, aligning with regional trends. In FY26, $1.7 million in commercial approvals have been registered, reflecting the area's residential nature. Compared to the Rest of WA, Manjimup has significantly less development activity, 57.0% below the regional average per person. This limited new supply generally supports stronger demand and values for established dwellings.
Similarly, development activity is under the national average, suggesting the area's established nature and potential planning limitations. Recent development has been entirely comprised of detached dwellings, preserving Manjimup's low density nature and attracting space-seeking buyers. The estimated count of 374 people in the area per dwelling approval reflects its quiet, low activity development environment. According to the latest AreaSearch quarterly estimate, Manjimup is forecasted to gain 757 residents by 2041. If current construction levels persist, housing supply could lag population growth, potentially intensifying buyer competition and underpinning price growth.
Frequently Asked Questions - Development
Infrastructure
Manjimup has limited levels of nearby infrastructure activity, ranking in the 3rdth percentile nationally
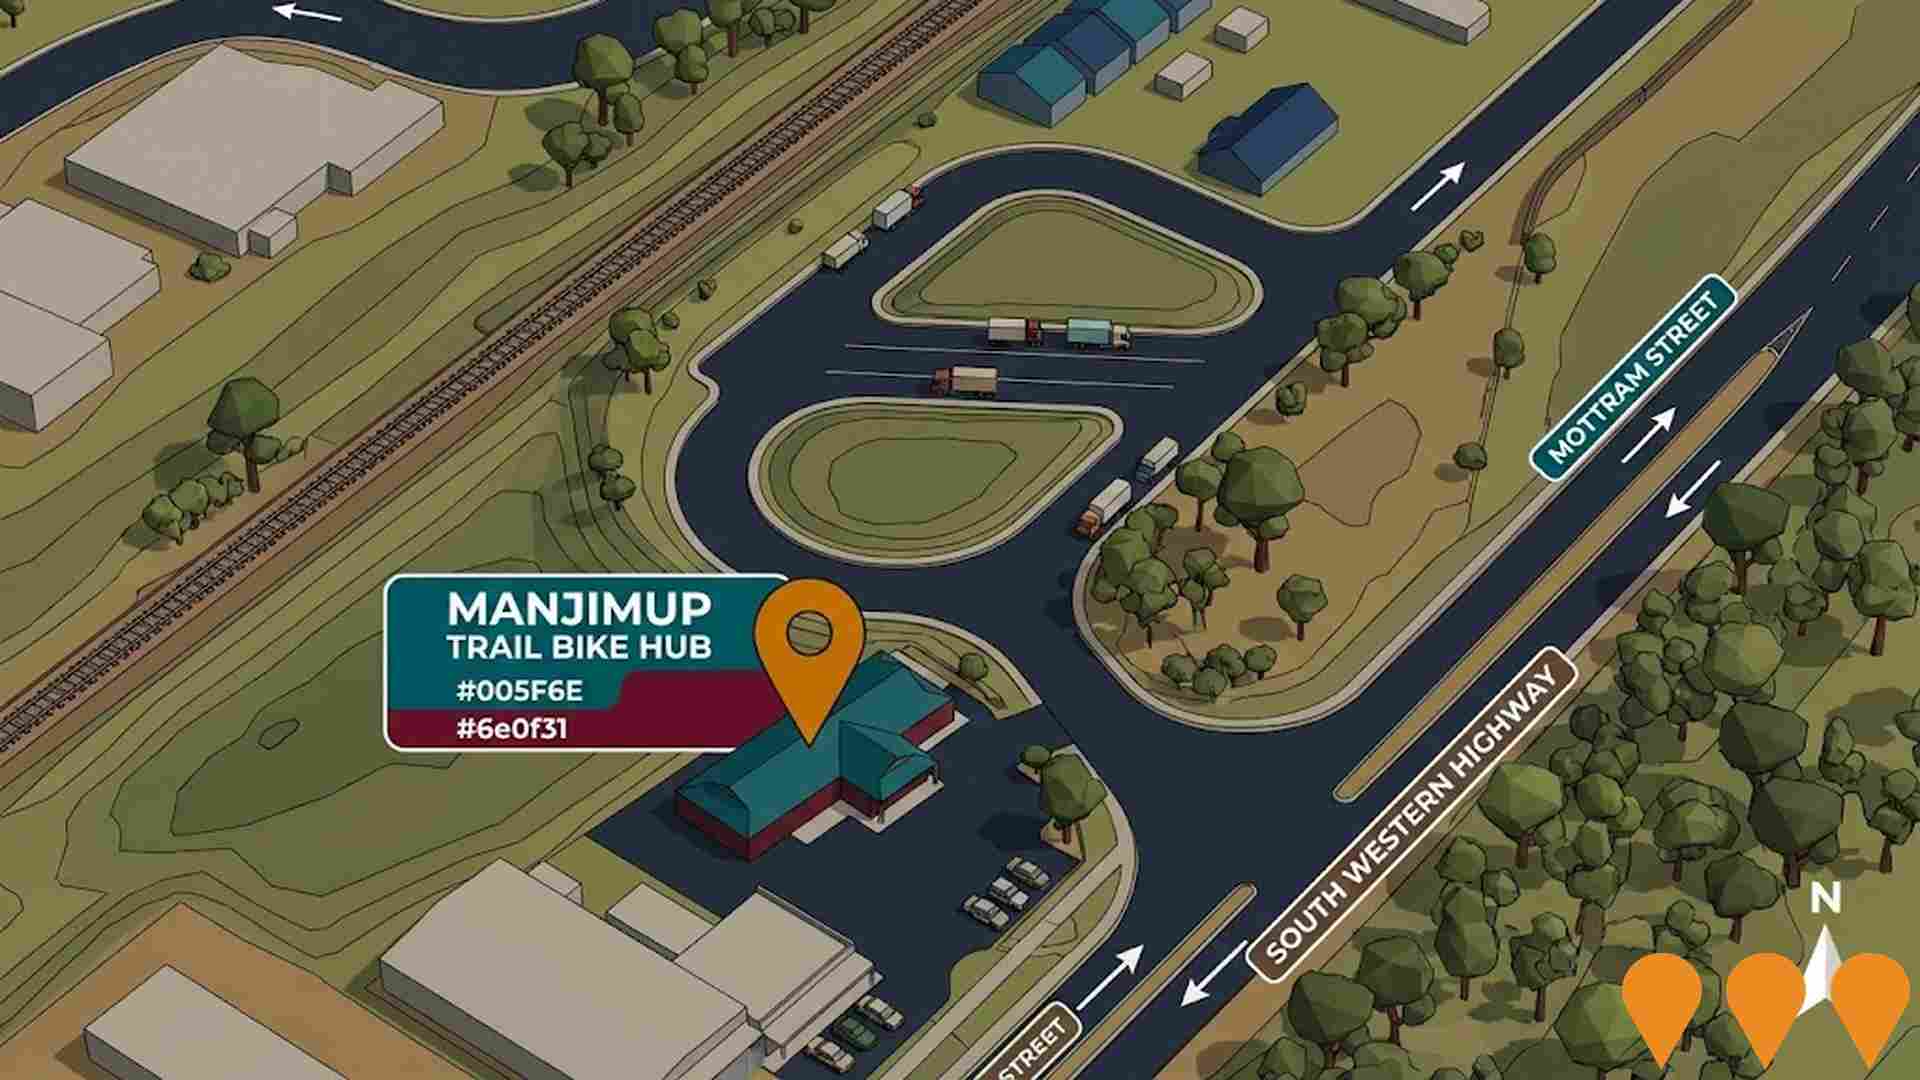
Changes to local infrastructure significantly impact an area's performance. AreaSearch has identified seven projects that may affect this region. Notable projects include Manjimup Rea Park & Collier Street Redevelopment, Shire of Manjimup Town Blueprints, Manjimup Motel and Restaurant, and Manjimup Trail Bike Hub. The following list details those most likely to be relevant.
Professional plan users can use the search below to filter and access additional projects.
INFRASTRUCTURE SEARCH
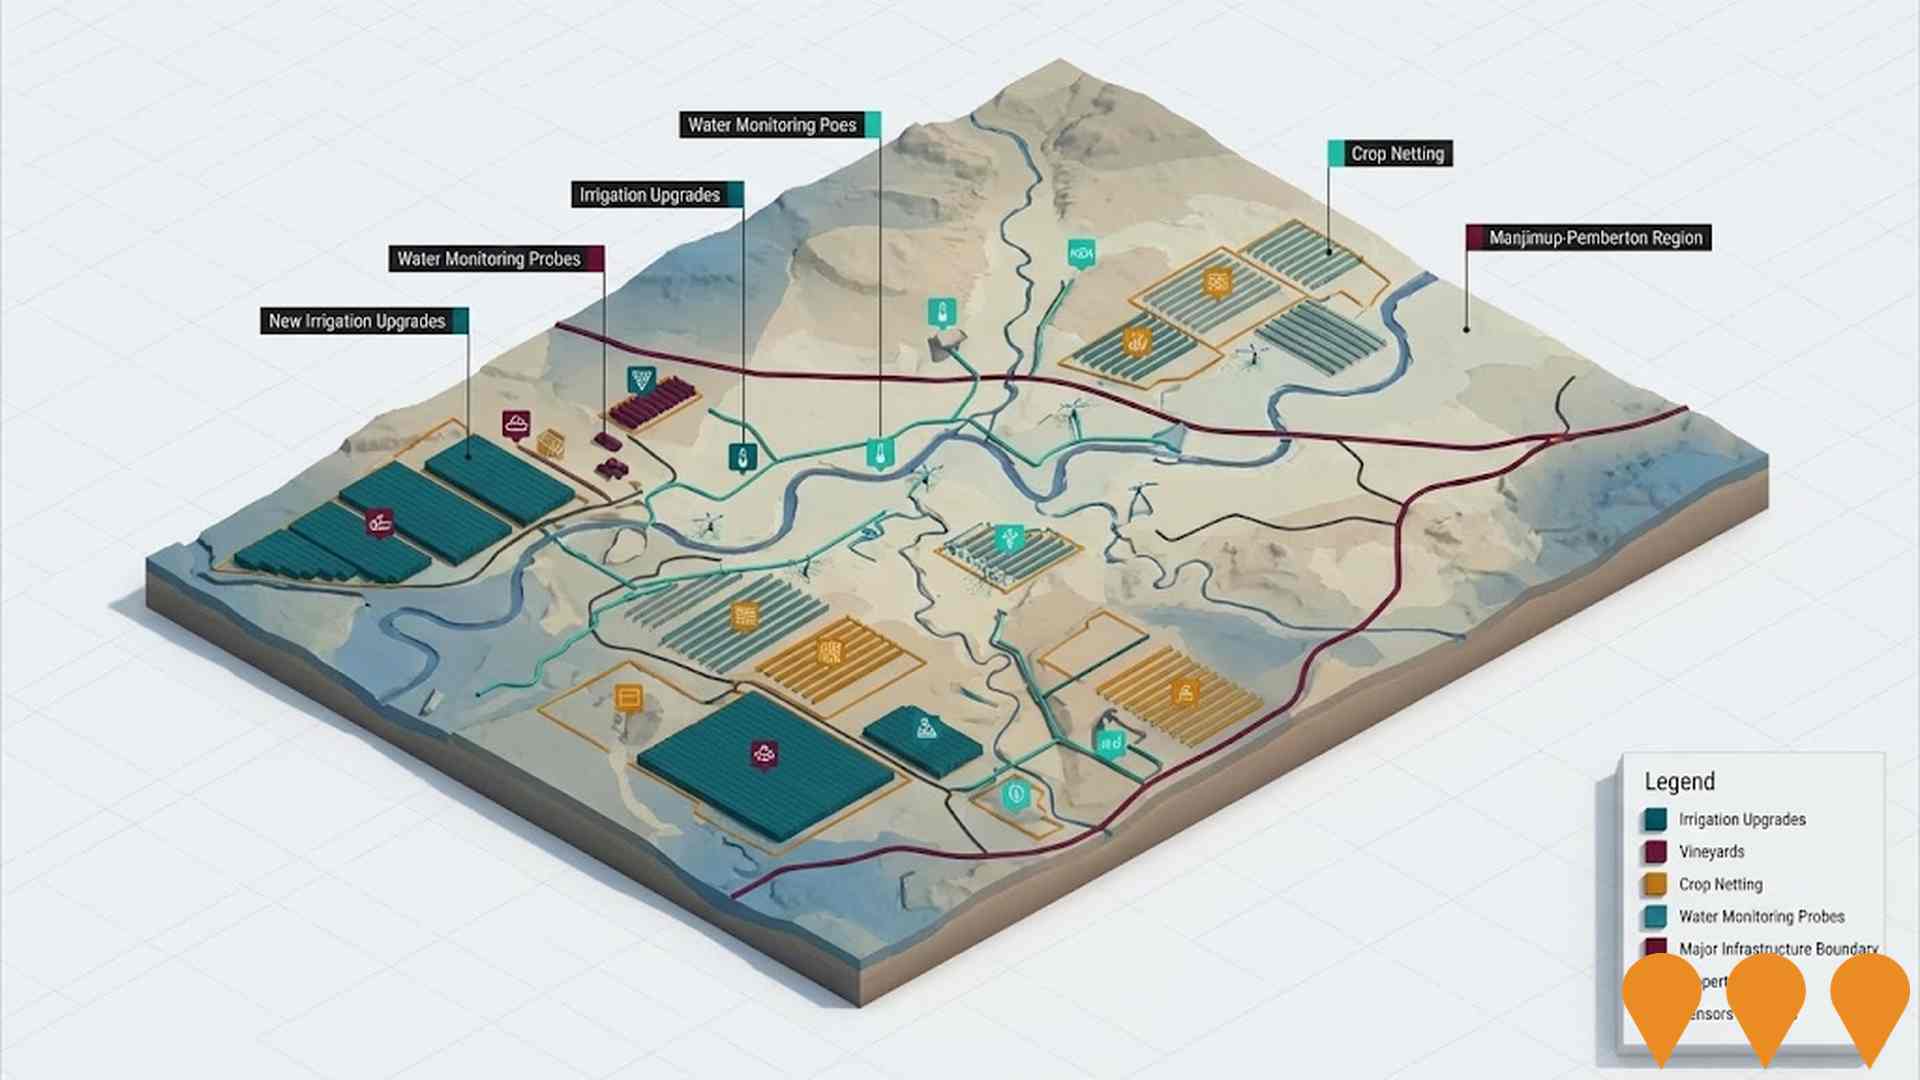
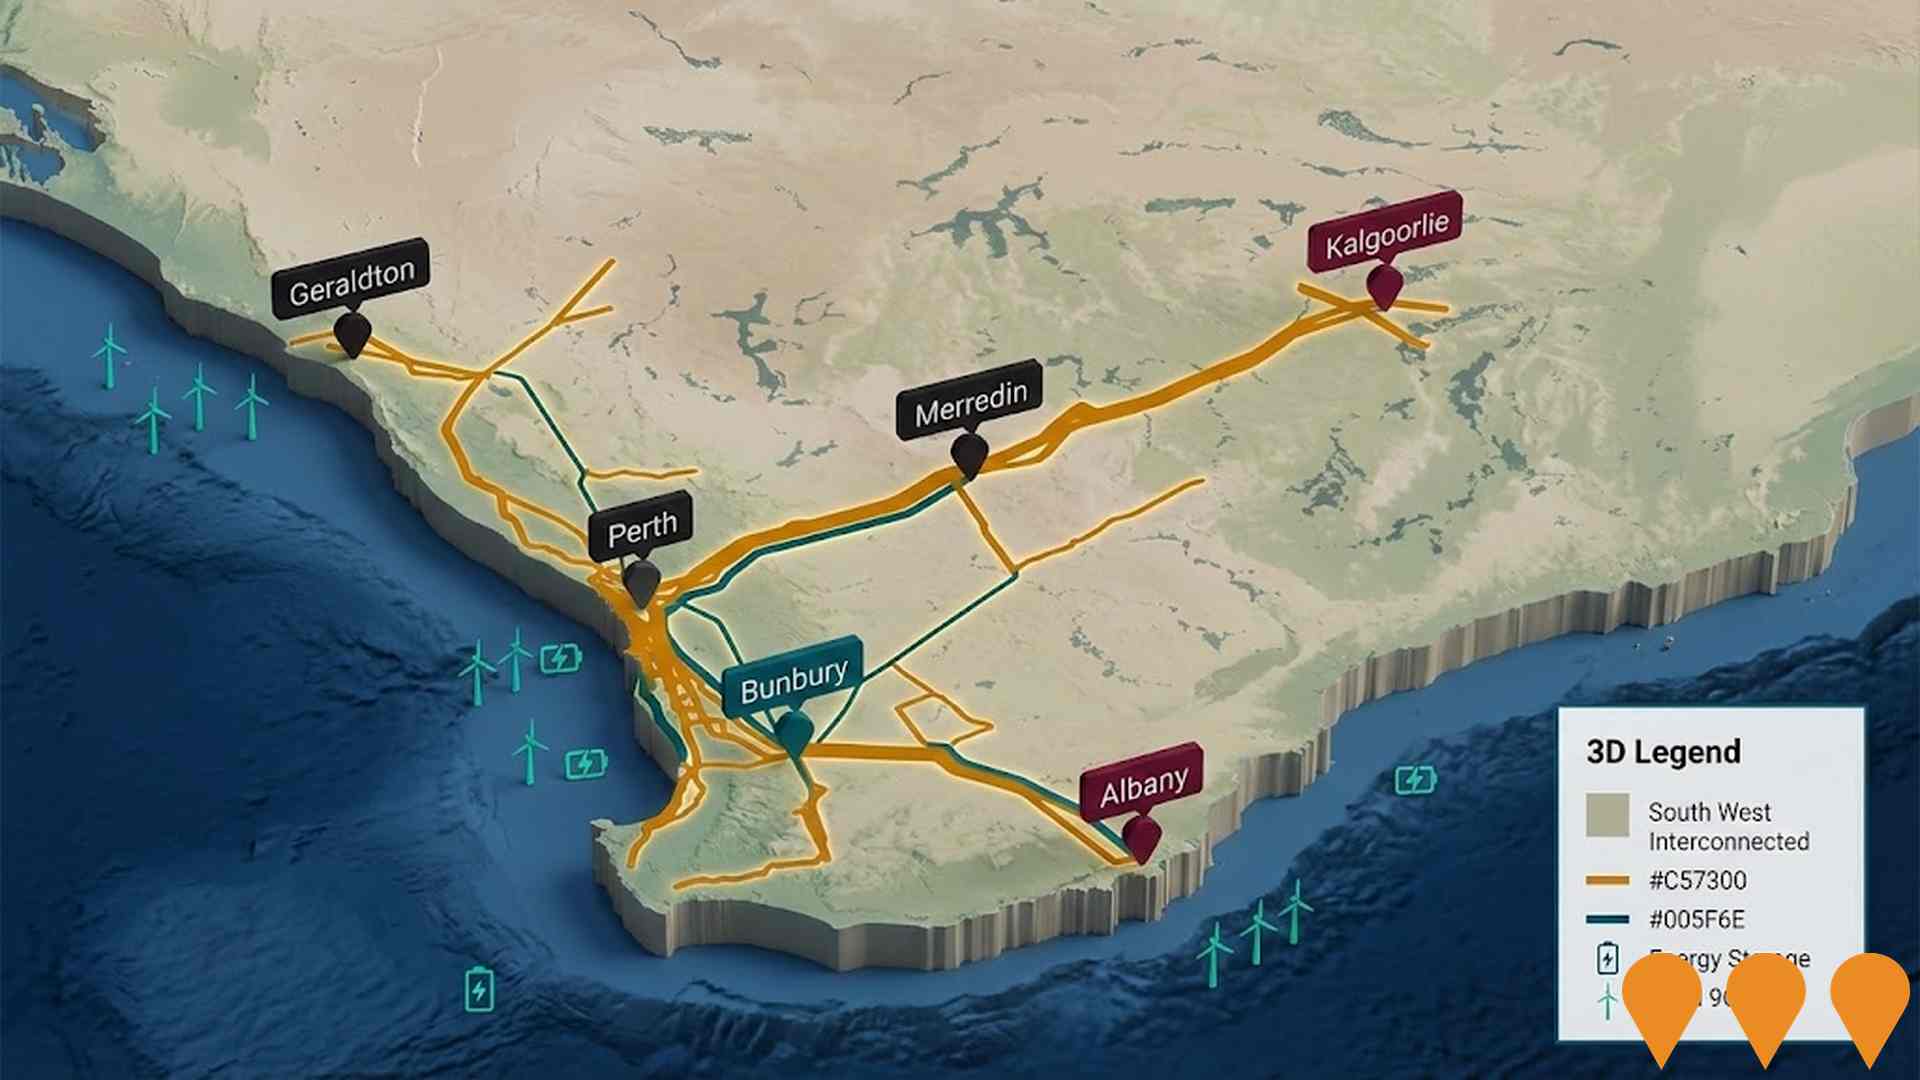
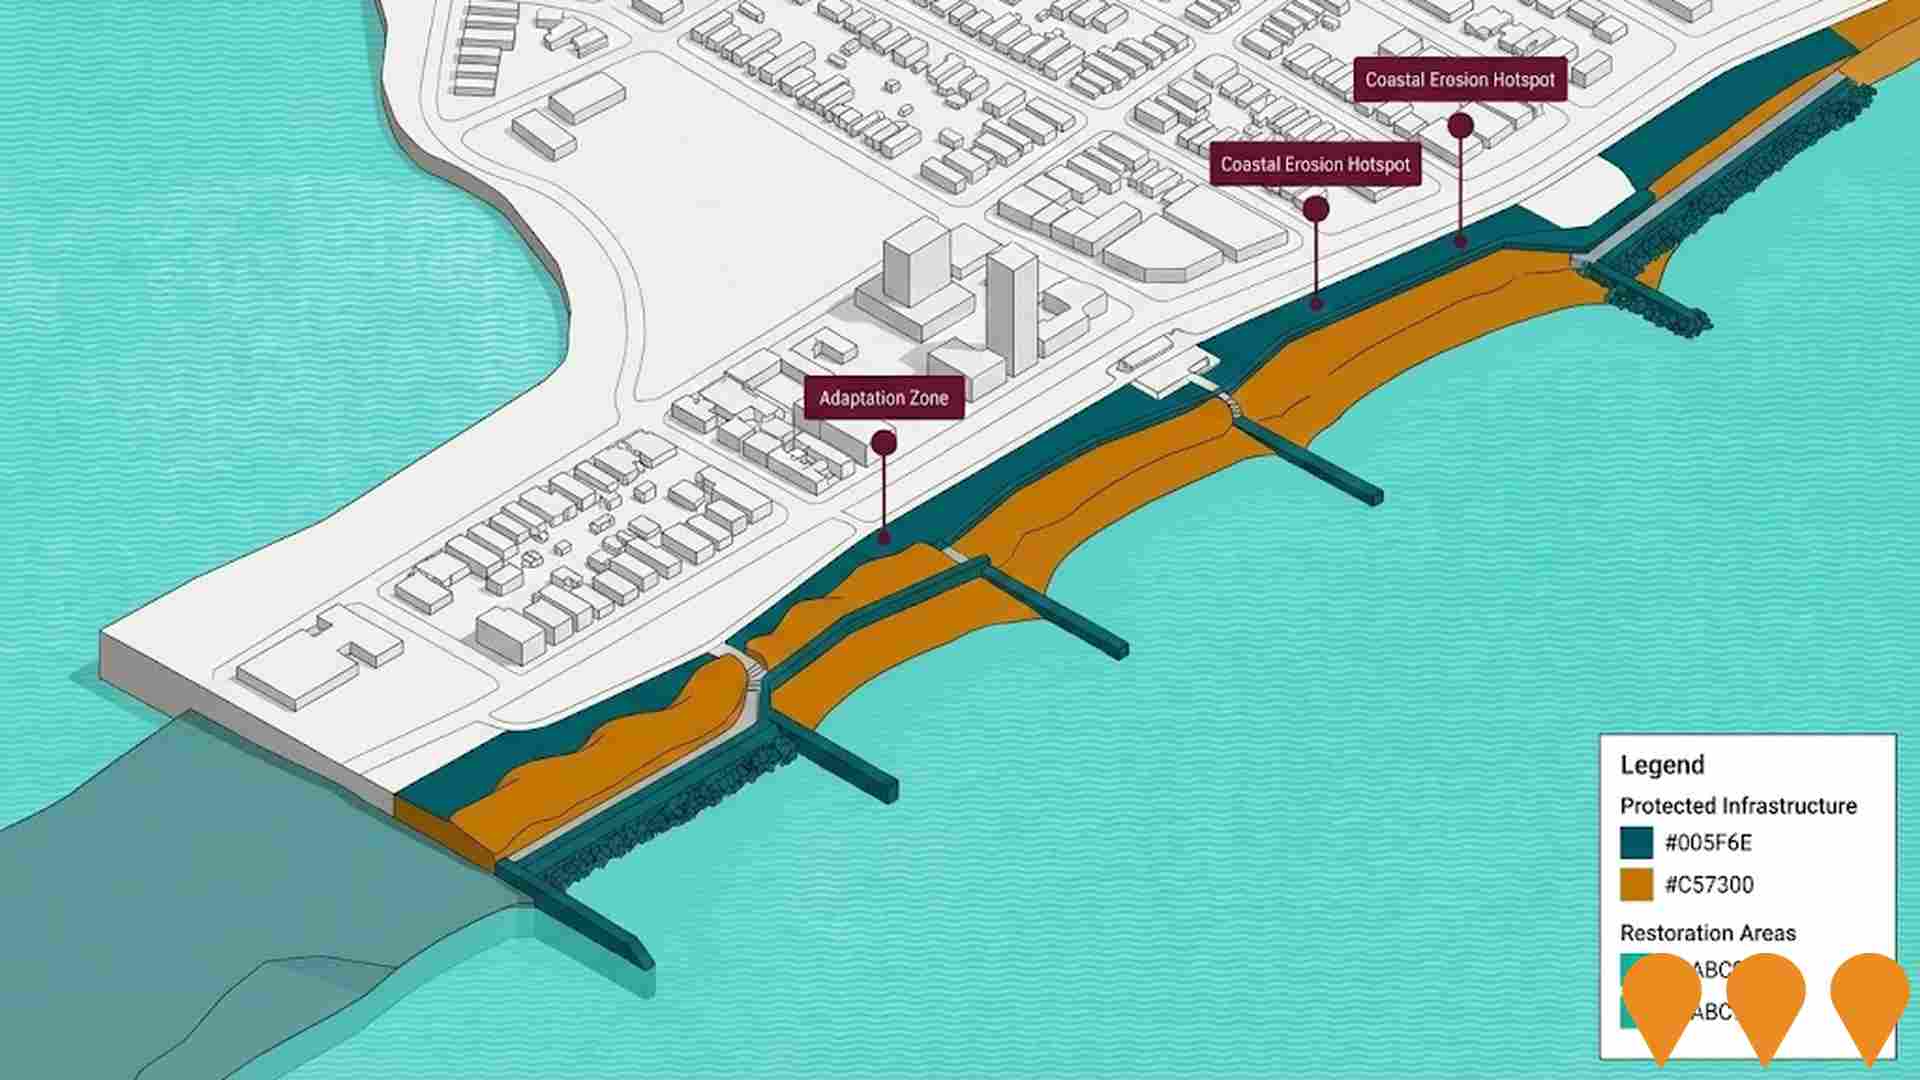
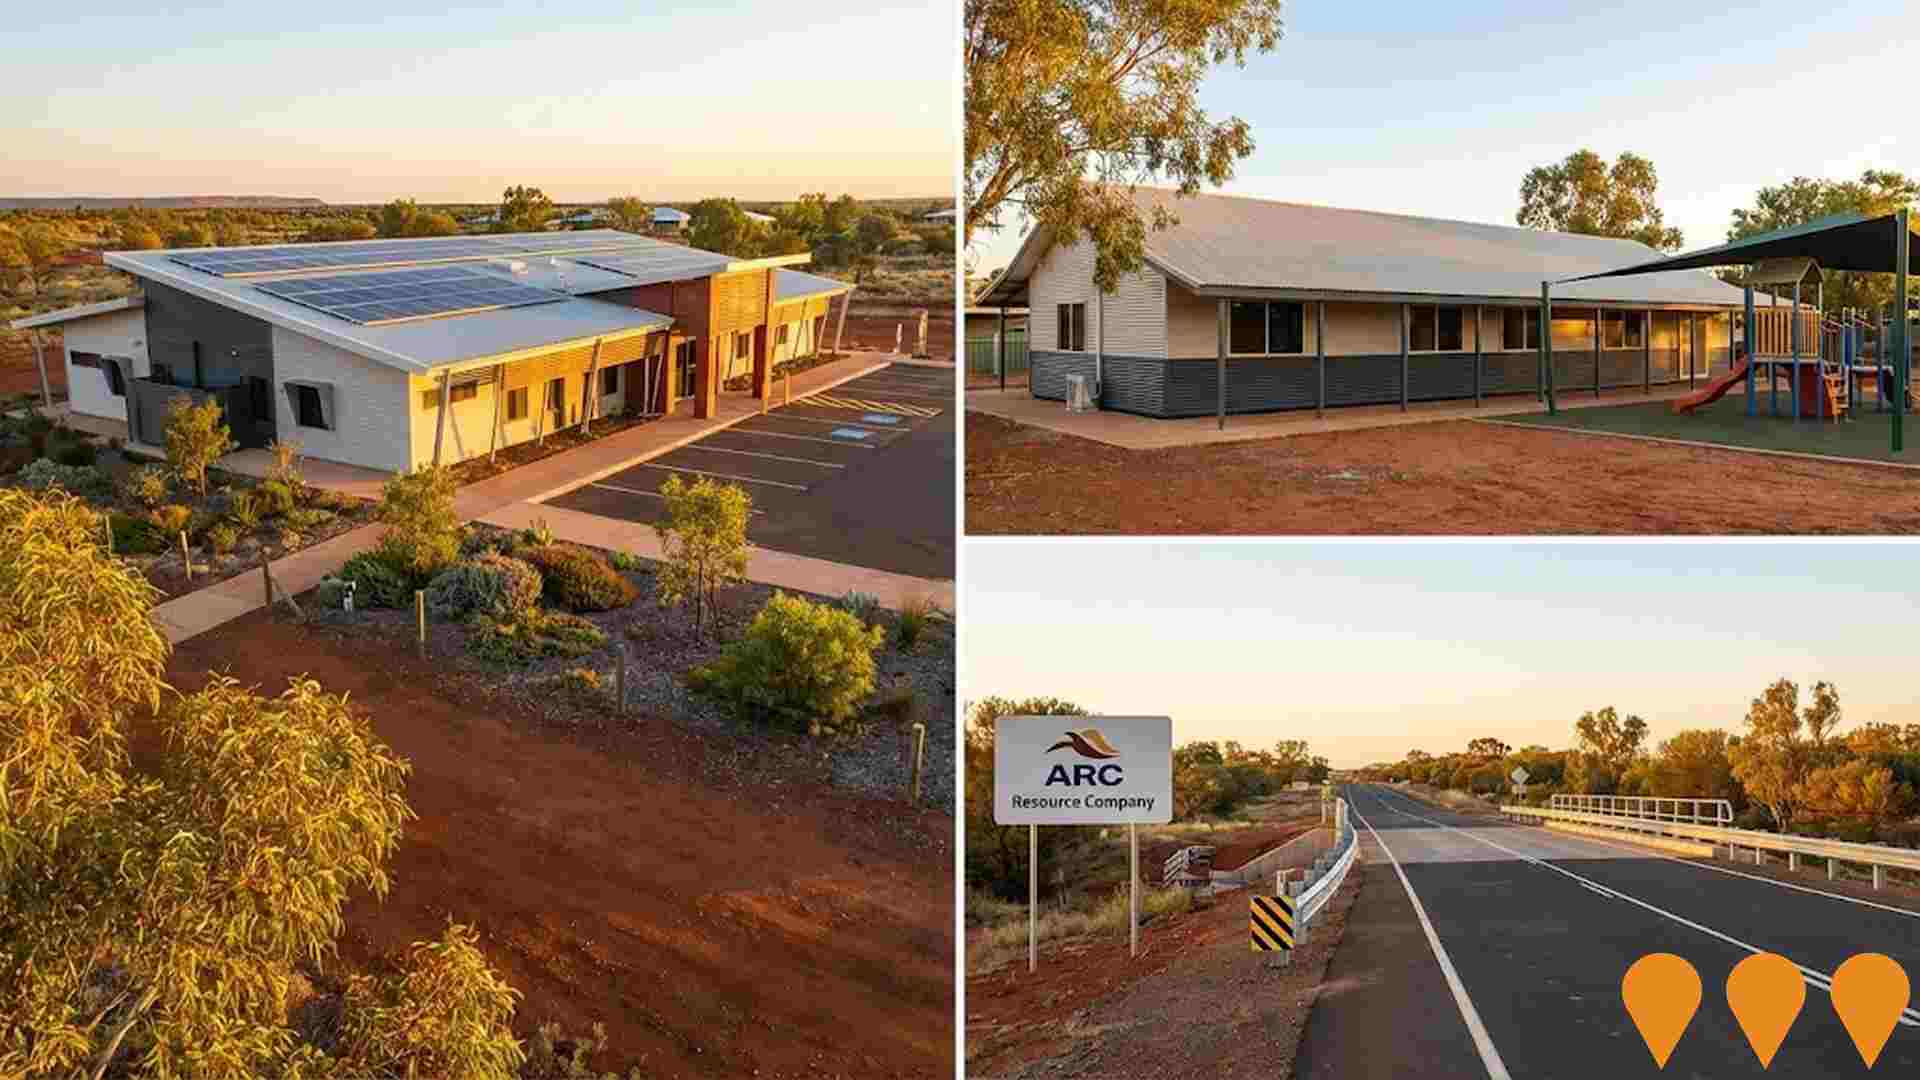
 Denotes AI-based impression for illustrative purposes only, not to be taken as definitive under any circumstances. Please follow links and conduct other investigations from the project's source for actual imagery. Developers and project owners wishing us to use original imagery please Contact Us and we will do so.
Frequently Asked Questions - Infrastructure
Resources Community Investment Initiative
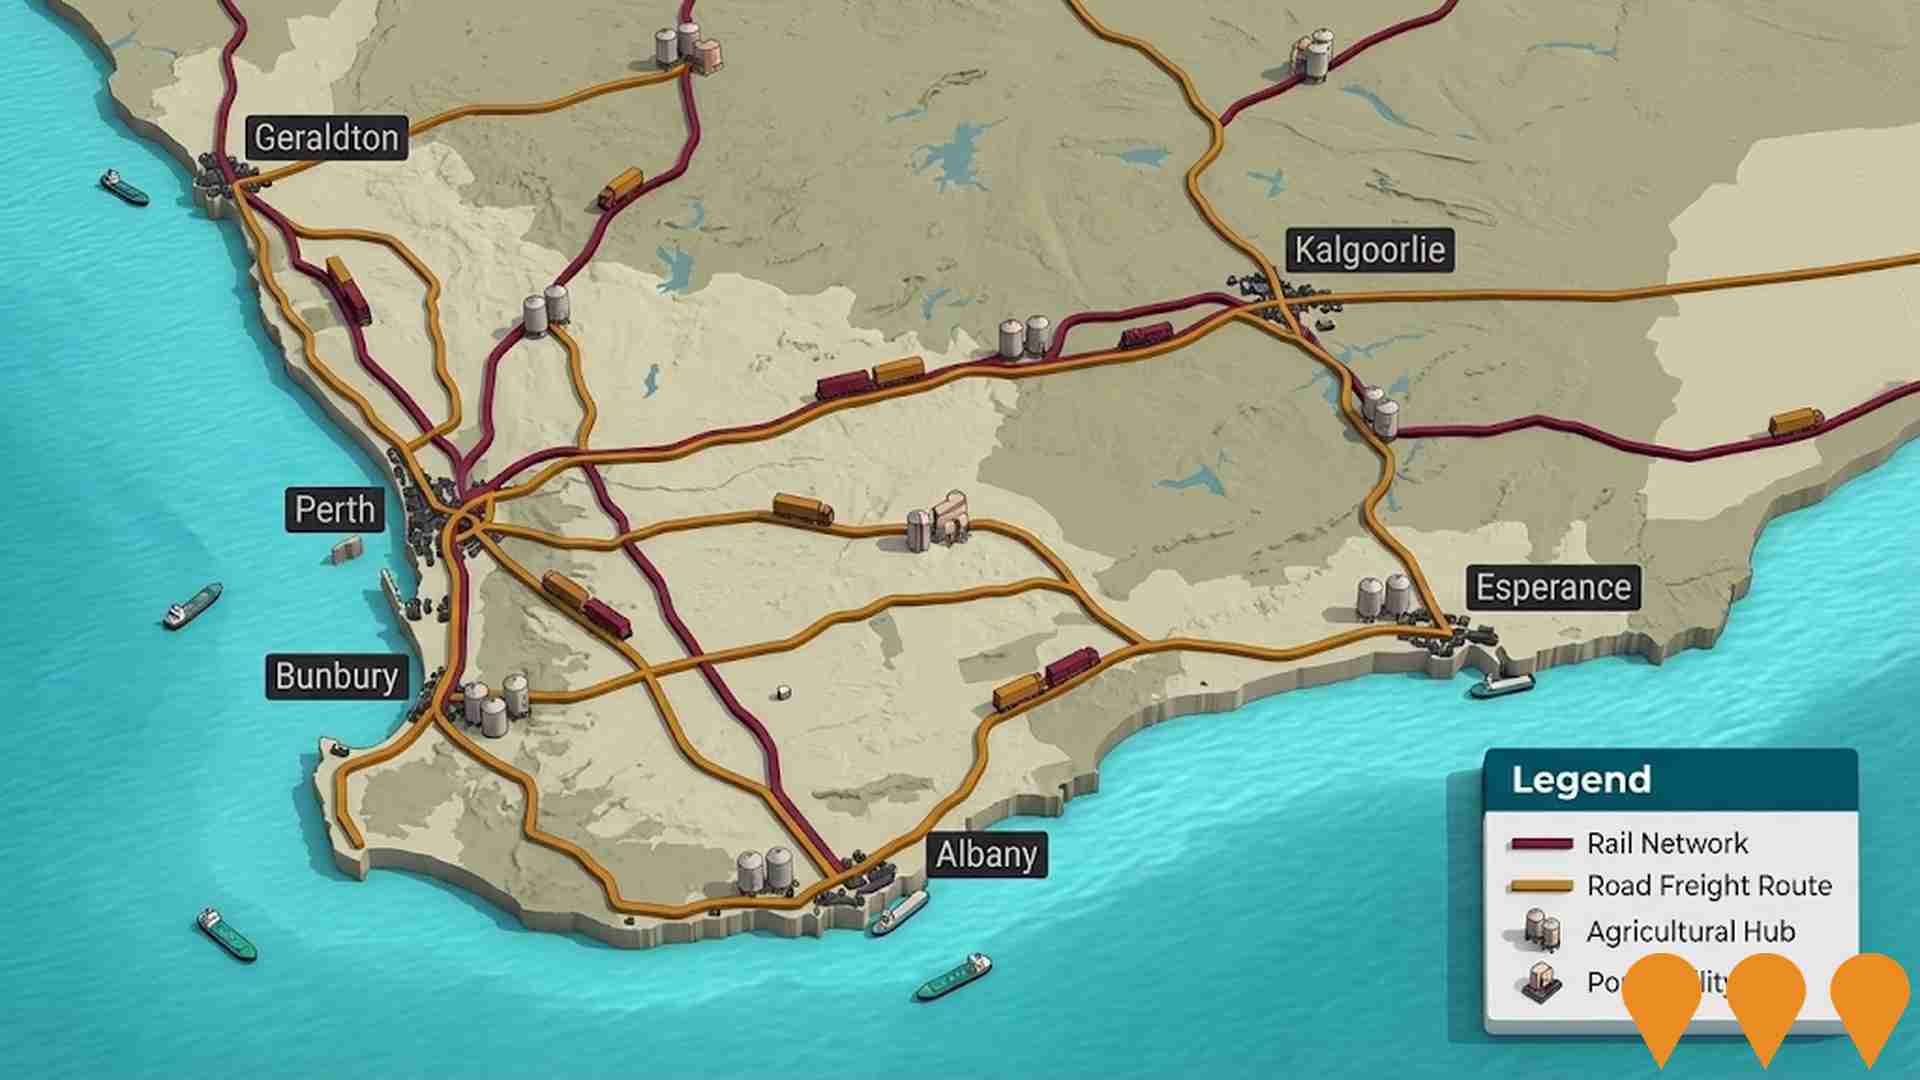
A $750 million partnership between the Western Australian Government and seven major resource companies (Rio Tinto, BHP, Woodside Energy, Chevron Australia, Mineral Resources, Fortescue, Roy Hill) to co-fund community, social and regional infrastructure projects across regional Western Australia, with strong focus on the Pilbara, Goldfields, Kimberley, Mid West and Gascoyne.
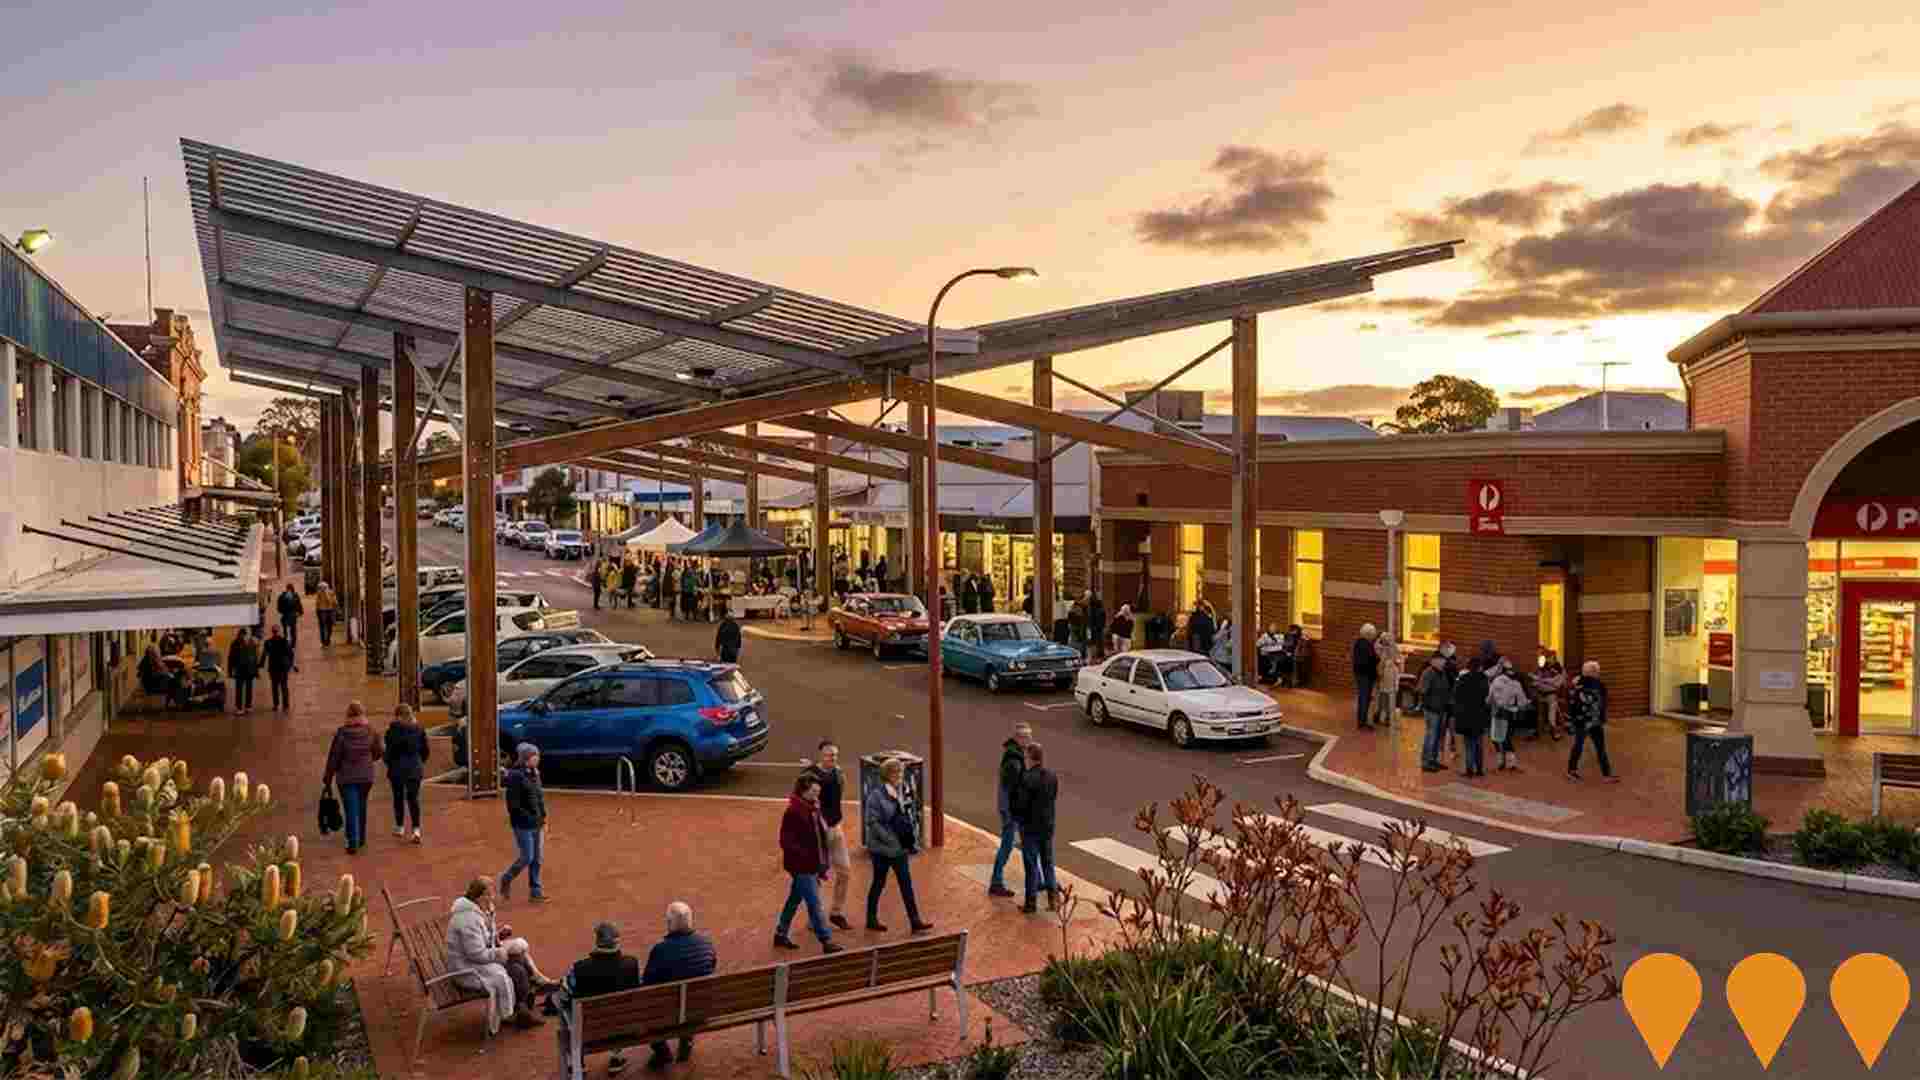
Manjimup Town Centre Revitalisation
Multi-stage renewal delivering eight components including Brockman Street town square canopy and CBD streetscape, Manjimup Timber and Heritage Park upgrades (Power Up Museum and State Timber Museum), linear recreation park, new access points and town entries, highway enhancements and pedestrian/cycling links. Key construction elements were completed by 2020 with Heritage Park works finished in 2018.
Bulk Water Supply Security
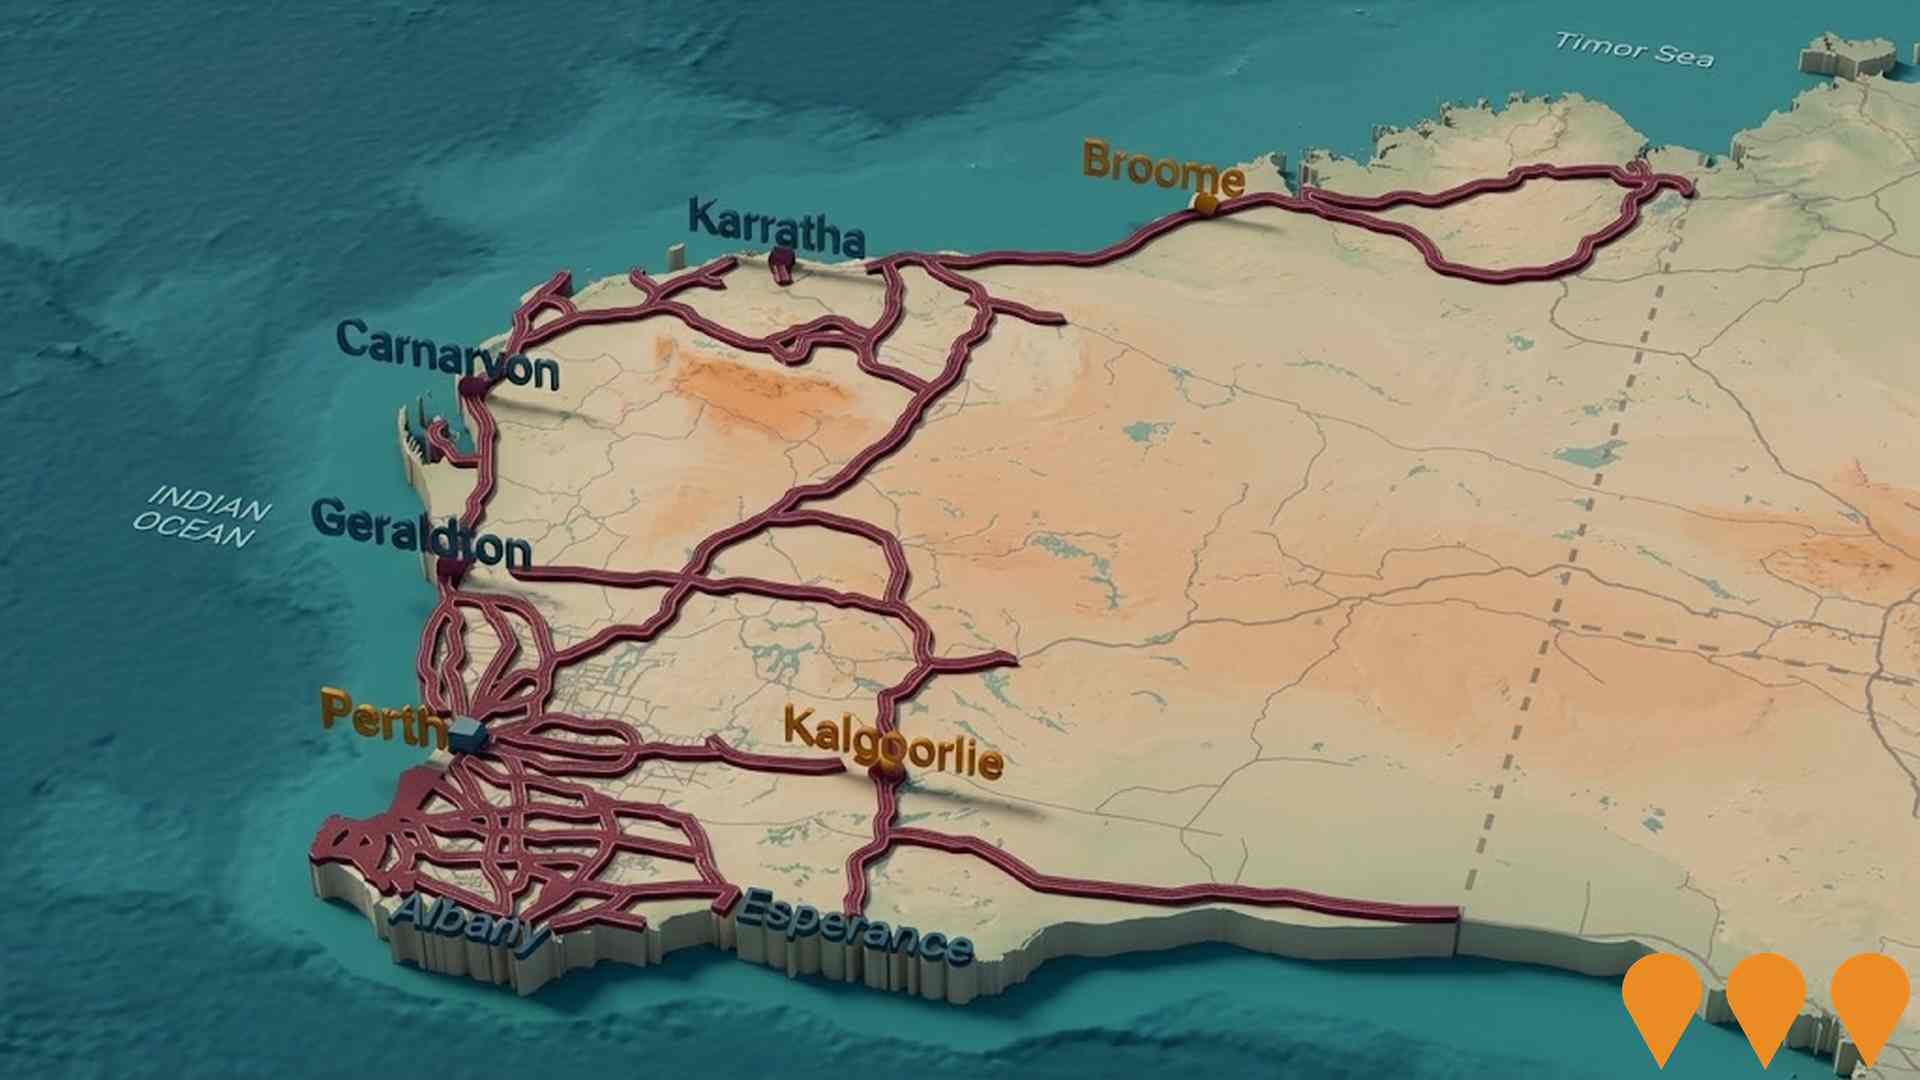
Nationwide program led by the National Water Grid Authority to improve bulk water security and reliability for non-potable and productive uses. Activities include strategic planning, science and business cases, and funding of state and territory projects such as storages, pipelines, dam upgrades, recycled water and efficiency upgrades to build drought resilience and support regional communities, industry and the environment.

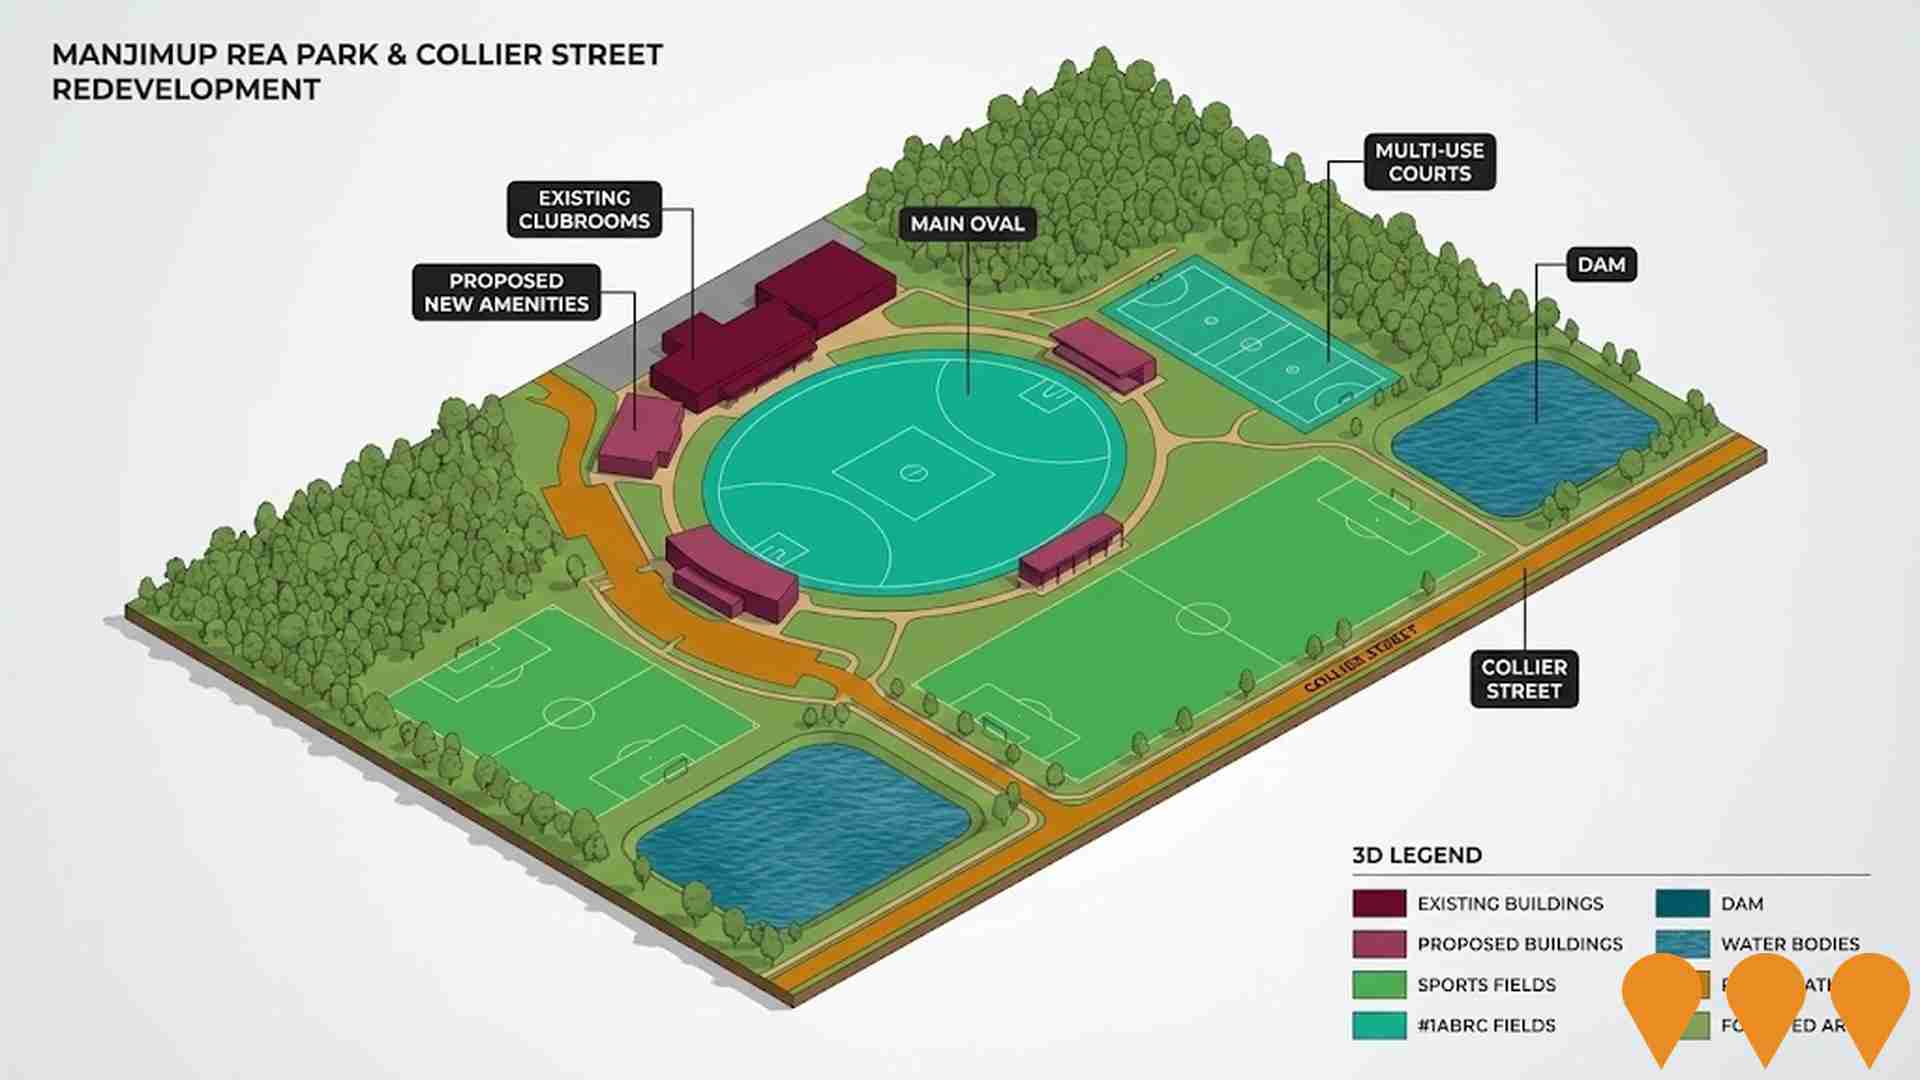
Manjimup Rea Park & Collier Street Redevelopment
Staged renewal of the Rea Park and Collier Street sporting precinct to create a premier multi-sport community facility. Stage 1 (power and LED field lighting) is complete. The Shire is now seeking funding for Stage 2 works including ground upgrades, drainage and amenities.
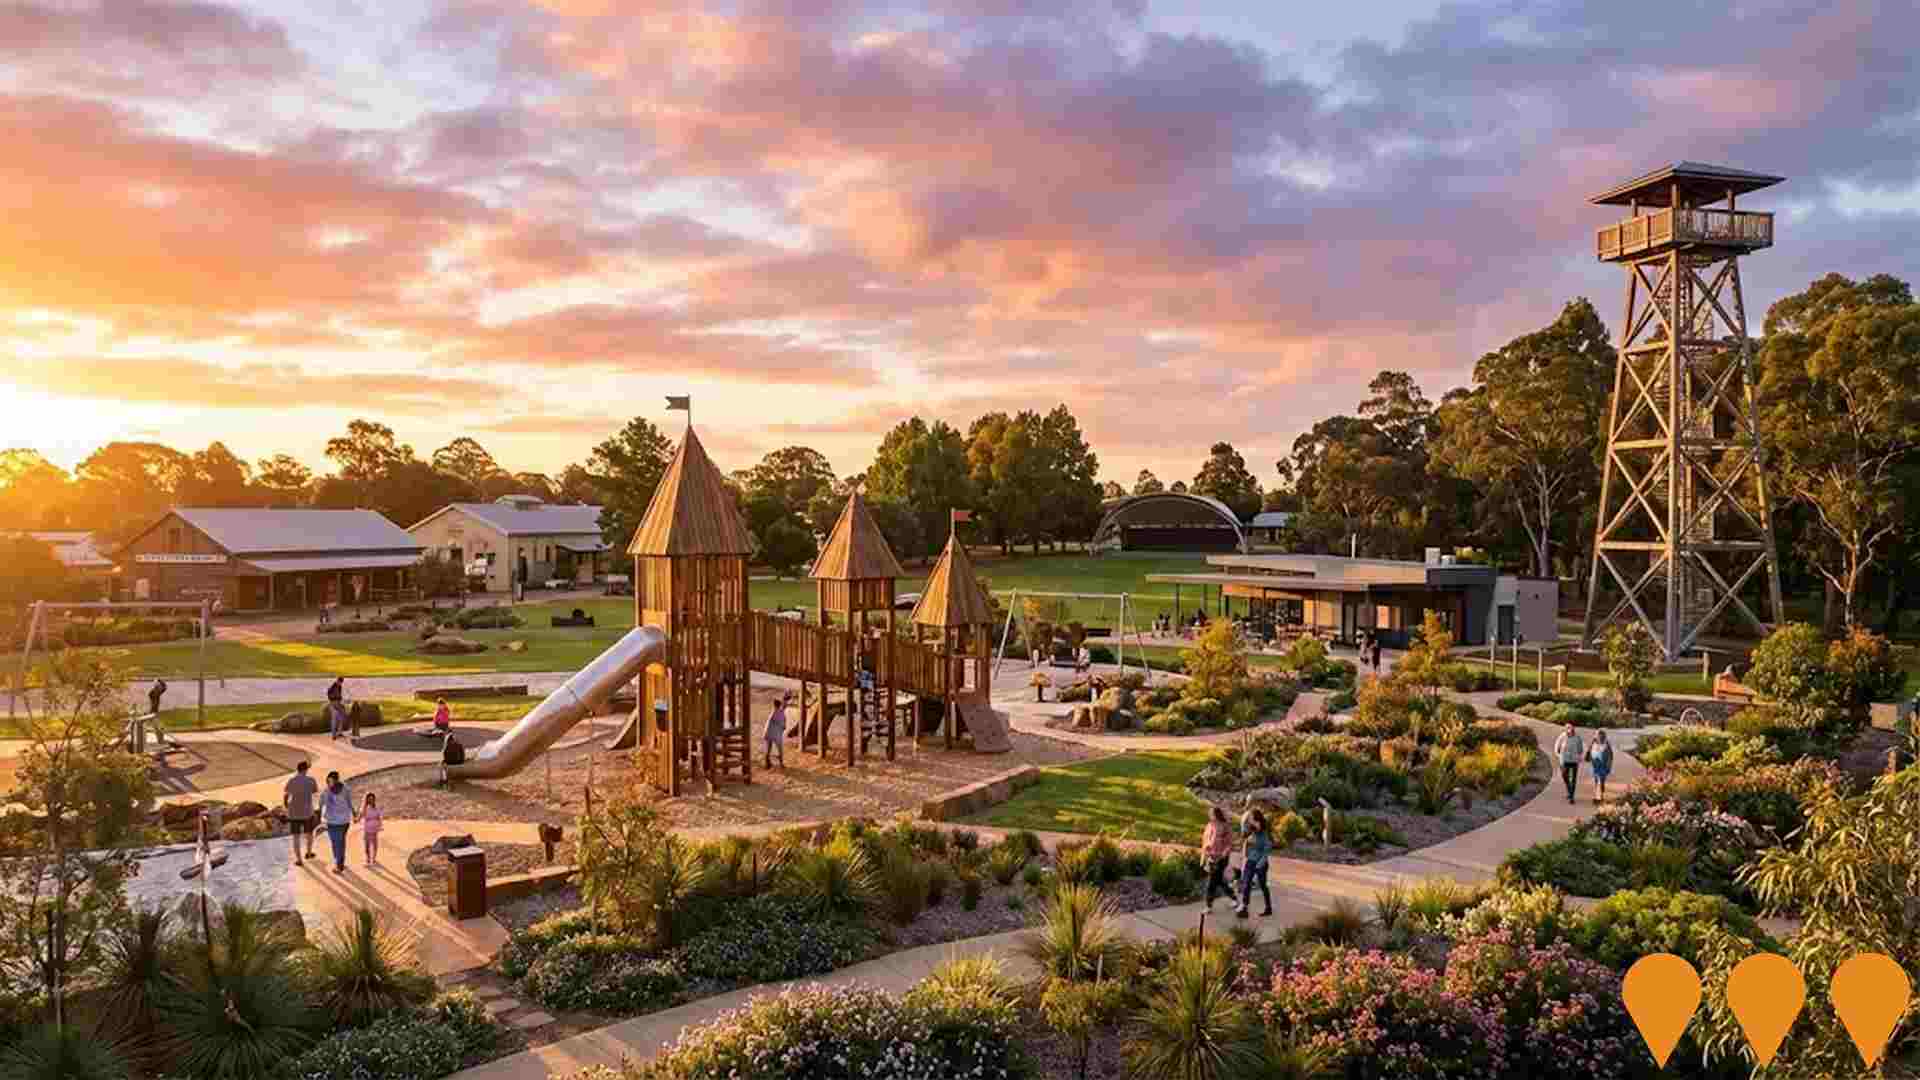
Manjimup Timber and Heritage Park Revitalisation
Revitalisation of the Manjimup Heritage Park as part of the Manjimup Town Centre Revitalisation, delivering refurbished museums (State Timber Museum and Power Up Electricity Museum), new and upgraded park entries, cafe and visitor amenities, extensive landscaping and paths, the Sandra Donovan Sound Shell and a major adventure playground, strengthening the site as a regional tourism and community hub.
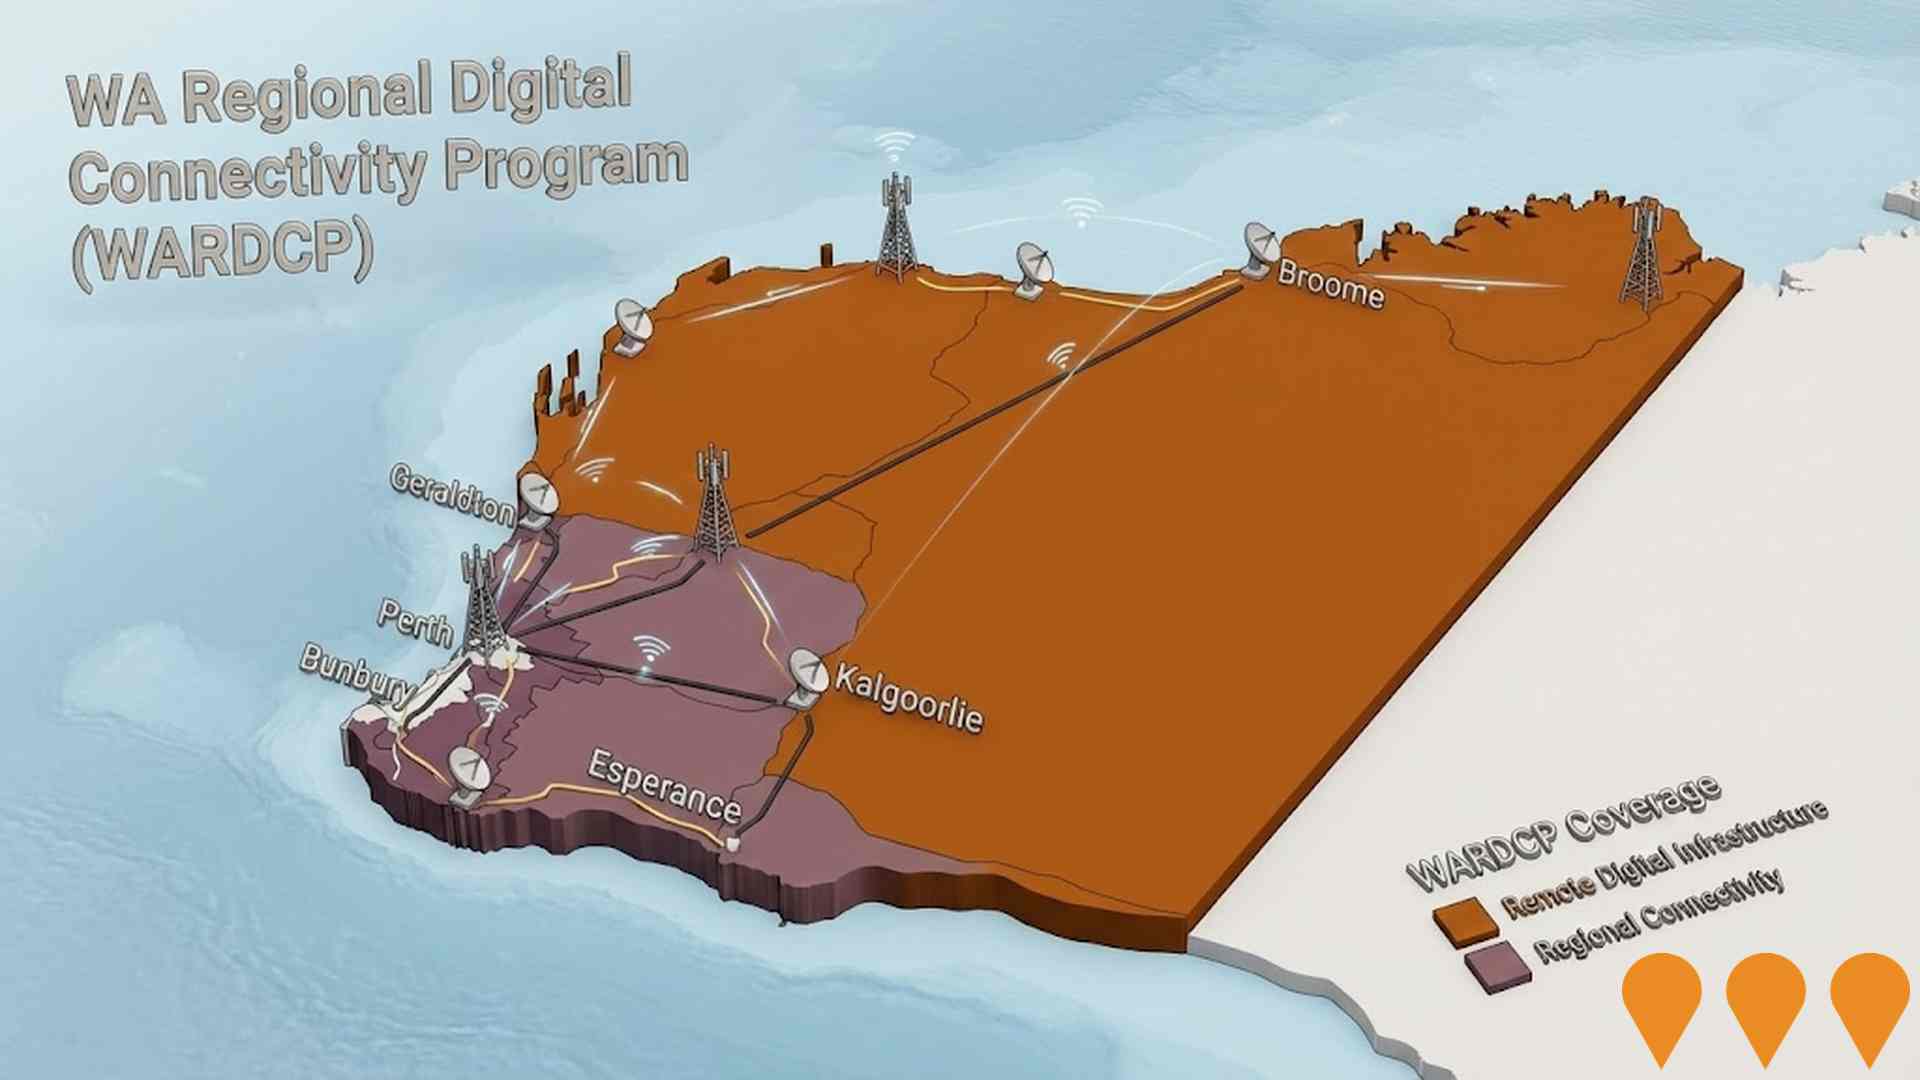
WA Regional Digital Connectivity Program (WARDCP)
Statewide co-investment program delivering new and upgraded mobile, fixed wireless and broadband infrastructure to improve reliability, coverage and performance for regional and remote Western Australia. Current workstreams include the Regional Telecommunications Project, State Agriculture Telecommunications Infrastructure Fund, and the WA Regional Digital Connectivity Program (WARDCP).
Shire of Manjimup Town Blueprints
Community planning program to prepare five new Town Blueprints for Manjimup, Northcliffe, Walpole, Pemberton and Quinninup. The Blueprints will guide land use, infrastructure and economic priorities for the next decade and inform the Shire's new Council Plan.
Manjimup Motel and Restaurant
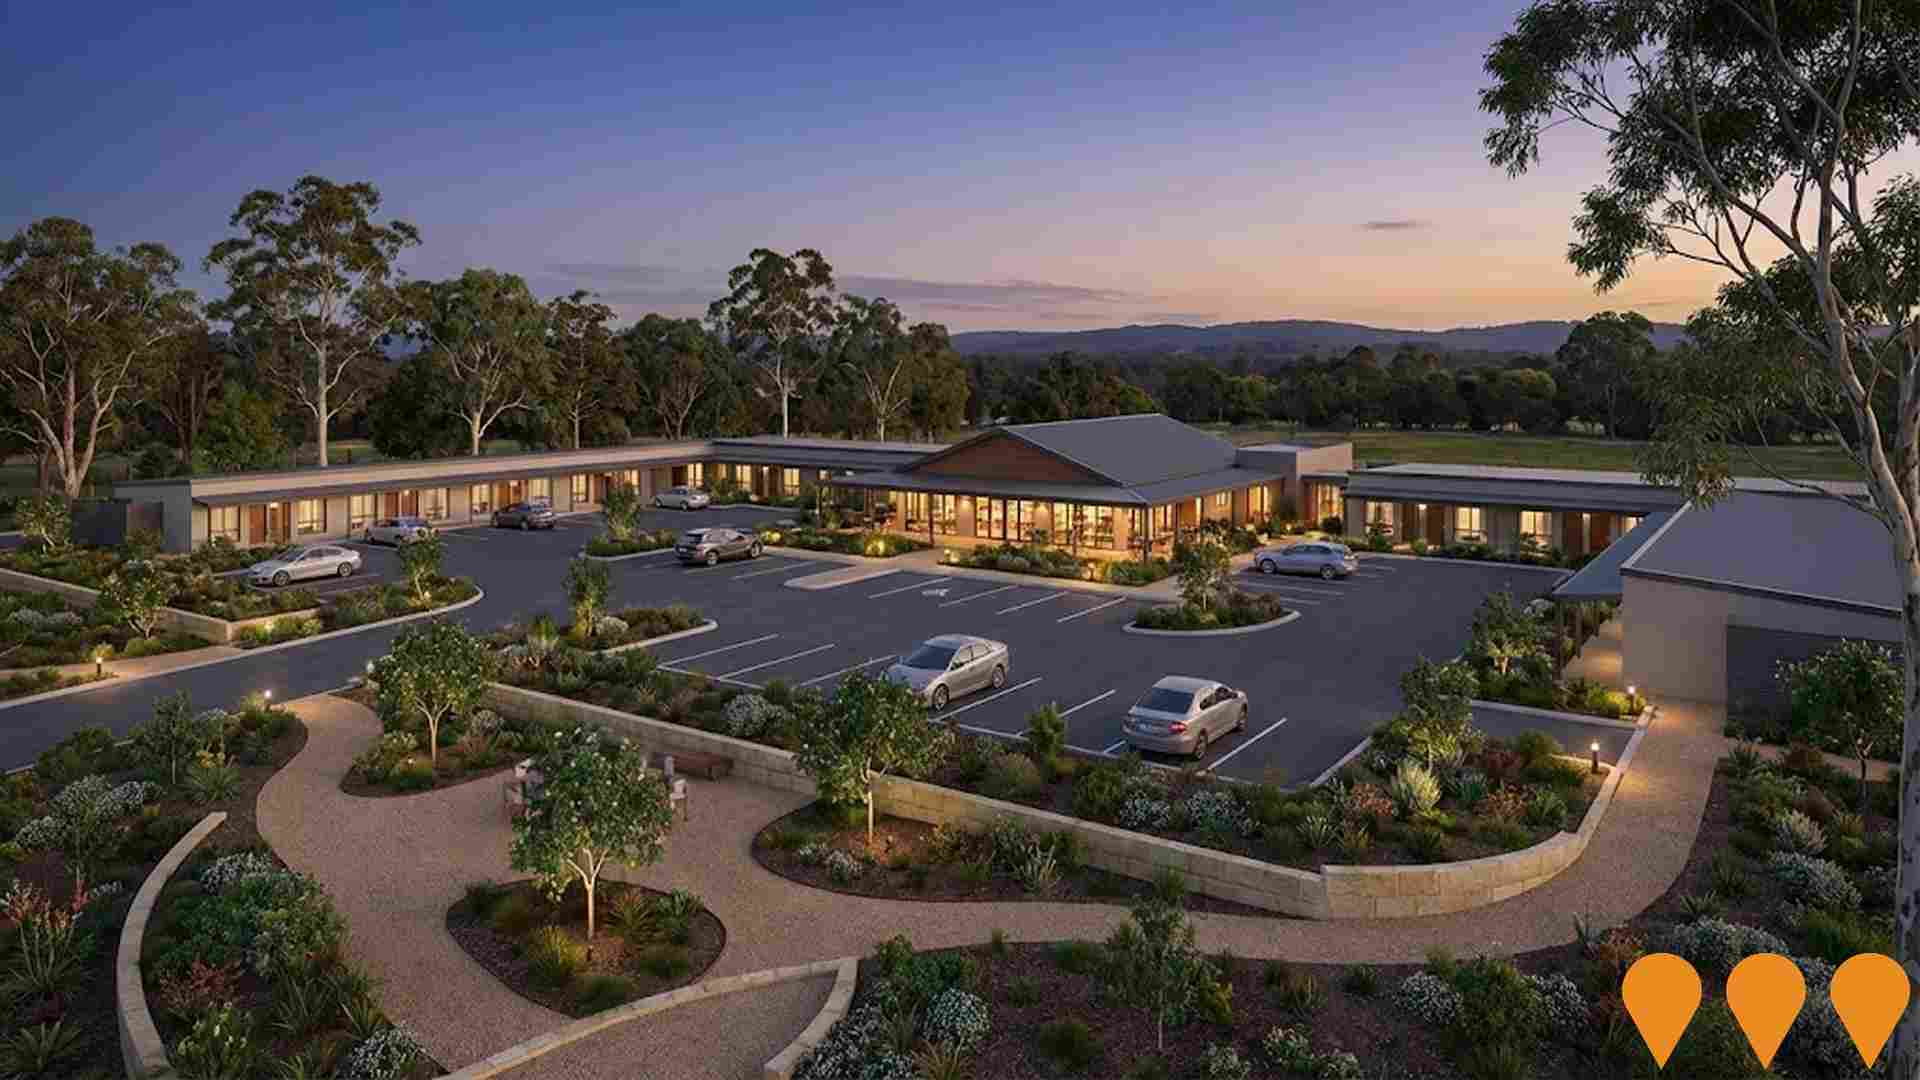
76-room motel with dual-key and accessible rooms, central facilities, meeting rooms and a 58-seat restaurant. Development Assessment Panel granted development approval on 22 Jan 2025 with conditions including parking, landscaping, waste and construction management requirements.
Employment
Employment performance in Manjimup exceeds national averages across key labour market indicators
Manjimup has a balanced workforce with both white and blue collar jobs. The unemployment rate in September 2025 was 3.5%.
Employment grew by 6.1% over the past year. As of that date, 3,093 residents were employed, with an unemployment rate of 3.7%, slightly higher than Rest of WA's 3.3%. Key industries include agriculture, forestry & fishing, retail trade, and health care & social assistance. Agriculture, forestry & fishing is particularly strong, with a share of employment twice the regional level.
Mining, however, is under-represented at 3.0% compared to Rest of WA's 11.7%. Many residents commute elsewhere for work based on census data. Between September 2024 and September 2025, employment levels increased by 6.1%, labour force grew by 5.8%, reducing the unemployment rate by 0.3 percentage points. Rest of WA saw lower growth rates: employment rose by 1.4%, labour force by 1.2%, with a 0.2 percentage point drop in unemployment. Jobs and Skills Australia's national employment forecasts from May-25 suggest future demand trends for Manjimup. National employment is projected to expand by 6.6% over five years and 13.7% over ten years, but growth varies significantly between sectors. Applying these projections to Manjimup's employment mix indicates local employment should increase by approximately 5.2% over five years and 11.4% over ten years.
Frequently Asked Questions - Employment
Income
The area's income levels rank in the lower 15% nationally based on AreaSearch comparative data
AreaSearch's latest postcode level ATO data for financial year 2022 shows that income in Manjimup SA2 is lower than average nationally. The median income is $45,917 and the average is $55,347. This contrasts with Rest of WA where the median income is $57,323 and the average is $71,163. Based on Wage Price Index growth of 14.2% since financial year 2022, current estimates for Manjimup would be approximately $52,437 (median) and $63,206 (average) as of September 2025. Census data reveals that household, family, and personal incomes in Manjimup all fall between the 18th and 27th percentiles nationally. The data shows that 31.6% of the population (1,784 individuals) falls within the $1,500 - $2,999 income range, similar to metropolitan regions where 31.1% occupy this range. After housing costs, 86.1% of income remains, ranking at the 21st percentile nationally.
Frequently Asked Questions - Income
Housing
Manjimup is characterized by a predominantly suburban housing profile, with a higher proportion of rental properties than the broader region
Manjimup's dwelling structures, as per the latest Census, were 89.9% houses and 10.0% other dwellings (semi-detached, apartments, 'other' dwellings), compared to Non-Metro WA's 95.2% houses and 4.9% other dwellings. Home ownership in Manjimup was 34.9%, with mortgaged dwellings at 33.2% and rented ones at 31.9%. The median monthly mortgage repayment was $1,300, lower than Non-Metro WA's average of $1,387. Median weekly rent in Manjimup was $240, compared to Non-Metro WA's $250. Nationally, Manjimup's mortgage repayments were significantly lower at $1,300 versus the Australian average of $1,863, and rents were substantially below the national figure of $375.
Frequently Asked Questions - Housing
Household Composition
Manjimup features high concentrations of lone person households, with a fairly typical median household size
Family households constitute 64.6% of all households, including 24.0% couples with children, 30.0% couples without children, and 9.6% single parent families. Non-family households comprise the remaining 35.4%, with lone person households at 33.2% and group households at 2.2%. The median household size is 2.3 people, which aligns with the average for the Rest of WA.
Frequently Asked Questions - Households
Local Schools & Education
Manjimup faces educational challenges, with performance metrics placing it in the bottom quartile of areas assessed nationally
The area's university qualification rate is 12.0%, significantly lower than the Australian average of 30.4%. Bachelor degrees are most common at 9.1%, followed by postgraduate qualifications (1.6%) and graduate diplomas (1.3%). Vocational credentials are prevalent, with 38.1% of residents aged 15+ holding them, including advanced diplomas (7.1%) and certificates (31.0%). Educational participation is high at 26.1%, comprising primary education (11.0%), secondary education (8.9%), and tertiary education (1.1%).
Educational participation is notably high, with 26.1% of residents currently enrolled in formal education. This includes 11.0% in primary education, 8.9% in secondary education, and 1.1% pursuing tertiary education.
Frequently Asked Questions - Education
Schools Detail
Nearby Services & Amenities
Transport
Transport servicing is very low compared to other areas nationally based on assessment of service frequency, route connectivity and accessibility
Manjimup has one active public transport stop operating within its boundaries, serving a mix of bus routes. This stop is serviced by three individual routes that collectively provide 24 weekly passenger trips. Transport accessibility in Manjimup is limited, with residents typically located 1470 meters from the nearest transport stop.
Service frequency averages three trips per day across all routes, equating to approximately 24 weekly trips per individual stop.
Frequently Asked Questions - Transport
Transport Stops Detail
Health
Health performance in Manjimup is lower than average with common health conditions somewhat prevalent across both younger and older age cohorts
Manjimup faces significant health challenges with common health conditions prevalent across both younger and older age cohorts. The rate of private health cover is very low at approximately 48% of the total population (~2,687 people), compared to 49.8% across Rest of WA and the national average of 55.3%. The most common medical conditions in the area are arthritis and mental health issues, impacting 9.7 and 9.5% of residents respectively, while 64.7% declared themselves completely clear of medical ailments compared to 65.4% across Rest of WA.
The area has 20.0% of residents aged 65 and over (1,126 people), which is lower than the 23.0% in Rest of WA. Health outcomes among seniors are above average, performing even better than the general population in health metrics.
Frequently Asked Questions - Health
Cultural Diversity
Manjimup ranks below the Australian average when compared to other local markets across a number of language and cultural background related metrics
Manjimup, as per the census data from June 2016, showed lower cultural diversity with 89.0% of its population being Australian citizens, 85.6% born in Australia, and 93.1% speaking English only at home. Christianity was the predominant religion, accounting for 43.2% of Manjimup's population. Islam, however, was overrepresented with 1.5%, compared to the Rest of WA's 0.6%.
In terms of ancestry, the top three groups were English (34.2%), Australian (29.0%), and Scottish (7.7%). Notably, Macedonian (1.9%) Italian (5.7%), and Croatian (0.6%) ethnicities were overrepresented compared to regional averages of 0.6%, 4.3%, and 0.3% respectively.
Frequently Asked Questions - Diversity
Age
Manjimup's median age exceeds the national pattern
The median age in Manjimup is 43 years, which is slightly higher than Rest of WA's average of 40 years, and well above Australia's median age of 38 years. The 55-64 age cohort is notably over-represented in Manjimup at 14.7%, compared to the Rest of WA average. Conversely, the 35-44 age group is under-represented at 12.2%. According to the 2021 Census, the 35-44 age group has increased from 11.0% to 12.2%, while the 75-84 cohort has decreased from 6.6% to 6.0%. Population forecasts for 2041 indicate significant demographic changes in Manjimup, with the 25-34 age group projected to expand by 303 people (48%) from 633 to 937. Meanwhile, the 75-84 and 55-64 cohorts are expected to experience population declines.
