Chart Color Schemes
This analysis uses ABS Statistical Areas Level 2 (SA2) boundaries, which can materially differ from Suburbs and Localities (SAL) even when sharing similar names.
SA2 boundaries are defined by the Australian Bureau of Statistics and are designed to represent communities for statistical reporting (e.g., census and ERP).
Suburbs and Localities (SAL) represent commonly-used suburb/locality names (postal-style areas) and may use different geographic boundaries. For comprehensive analysis, consider reviewing both boundary types if available.
est. as @ -- *
ABS ERP | -- people | --
2021 Census | -- people
Sales Activity
Curious about local property values? Filter the chart to assess the volume and appreciation (including resales) trends and regional comparisons, or scroll to the map below view this information at an individual property level.
Find a Recent Sale
Sales Detail
Population
Dardanup has seen population growth performance typically on par with national averages when looking at short and medium term trends
Dardanup's population is approximately 3,715 as of November 2025. This figure represents a growth of 429 people (13.1%) since the 2021 Census, which reported a population of 3,286. The increase is inferred from an estimated resident population of 3,630 in June 2024 and 111 additional validated new addresses since the Census date. This results in a population density ratio of 7.2 persons per square kilometer. Dardanup's growth rate exceeds the national average (8.9%) and its SA3 area, indicating it is a region leader in population growth. Interstate migration contributed approximately 65.6% to overall population gains during recent periods, with natural growth and overseas migration also being positive factors.
AreaSearch uses ABS/Geoscience Australia projections for each SA2 area, released in 2024 with a base year of 2022. For areas not covered by this data, AreaSearch utilises growth rates by age cohort provided by the ABS in its latest Greater Capital Region projections (released in 2023, based on 2022 data). Future population trends project an above median growth for non-metropolitan areas nationally, with Dardanup expected to expand by 492 persons to 2041, reflecting a total gain of 11.0% over the 17 years.
Frequently Asked Questions - Population
Development
AreaSearch assessment of residential approval activity sees Dardanup among the top 30% of areas assessed nationwide
Dardanup has seen approximately 33 new homes approved each year. Over the past five financial years, from FY21 to FY25, a total of 167 homes were approved, with an additional 14 approved so far in FY26. On average, about 2.3 people have moved to the area per new home constructed over these five years, reflecting strong demand that supports property values.
New homes are being built at an average expected construction cost of $305,000. This year alone, there has been $5.7 million in commercial approvals, indicating the area's primarily residential nature. Compared to the rest of WA, Dardanup shows 67.0% higher construction activity per person. However, construction activity has eased recently.
All recent building activity consists of detached houses, maintaining the area's traditional low density character and appealing to those seeking space for families. The location currently has approximately 156 people per dwelling approval, suggesting an expanding market. According to AreaSearch's latest quarterly estimate, Dardanup is forecasted to gain 407 residents by 2041. At current development rates, new housing supply should comfortably meet demand, providing good conditions for buyers and potentially supporting population growth beyond current projections.
Frequently Asked Questions - Development
Infrastructure
Dardanup has limited levels of nearby infrastructure activity, ranking in the 5thth percentile nationally
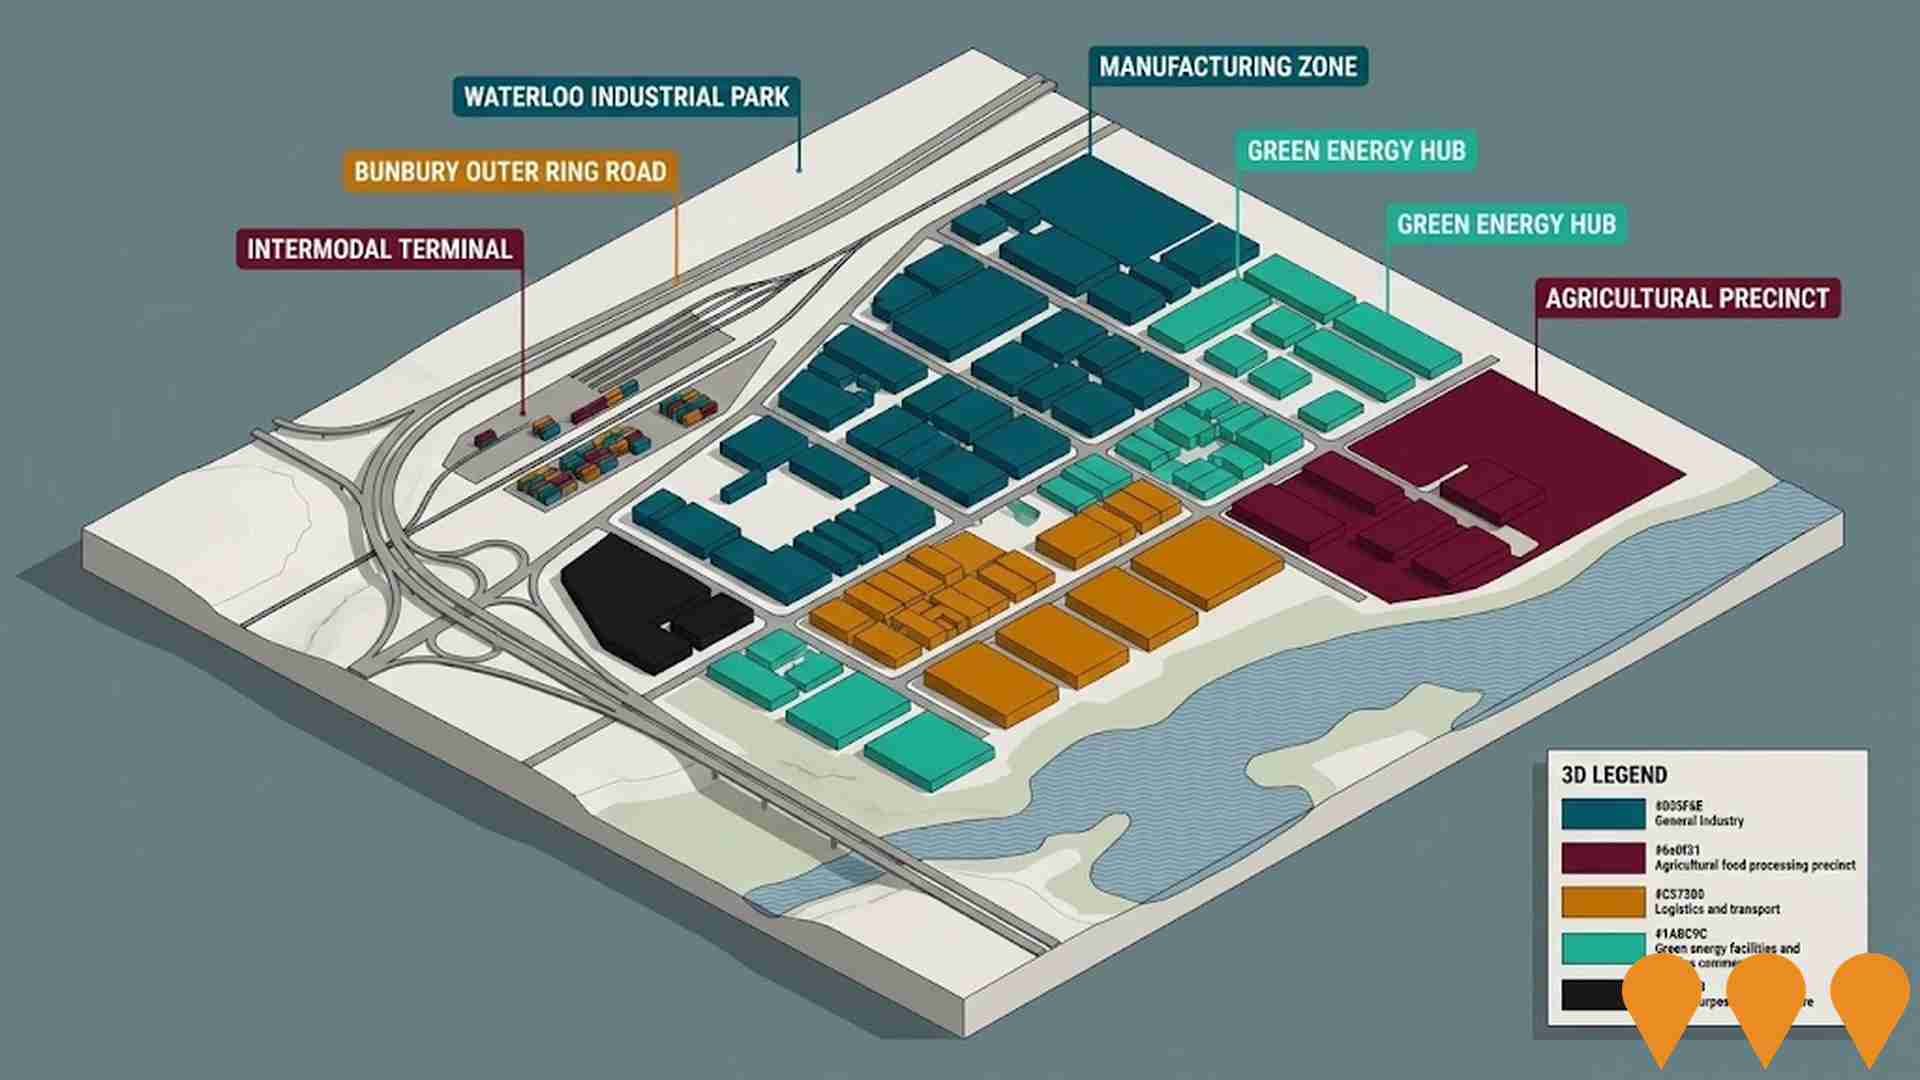
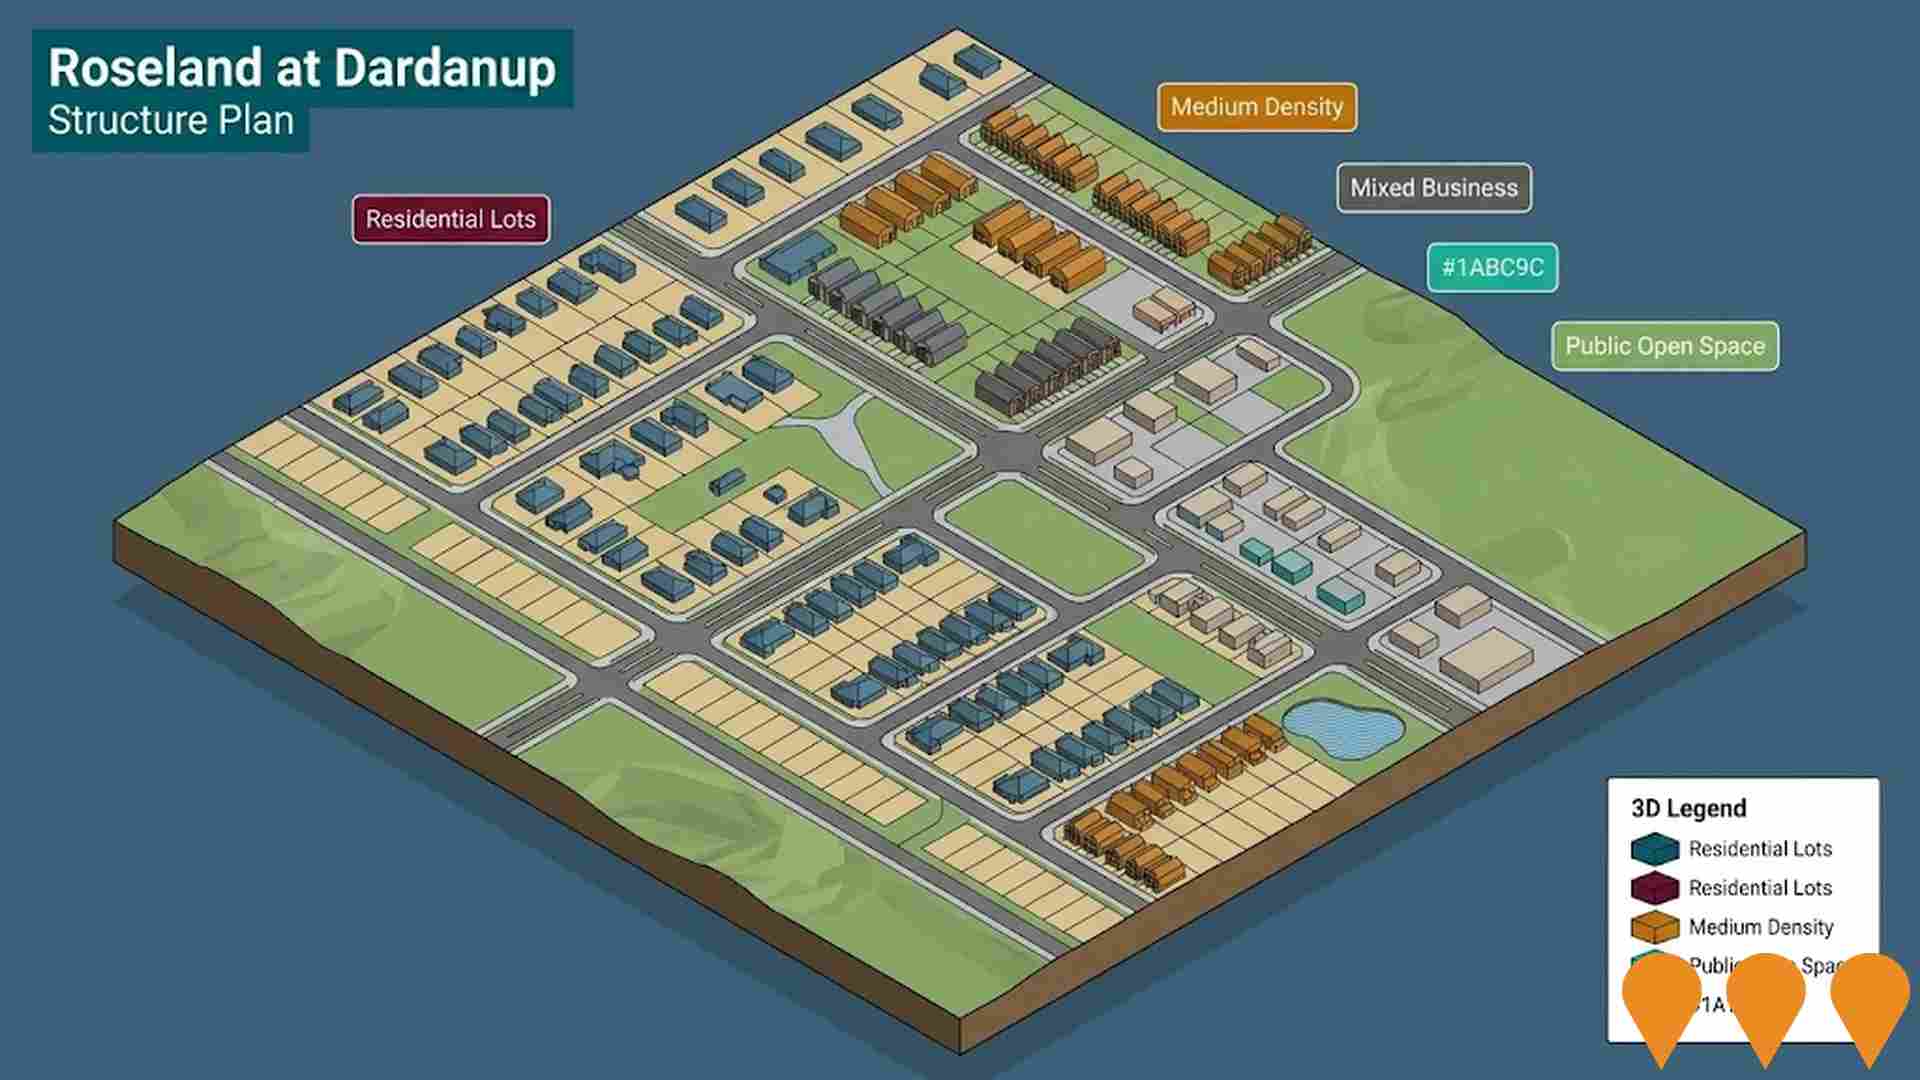
Changes to local infrastructure significantly impact an area's performance. AreaSearch identified 20 projects likely affecting the region. Notable initiatives include Bunbury-Dardanup Housing Infrastructure in Wanju & Waterloo, Picton Enterprise Park Development, Waterloo Industrial Park, and Roseland at Dardanup. The following list details those expected to be most relevant.
Professional plan users can use the search below to filter and access additional projects.
INFRASTRUCTURE SEARCH
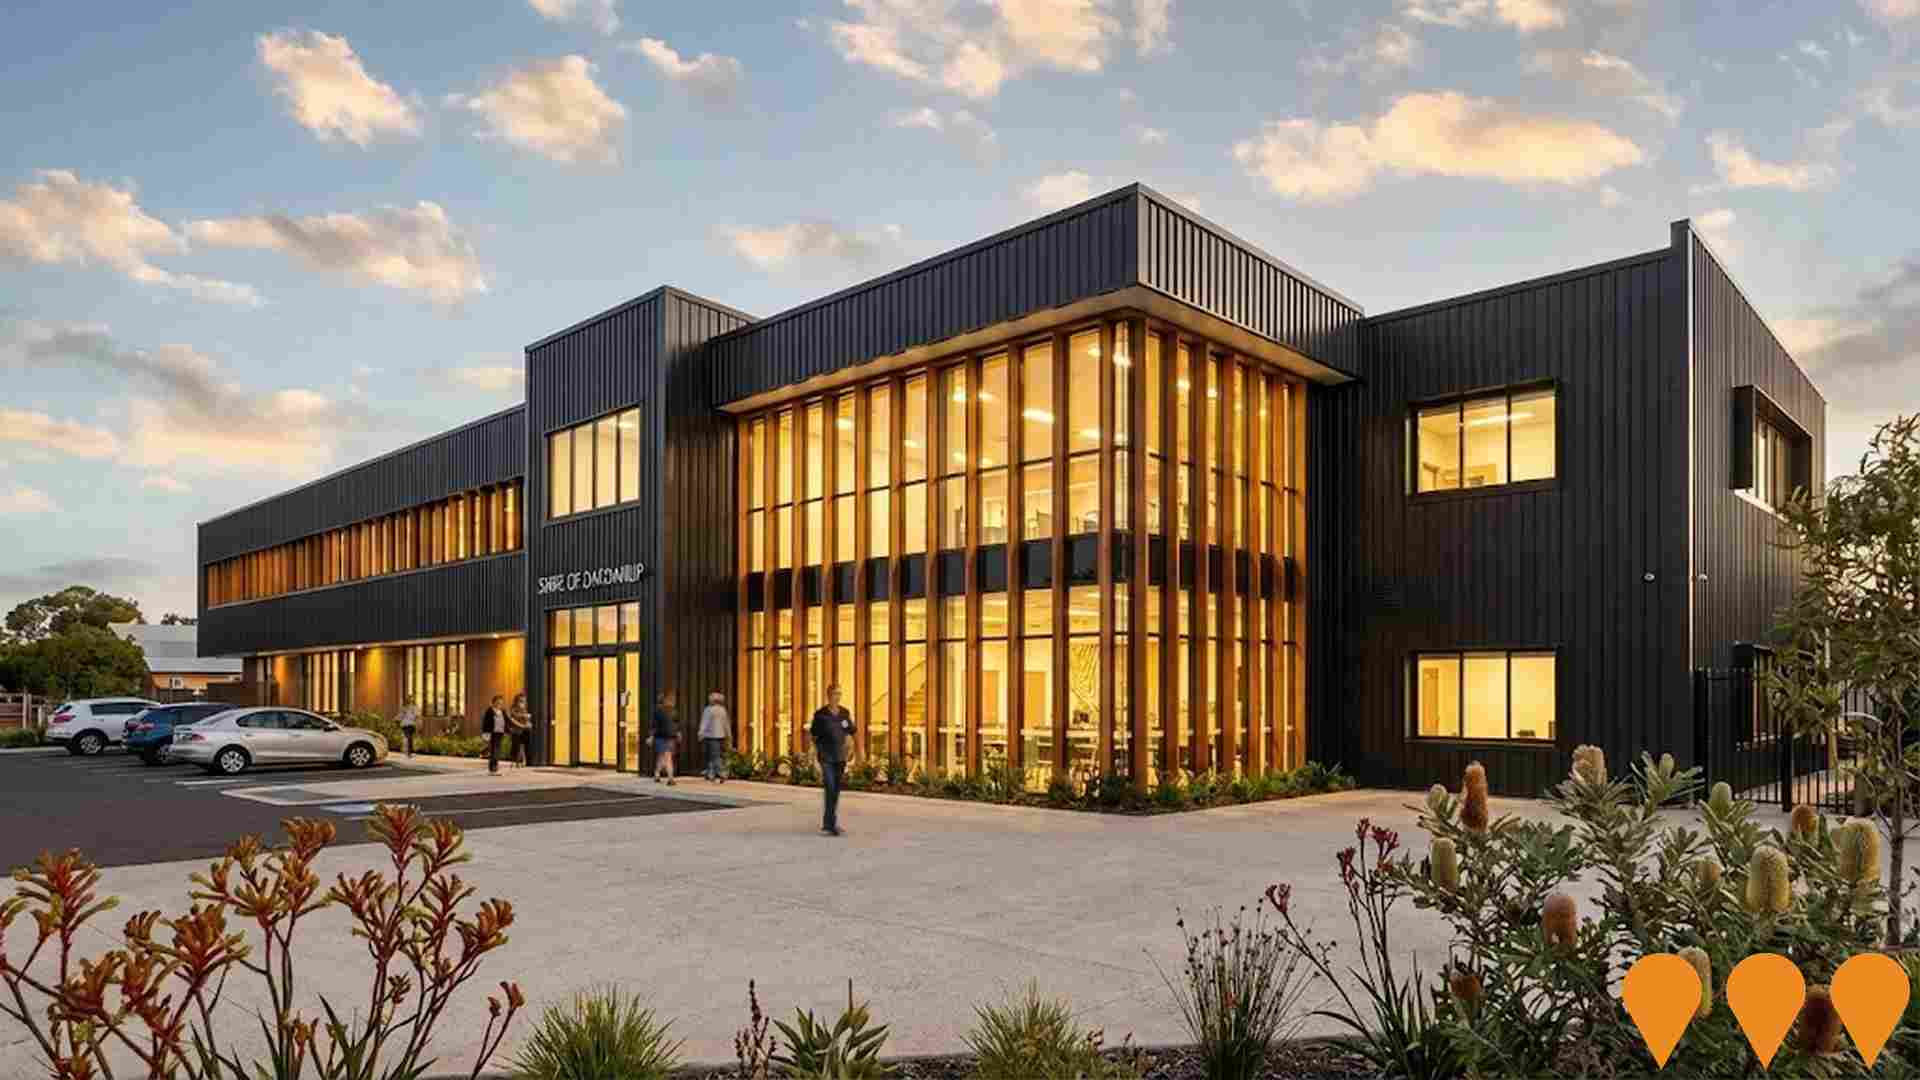
 Denotes AI-based impression for illustrative purposes only, not to be taken as definitive under any circumstances. Please follow links and conduct other investigations from the project's source for actual imagery. Developers and project owners wishing us to use original imagery please Contact Us and we will do so.
Frequently Asked Questions - Infrastructure
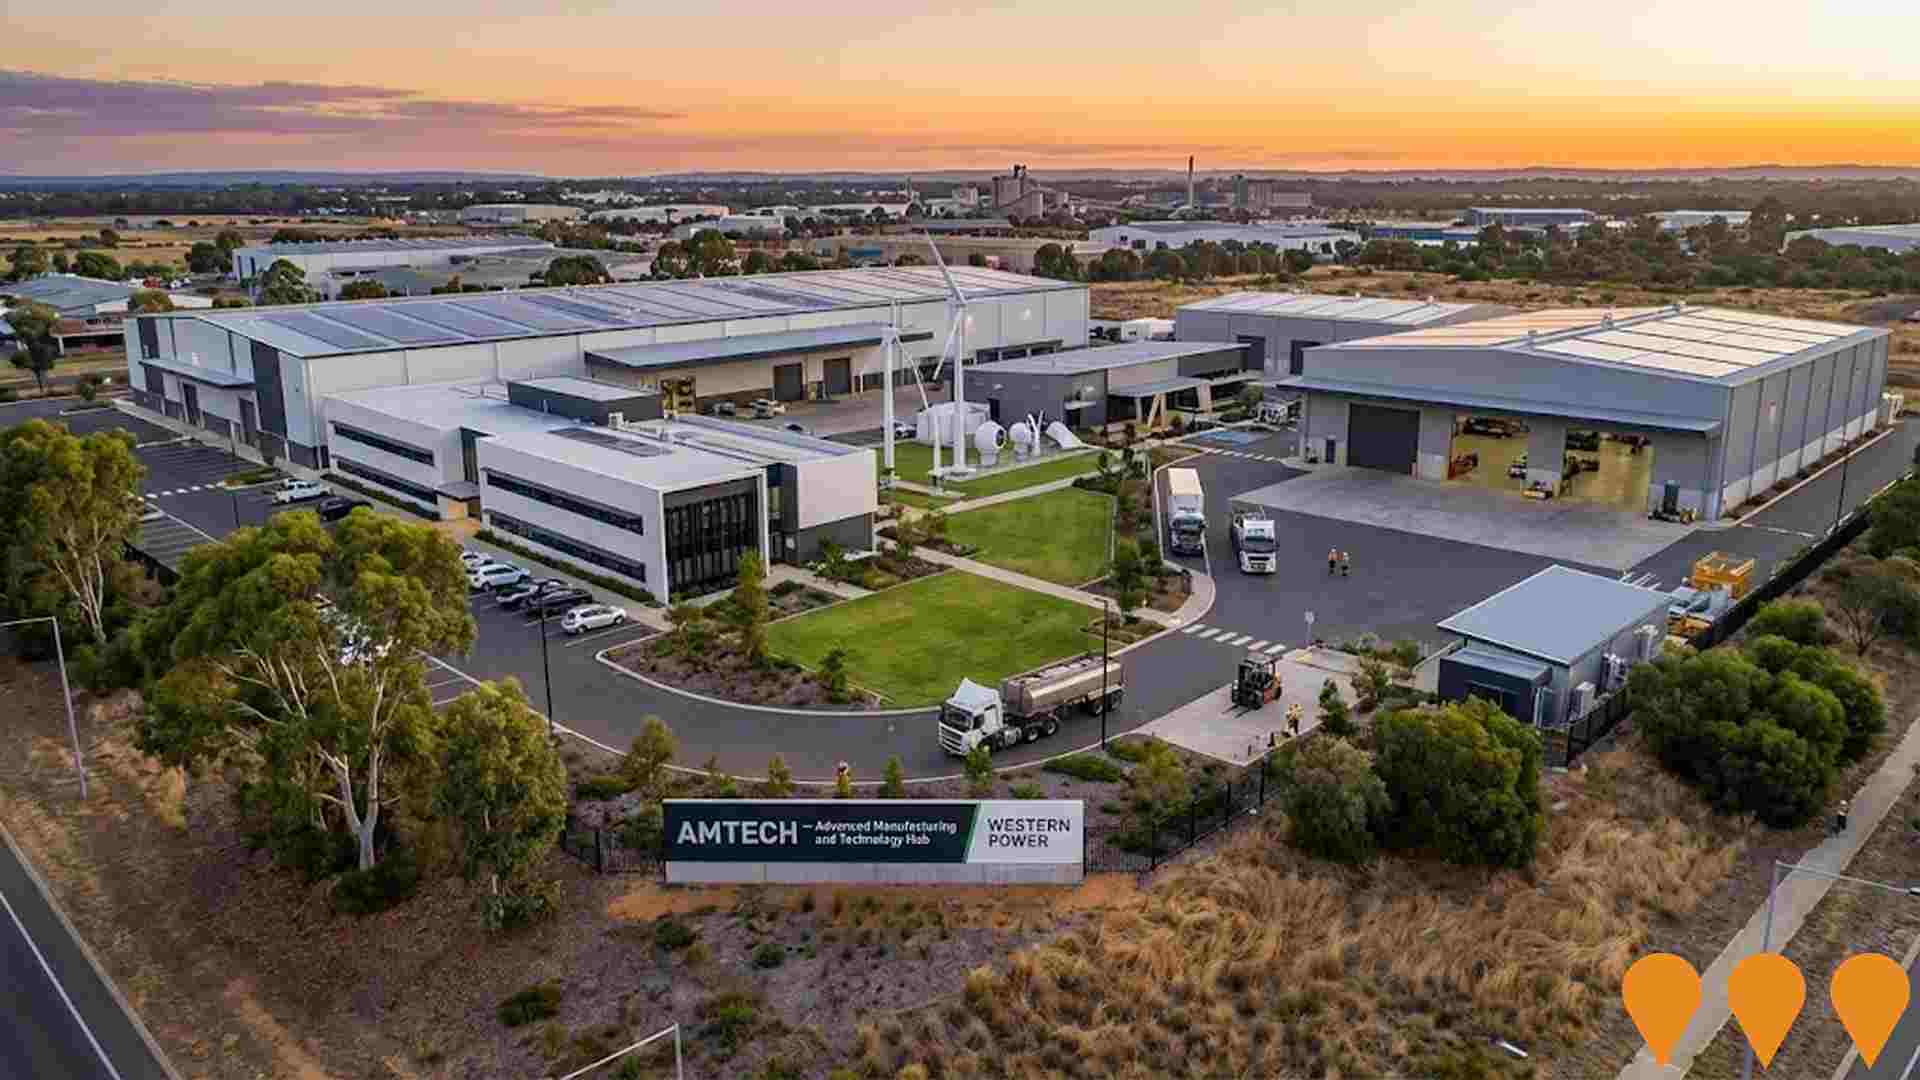
Advanced Manufacturing and Technology Hub (AMTECH)
Western Australia's first dedicated advanced manufacturing, technology and renewables hub in the Picton Industrial Area, Bunbury. Anchored by Western Power, the precinct supports renewable energy manufacturing, critical minerals processing, battery supply chains and defence industries with shared infrastructure, an Industry Development and Skills Centre (IDSC), research facilities and training programs.
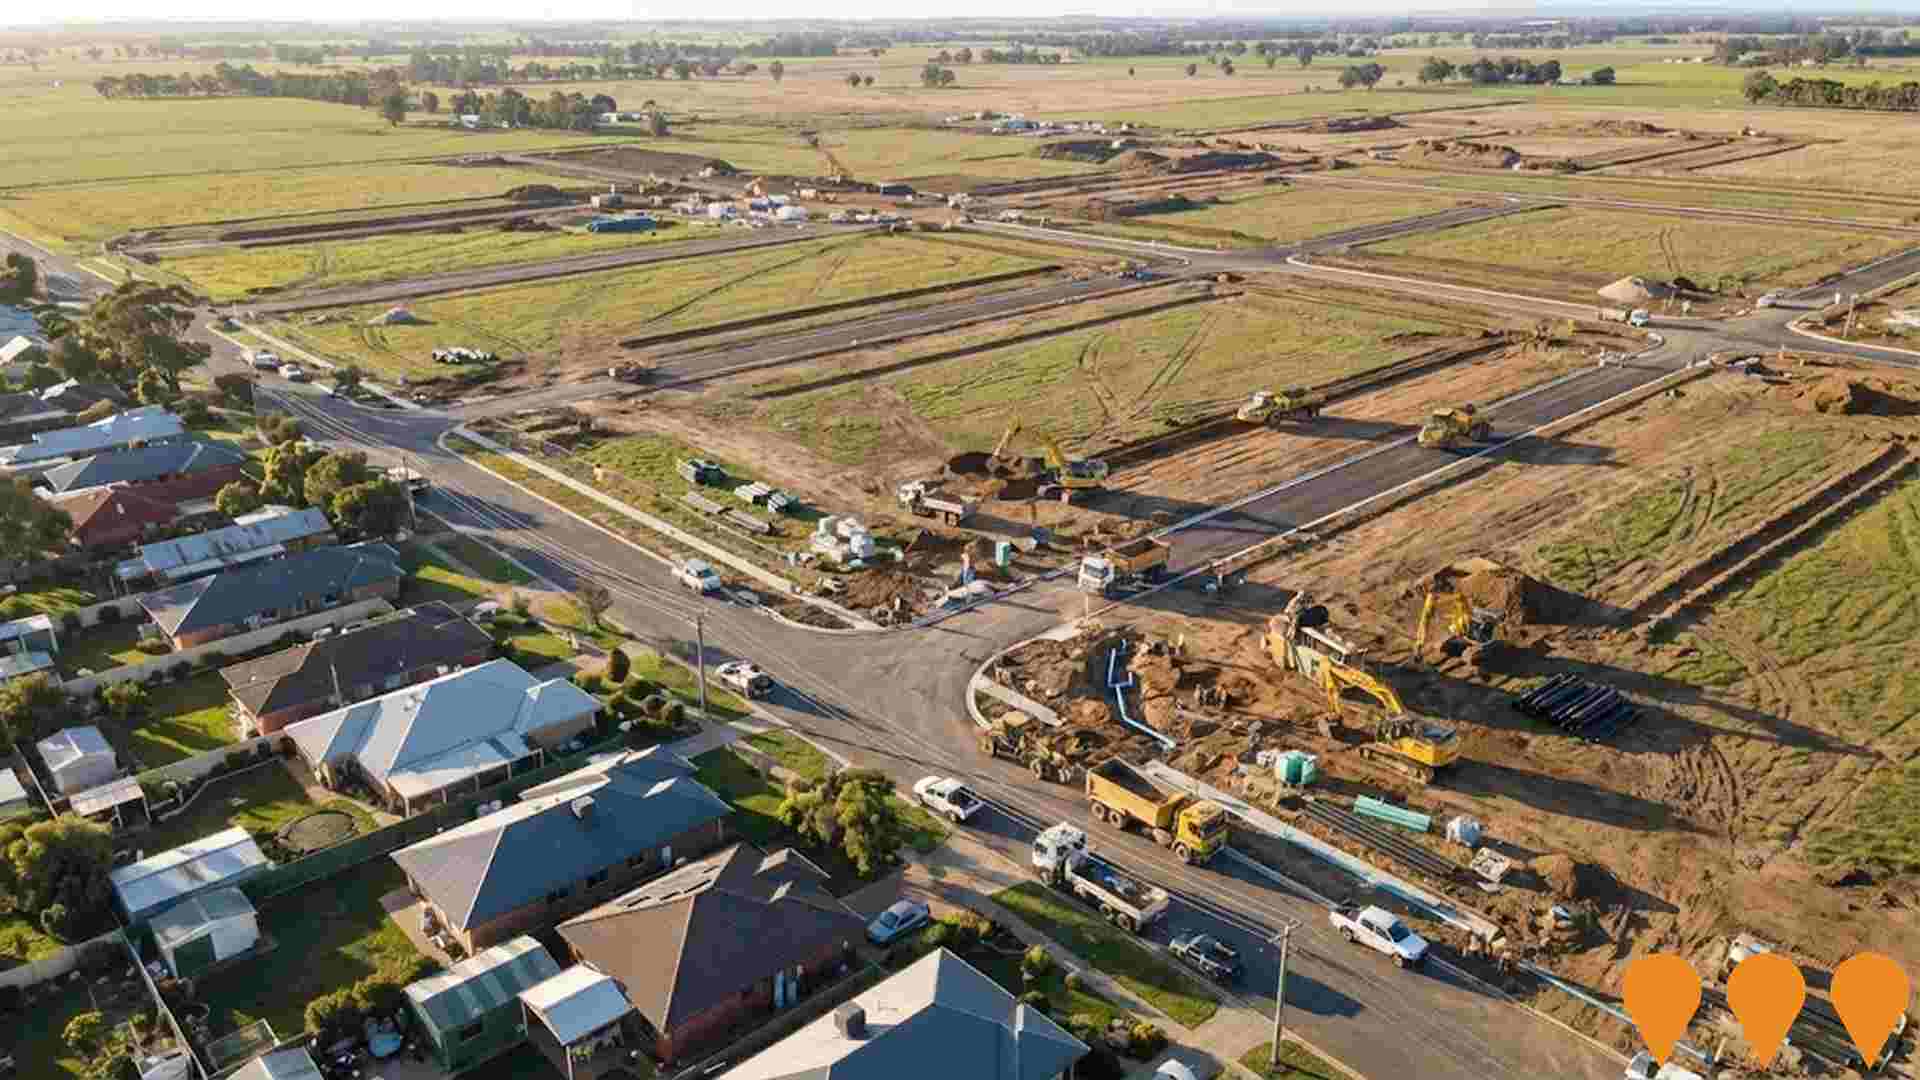
Bunbury-Dardanup Housing Infrastructure (Wanju & Waterloo)
Major enabling infrastructure works to support the new city of Wanju and Dardanup townsite expansion, set to deliver over 3,000 new residential lots. The project includes water, wastewater, and road upgrades, supported by a $7.3 million Federal and State Government investment via the Housing Support Program. The broader Wanju development is planned to accommodate up to 20,000 homes and 60,000 people over the long term, with the District Structure Plan currently undergoing amendment.
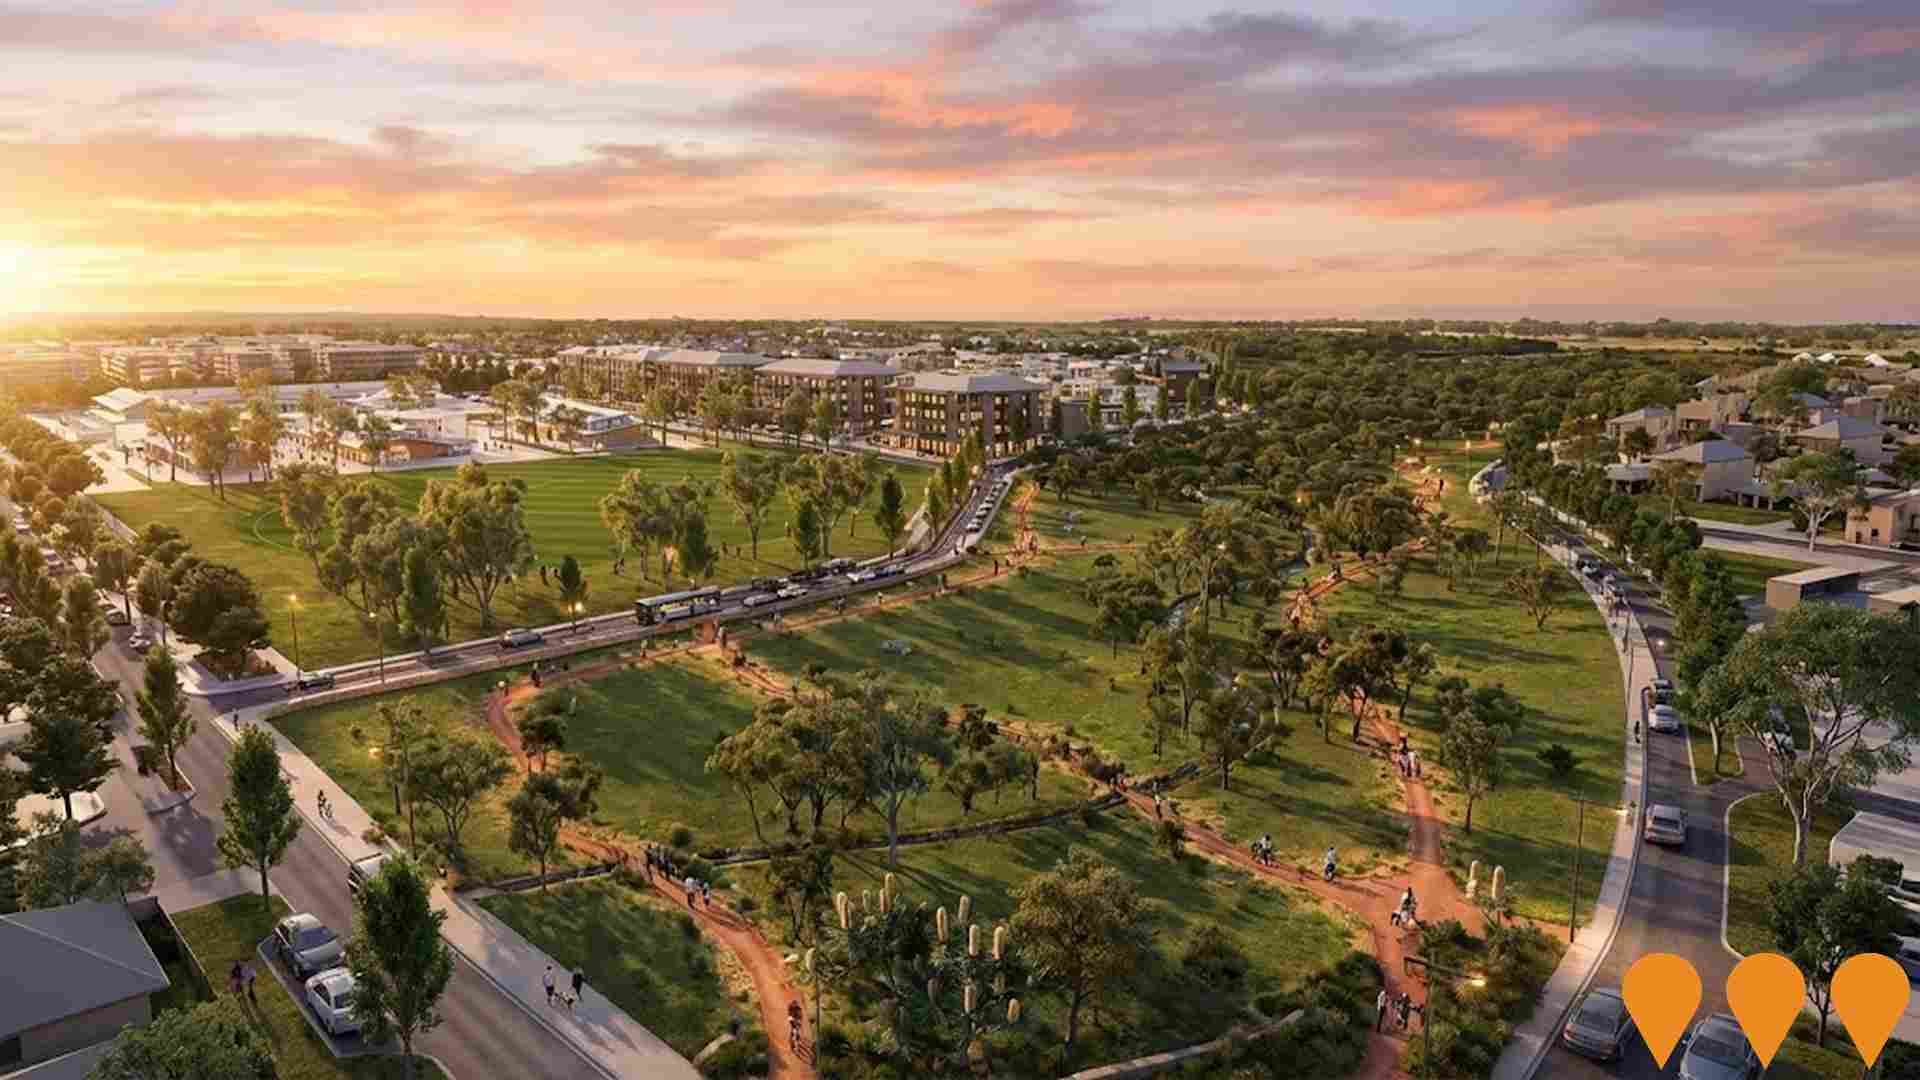
Wanju New City Development
A major satellite city development designed to accommodate regional population growth in the Greater Bunbury region. The masterplanned project will deliver approximately 20,000 homes for 60,000 people across 1,245 hectares. Key features include a new city centre, sustainable urban design, a hospital precinct, schools, and significant commercial and retail space, integrated with the nearby Waterloo Industrial Park.
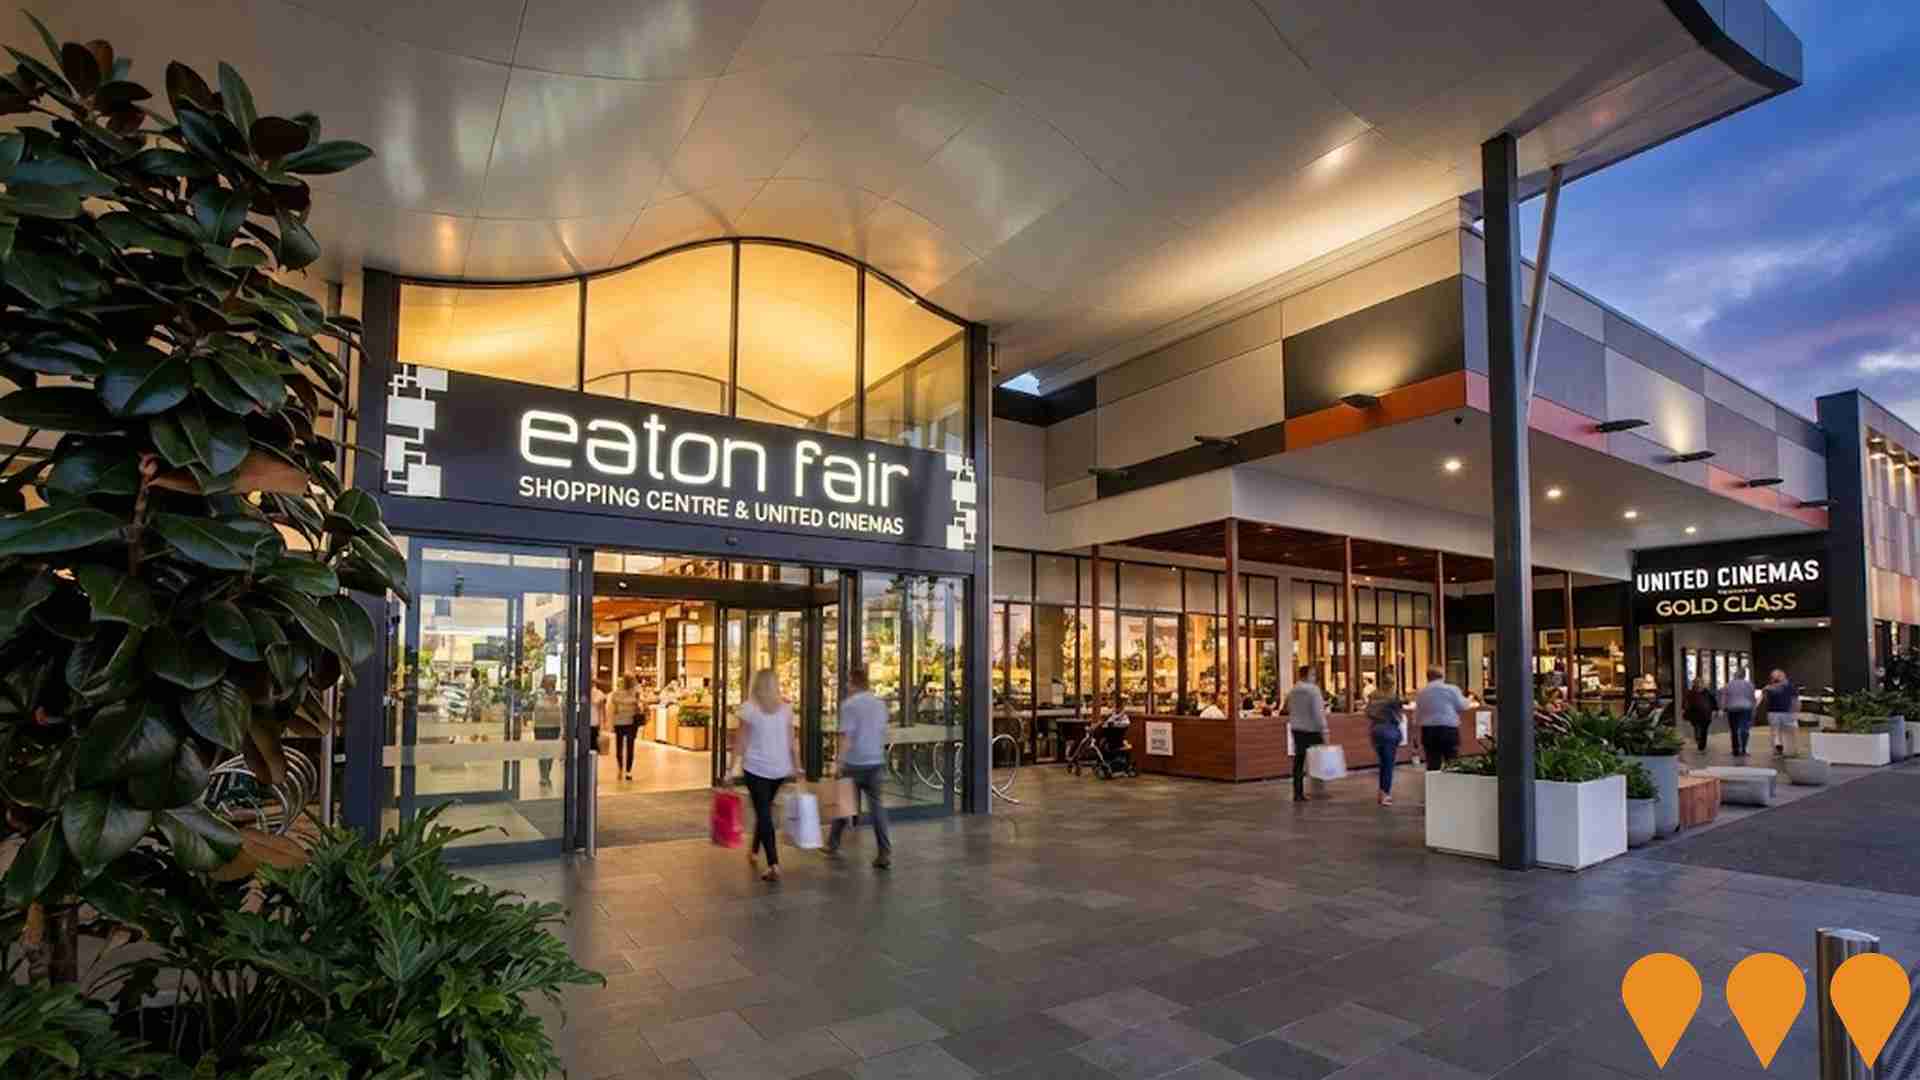
Eaton Fair Shopping Centre Expansion
Major expansion of the Eaton Fair Shopping Centre including 10,000sqm of additional retail space, an 8-screen United Cinemas complex with gold class features, new food and entertainment precinct with gym, and 26 residential dwellings to create a vibrant town centre and leisure destination.
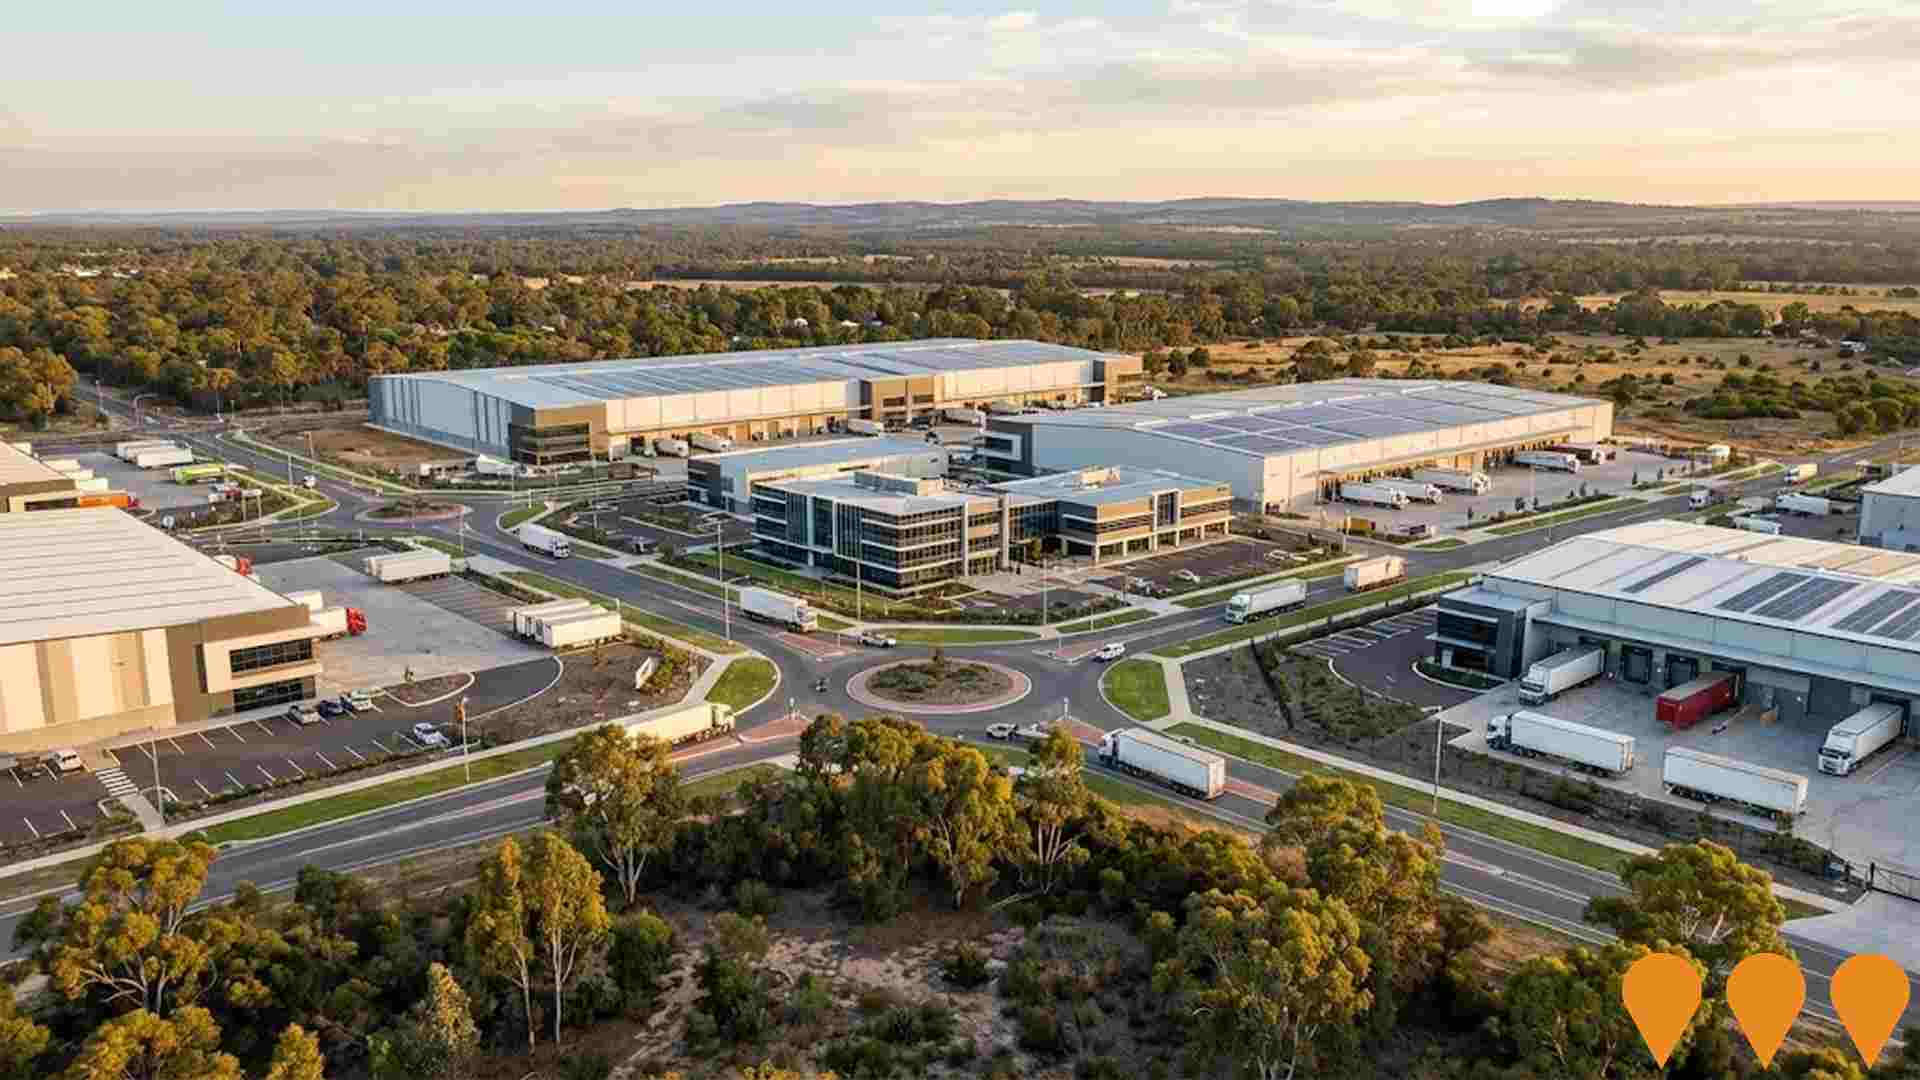
Picton Enterprise Park Development
Development of industrial and business park facilities in Picton to support commercial and light industrial activities. The project includes infrastructure for business operations, logistics, and technology-based enterprises in the region.
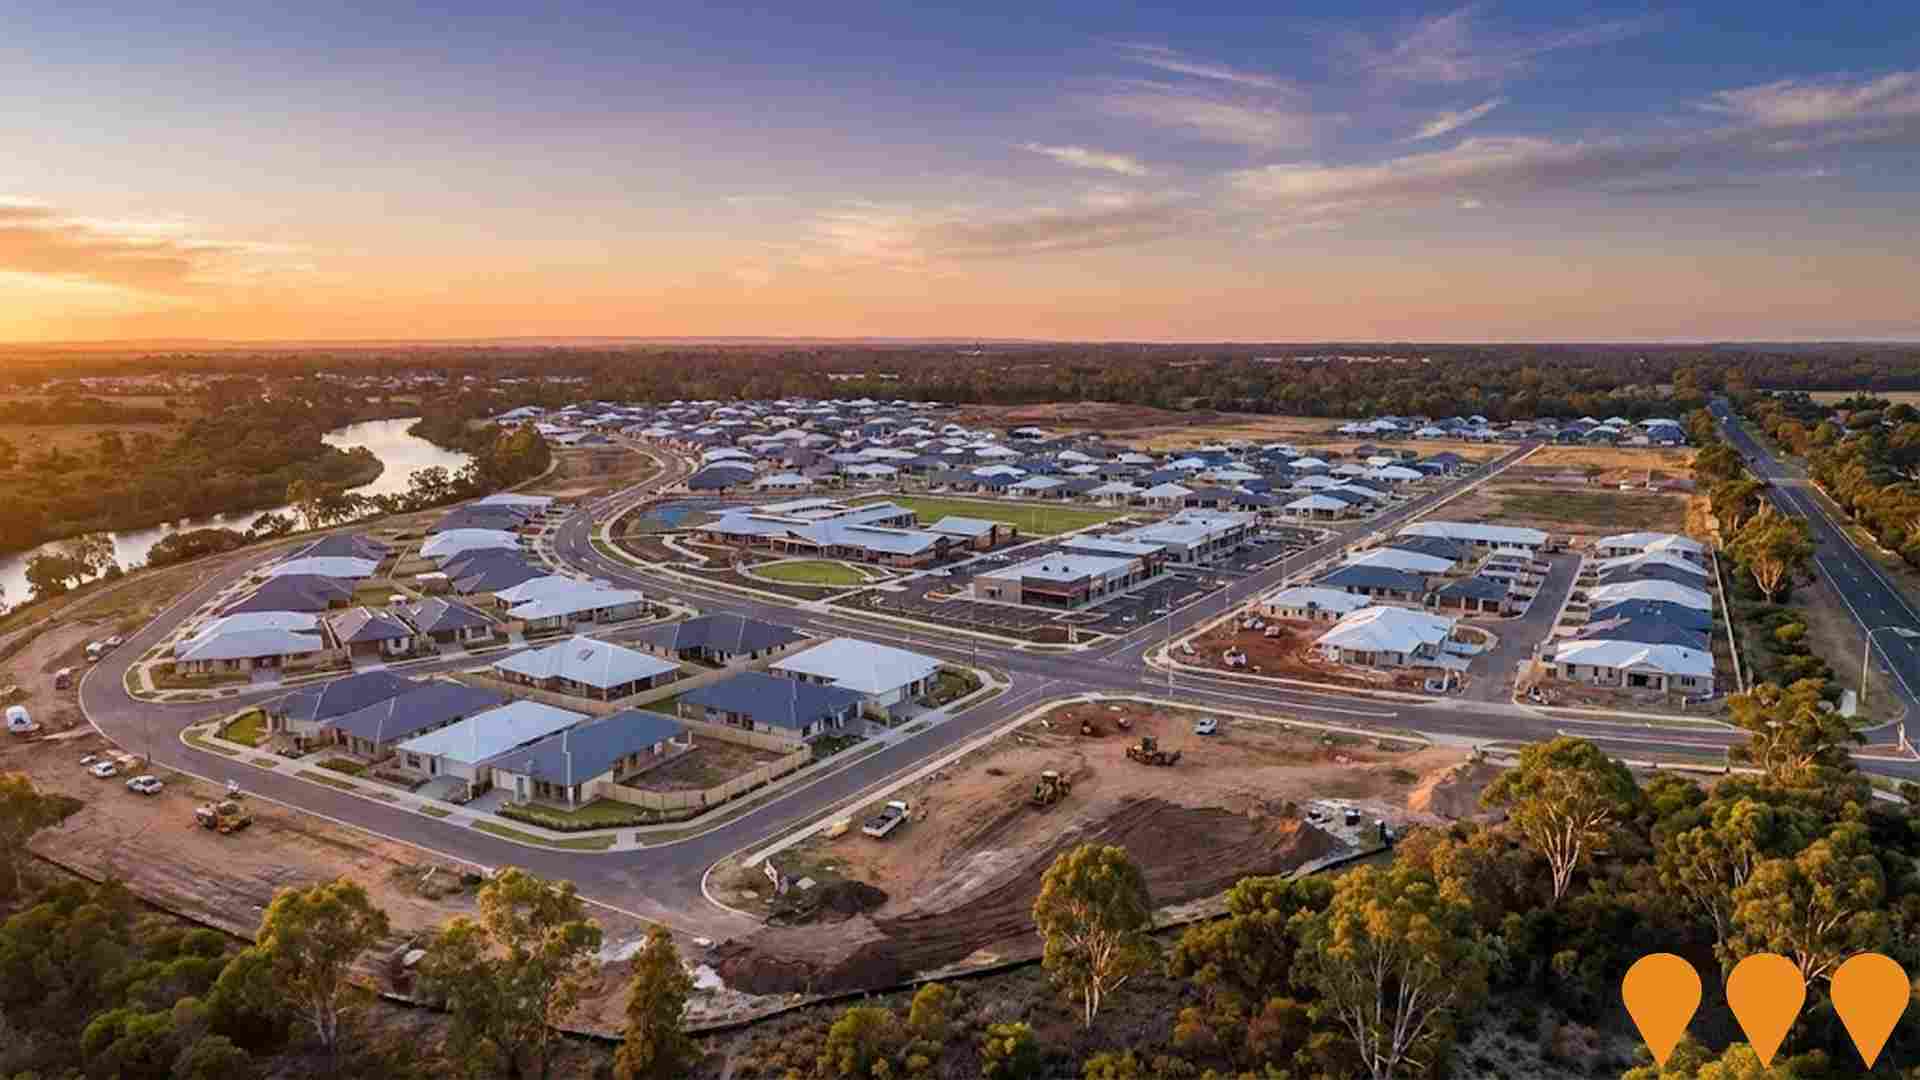
Kingston at Australind
A major 1400 lot residential subdivision development on a massive 185 hectare site, currently halfway through development. Kingston provides comprehensive community infrastructure including a primary school, neighbourhood shopping centre, retirement village facilities, and a range of housing styles. The site is bounded by the Brunswick River on northern and western sides, the Australind Bypass Highway to the east, and Leschenault Leisure and Aquatic Centre to the south.
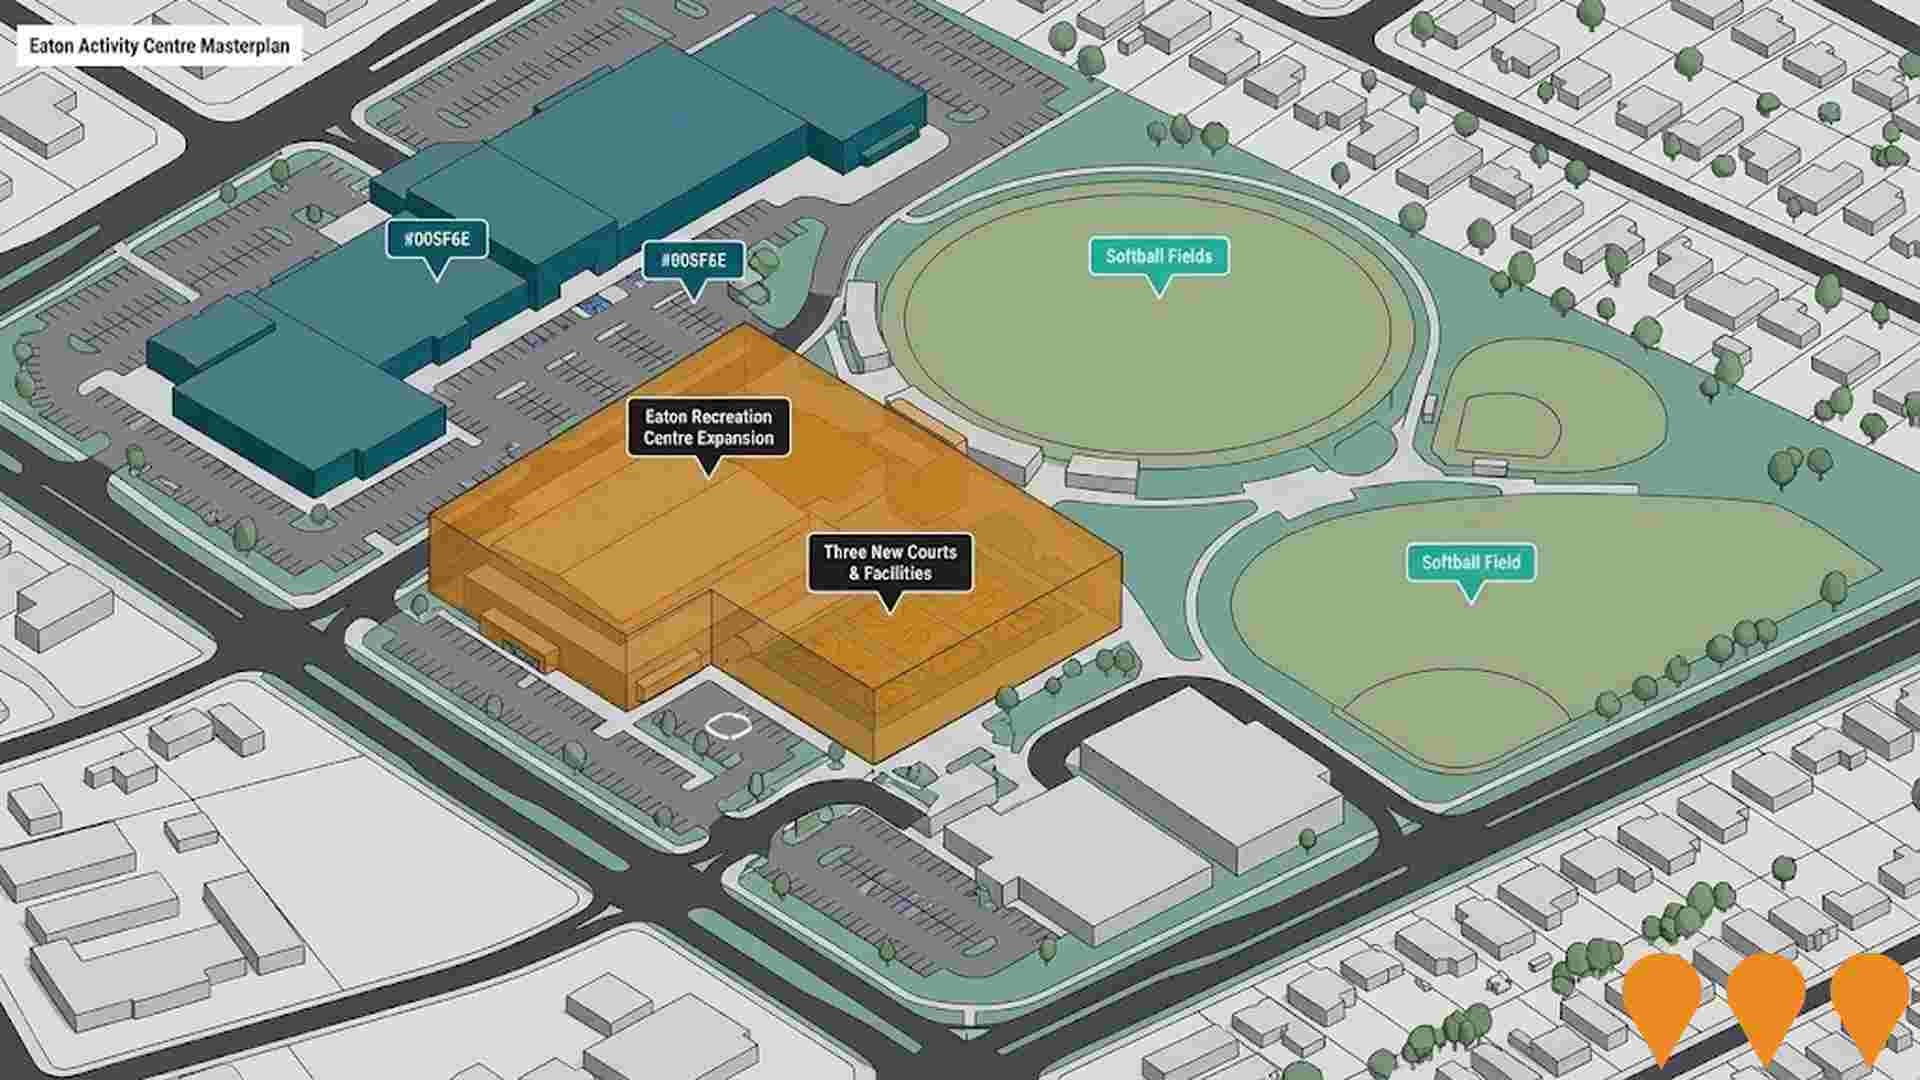
Eaton Recreation Centre Expansion
The expansion of the Eaton Recreation Centre involves adding three new basketball/netball courts, expanded change facilities, and additional spectator seating to establish it as the South West Regional Basketball and Netball Hub. This will support major competitions, local teams like the South West Slammers and South West Jets, and community programs, promoting active lifestyles.
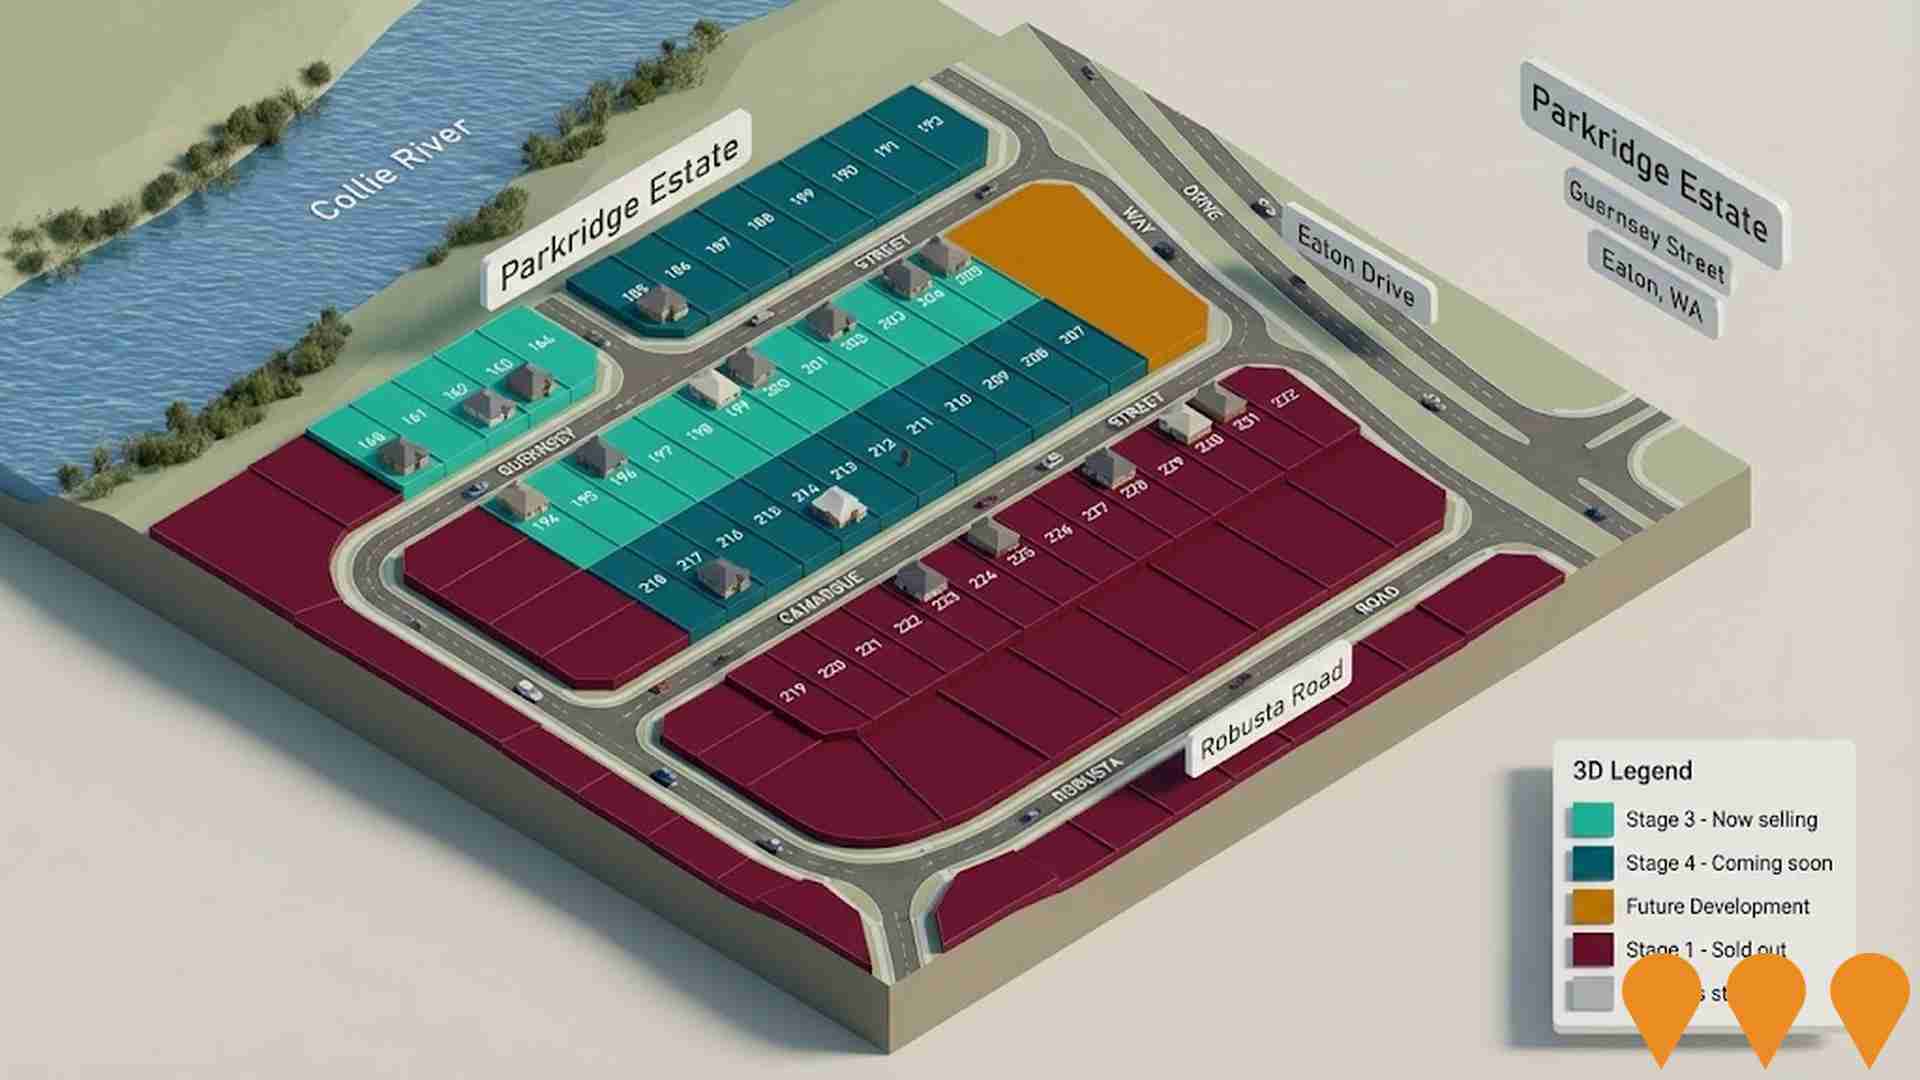
Parkridge Estate
Masterplanned residential estate adjacent to the Collie River in Eaton delivering multiple stages of serviced lots (R20-R40). Active land releases continue (Stage 4 titles targeted for Dec-Jan) while a structure plan amendment lodged in 2023 was refused by WAPC and is currently under SAT-led reconsideration. Civil works for earlier stages have been delivered (e.g., Stages 2A/2B).
Employment
AreaSearch analysis of employment trends sees Dardanup performing better than 90% of local markets assessed across Australia
Dardanup has a skilled workforce with manufacturing and industrial sectors strongly represented. The unemployment rate was 1.6% in September 2025, below the Rest of WA's rate of 3.3%.
Employment growth over the past year was estimated at 6.5%. There were 2,156 residents employed while the workforce participation rate was 64.0%, compared to the Rest of WA's 59.4%. Major employment sectors include construction, health care & social assistance, and manufacturing. Manufacturing is particularly specialized with an employment share twice the regional level at 2.0 times.
Conversely, mining shows lower representation at 7.6% versus the regional average of 11.7%. Many residents commute elsewhere for work based on Census data. In the 12 months prior, employment increased by 6.5%, labour force grew by 6.2%, and unemployment rate fell by 0.2 percentage points. Jobs and Skills Australia's national employment forecasts from May-25 suggest potential future demand within Dardanup. National employment is forecast to expand by 6.6% over five years and 13.7% over ten years, with industry-specific projections suggesting local employment should increase by 5.3% over five years and 11.8% over ten years.
Frequently Asked Questions - Employment
Income
Income analysis reveals strong economic positioning, with the area outperforming 60% of locations assessed nationally by AreaSearch
The median income among taxpayers in Dardanup SA2 was $57,376 in financial year 2022. The average income stood at $73,744 during the same period. In comparison, Rest of WA had median and average incomes of $57,323 and $71,163 respectively. Based on a 14.2% growth in wages since financial year 2022, estimated current incomes are approximately $65,523 (median) and $84,216 (average) as of September 2025. According to the 2021 Census, household, family and personal incomes in Dardanup were at the 56th percentile nationally. Income brackets show that 32.2% of residents earned between $1,500 and $2,999 weekly (1,196 residents), similar to the broader area where this cohort represented 31.1%. After housing costs, residents retained 88.6% of their income, indicating strong purchasing power. The area's SEIFA income ranking placed it in the 5th decile.
Frequently Asked Questions - Income
Housing
Dardanup is characterized by a predominantly suburban housing profile, with above-average rates of outright home ownership
The dwelling structure in Dardanup, as evaluated at the latest Census held on 28 August 2016, consisted of 94.6% houses and 5.4% other dwellings such as semi-detached homes, apartments, and 'other' dwellings. This is compared to Non-Metro WA's structure which was 88.1% houses and 11.8% other dwellings. The level of home ownership in Dardanup was 41.6%, with the remaining dwellings either mortgaged (44.1%) or rented (14.3%). The median monthly mortgage repayment in the area at that time was $1,750, while the median weekly rent figure was recorded as $260. Nationally, Dardanup's mortgage repayments were lower than the Australian average of $1,863, while rents were substantially below the national figure of $375.
Frequently Asked Questions - Housing
Household Composition
Dardanup features high concentrations of family households, with a fairly typical median household size
Family households constitute 77.8 percent of all households, including 33.0 percent couples with children, 37.2 percent couples without children, and 7.5 percent single parent families. Non-family households account for the remaining 22.2 percent, with lone person households at 21.1 percent and group households comprising 1.2 percent of the total. The median household size is 2.5 people, which aligns with the average in the Rest of WA.
Frequently Asked Questions - Households
Local Schools & Education
Educational outcomes in Dardanup fall within the lower quartile nationally, indicating opportunities for improvement in qualification attainment
The area's university qualification rate is 18.4%, significantly lower than Australia's average of 30.4%. Bachelor degrees are the most common at 14.4%, followed by graduate diplomas (2.3%) and postgraduate qualifications (1.7%). Vocational credentials are prevalent, with 43.8% of residents aged 15+ holding them, including advanced diplomas (10.6%) and certificates (33.2%). Educational participation is high at 27.7%, with 11.3% in primary education, 9.7% in secondary education, and 1.8% pursuing tertiary education.
Educational participation is notably high, with 27.7% of residents currently enrolled in formal education. This includes 11.3% in primary education, 9.7% in secondary education, and 1.8% pursuing tertiary education.
Frequently Asked Questions - Education
Schools Detail
Nearby Services & Amenities
Transport
Transport servicing is very low compared to other areas nationally based on assessment of service frequency, route connectivity and accessibility
Public transport analysis indicates that as of 2021 there is one active transport stop operating within Dardanup. This stop offers a mix of bus services. It is serviced by one individual route, collectively providing five weekly passenger trips.
Transport accessibility in the area is rated as limited, with residents typically located 5532 meters from the nearest transport stop. Service frequency averages zero trips per day across all routes, equating to approximately five weekly trips per individual stop.
Frequently Asked Questions - Transport
Transport Stops Detail
Health
Dardanup's residents are healthier than average in comparison to broader Australia with a fairly standard level of common health conditions seen across both young and old age cohorts
Dardanup residents have a relatively positive health status with common conditions seen across all age groups. The private health cover rate is high at approximately 56%, compared to 54.1% in the rest of WA.
Arthritis and mental health issues are the most prevalent, affecting 10.1 and 7.6% respectively. About 69.5% report no medical ailments, higher than the 66.4% in the rest of WA. Around 19.5% of residents are aged 65 and over (724 people), compared to 17.6% in the rest of WA. Seniors' health outcomes are strong, exceeding general population metrics.
Frequently Asked Questions - Health
Cultural Diversity
Dardanup is considerably less culturally diverse than average when assessed alongside AreaSearch's national rankings for language and cultural background related metrics
Dardanup has a below average cultural diversity, with 84.1% of its population born in Australia and 97.7% speaking English only at home. As of the 2016 Census, 90.3% of Dardanup's residents are Australian citizens. Christianity is the predominant religion, practiced by 49.3% of people, compared to 45.9% across the rest of Western Australia (WA).
The top three ancestry groups in Dardanup are English at 35.3%, Australian at 31.4%, and Scottish at 7.6%. Notably, Dutch ancestry is overrepresented in Dardanup at 2.0%, compared to 1.6% regionally. South African ancestry also stands out at 1.1%, higher than the regional average of 0.8%. Additionally, Italian ancestry is present at 5.5%, slightly higher than the regional average of 4.8%.
Frequently Asked Questions - Diversity
Age
Dardanup hosts an older demographic, ranking in the top quartile nationwide
Dardanup's median age is 45 years, which is significantly higher than the Rest of WA average of 40 years and Australia's average of 38 years. The age profile shows that those aged 65-74 years are particularly prominent, making up 12.8% of the population, while the 25-34 age group is comparatively smaller at 9.4%. Between 2021 and present, Dardanup's median age has decreased by 1.1 years to 45 from 46. During this period, the 35-44 age group grew from 11.6% to 13.4% of the population, and the 15-24 cohort increased from 9.7% to 11.3%. Conversely, the 45-54 age group declined from 16.0% to 13.1%, and the 55-64 group dropped from 16.4% to 14.9%. Population forecasts for 2041 indicate substantial demographic changes in Dardanup, with the 25-34 age cohort projected to grow by 56% to reach 544 residents. However, the 55-64 and 65-74 cohorts are expected to experience population declines.

