Chart Color Schemes
This analysis uses ABS Statistical Areas Level 2 (SA2) boundaries, which can materially differ from Suburbs and Localities (SAL) even when sharing similar names.
SA2 boundaries are defined by the Australian Bureau of Statistics and are designed to represent communities for statistical reporting (e.g., census and ERP).
Suburbs and Localities (SAL) represent commonly-used suburb/locality names (postal-style areas) and may use different geographic boundaries. For comprehensive analysis, consider reviewing both boundary types if available.
est. as @ -- *
ABS ERP | -- people | --
2021 Census | -- people
Sales Activity
Curious about local property values? Filter the chart to assess the volume and appreciation (including resales) trends and regional comparisons, or scroll to the map below view this information at an individual property level.
Find a Recent Sale
Sales Detail
Population
Population growth drivers in Donnybrook - Balingup are above average based on AreaSearch's ranking of recent, and medium to long-term trends
Donnybrook-Balingup's population was 6,155 as of the 2021 Census. By Nov 2025, it had increased to around 6,680, a growth of 525 people (8.5%). This increase is inferred from ABS data: an estimated resident population of 6,584 in June 2024 and 94 new addresses validated since the Census date. The population density is 4.3 persons per square kilometer. Donnybrook-Balingup's growth exceeded that of its SA3 area (8.1%), making it a regional growth leader. Interstate migration contributed approximately 53.0% of overall population gains during recent periods.
AreaSearch uses ABS/Geoscience Australia projections for each SA2 area, released in 2024 with a base year of 2022. For areas not covered by this data and post-2032 growth estimation, AreaSearch utilises ABS' Greater Capital Region projections (released in 2023, based on 2022 data). Demographically, non-metropolitan Australia is projected to have above median population growth. By 2041, Donnybrook-Balingup is expected to expand by 1,079 persons, reflecting a total gain of 14.7% over the 17 years based on latest annual ERP population numbers.
Frequently Asked Questions - Population
Development
Recent residential development output has been above average within Donnybrook - Balingup when compared nationally
Donnybrook-Balingup has seen approximately 44 new home approvals per year over the past five financial years, totalling around 220 homes. As of FY26, 14 approvals have been recorded. On average, 2.1 people moved to the area annually for each new home constructed between FY21 and FY25, suggesting strong demand that supports property values. The average construction cost value of these new homes is around $238,000, which is below regional levels, offering more affordable housing options.
This financial year has seen approximately $9.0 million in commercial approvals, indicating limited commercial development focus. Compared to the rest of WA, Donnybrook-Balingup has slightly higher development activity, with 14.0% more approvals per person over the past five years. This balance between buyer choice and support for current property values is evident.
The new development in the area primarily consists of standalone homes (93.0%) and townhouses or apartments (7.0%), preserving its low-density nature while catering to space-seeking buyers. With around 166 people per approval, Donnybrook-Balingup reflects a developing area with a population growth projection of 983 residents by 2041. Based on current development patterns, new housing supply should meet demand effectively, providing good conditions for buyers and potentially facilitating further population growth beyond current projections.
Frequently Asked Questions - Development
Infrastructure
Donnybrook - Balingup has limited levels of nearby infrastructure activity, ranking in the 3rdth percentile nationally
Changes in local infrastructure significantly impact an area's performance. AreaSearch has identified nine projects that could affect this region. Notable ones include the Donnybrook Town Centre Revitalisation Project, Bridge Street Housing Project (Independent Living Units), Collie to Mumballup Road Upgrade, and Global Advanced Metals Tantalum Processing facility. The following list details those most likely to be relevant.
Professional plan users can use the search below to filter and access additional projects.
INFRASTRUCTURE SEARCH
 Denotes AI-based impression for illustrative purposes only, not to be taken as definitive under any circumstances. Please follow links and conduct other investigations from the project's source for actual imagery. Developers and project owners wishing us to use original imagery please Contact Us and we will do so.
Frequently Asked Questions - Infrastructure
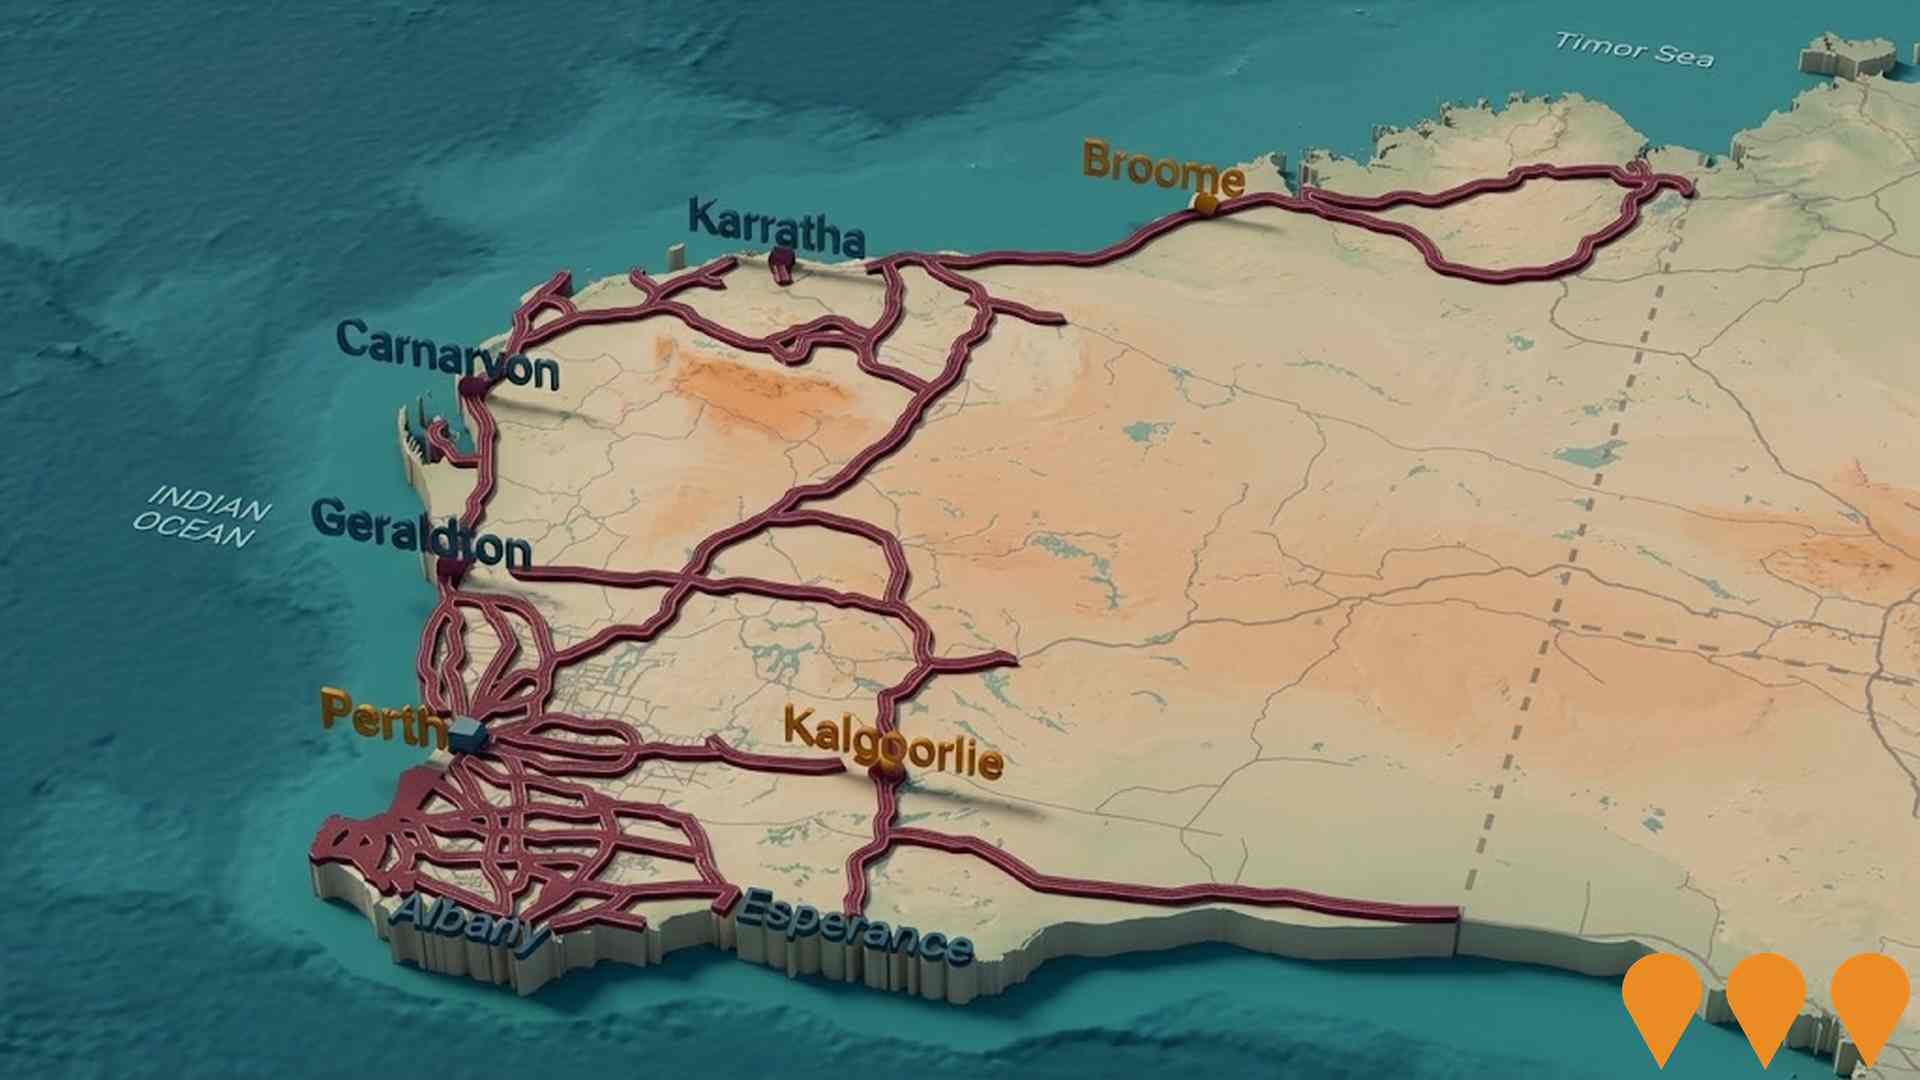
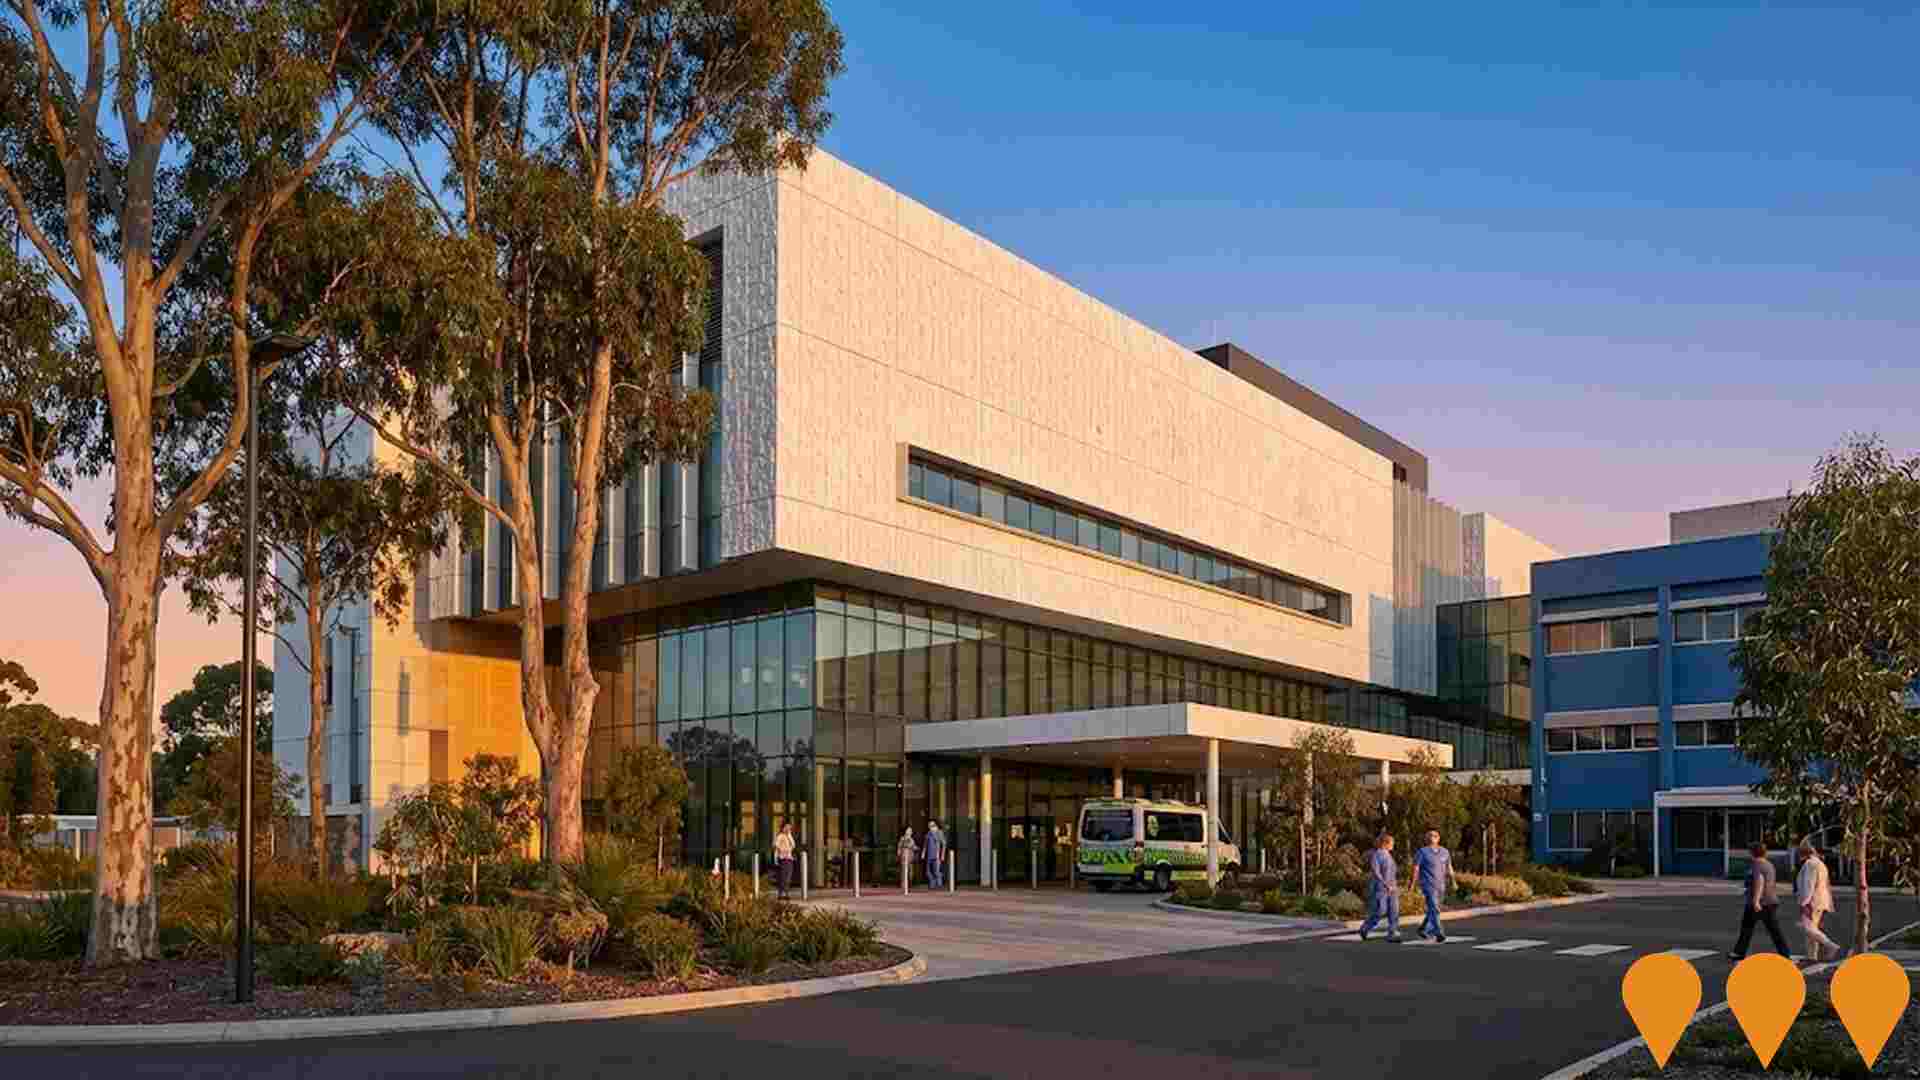
Bunbury Regional Hospital Redevelopment
A $471.5 million redevelopment to transform Bunbury Regional Hospital into one of the most modern facilities in regional Australia, ensuring South West residents have access to contemporary healthcare. The project includes an expanded emergency department, increased operating theatre capacity, additional medical and intensive care beds, new and expanded maternity, birthing, and neonatal services, a dedicated mental health observation area, expanded mental health inpatient facilities, and WAs first regional training, education, and research centre.
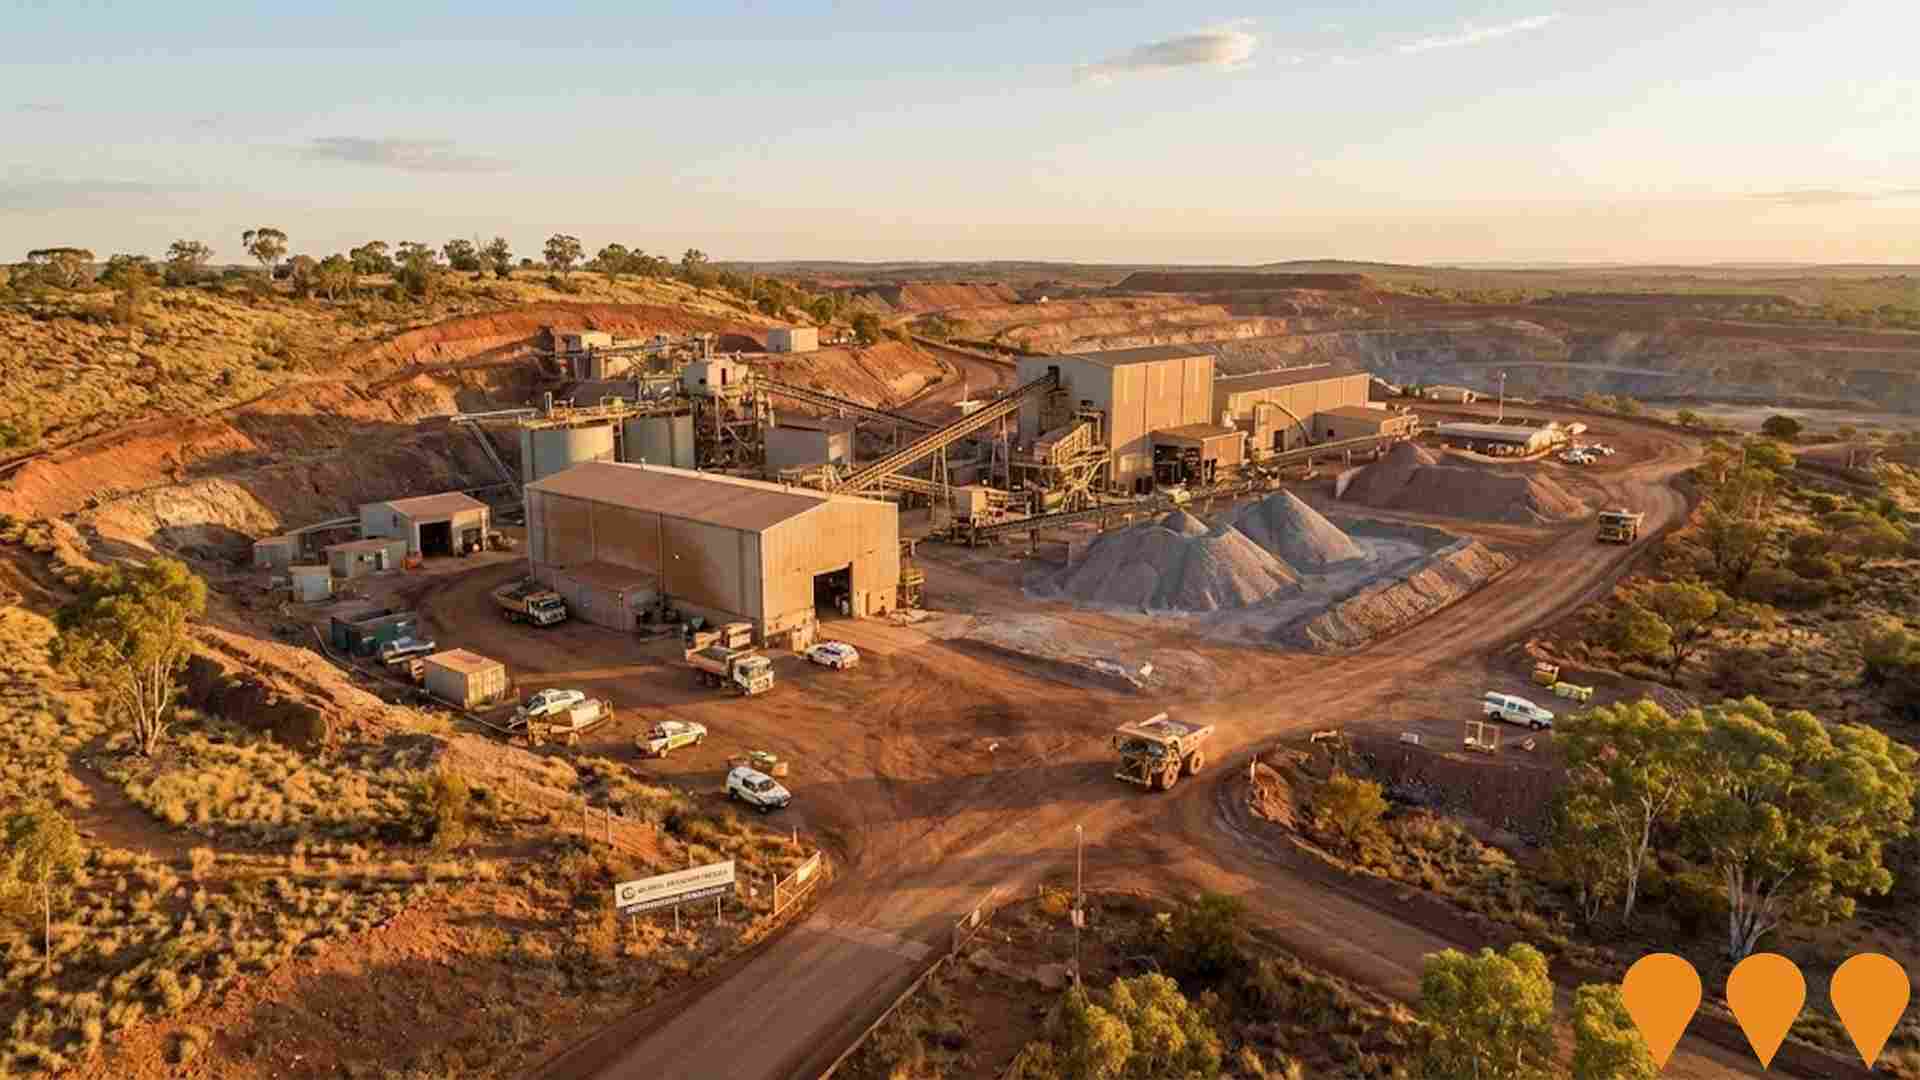
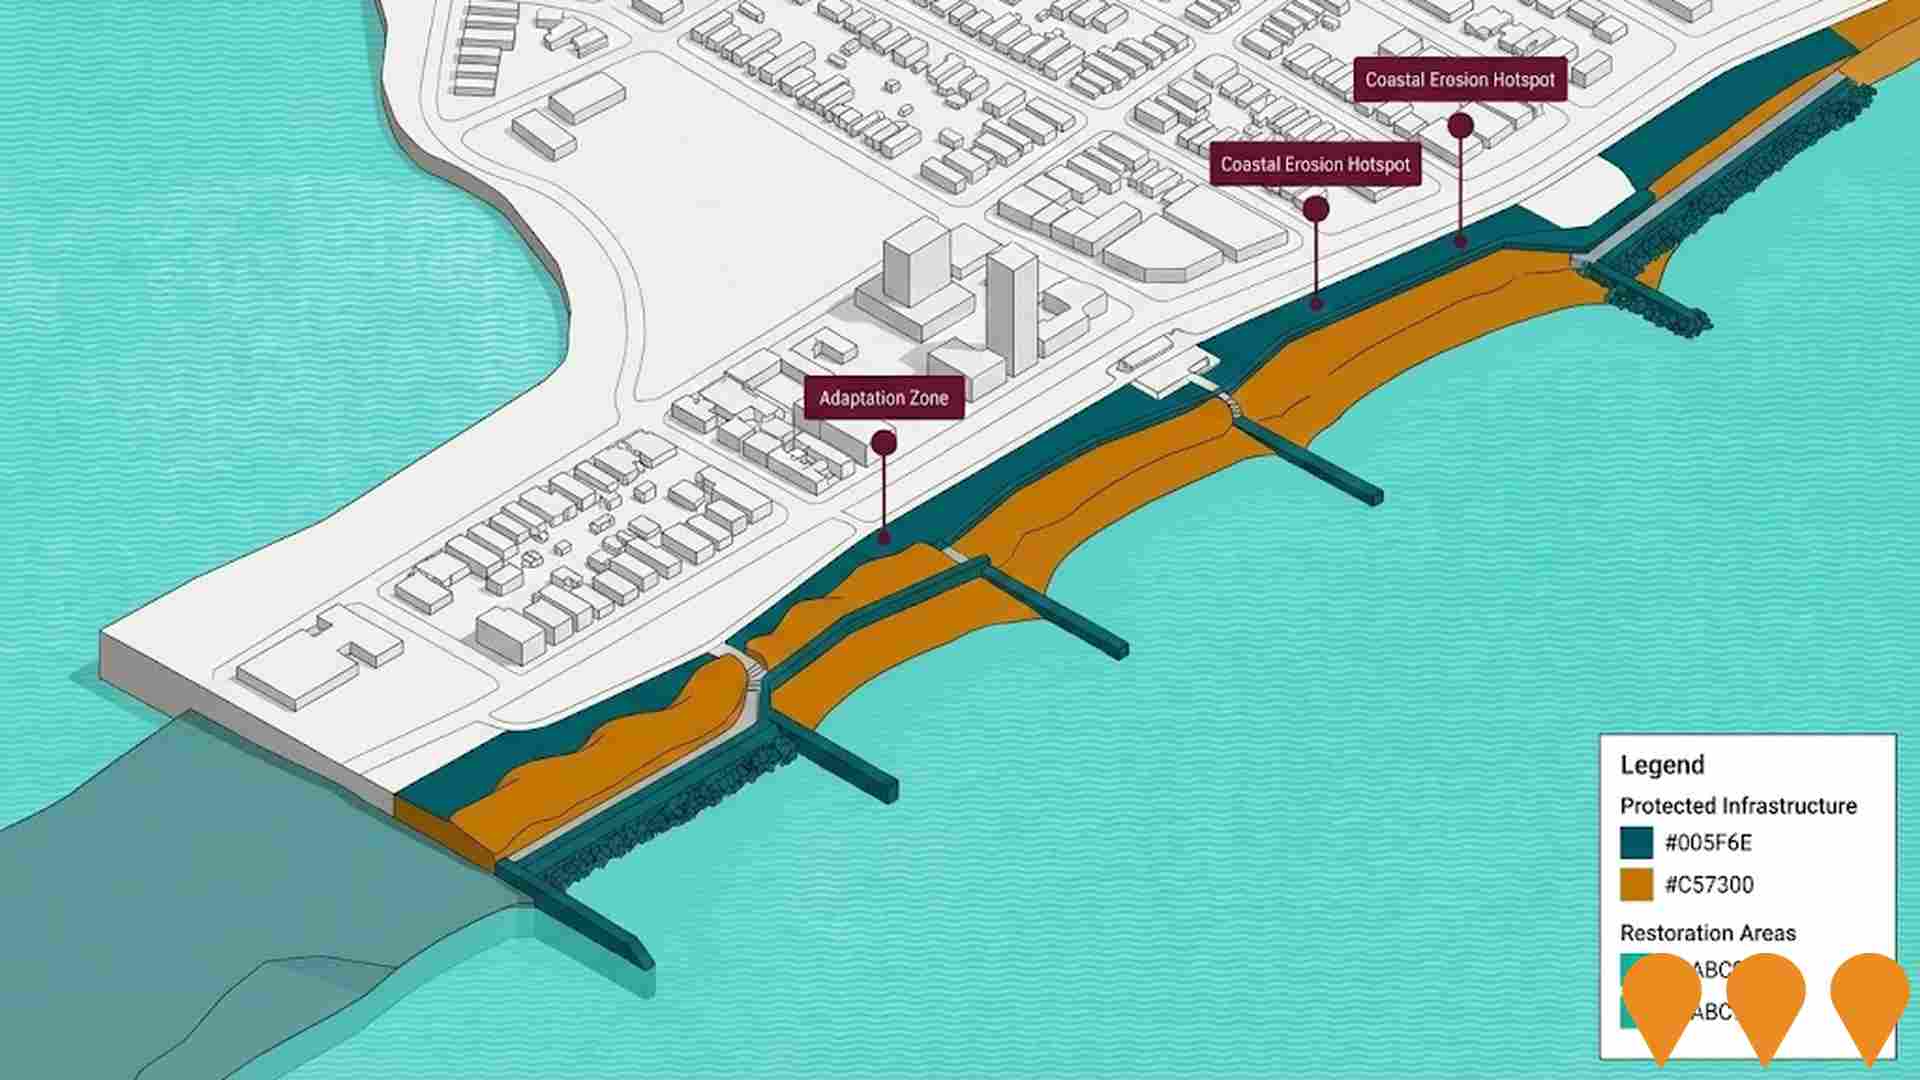
Greenbushes Lithium Mine Expansion
Expansion of the existing lithium mine to substantially increase production capacity of spodumene ore and lithium mineral concentrate. The proposal includes construction of new waste rock landforms (S2 and S8 WRL), expansion of existing dams to create the larger Salt Water Gully Dam (SWG Dam), a highway crossing (overpass or underpass), and additional supporting infrastructure. The proposal will increase the development envelope by 28% to 2,826 hectares and requires state and federal environmental approvals.

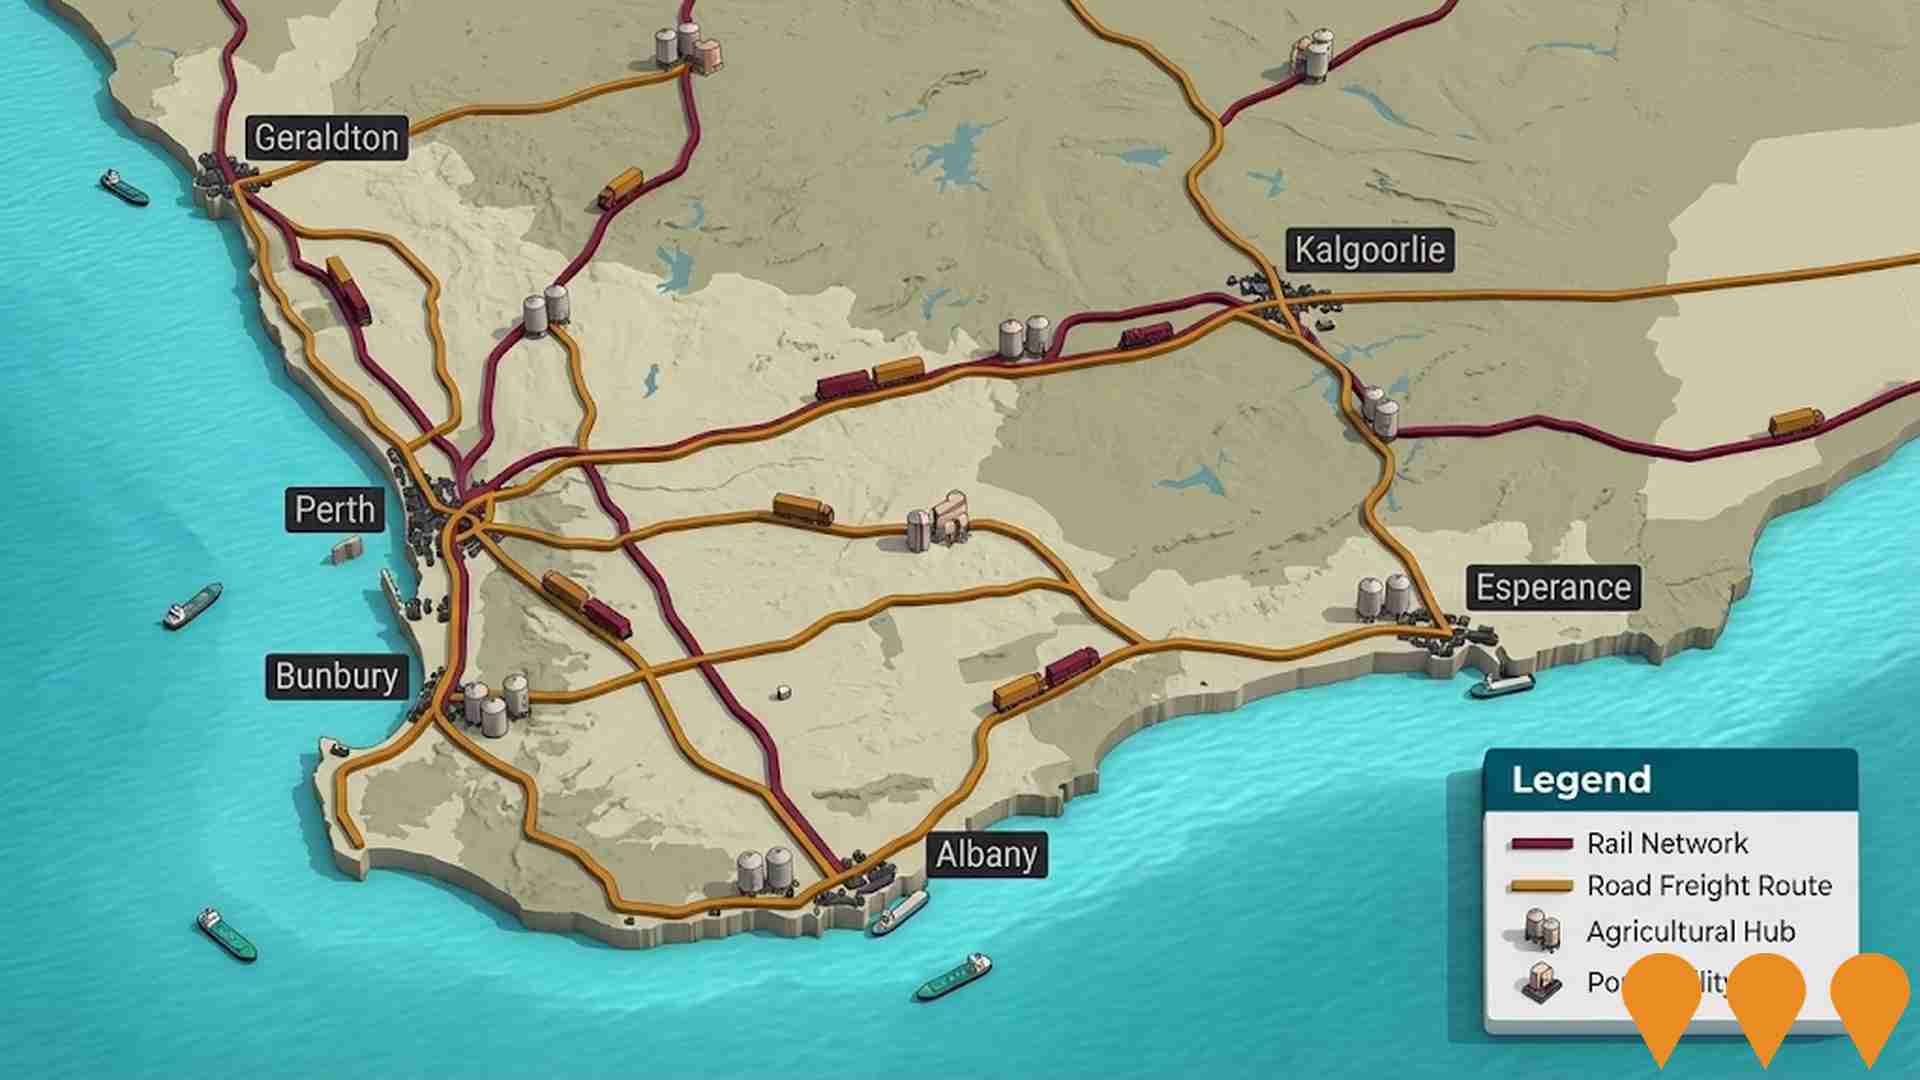
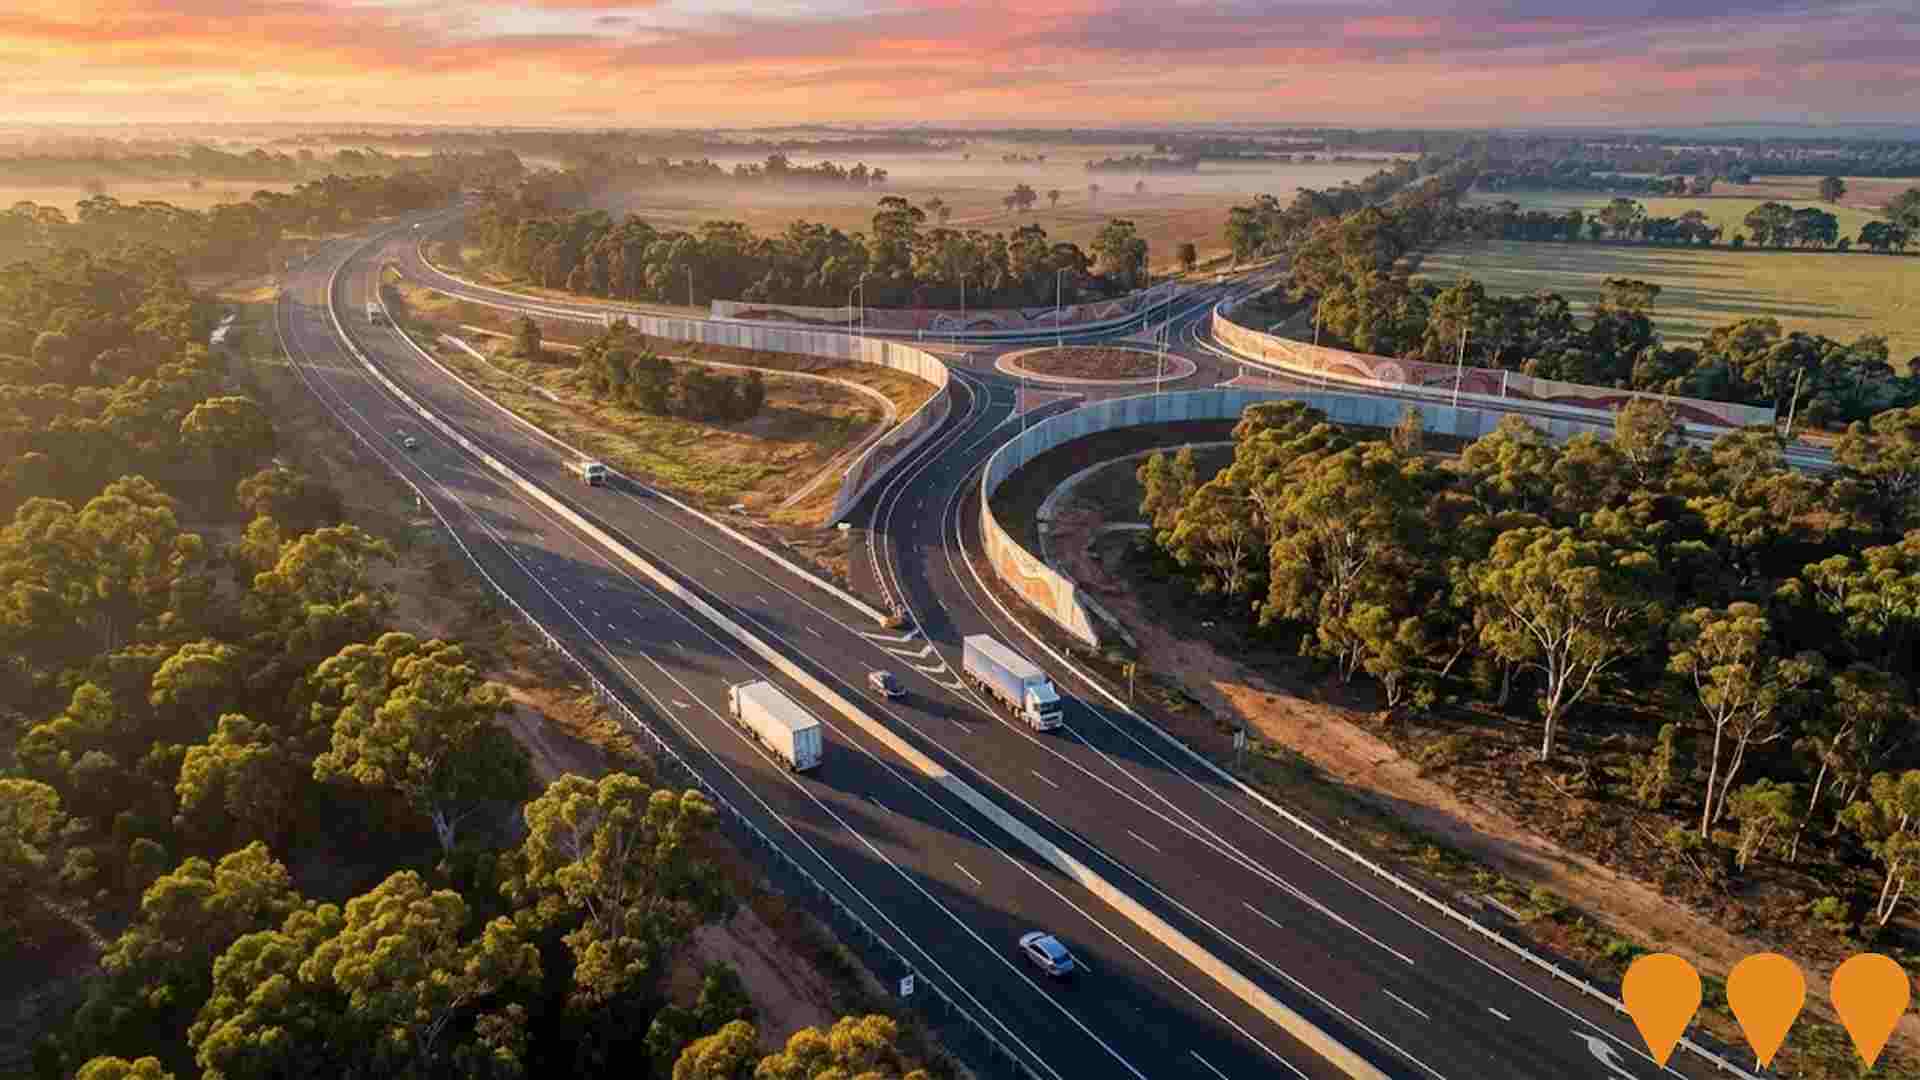
Wilman Wadandi Highway
The Wilman Wadandi Highway (formerly known as the Bunbury Outer Ring Road) is a 27-kilometre four-lane dual carriageway that bypasses Bunbury, connecting Forrest Highway in the north-east to Bussell Highway near Dalyellup in the south-west. Officially opened on December 16, 2024, this $1.46 billion project is the largest road infrastructure project ever undertaken in Western Australia's South-West. It features interchanges, bridges, improved access to Bunbury Port and industrial areas, and ongoing finishing works including permanent signage, artwork on noise walls, and completion of shared pedestrian and cycle paths. The highway reduces travel times by 11-18 minutes, diverts 15,000 vehicles daily from local Bunbury roads, and enhances connectivity and freight efficiency for the South West region.
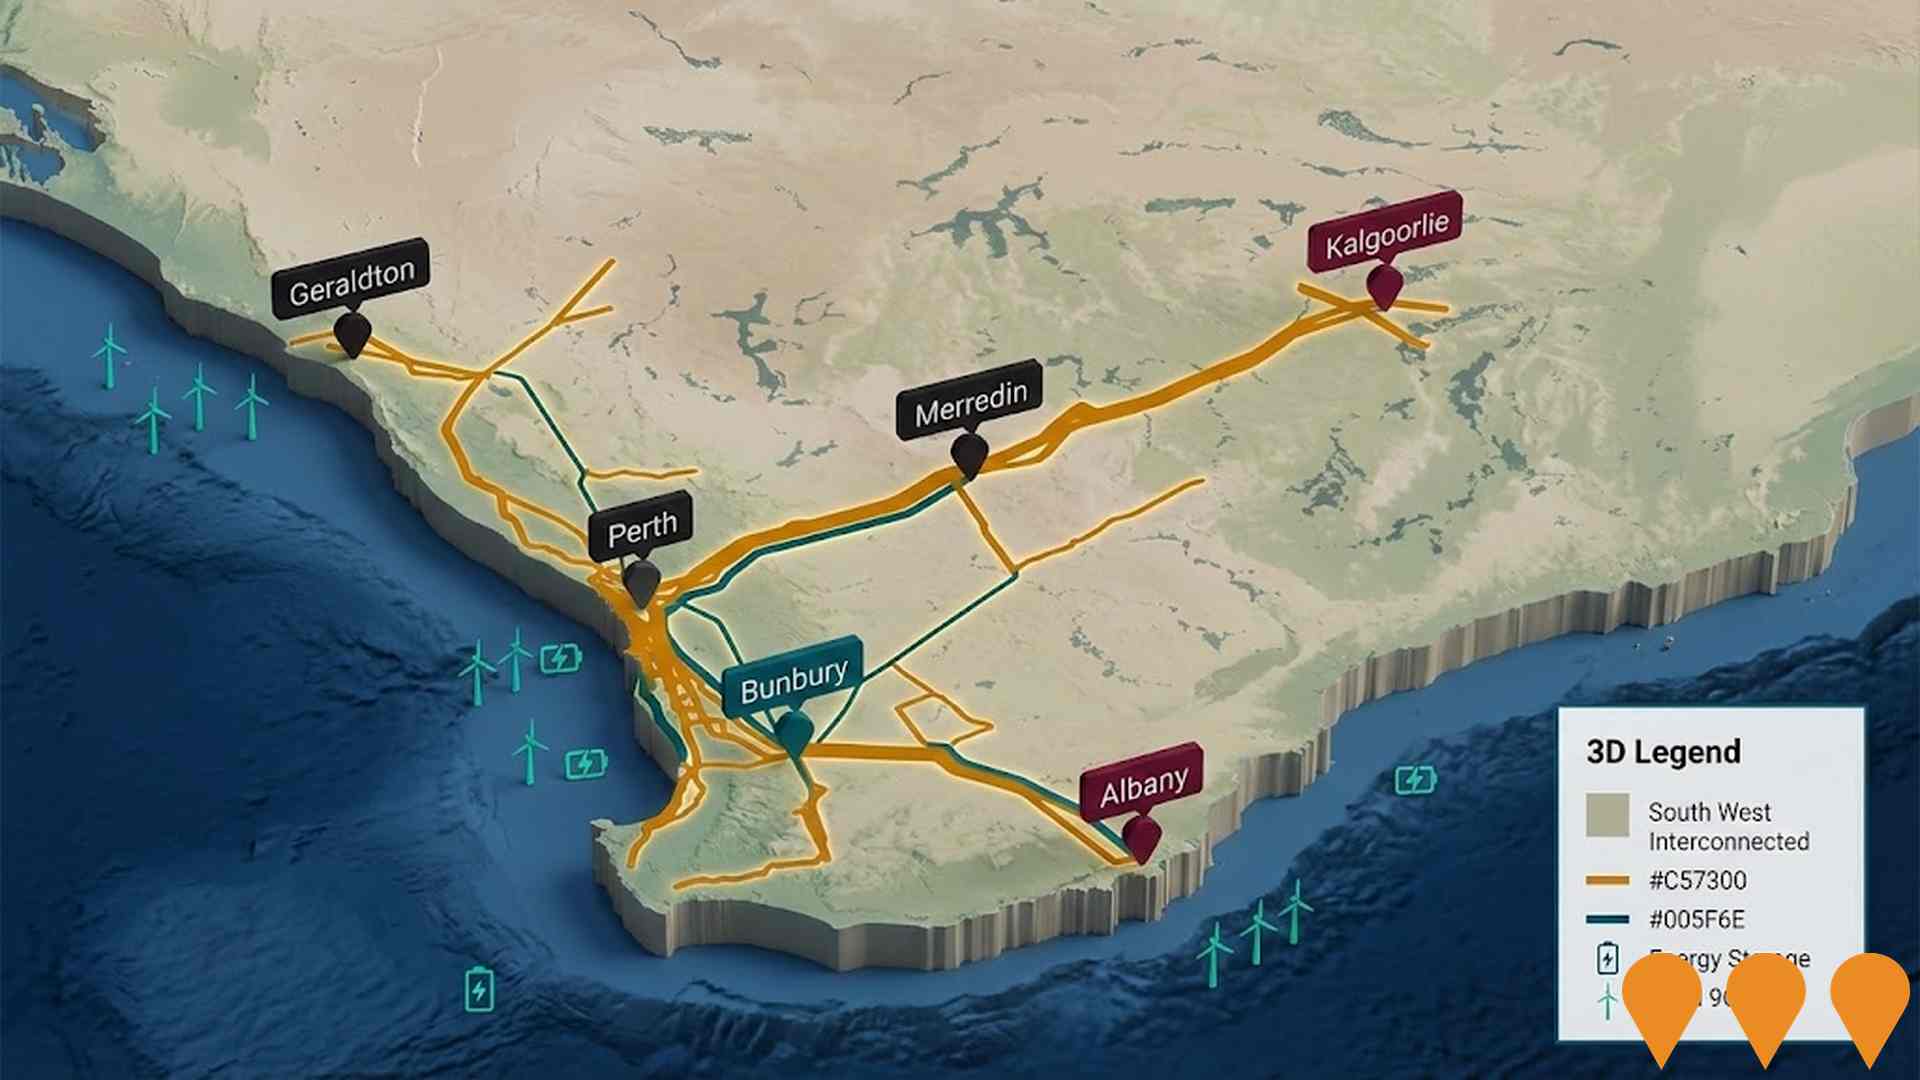
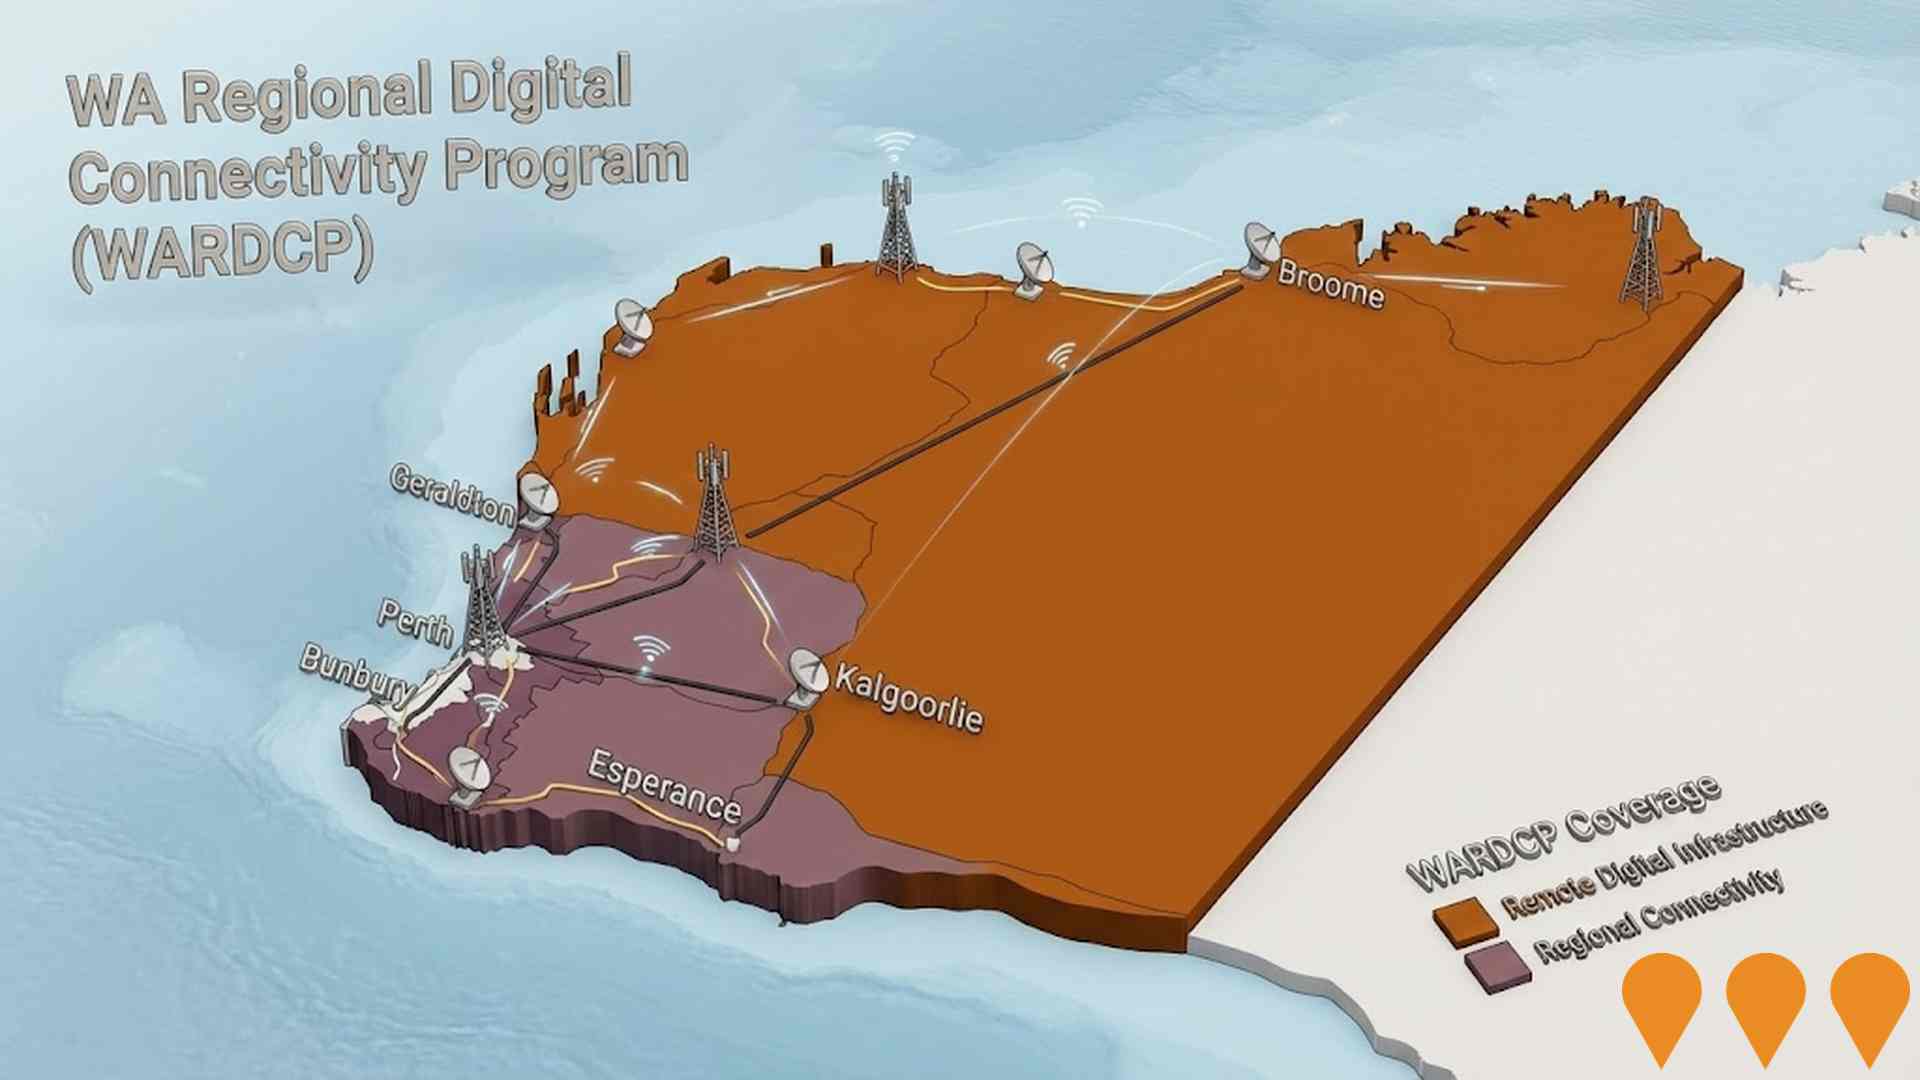
WA Regional Digital Connectivity Program (WARDCP)
Statewide co-investment program delivering new and upgraded mobile, fixed wireless and broadband infrastructure to improve reliability, coverage and performance for regional and remote Western Australia. Current workstreams include the Regional Telecommunications Project, State Agriculture Telecommunications Infrastructure Fund, and the WA Regional Digital Connectivity Program (WARDCP).
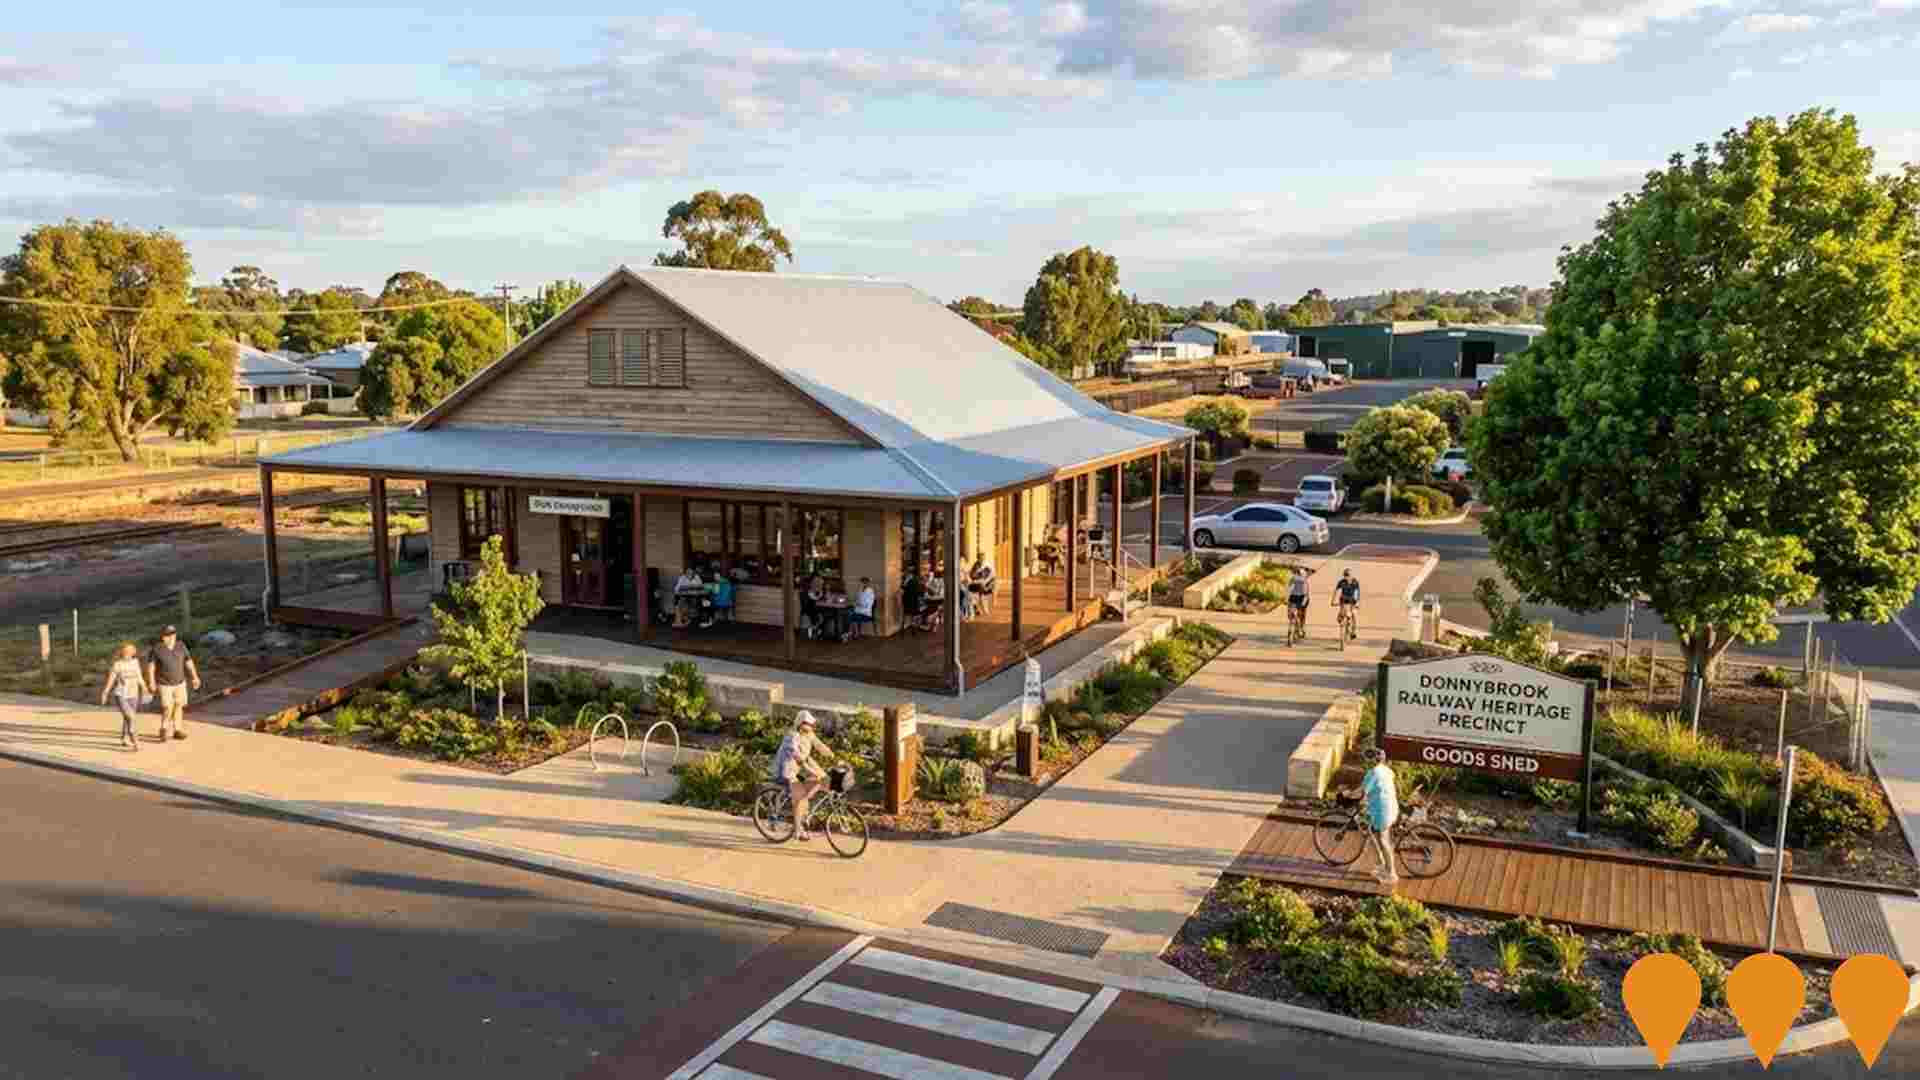
Donnybrook Town Centre Revitalisation Project
A heritage revitalization project centered on the restoration of the 1800s Donnybrook Railway Heritage Precinct Goods Shed, now operating as an interpretive centre showcasing the region's history. The project connects public spaces on both sides of the railway station precinct and the Apple Fun Park through new boardwalks and landscaping, creating Station Square as a community hub and tourism destination. The heritage-listed Goods Shed houses the Donnybrook Heritage Goods Shed Interpretive Centre, managed by Park Donnybrook cafe and interpretive facility.
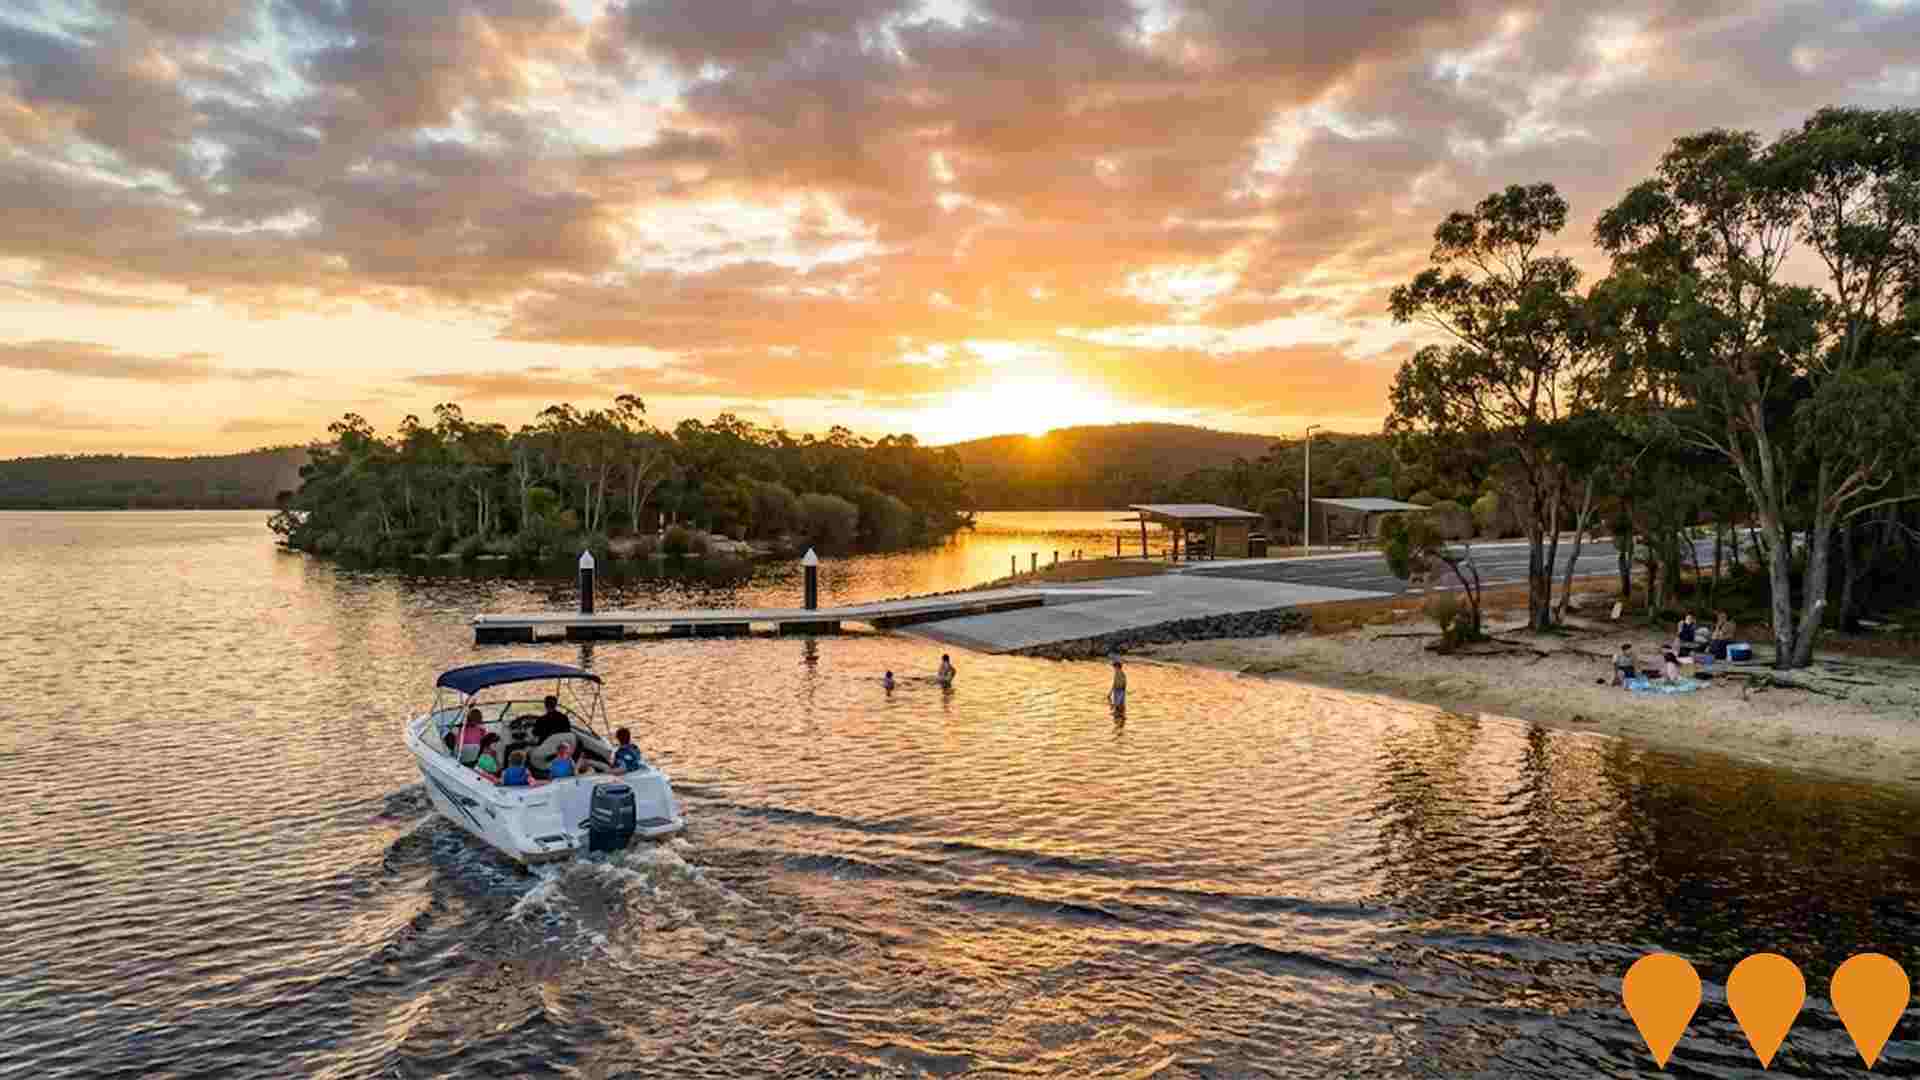
Lake Kepwari Tourism Hub
Transformation of a former open-cut coalmine into a water-based tourism hub featuring facilities for boating, waterskiing, swimming, camping, and picnicking. Includes campgrounds, picnic areas, and accessible pathways.
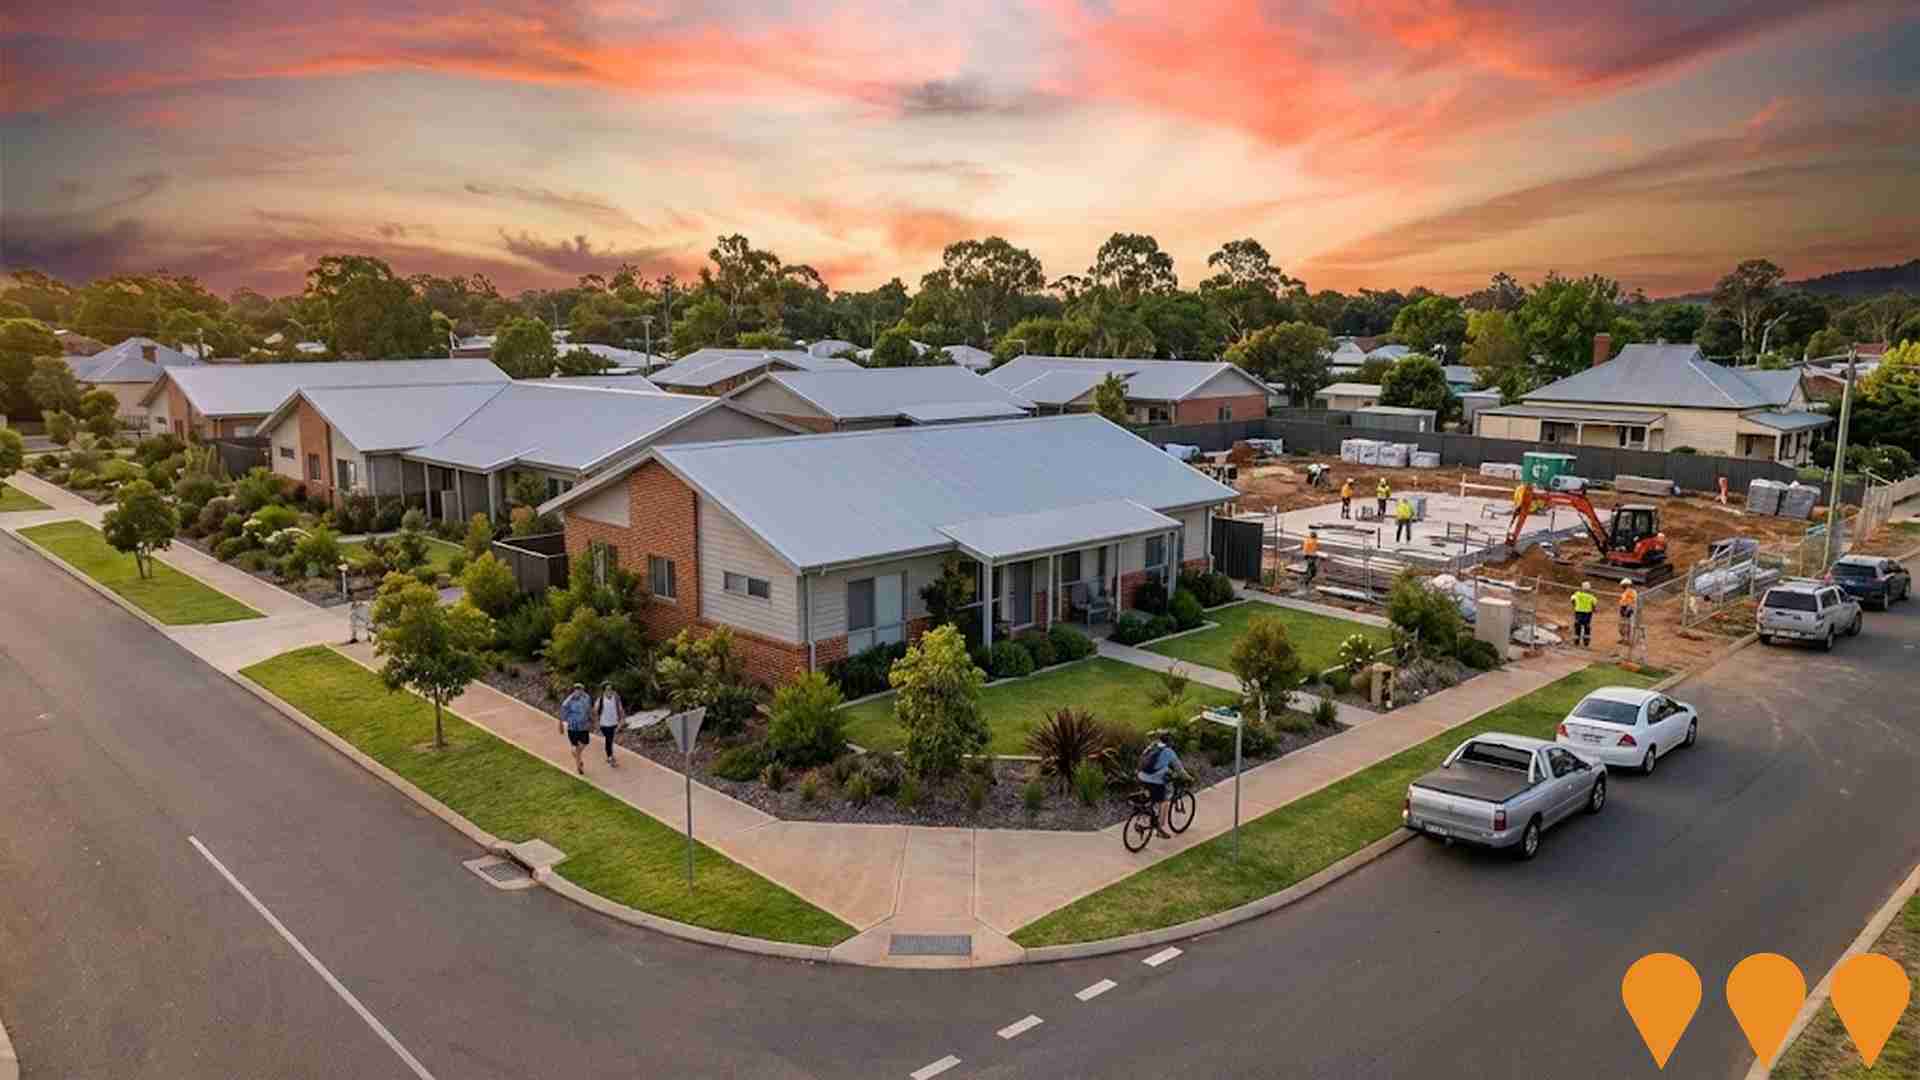
Bridge Street Housing Project (Independent Living Units)
A development of 12 independent living units for residents aged 65 and over, delivered by Alliance Housing with funding from the State Government's Regional Aged Accommodation Program and Social Housing Economic Recovery Package. The project features 10 two-bedroom units and 2 one-bedroom units built to Australian Adaptable Housing Standards, providing affordable rental options for aged accommodation within walking distance of Donnybrook town centre. Constructed by Smith Constructions with site works by JAK Civil.
Collie to Mumballup Road Upgrade
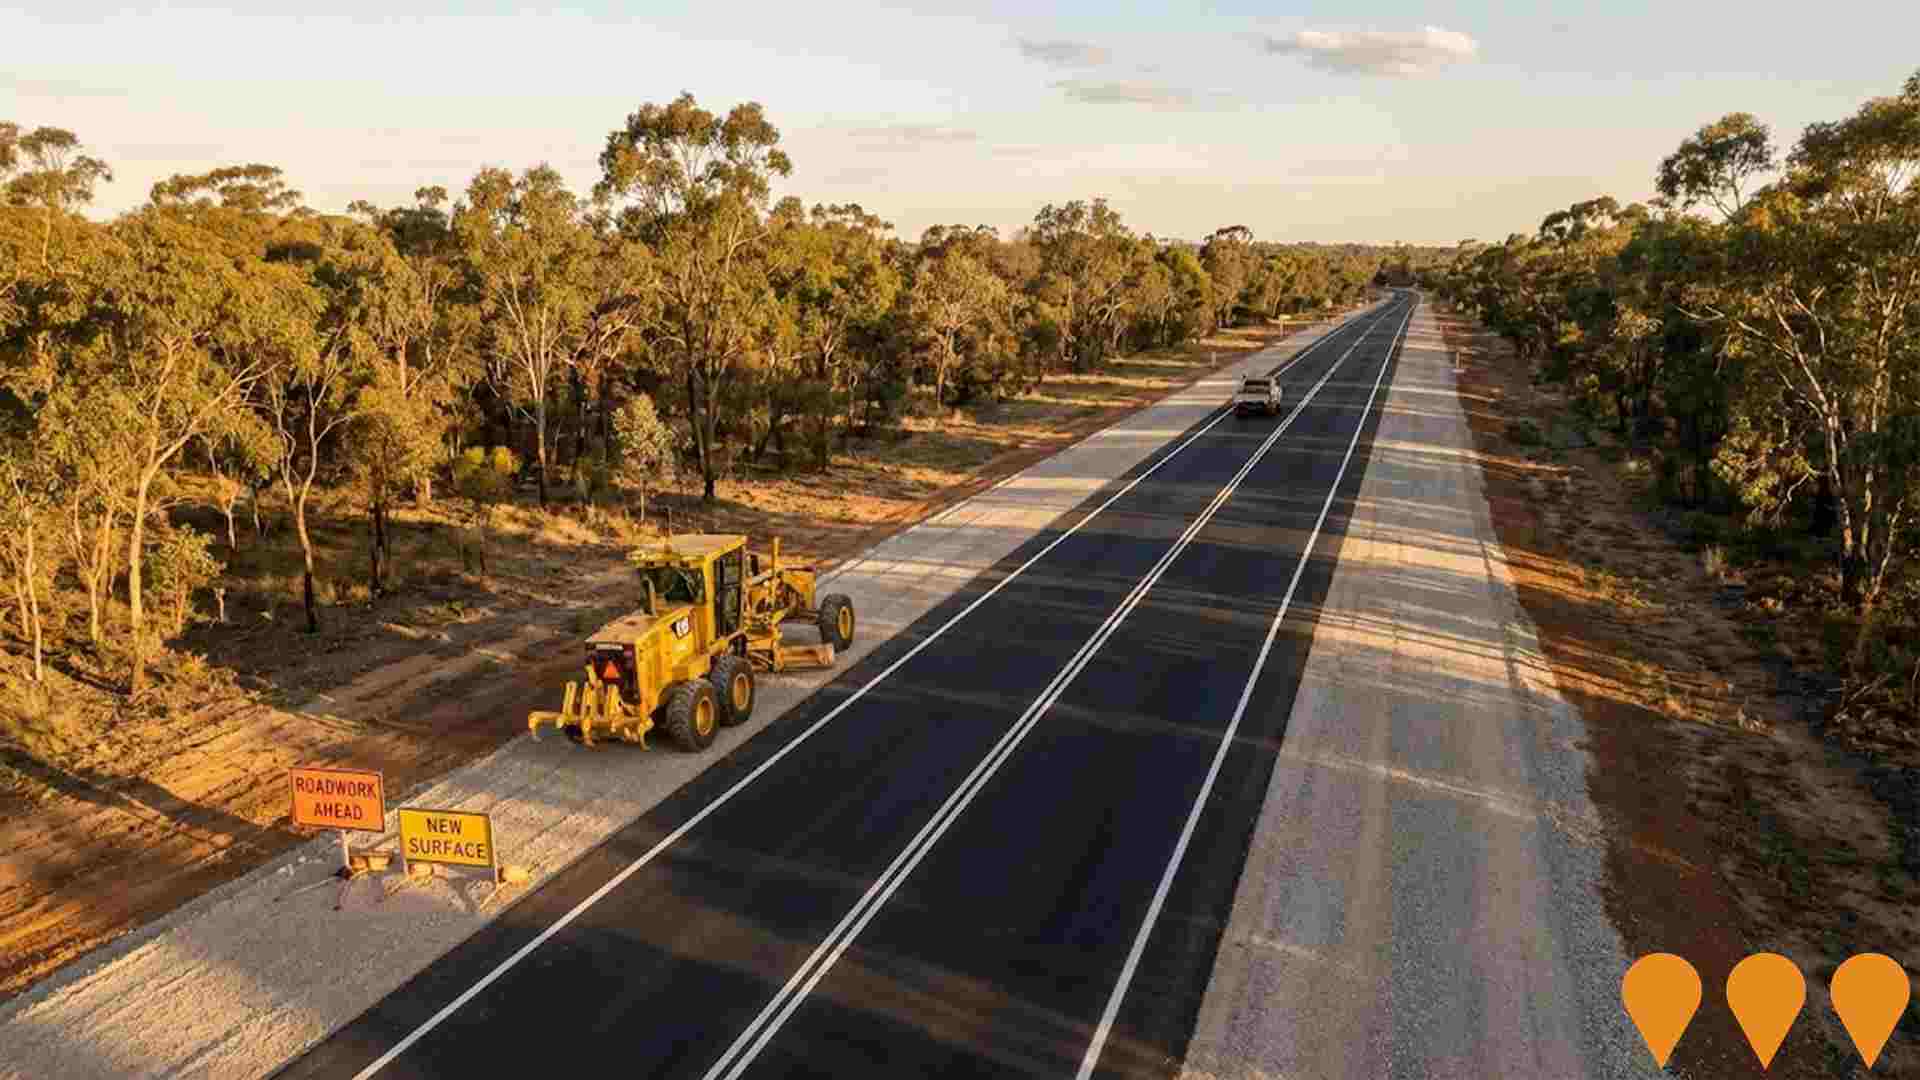
Upgrades to the section of road from Greer Road to Donnybrook-Boyup Brook Road are being undertaken in stages to improve safety and provide smoother journeys. Stage 2 between Vernon Road and Glen Mervyn Dam has been completed, and planning is now focusing on Stage 3 between Glen Mervyn Dam and Donnybrook Boyup Brook Road, with construction subject to funding.
Employment
Employment conditions in Donnybrook - Balingup demonstrate strong performance, ranking among the top 35% of areas assessed nationally
Donnybrook-Balingup has a skilled workforce with strong manufacturing and industrial sectors. Its unemployment rate was 2.5% in the past year, with an estimated employment growth of 6.6%.
As of September 2025, 3,474 residents are employed, with an unemployment rate of 0.8% below Rest of WA's rate of 3.3%. Key industries include agriculture, forestry & fishing, health care & social assistance, and mining. Agriculture, forestry & fishing has notable concentration, with employment levels at 1.5 times the regional average. However, accommodation & food services have limited presence at 5.4%, compared to 7.1% regionally.
The area offers limited local employment opportunities, as indicated by Census data. Over a 12-month period ending in May-25, employment increased by 6.6% while labour force grew by 6.1%, leading to a unemployment drop of 0.5 percentage points. This contrasts with Rest of WA's 1.4% employment growth and 1.2% labour force increase, resulting in a 0.2 percentage point unemployment decrease. Jobs and Skills Australia forecasts national employment growth at 6.6% over five years and 13.7% over ten years. Applying these projections to Donnybrook-Balingup's employment mix suggests local employment should increase by 5.3% over five years and 11.8% over ten years, though this is a simple extrapolation for illustrative purposes only.
Frequently Asked Questions - Employment
Income
Income levels sit below national averages according to AreaSearch assessment
AreaSearch's latest postcode level ATO data for financial year 2022 shows that median income in Donnybrook - Balingup SA2 is $47,446 and average income stands at $61,440. This contrasts with Rest of WA's figures of a median income of $57,323 and an average income of $71,163. Based on Wage Price Index growth of 14.2% since financial year 2022, current estimates as of September 2025 would be approximately $54,183 (median) and $70,164 (average). From the 2021 Census, household income in Donnybrook - Balingup falls between the 20th and 22nd percentiles nationally. Income brackets indicate that 27.0% of the population falls within the $1,500 - 2,999 range, aligning with the surrounding region where this cohort represents 31.1%. After housing costs, 86.0% of income remains, ranking at the 25th percentile nationally. The area's SEIFA income ranking places it in the 4th decile.
Frequently Asked Questions - Income
Housing
Donnybrook - Balingup is characterized by a predominantly suburban housing profile, with ownership patterns similar to the broader region
In Donnybrook-Balingup, as per the latest Census, 96.9% of dwellings were houses, with the remaining 3.0% comprising semi-detached homes, apartments, and other types. This is similar to Non-Metro WA's figures of 95.2% houses and 4.8% other dwellings. Home ownership in Donnybrook-Balingup stood at 45.1%, with mortgaged properties at 39.2% and rented ones at 15.7%. The median monthly mortgage repayment was $1,562, higher than Non-Metro WA's average of $1,387. The median weekly rent in the area was $290, compared to Non-Metro WA's $250. Nationally, Donnybrook-Balingup's mortgage repayments were lower at $1,562 versus Australia's average of $1,863, and rents were also lower at $290 compared to the national figure of $375.
Frequently Asked Questions - Housing
Household Composition
Donnybrook - Balingup has a typical household mix, with a higher-than-average median household size
Family households constitute 73.4% of all households, including 25.9% couples with children, 38.6% couples without children, and 7.9% single parent families. Non-family households account for the remaining 26.6%, with lone person households at 24.5% and group households comprising 2.1%. The median household size is 2.4 people, larger than the Rest of WA average of 2.3.
Frequently Asked Questions - Households
Local Schools & Education
Educational outcomes in Donnybrook - Balingup fall within the lower quartile nationally, indicating opportunities for improvement in qualification attainment
The area's university qualification rate is 17.4%, significantly lower than the Australian average of 30.4%. This disparity presents both a challenge and an opportunity for targeted educational initiatives. Bachelor degrees are the most prevalent at 12.5%, followed by postgraduate qualifications (2.6%) and graduate diplomas (2.3%). Vocational credentials are also prominent, with 41.4% of residents aged 15 and above holding such qualifications - advanced diplomas comprise 10.9% and certificates make up 30.5%.
A total of 24.2% of the population is actively engaged in formal education, including 10.3% in primary education, 7.6% in secondary education, and 1.4% pursuing tertiary education.
Frequently Asked Questions - Education
Schools Detail
Nearby Services & Amenities
Transport
Transport servicing is very low compared to other areas nationally based on assessment of service frequency, route connectivity and accessibility
The analysis shows eight active public transport stops in Donnybrook-Balingup area, all of which are bus stops. These stops are served by four different routes that together offer thirty weekly passenger trips. The accessibility to these services is rated as limited, with residents typically located 1903 meters away from the nearest stop.
On average, there are four trips per day across all routes, resulting in approximately three weekly trips per individual stop.
Frequently Asked Questions - Transport
Transport Stops Detail
Health
Health performance in Donnybrook - Balingup is lower than average with common health conditions somewhat prevalent across both younger and older age cohorts
Donnybrook-Balingup faces significant health challenges with common health conditions prevalent across both younger and older age cohorts.
The rate of private health cover is relatively low at approximately 51% of the total population (~3,380 people). The most common medical conditions are arthritis and mental health issues, impacting 10.5% and 8.3% of residents respectively. Sixty-six point one percent declared themselves completely clear of medical ailments compared to 65.4% across Rest of WA. The area has 22.9% of residents aged 65 and over (1,528 people). Health outcomes among seniors are particularly strong, performing better than the general population in health metrics.
Frequently Asked Questions - Health
Cultural Diversity
Donnybrook - Balingup ranks below the Australian average when compared to other local markets across a number of language and cultural background related metrics
Donnybrook-Balingup was found to have below average cultural diversity, with 80.2% of its population born in Australia and 88.3% being citizens. English is the language spoken at home by 94.9% of residents. Christianity is the predominant religion, comprising 44.3% of the population.
Judaism, however, is overrepresented at 0.1%, compared to 0.0% in the rest of WA. The top three ancestry groups are English (35.7%), Australian (28.6%), and Scottish (8.3%). Notably, Dutch (1.7%) and Italian (4.9%) ethnicities are overrepresented compared to regional averages of 1.6% and 4.3%, respectively. New Zealand ethnicity is also equally represented at 0.8%.
Frequently Asked Questions - Diversity
Age
Donnybrook - Balingup hosts an older demographic, ranking in the top quartile nationwide
Donnybrook-Balingup's median age is 48 years, notably higher than Rest of WA's 40 and national norm of 38. The 65-74 cohort is over-represented at 14.6%, compared to Rest of WA's average, while the 15-24 cohort is under-represented at 8.3%. This concentration of the 65-74 age group is well above the national average of 9.4%. Between 2021 and present, younger residents have decreased the median age by 1 year to 48. The 25 to 34 age group grew from 8.1% to 10.7%, while the 35 to 44 cohort increased from 11.1% to 12.3%. Conversely, the 45 to 54 cohort declined from 13.7% to 11.8%, and the 65 to 74 group dropped from 15.9% to 14.6%. By 2041, population forecasts indicate significant demographic changes for Donnybrook-Balingup. The 25 to 34 cohort is projected to grow by 50%, adding 353 residents to reach 1,066. Conversely, population declines are forecasted for the 75 to 84 and 85+ age groups.
