Chart Color Schemes
This analysis uses ABS Statistical Areas Level 2 (SA2) boundaries, which can materially differ from Suburbs and Localities (SAL) even when sharing similar names.
SA2 boundaries are defined by the Australian Bureau of Statistics and are designed to represent communities for statistical reporting (e.g., census and ERP).
Suburbs and Localities (SAL) represent commonly-used suburb/locality names (postal-style areas) and may use different geographic boundaries. For comprehensive analysis, consider reviewing both boundary types if available.
est. as @ -- *
ABS ERP | -- people | --
2021 Census | -- people
Sales Activity
Curious about local property values? Filter the chart to assess the volume and appreciation (including resales) trends and regional comparisons, or scroll to the map below view this information at an individual property level.
Find a Recent Sale
Sales Detail
Population
Population growth drivers in Capel are above average based on AreaSearch's ranking of recent, and medium to long-term trends
Capel's population, as per AreaSearch's analysis, stands at 6,006 as of November 2025. This figure indicates a rise of 549 people (10.1%) since the 2021 Census, which recorded a population of 5,457. The increase is inferred from the estimated resident population of 5,909 in June 2024 and an additional 50 validated new addresses post-Census date. This results in a density ratio of 11.8 persons per square kilometer. Capel's growth rate of 10.1% since the 2021 Census exceeds the national average of 8.9%, positioning it as a growth leader in its SA3 area. The population growth was driven by balanced factors across natural increase and migration patterns.
AreaSearch uses ABS/Geoscience Australia projections for each SA2 area, released in 2024 with a base year of 2022. For areas not covered, it utilises ABS's latest Greater Capital Region projections (released in 2023, based on 2022 data) to estimate growth post-2032. Future population projections suggest an above median growth for regional areas nationally, with Capel expected to expand by 845 persons to reach 6,851 by 2041, reflecting a total increase of 12.4% over the 17 years.
Frequently Asked Questions - Population
Development
AreaSearch assessment of residential development activity positions Capel among the top 25% of areas assessed nationwide
Capel has recorded approximately 36 residential properties granted approval annually. Over the past five financial years, from FY-21 to FY-25, around 181 homes were approved, with an additional 21 approved so far in FY-26. On average, each dwelling built over these five years attracted about 2.6 new residents per year, indicating healthy demand that supports property values.
The average construction cost value of new homes is approximately $274,000. In the current financial year, around $4.9 million in commercial approvals have been registered, suggesting limited focus on commercial development. Capel maintains similar construction rates relative to the rest of WA, preserving market equilibrium consistent with surrounding areas.
Recent building activity consists entirely of detached dwellings, preserving the area's low density nature and attracting space-seeking buyers. With around 330 people per approval, Capel reflects a transitioning market. According to the latest AreaSearch quarterly estimate, Capel is projected to add approximately 748 residents by 2041. Based on current development patterns, new housing supply should readily meet demand, offering good conditions for buyers and potentially facilitating population growth beyond current projections.
Frequently Asked Questions - Development
Infrastructure
Capel has limited levels of nearby infrastructure activity, ranking in the 6thth percentile nationally
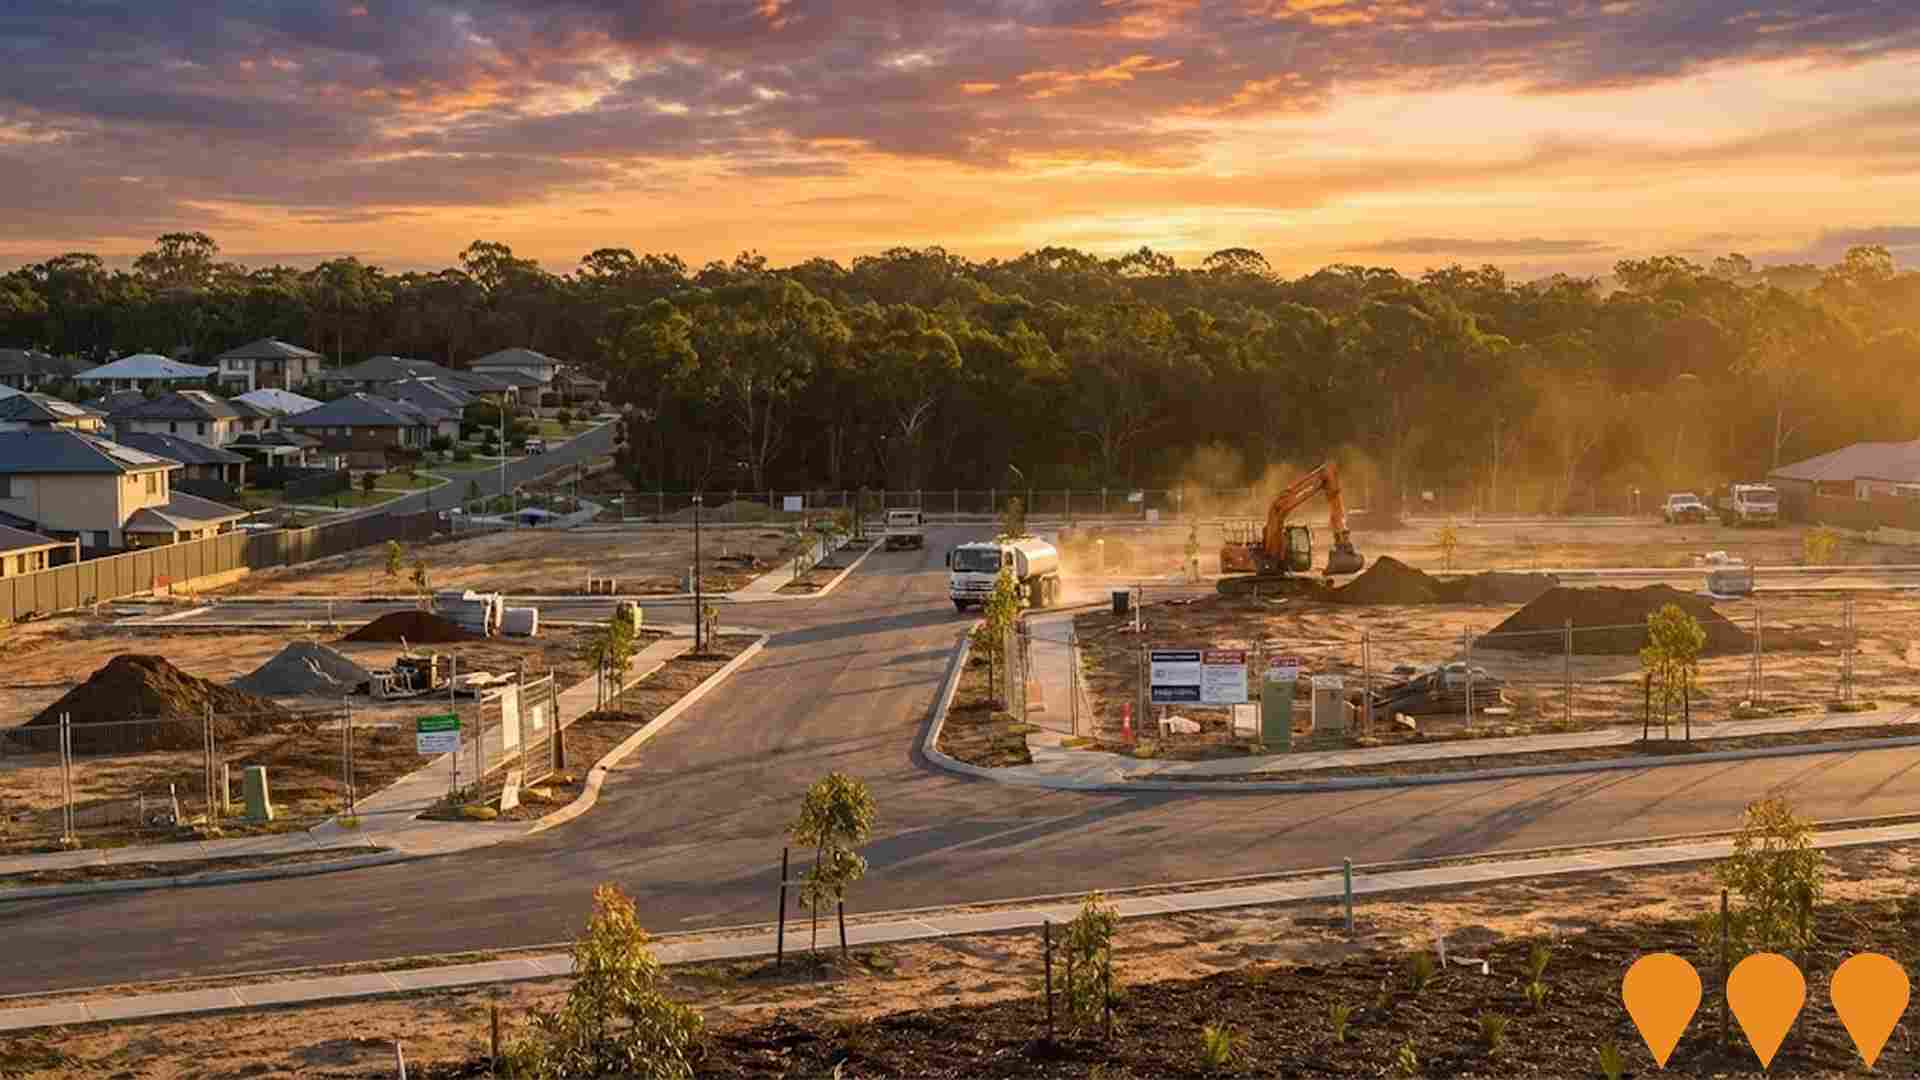
Changes in local infrastructure significantly impact an area's performance. AreaSearch has identified 27 projects likely to affect this region. Notable ones include The Acreage Estate Dalyellup, Tuart Forest Primary School, Bethanie Dalyellup Aged Care Facility, and ALDI Dalyellup Supermarket. The following list details those most relevant.
Professional plan users can use the search below to filter and access additional projects.
INFRASTRUCTURE SEARCH
 Denotes AI-based impression for illustrative purposes only, not to be taken as definitive under any circumstances. Please follow links and conduct other investigations from the project's source for actual imagery. Developers and project owners wishing us to use original imagery please Contact Us and we will do so.
Frequently Asked Questions - Infrastructure
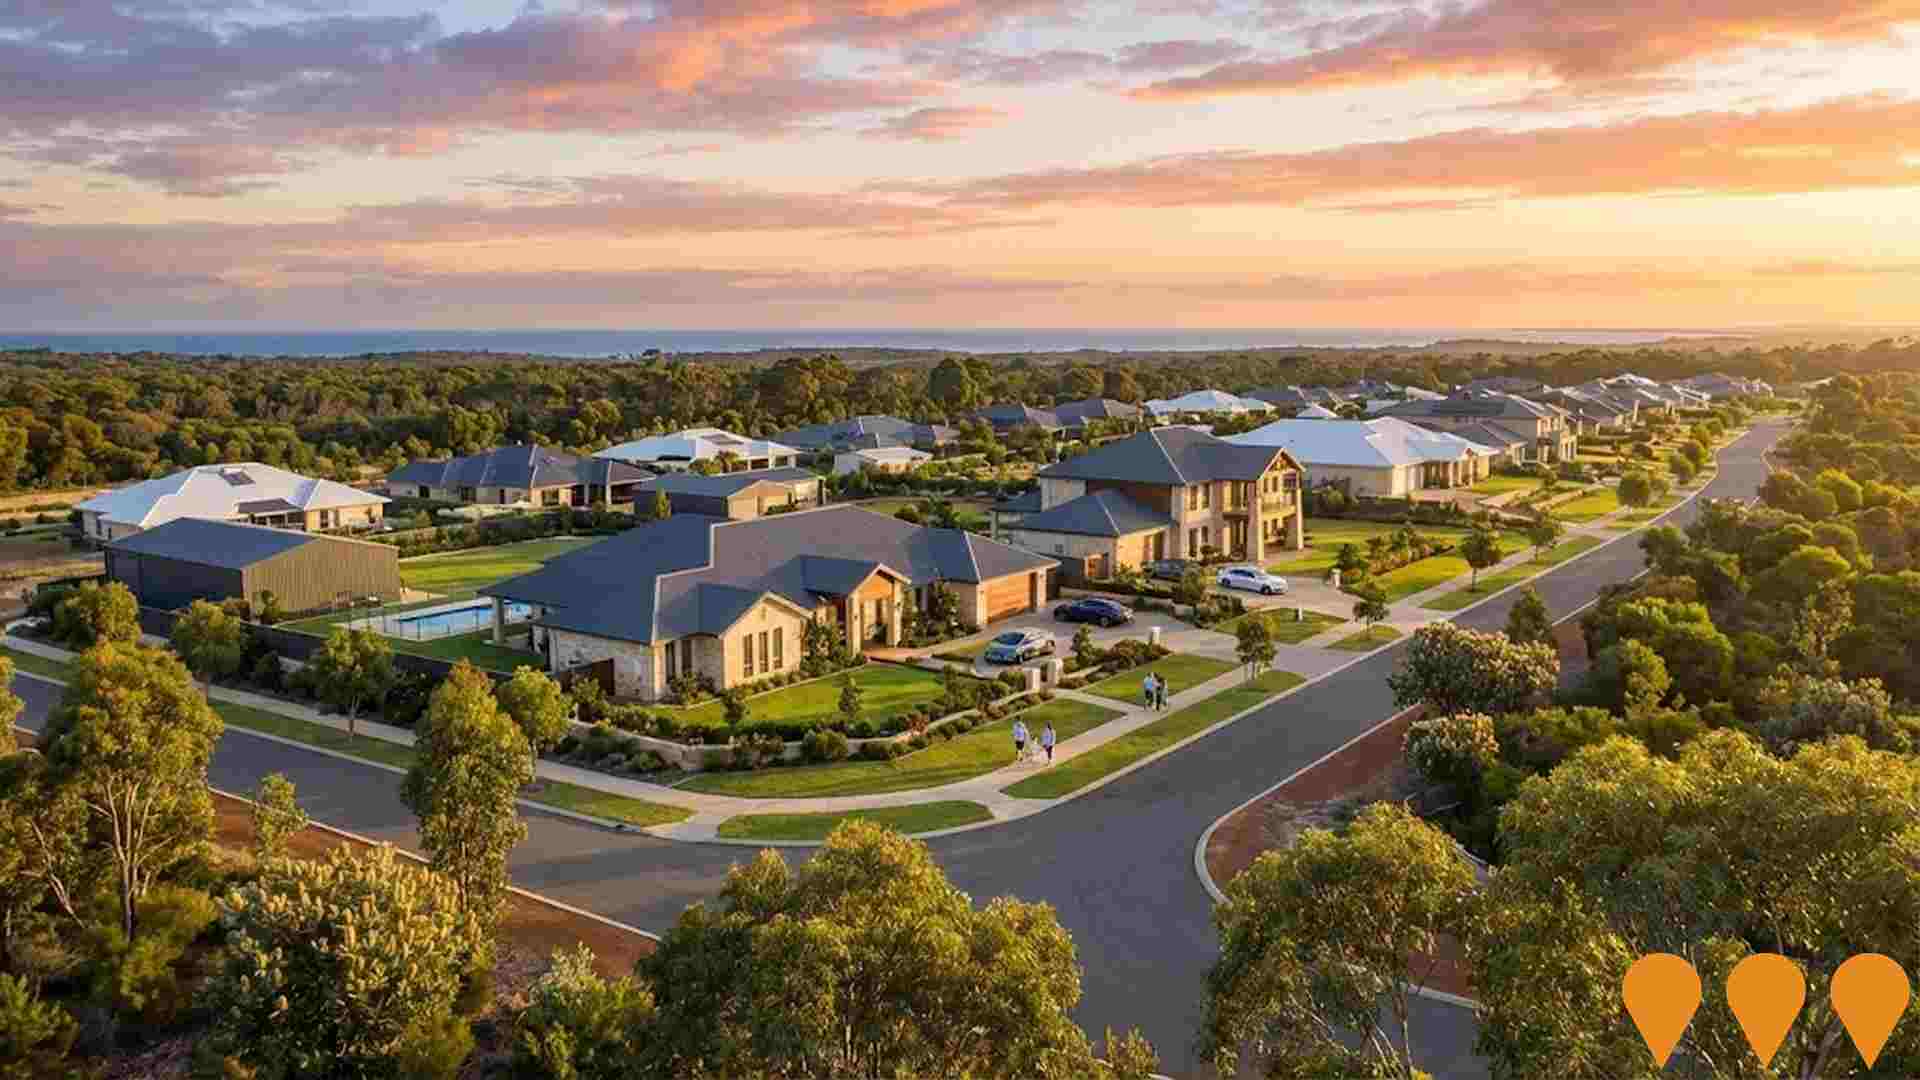
Usher Residential Land Release
A 55ha zoned residential land release in Usher, Bunbury, that will be released to market for an incoming developer. The site's planning has been reviewed, and the Water Corporation has confirmed funding for required upgrades. The project has the potential to provide more than 300 new residential lots.
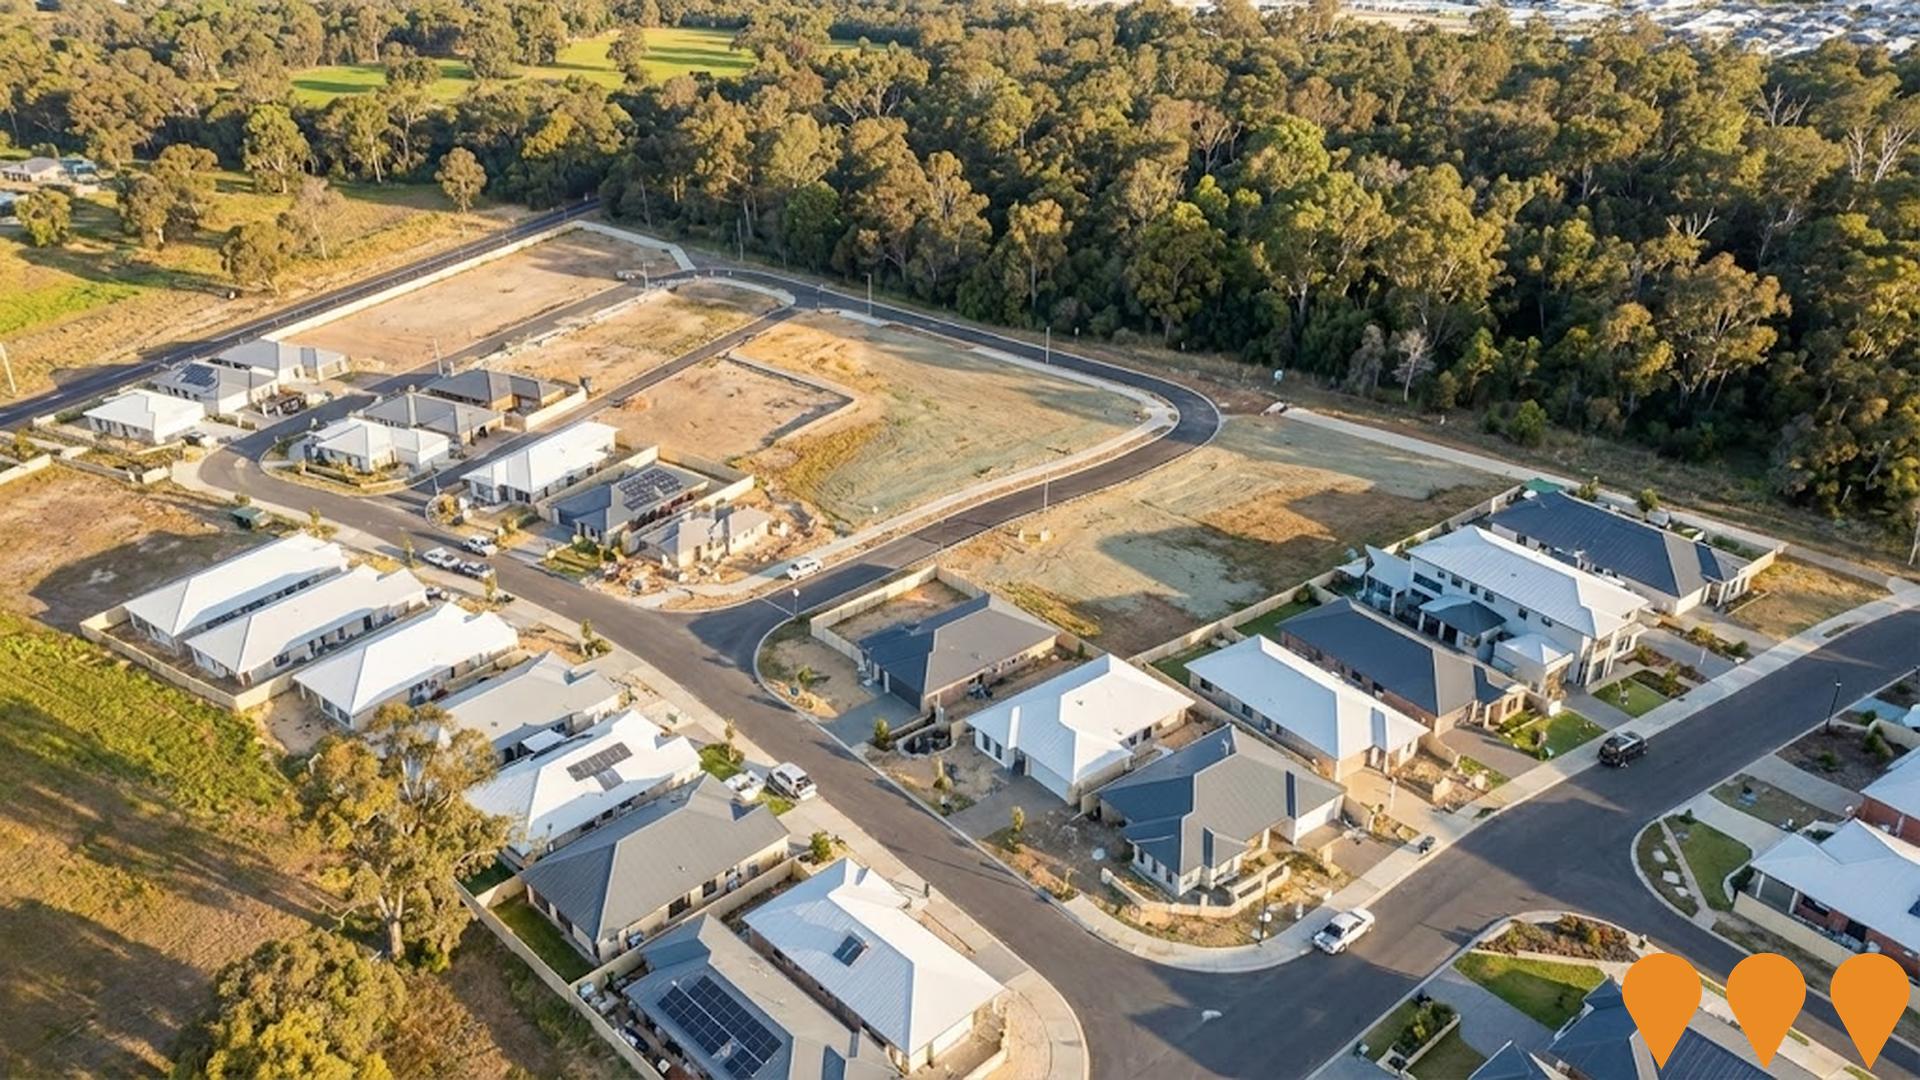
ALDI Dalyellup Supermarket
A new ALDI supermarket development in the Dalyellup town centre, strategically located on the corner of Portobello Road and Grafton Lane. The development will provide additional retail options and grocery competition for the local community, complementing existing Woolworths and Coles supermarkets in the area. ALDI aims to bring their unique discount shopping experience to serve the growing residential suburb of Dalyellup.
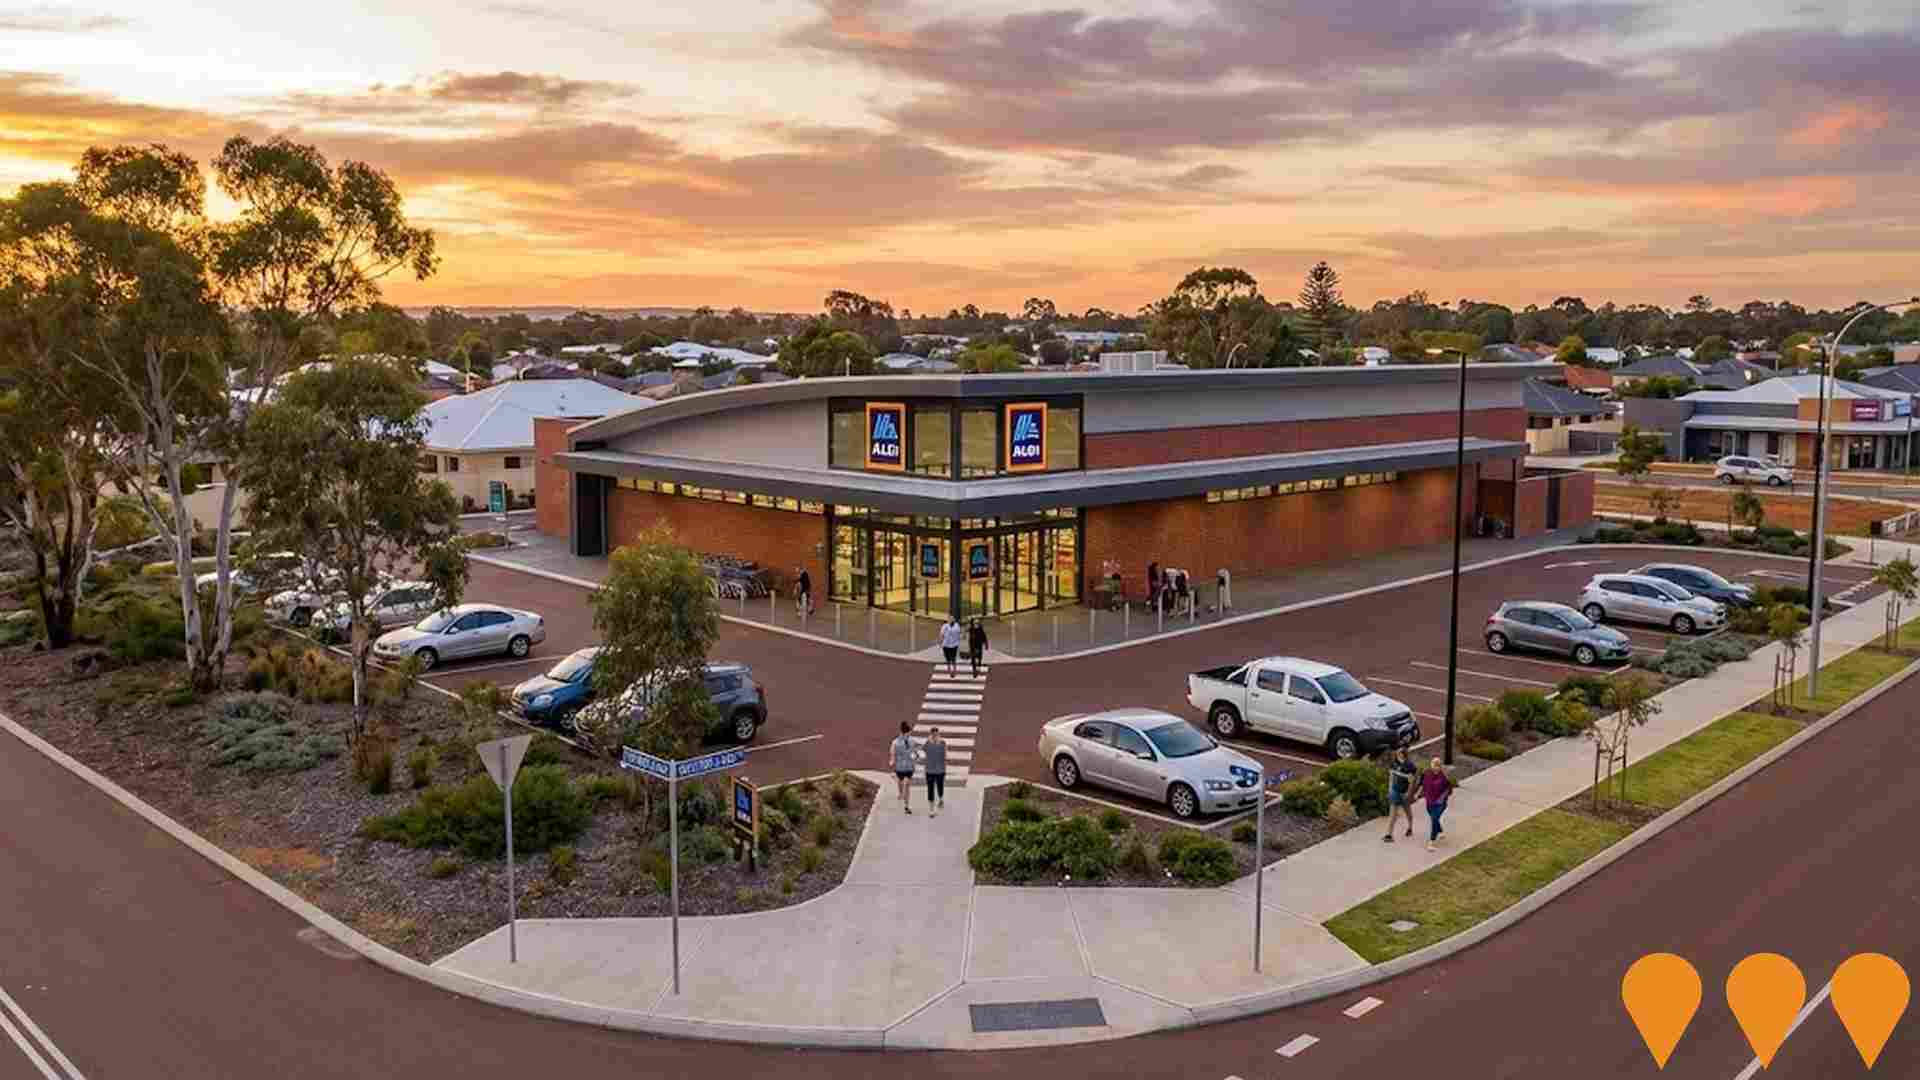
Dalyellup Village
A new Coles supermarket anchored shopping centre featuring a full-line Coles Supermarket (circa 3205m2), Liquorland, and three specialty retail tenancies totalling 323m2 including a food and beverage tenancy (circa 150sqm) to service the local community in the booming residential suburb of Dalyellup, approximately 10 kilometres south of Bunbury City Centre.
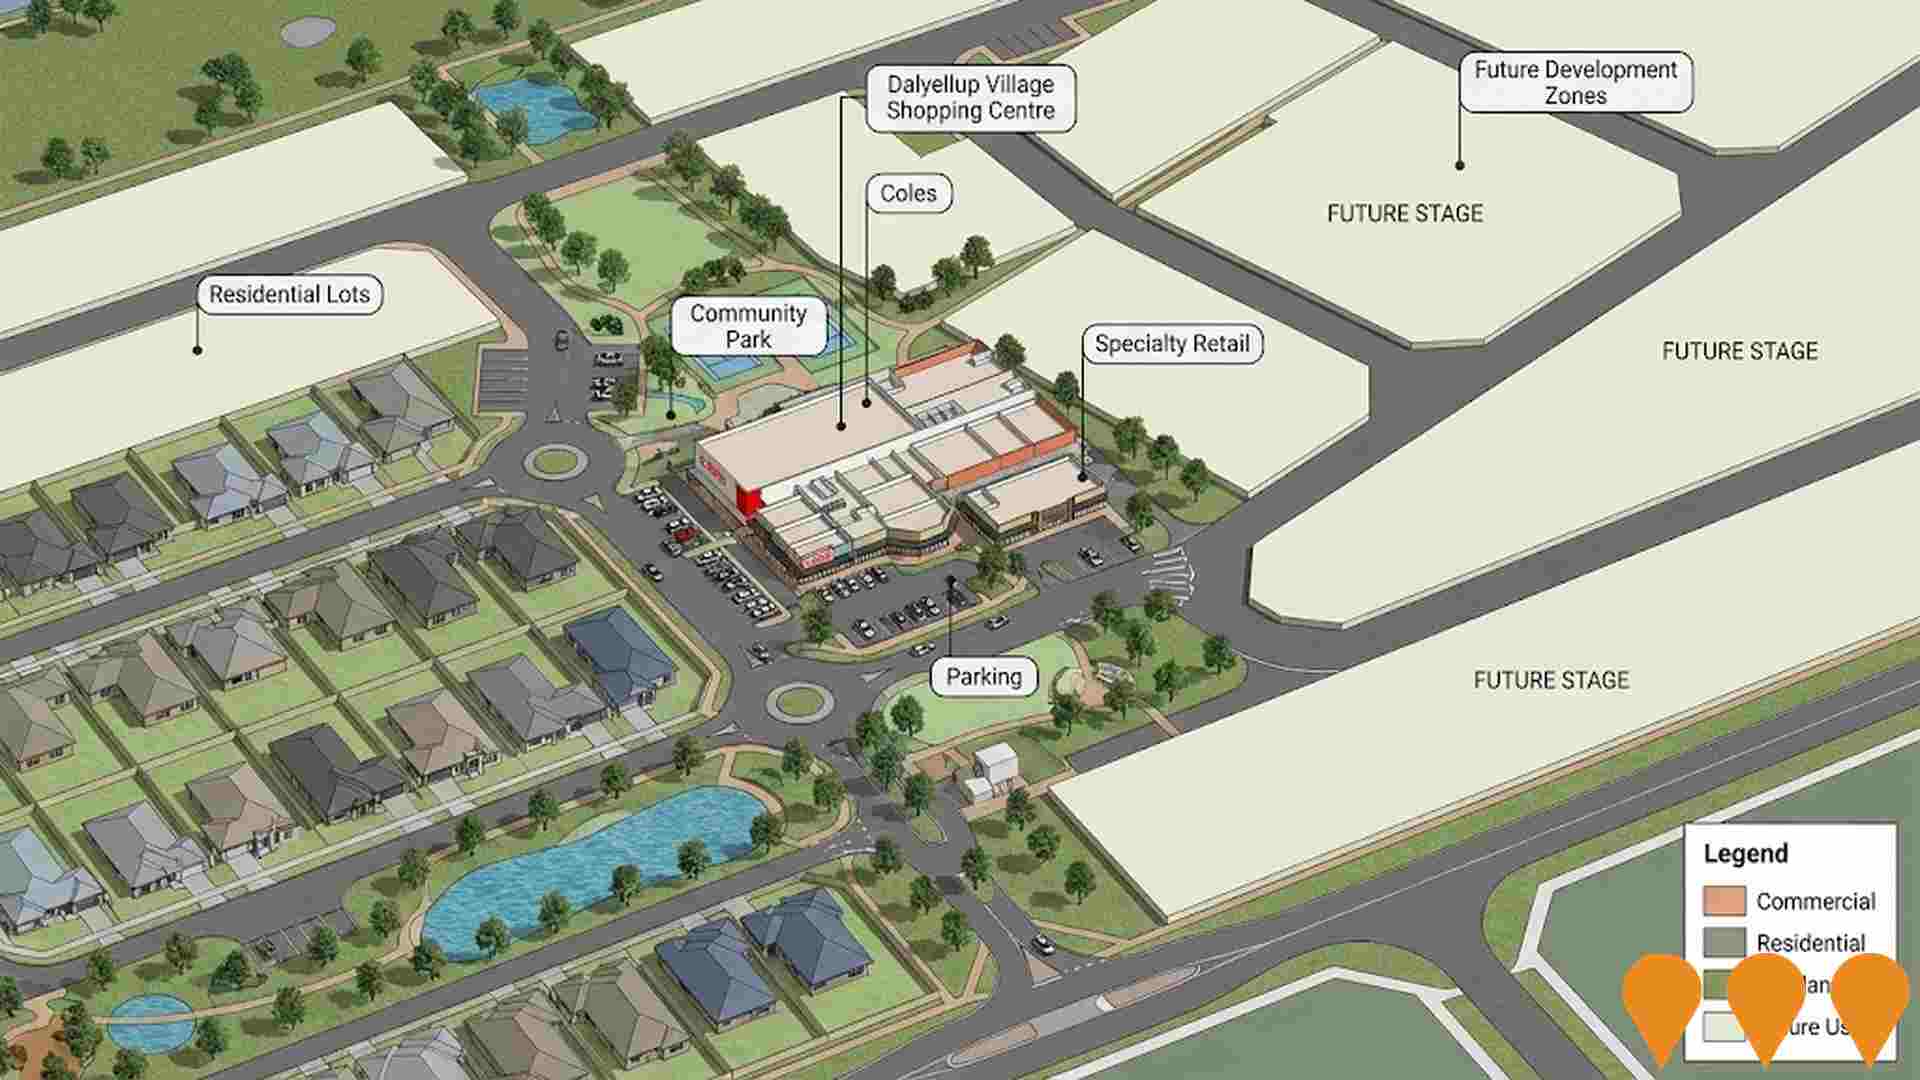
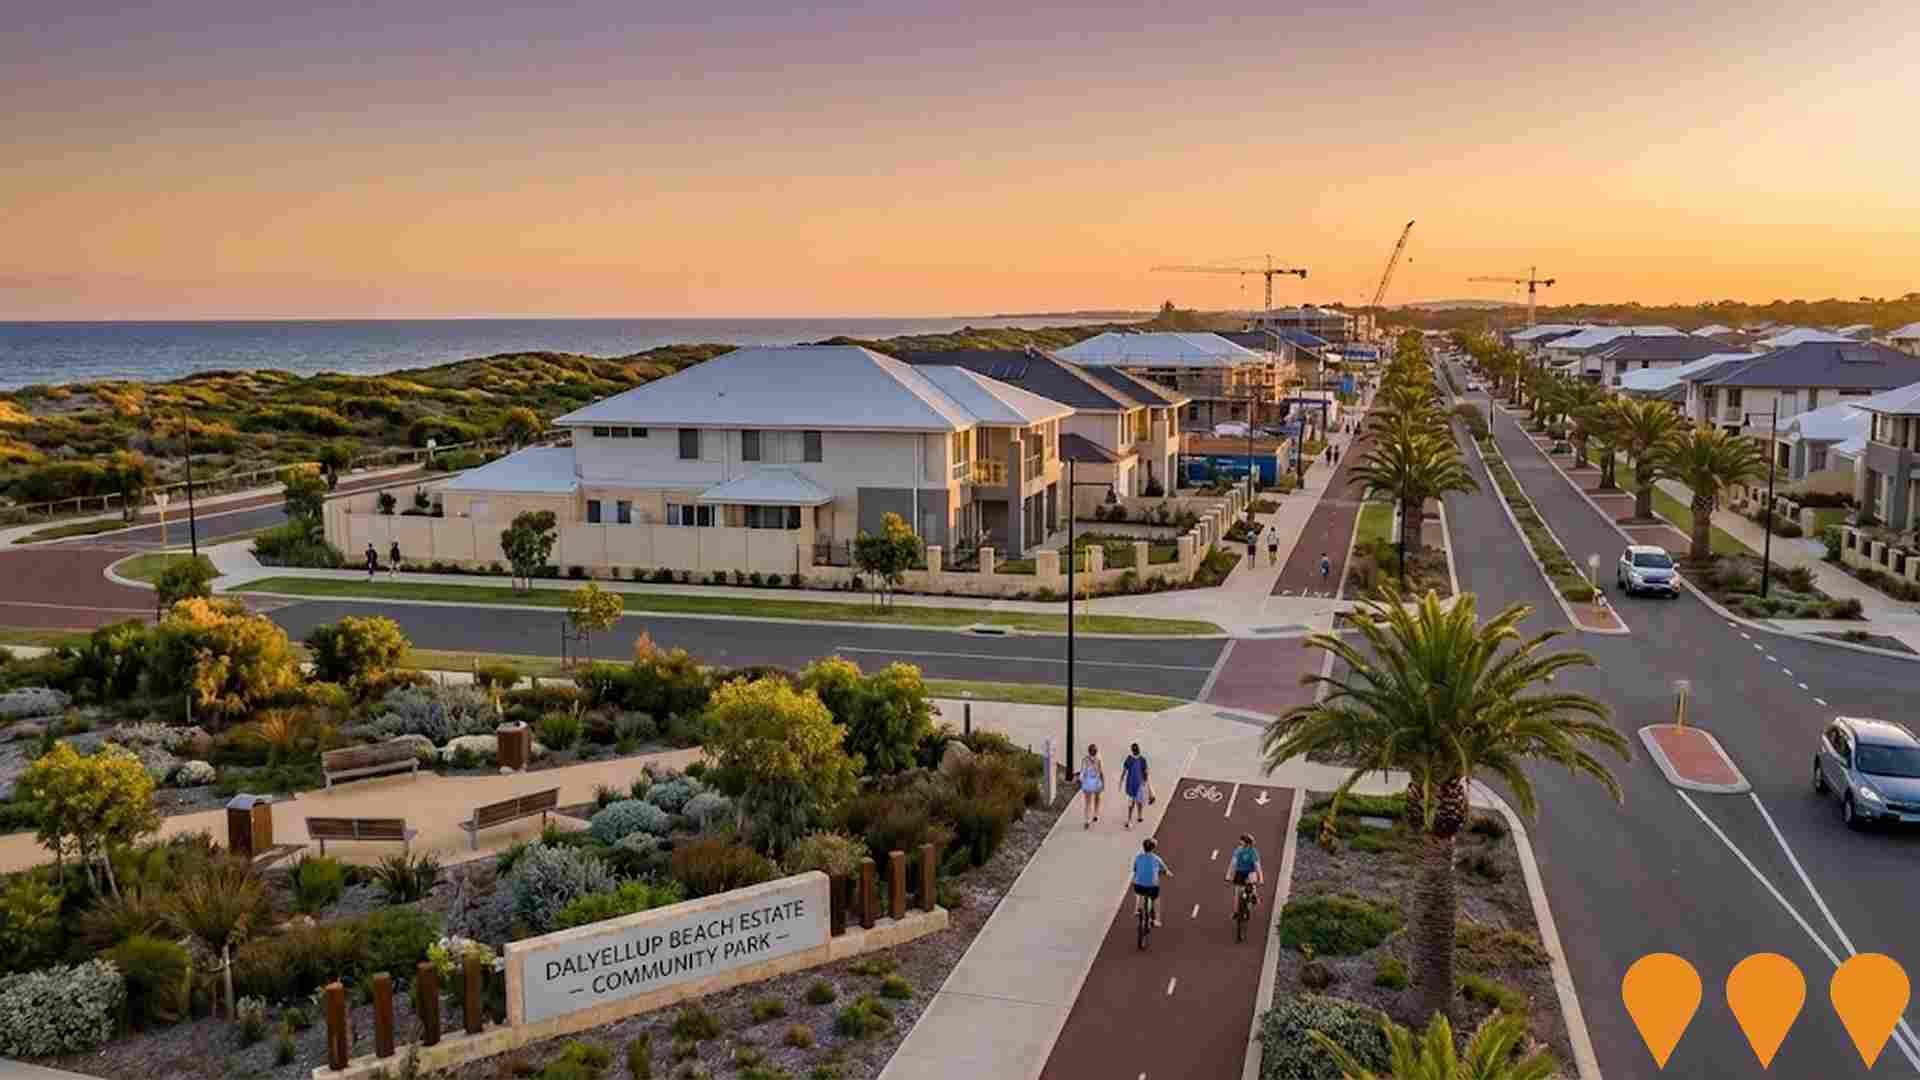
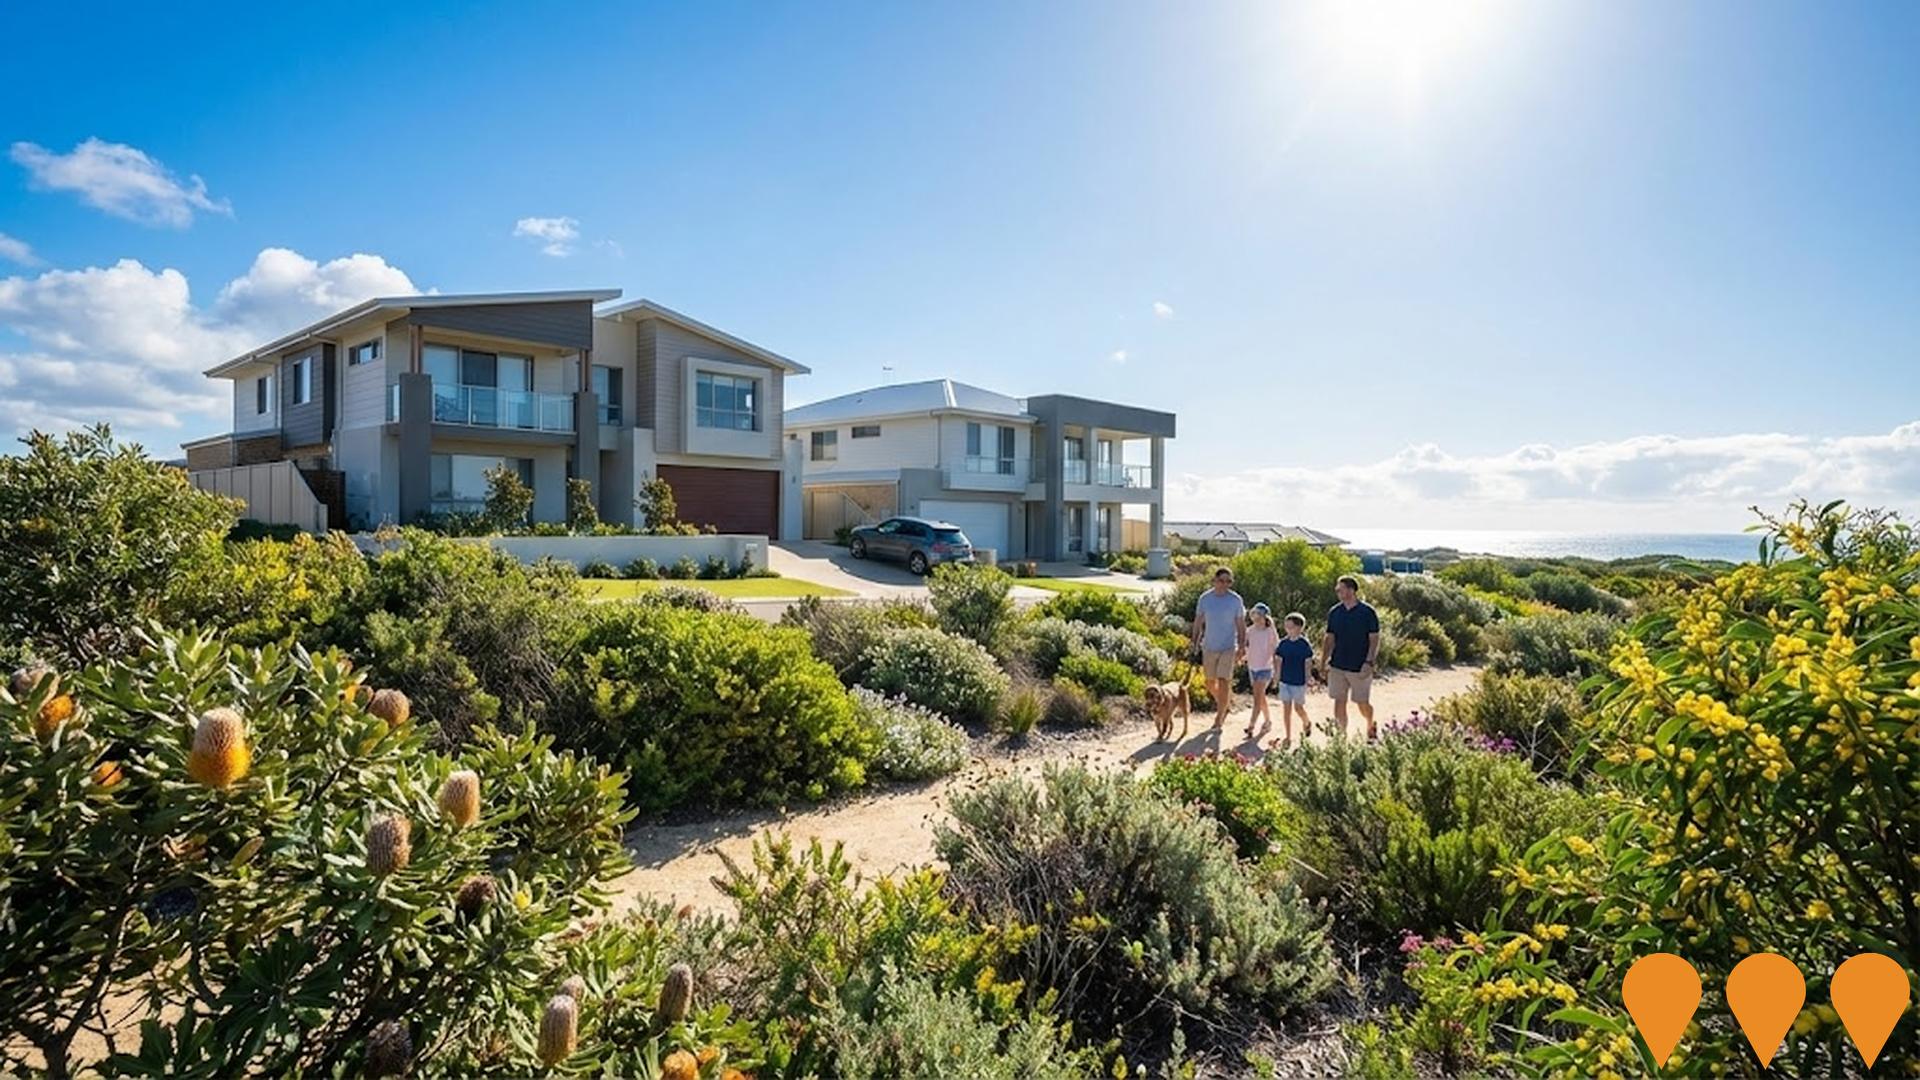
Dalyellup Beach Estate - Wildwood Precinct
The newest premium precinct within the award-winning Dalyellup Beach masterplanned community. Wildwood offers 146 homesites positioned just 500 metres from the beach, bordered by regional open space to the north and sitting beside the Maidment Parade parklands. This premium residential estate development features sustainable housing, natural coastal settings, and community facilities, providing modern living with proximity to beaches and nature reserves.
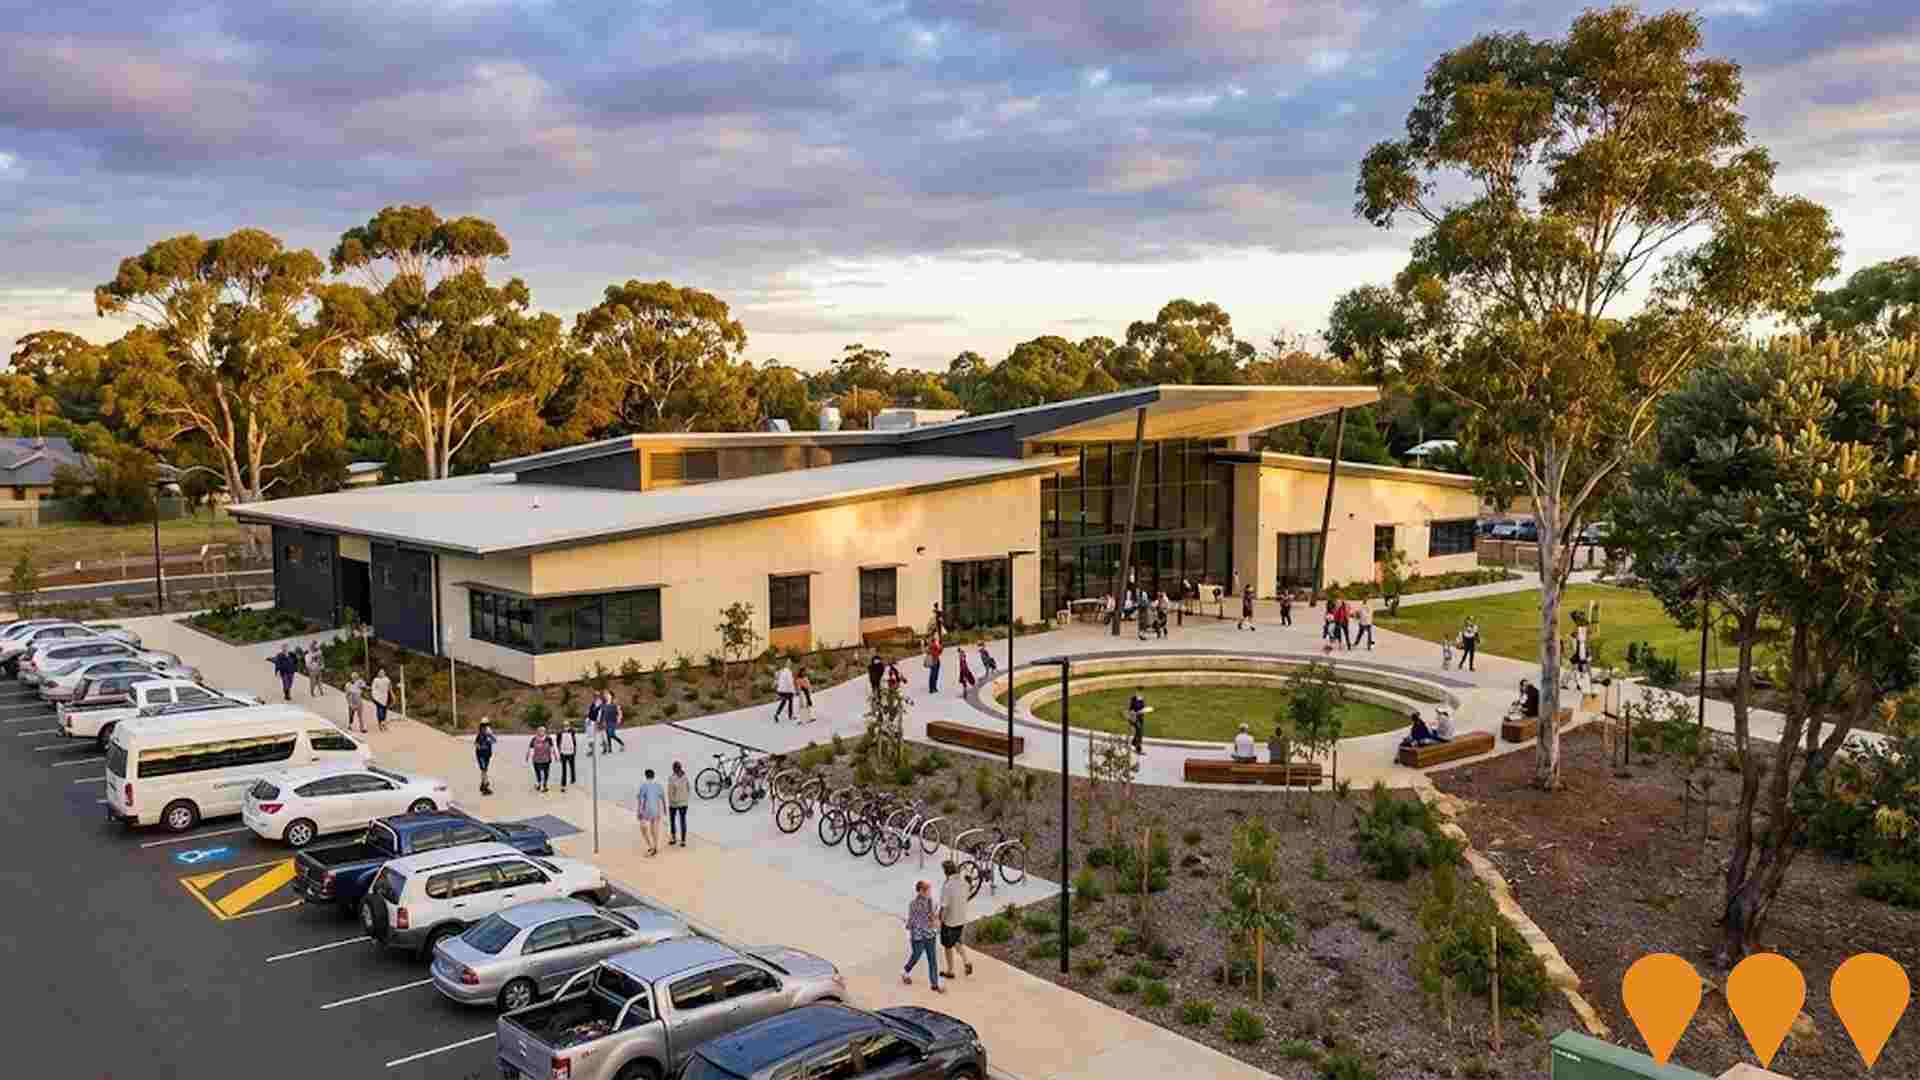
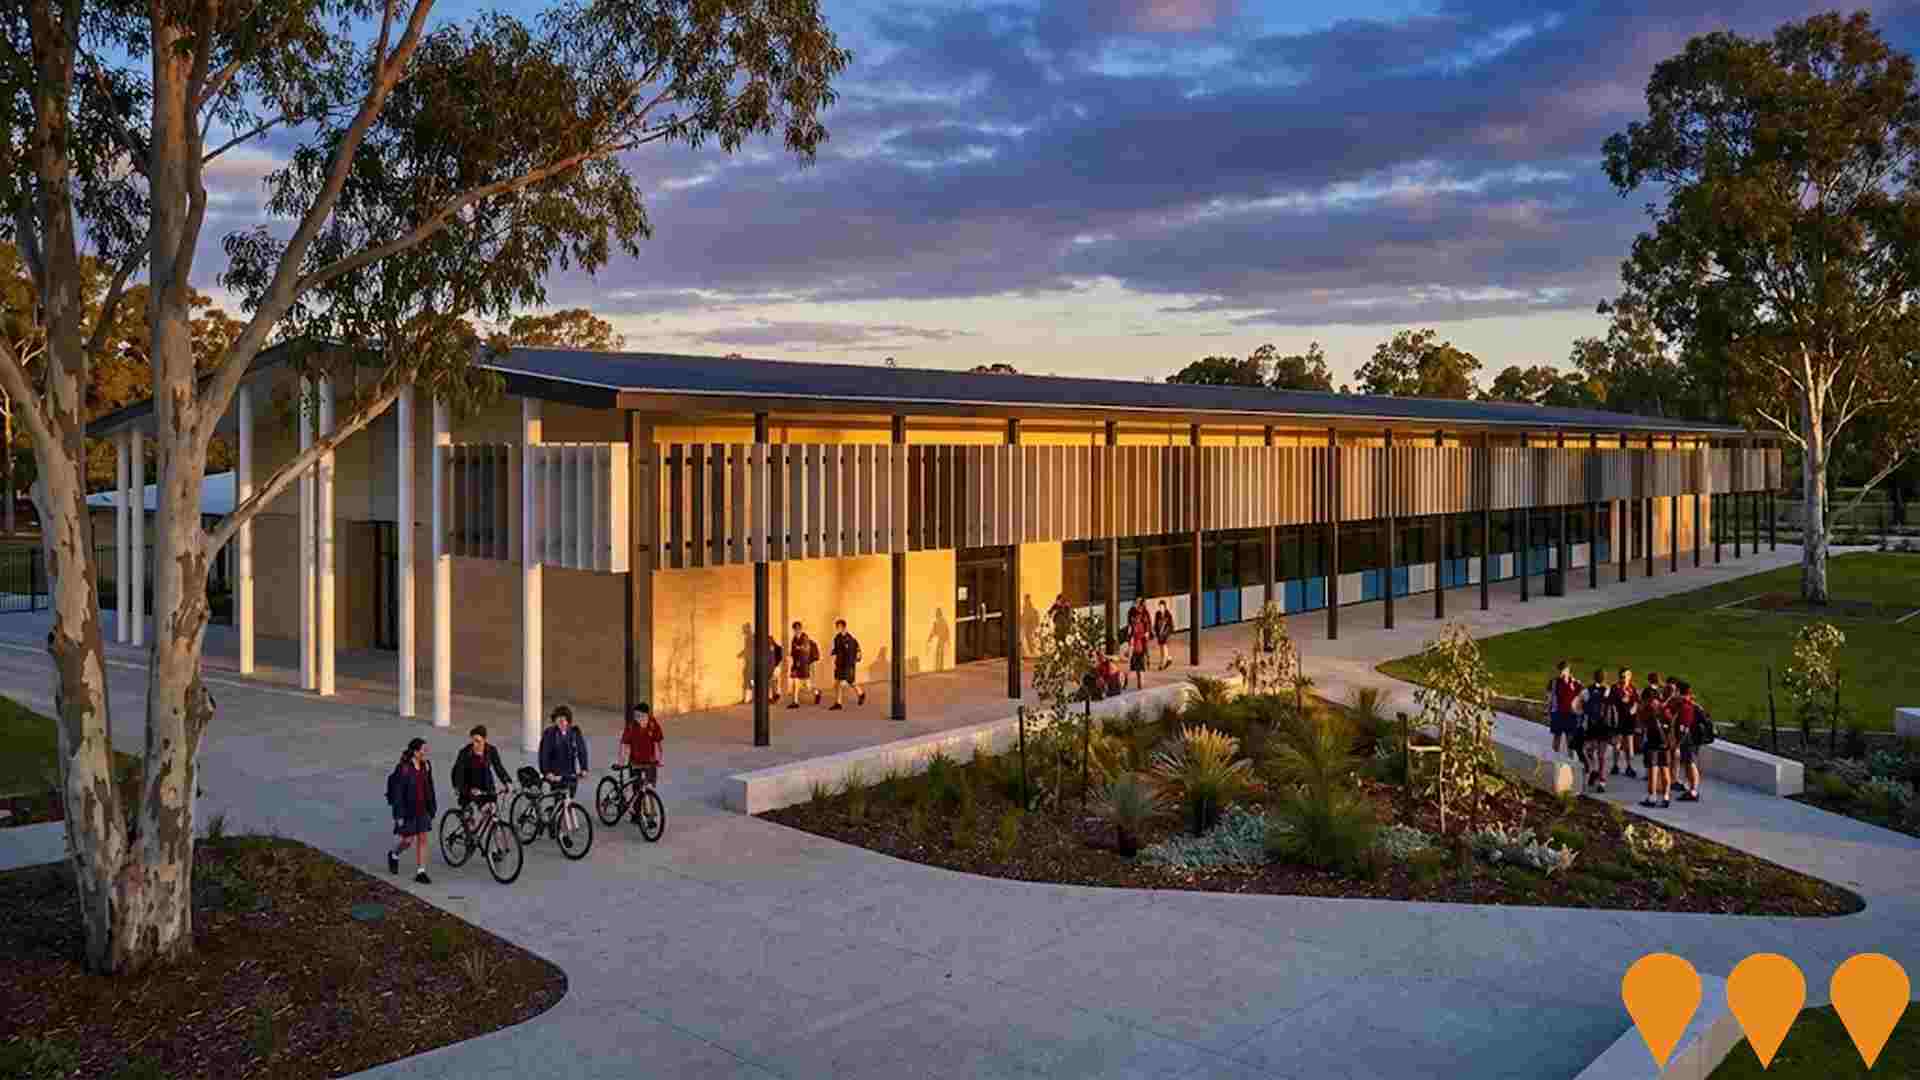
Dalyellup College
A secondary school serving Years 7-12 for the Dalyellup community. The college provides comprehensive secondary education with modern facilities, technology labs, and sporting amenities to support students transitioning to higher education and career pathways.
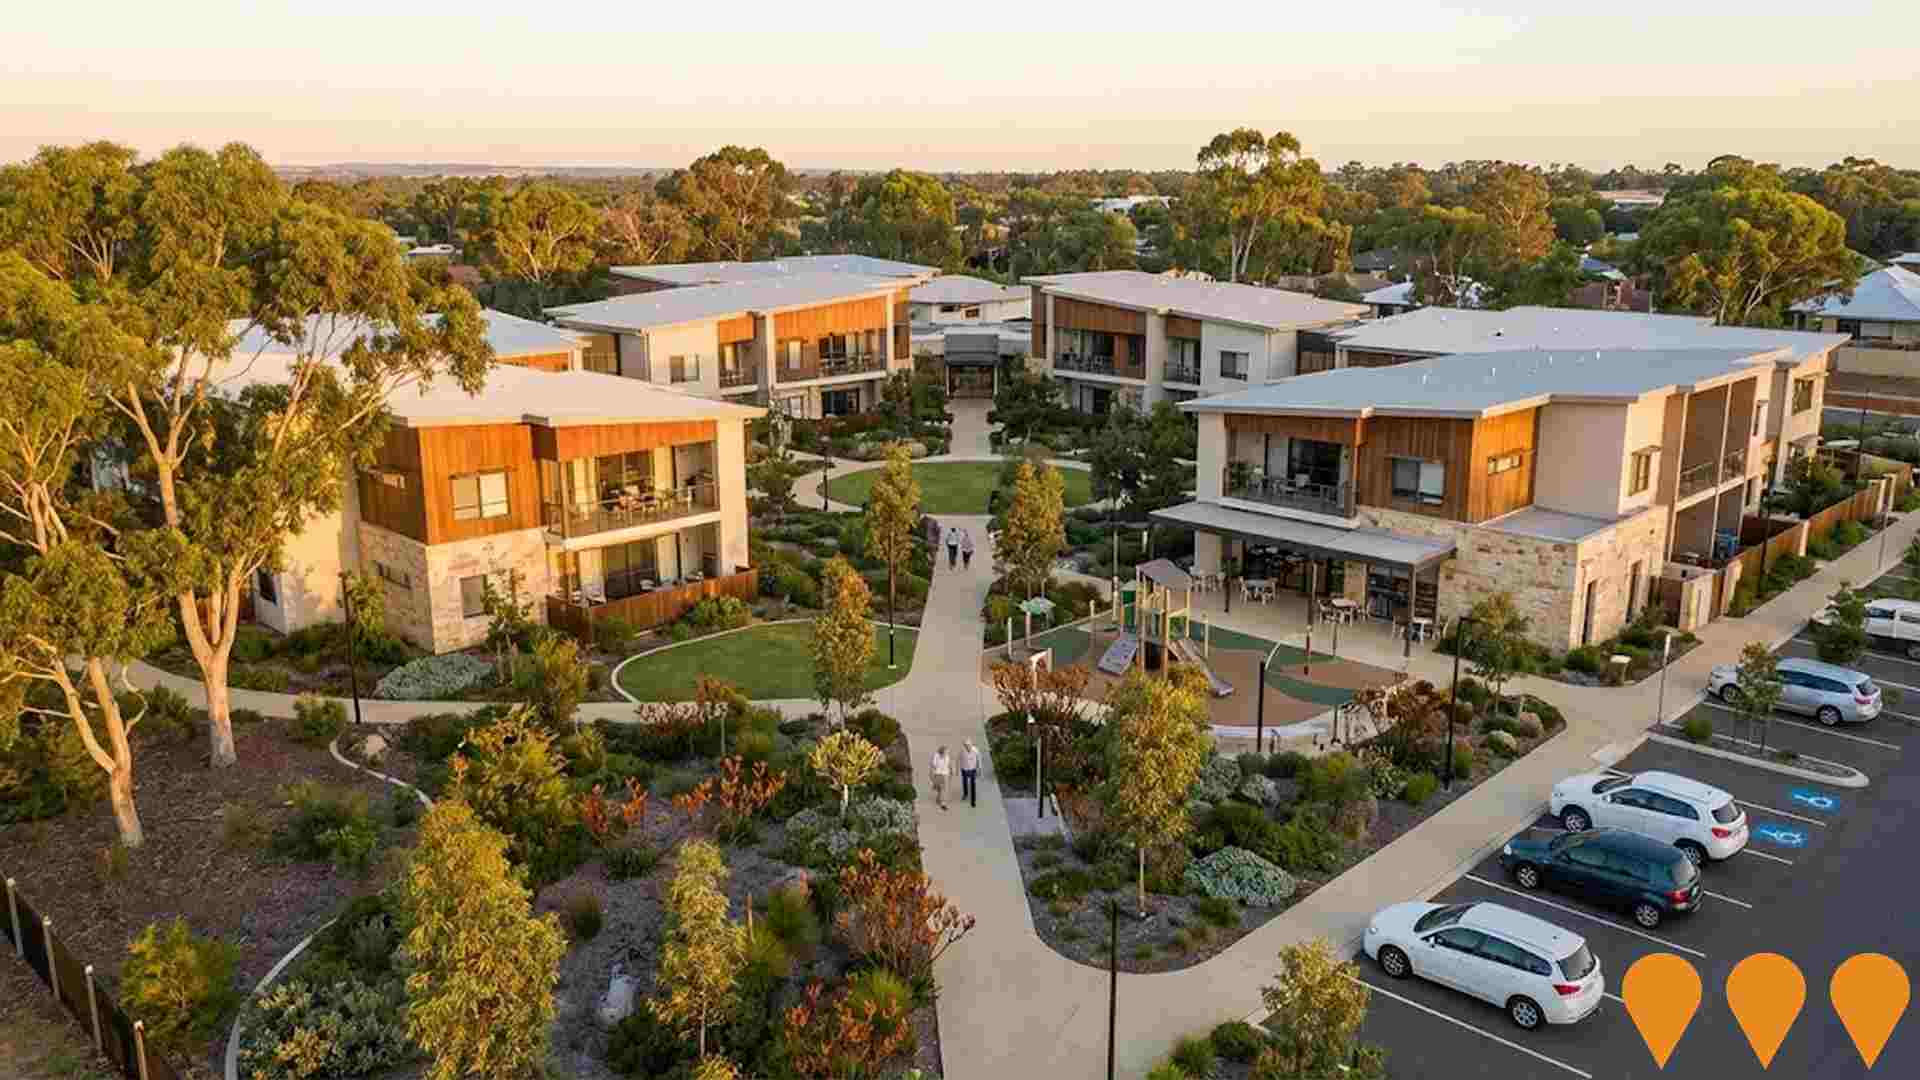
Bethanie Dalyellup Aged Care Facility
A state-of-the-art $28 million, 120-bed aged care facility comprising six small houses with approximately 20 rooms each (many with balconies). Features an intergenerational exercise and play area, cafe, bar, hairdresser, wellness rooms, and large multipurpose room. Provides 24-hour care for diverse needs including dementia and palliative care.
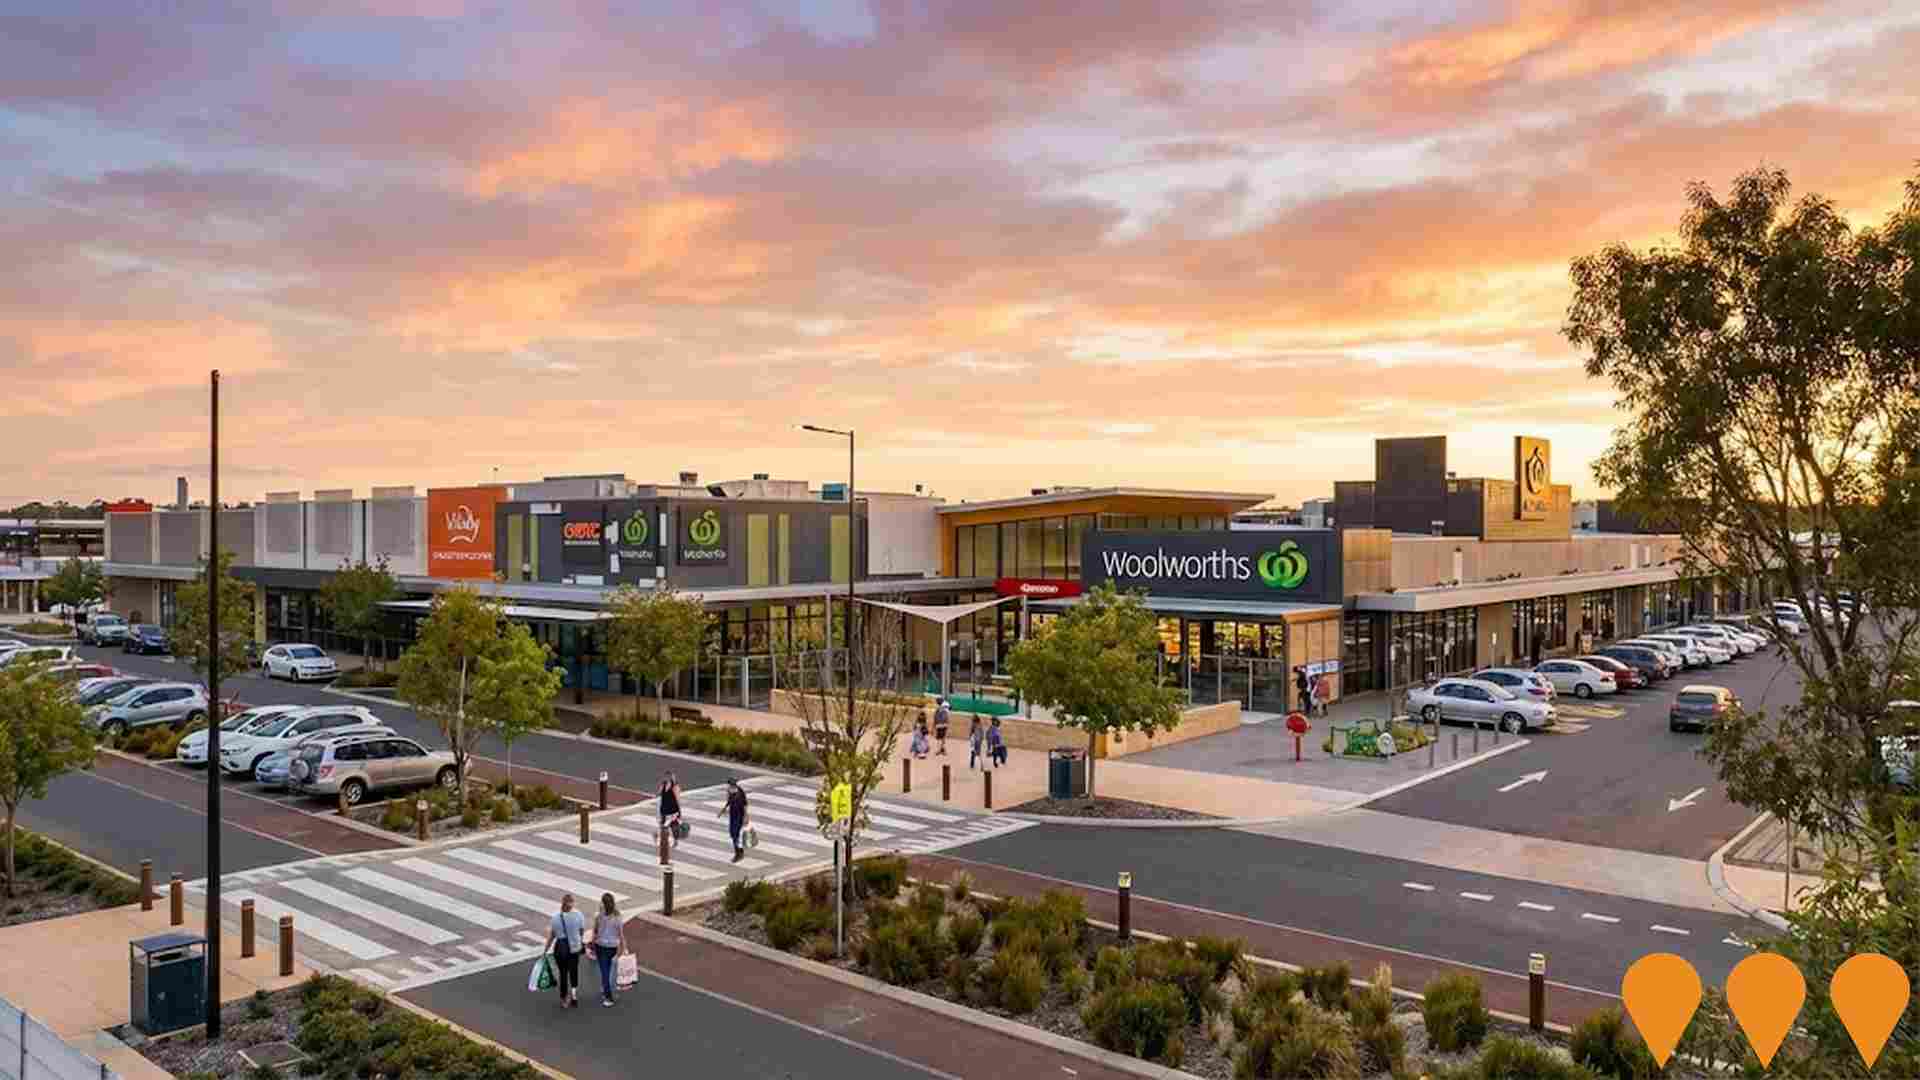
Dalyellup Shopping Centre
A modern neighbourhood shopping centre anchored by Woolworths supermarket, serving the daily needs of the Dalyellup community. The 6,469 sqm centre includes 1 mini-major, 14 specialty shops, 2 kiosks, plus dining options and services, providing convenient local shopping and community gathering space.
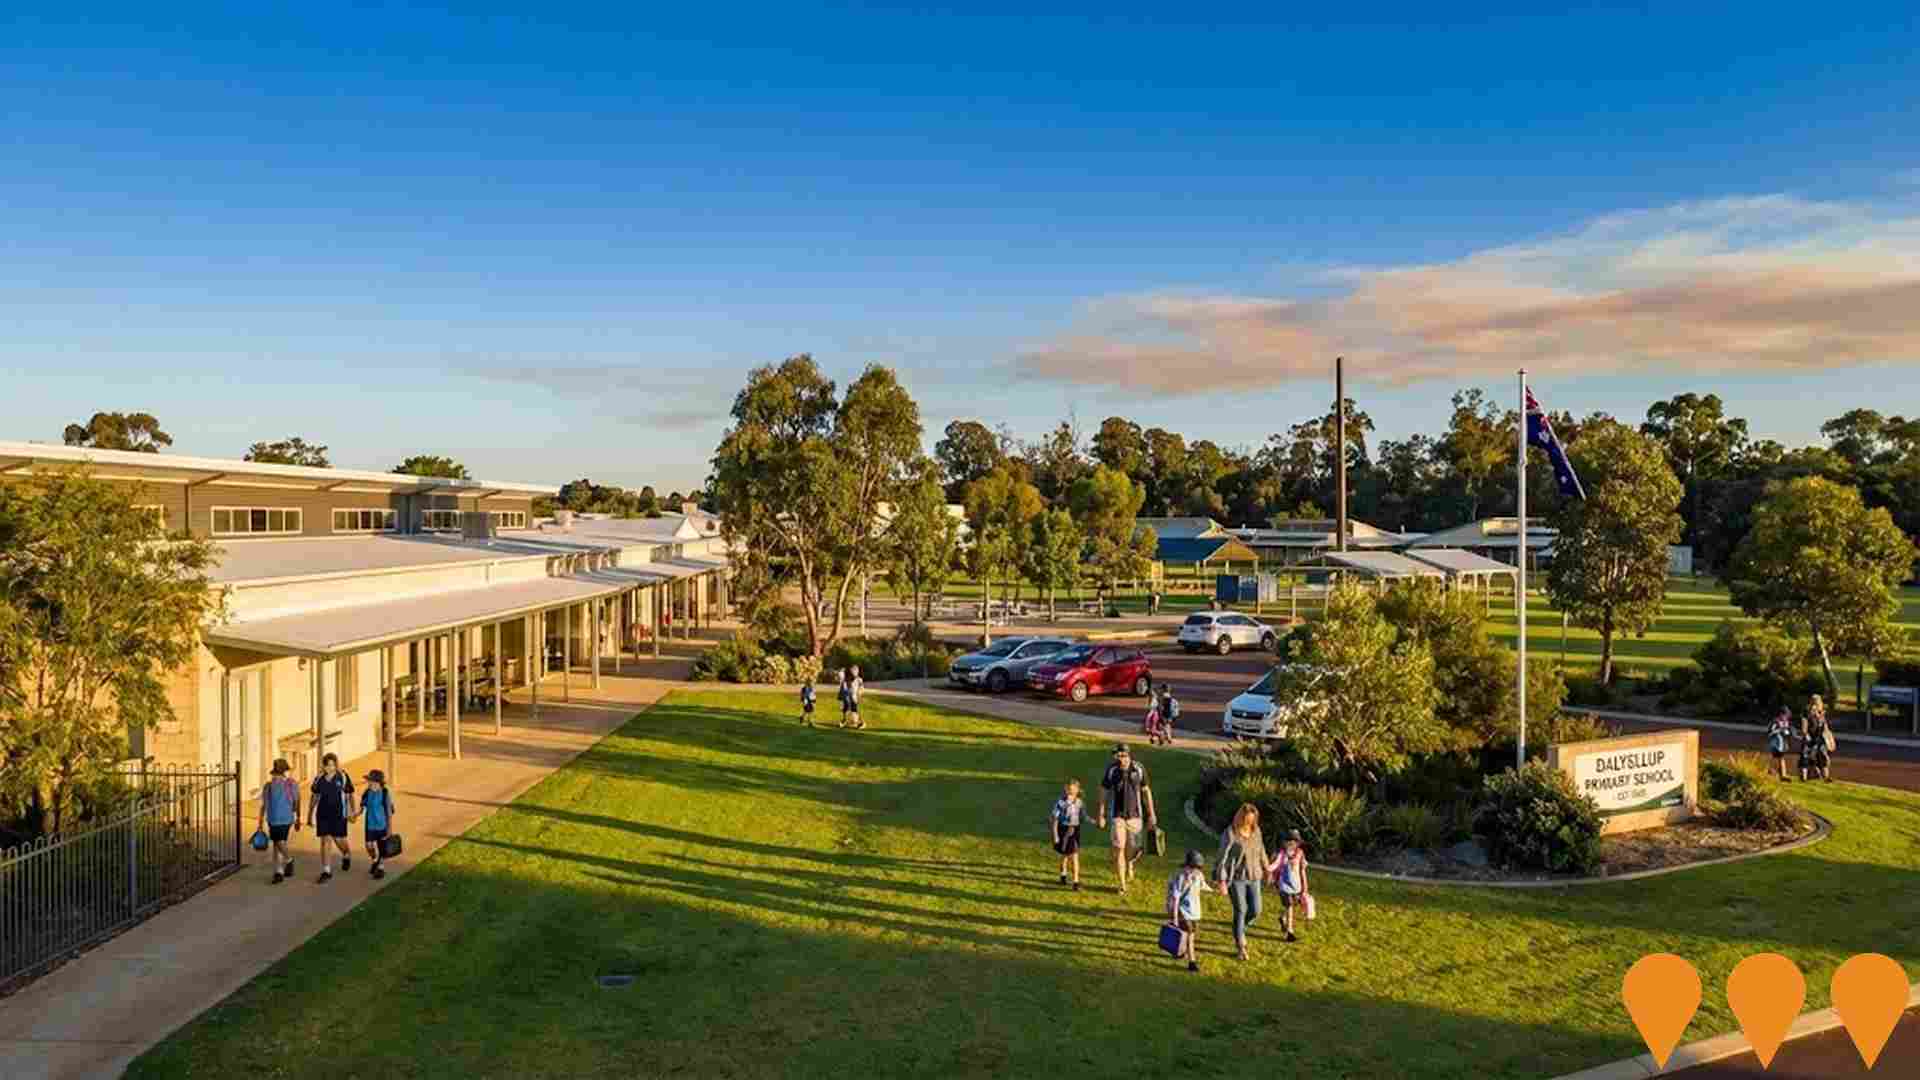
Dalyellup Primary School
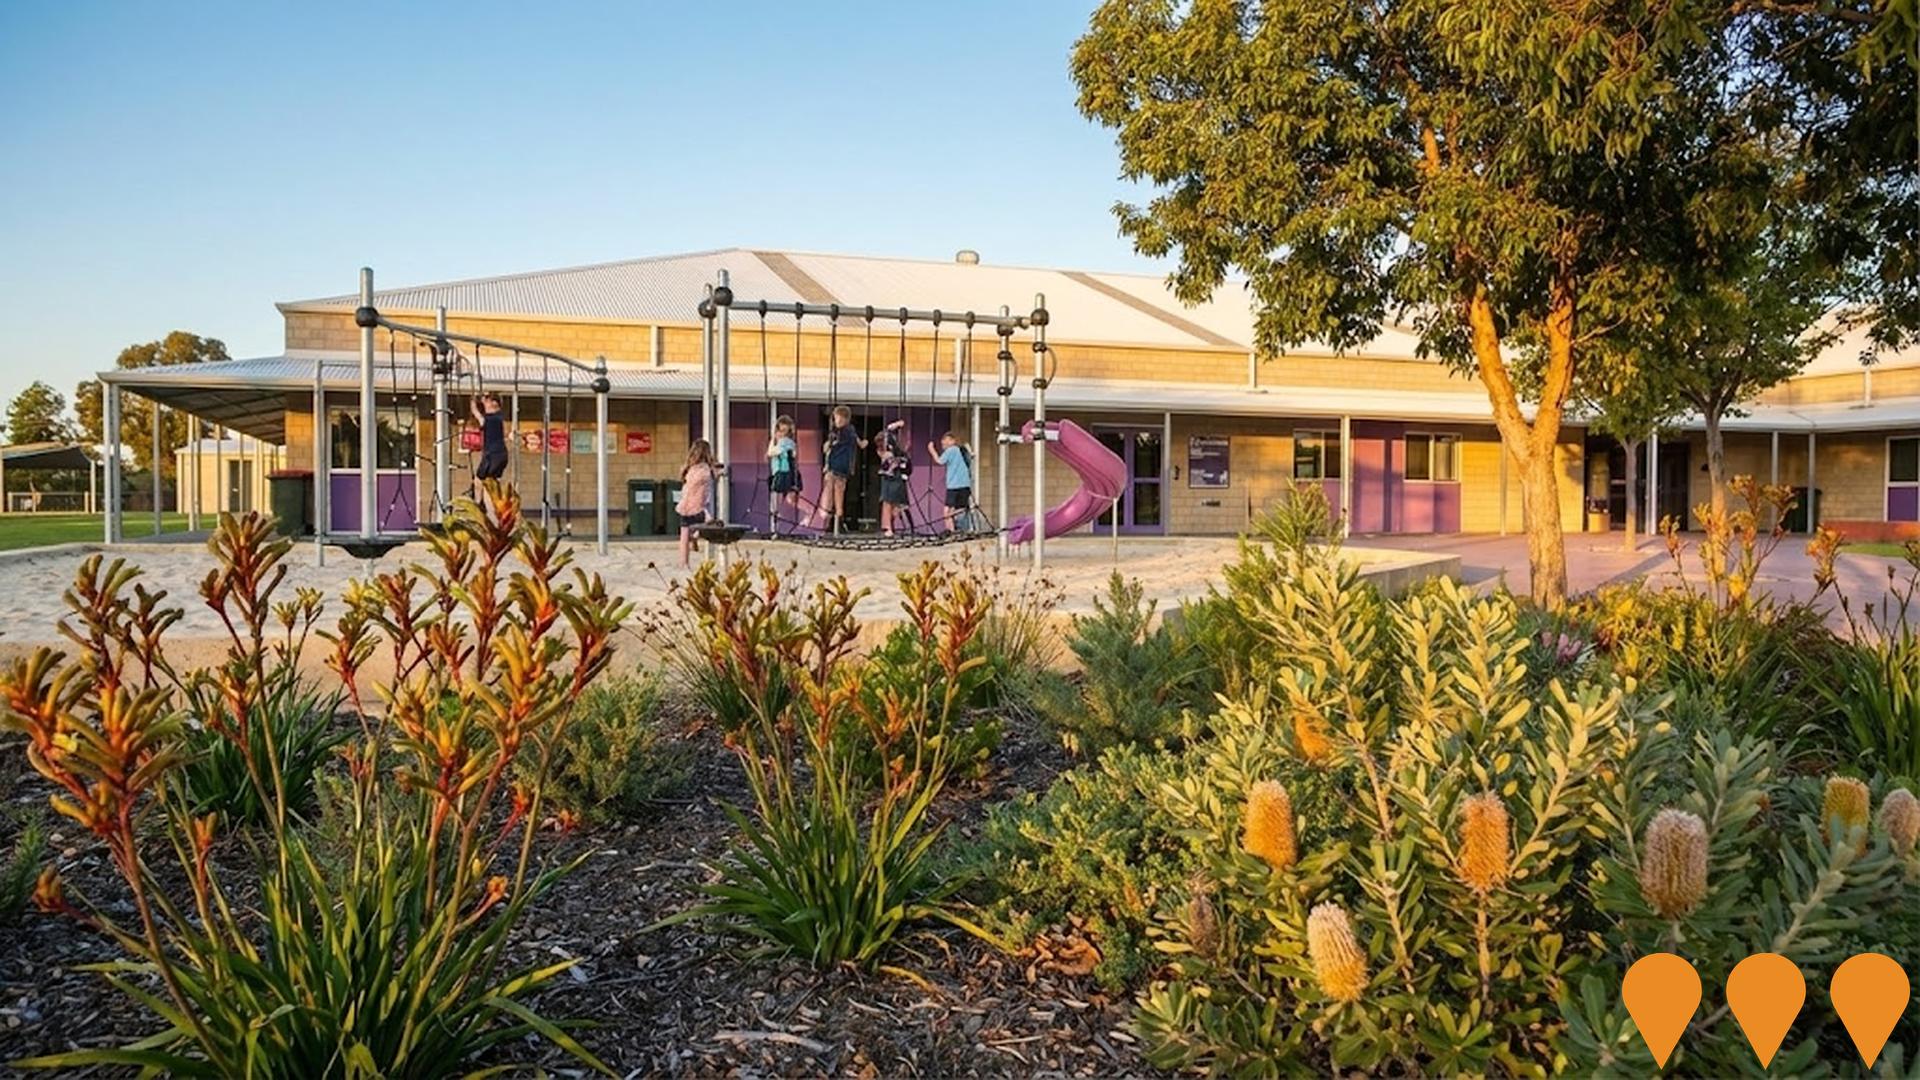
A modern primary school serving the growing Dalyellup community with facilities for Kindergarten to Year 6 students. The school features contemporary learning spaces, technology hubs, and recreational facilities designed to support the educational needs of families in the expanding Dalyellup Beach Estate.
Employment
AreaSearch analysis reveals Capel significantly outperforming the majority of regions assessed nationwide
Capel has a balanced workforce comprising white and blue collar jobs, with manufacturing and industrial sectors prominent. The unemployment rate is 2.5%, lower than the national average of 3.3%.
Over the past year, employment grew by 6.3%. As of September 2025, 3,369 residents are employed, with an unemployment rate of 0.8% below Rest of WA's rate. Workforce participation is similar to Rest of WA's at 59.4%.
Dominant sectors include health care & social assistance, construction, and agriculture, forestry & fishing. Mining has lower representation at 8.5% compared to the regional average of 11.7%. Employment opportunities locally may be limited based on Census data comparison. Between September 2024 and September 2025, employment increased by 6.3%, labour force by 5.9%, reducing unemployment by 0.3 percentage points. In contrast, Rest of WA had employment growth of 1.4% and labour force growth of 1.2%. Jobs and Skills Australia's national employment forecasts from May-25 project national employment growth of 6.6% over five years and 13.7% over ten years. Applying these projections to Capel's employment mix suggests local employment should increase by 5.6% over five years and 12.3% over ten years, though this is a simplified extrapolation for illustrative purposes only.
Frequently Asked Questions - Employment
Income
Income levels align closely with national averages, indicating typical economic conditions for Australian communities according to AreaSearch analysis
AreaSearch's latest postcode level ATO data for financial year 2022 shows that Capel SA2 has a median income of $52,738 and an average income of $66,102. This is slightly above the national average, which stands at $57,323 (median) and $71,163 (average) for Rest of WA. Based on Wage Price Index growth of 14.2% since financial year 2022, estimated incomes as of September 2025 would be approximately $60,227 (median) and $75,488 (average). Census data indicates that household, family, and personal incomes in Capel rank modestly, between the 37th and 38th percentiles. Income distribution shows that 32.5% of Capel's population falls within the $1,500 - $2,999 range, which is consistent with broader regional trends at 31.1%. After housing expenses, 85.4% of income remains for other expenses.
Frequently Asked Questions - Income
Housing
Capel is characterized by a predominantly suburban housing profile, with above-average rates of outright home ownership
Capel's dwelling structures, as per the latest Census, consisted of 95.3% houses and 4.7% other dwellings (semi-detached, apartments, 'other' dwellings). This compares to Non-Metro WA's 88.1% houses and 11.8% other dwellings. Home ownership in Capel was at 37.5%, with mortgaged dwellings at 45.3% and rented ones at 17.2%. The median monthly mortgage repayment was $1,625, higher than Non-Metro WA's average of $1,616. Median weekly rent in Capel was $330, compared to Non-Metro WA's $300. Nationally, Capel's mortgage repayments were lower at $1,625 versus Australia's average of $1,863, and rents were substantially lower at $330 compared to the national figure of $375.
Frequently Asked Questions - Housing
Household Composition
Capel has a typical household mix, with a fairly typical median household size
Family households comprise 77.0% of all households, including 30.3% couples with children, 35.3% couples without children, and 10.8% single parent families. Non-family households make up the remaining 23.0%, with lone person households at 20.8% and group households comprising 2.3%. The median household size is 2.5 people, matching the Rest of WA average.
Frequently Asked Questions - Households
Local Schools & Education
Capel shows below-average educational performance compared to national benchmarks, though pockets of achievement exist
The area has a lower university qualification rate of 15.7%, compared to the Australian average of 30.4%. This disparity presents both challenges and opportunities for targeted educational initiatives. Bachelor degrees are most common at 11.9%, followed by graduate diplomas at 2.1% and postgraduate qualifications at 1.7%. Vocational credentials are prevalent, with 43.8% of residents aged 15+ holding them, including advanced diplomas at 9.5% and certificates at 34.3%.
Educational participation is high, with 28.8% of residents currently enrolled in formal education. This includes primary education at 11.4%, secondary education at 10.1%, and tertiary education at 2.1%.
Frequently Asked Questions - Education
Schools Detail
Nearby Services & Amenities
Transport
Transport servicing is low compared to other areas nationally based on assessment of service frequency, route connectivity and accessibility
Capel has four active public transport stops operating, all of which are bus stops. These stops are serviced by three different bus routes that collectively offer 22 weekly passenger trips. The accessibility of these services is limited, with residents typically located 2017 meters away from the nearest stop.
On average, each route provides three trips per day, resulting in approximately five weekly trips per individual stop.
Frequently Asked Questions - Transport
Transport Stops Detail
Health
Health performance in Capel is lower than average with common health conditions somewhat prevalent across both younger and older age cohorts
Capel faces significant health challenges with common health conditions somewhat prevalent across both younger and older age cohorts.
The rate of private health cover is approximately 52% of the total population (~3,147 people), which leads that of the average SA2 area. The most common medical conditions in the area are arthritis and mental health issues, impacting 10.7% and 8.5% of residents respectively. Sixty-six percent (66%) of residents declared themselves completely clear of medical ailments, compared to 66.4% across Rest of WA. Nineteen point eight percent (19.8%) of residents are aged 65 and over (1,190 people), which is higher than the 17.6% in Rest of WA. Health outcomes among seniors in Capel are above average, performing even better than the general population in health metrics.
Frequently Asked Questions - Health
Cultural Diversity
Capel is considerably less culturally diverse than average when assessed alongside AreaSearch's national rankings for language and cultural background related metrics
Capel's population was found to be predominantly culturally homogeneous, with 88.7% being Australian citizens and 84.1% born in Australia. The majority of residents, 97.1%, spoke English only at home. Christianity was the most prevalent religion, comprising 42.6% of Capel's population.
Notably, the 'Other' religious category made up just 0.5% of Capel's population, compared to 0.6% in the rest of Western Australia. In terms of ancestry, the top three groups were English (35.7%), Australian (32.7%), and Scottish (7.3%). Some ethnic groups showed notable deviations from regional averages: Dutch residents comprised 2.2% of Capel's population compared to 1.6% regionally, Welsh residents made up 0.8% versus 0.6%, and South African residents constituted 0.6% compared to 0.8%.
Frequently Asked Questions - Diversity
Age
Capel hosts a notably older demographic compared to the national average
Capel's median age is 44 years, which is higher than the Rest of WA average of 40 years and exceeds the national average of 38 years. The 65-74 age group makes up 12.6% of Capel's population compared to the Rest of WA, while the 25-34 cohort comprises 10.3%. Post-2021 Census data shows that the 15 to 24 age group grew from 9.9% to 11.8%, and the 25 to 34 cohort increased from 8.6% to 10.3%. Conversely, the 5 to 14 age group declined from 14.4% to 12.9%, and the 55 to 64 group decreased from 16.0% to 14.6%. Demographic modeling projects significant changes in Capel's age profile by 2041, with the 25-34 cohort showing the strongest growth of 59%, adding 366 residents to reach 986. In contrast, population declines are projected for the 85+ and 75-84 cohorts.
