Chart Color Schemes
This analysis uses ABS Statistical Areas Level 2 (SA2) boundaries, which can materially differ from Suburbs and Localities (SAL) even when sharing similar names.
SA2 boundaries are defined by the Australian Bureau of Statistics and are designed to represent communities for statistical reporting (e.g., census and ERP).
Suburbs and Localities (SAL) represent commonly-used suburb/locality names (postal-style areas) and may use different geographic boundaries. For comprehensive analysis, consider reviewing both boundary types if available.
est. as @ -- *
ABS ERP | -- people | --
2021 Census | -- people
Sales Activity
Curious about local property values? Filter the chart to assess the volume and appreciation (including resales) trends and regional comparisons, or scroll to the map below view this information at an individual property level.
Find a Recent Sale
Sales Detail
Population
An assessment of population growth drivers in Seaford reveals an overall ranking slightly below national averages considering recent, and medium term trends
Seaford's population is 18,074 as of November 2025. This reflects a growth of 859 people since the 2021 Census, which reported a population of 17,215. The increase is inferred from ABS data showing an estimated resident population of 18,072 in June 2024 and 290 new addresses validated since the Census date. This results in a population density ratio of 1,454 persons per square kilometer, higher than the average seen across national locations assessed by AreaSearch. Seaford's growth rate of 5.0% since the 2021 census exceeds both the SA4 region (3.1%) and the SA3 area, indicating it as a growth leader in the region. Natural growth contributed approximately 50.3% of overall population gains recently.
AreaSearch uses ABS/Geoscience Australia projections for each SA2 area released in 2024 with a base year of 2022. For areas not covered by this data, AreaSearch utilises VIC State Government's Regional/LGA projections released in 2023, adjusted using weighted aggregation methods to SA2 levels. Growth rates by age group are applied across all areas for years 2032 to 2041. By 2041, Seaford is expected to increase by 1,893 persons based on the latest annual ERP population numbers, reflecting a total increase of 10.5% over the 17-year period.
Frequently Asked Questions - Population
Development
Recent residential development output has been above average within Seaford when compared nationally
Seaford has averaged approximately 84 new dwelling approvals annually. Over the past five financial years, from FY21 to FY25420 homes were approved, with an additional 37 approved in FY26 so far. This averages out to about 1.6 people moving to the area per year for each dwelling built over these five financial years.
The average construction value of new homes is $365,000. In this current financial year, $40.0 million in commercial development approvals have been recorded, indicating significant commercial development activity. Compared to Greater Melbourne, Seaford has 54.0% more construction activity per person, offering greater choice for buyers. The new developments consist of 39.0% detached houses and 61.0% attached dwellings, reflecting a shift towards denser development that appeals to downsizers, investors, and entry-level buyers. This is notable given the area's current housing composition of 74.0% houses. Seaford has around 242 people per dwelling approval, indicating low-density characteristics.
By 2041, population forecasts estimate an increase of 1,891 residents in Seaford. Given current development patterns, new housing supply should meet demand, creating favorable conditions for buyers and potentially facilitating further population growth.
Frequently Asked Questions - Development
Infrastructure
Seaford has moderate levels of nearby infrastructure activity, ranking in the 48thth percentile nationally
Changes to local infrastructure significantly impact an area's performance. AreaSearch identified 16 projects likely affecting the region. Notable ones include Frankston Basketball and Gymnastics Stadium Redevelopment, Seaford Level Crossing Removal - Armstrongs Road & Station Street, 8A Klauer Street Industrial Development, and Seaford Child, Youth & Family Centre Upgrade and Expansion. The following list details those most relevant.
Professional plan users can use the search below to filter and access additional projects.
INFRASTRUCTURE SEARCH
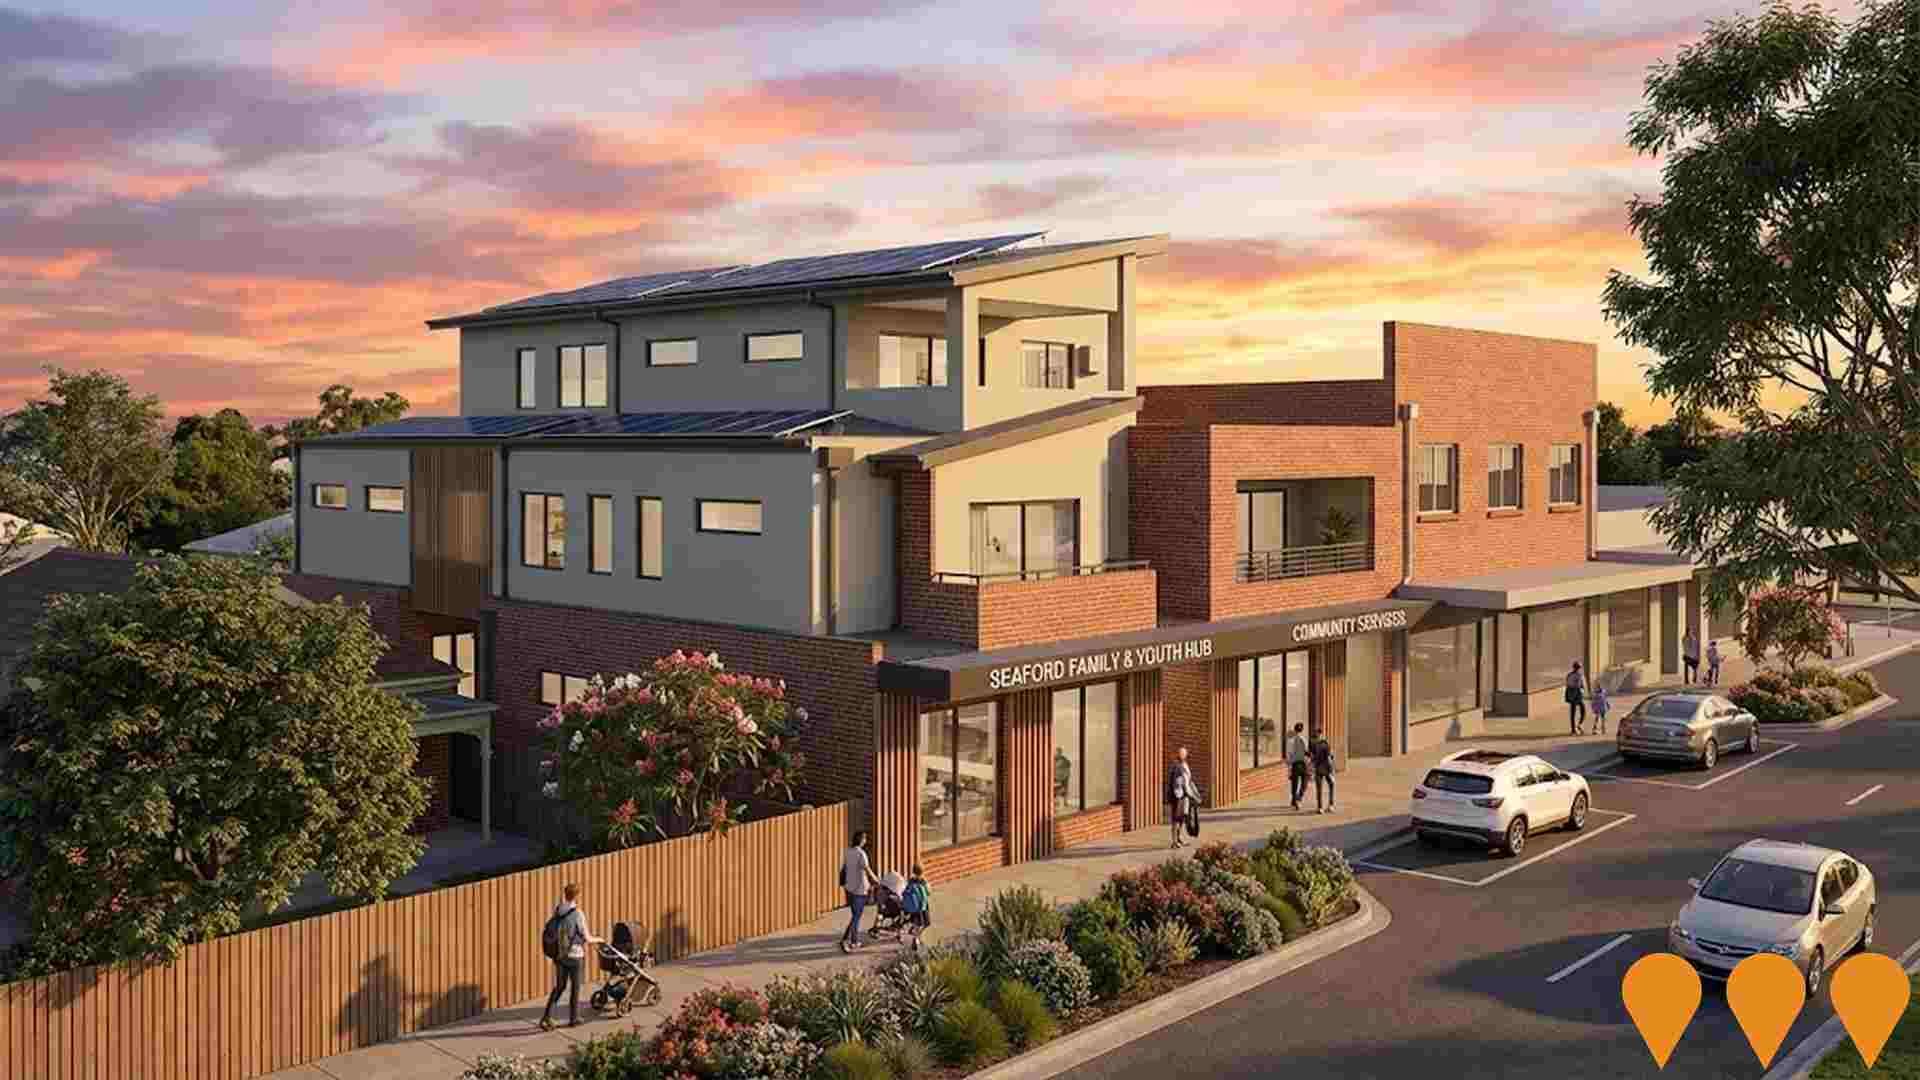
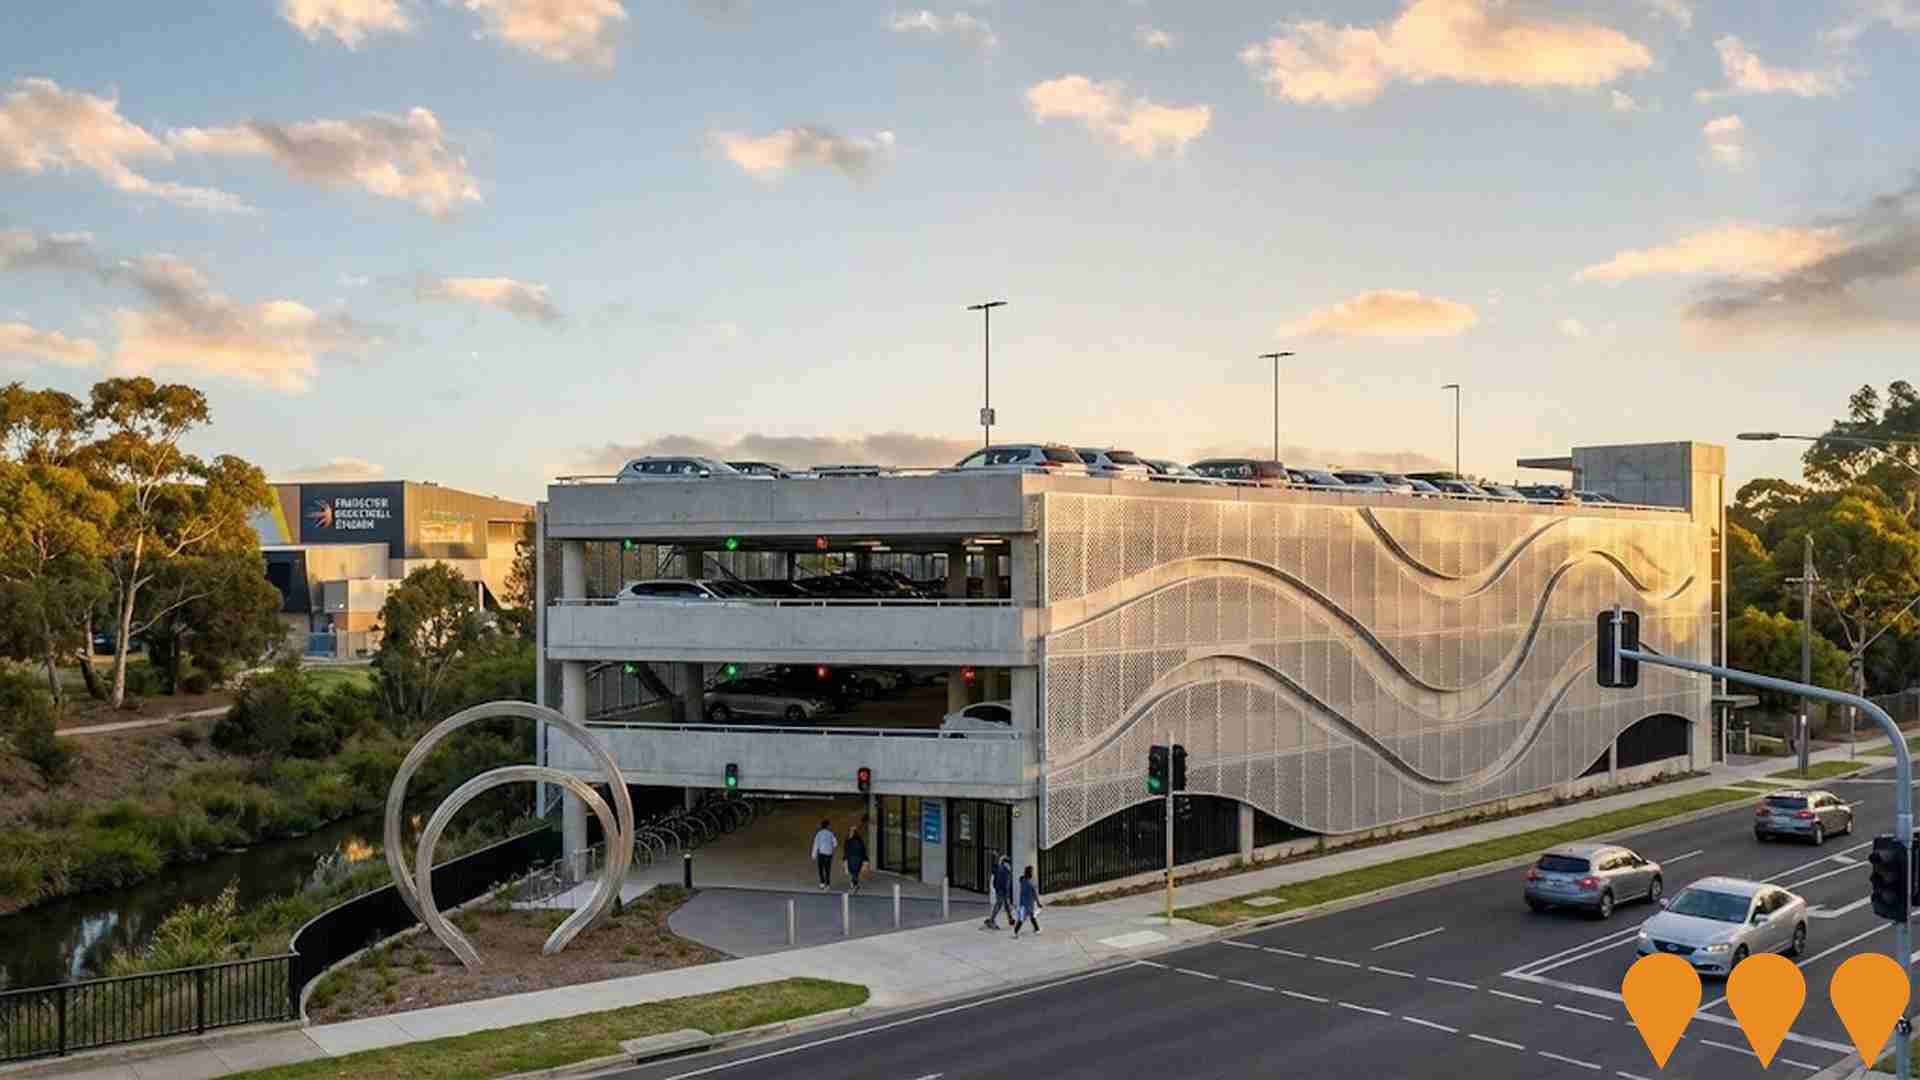
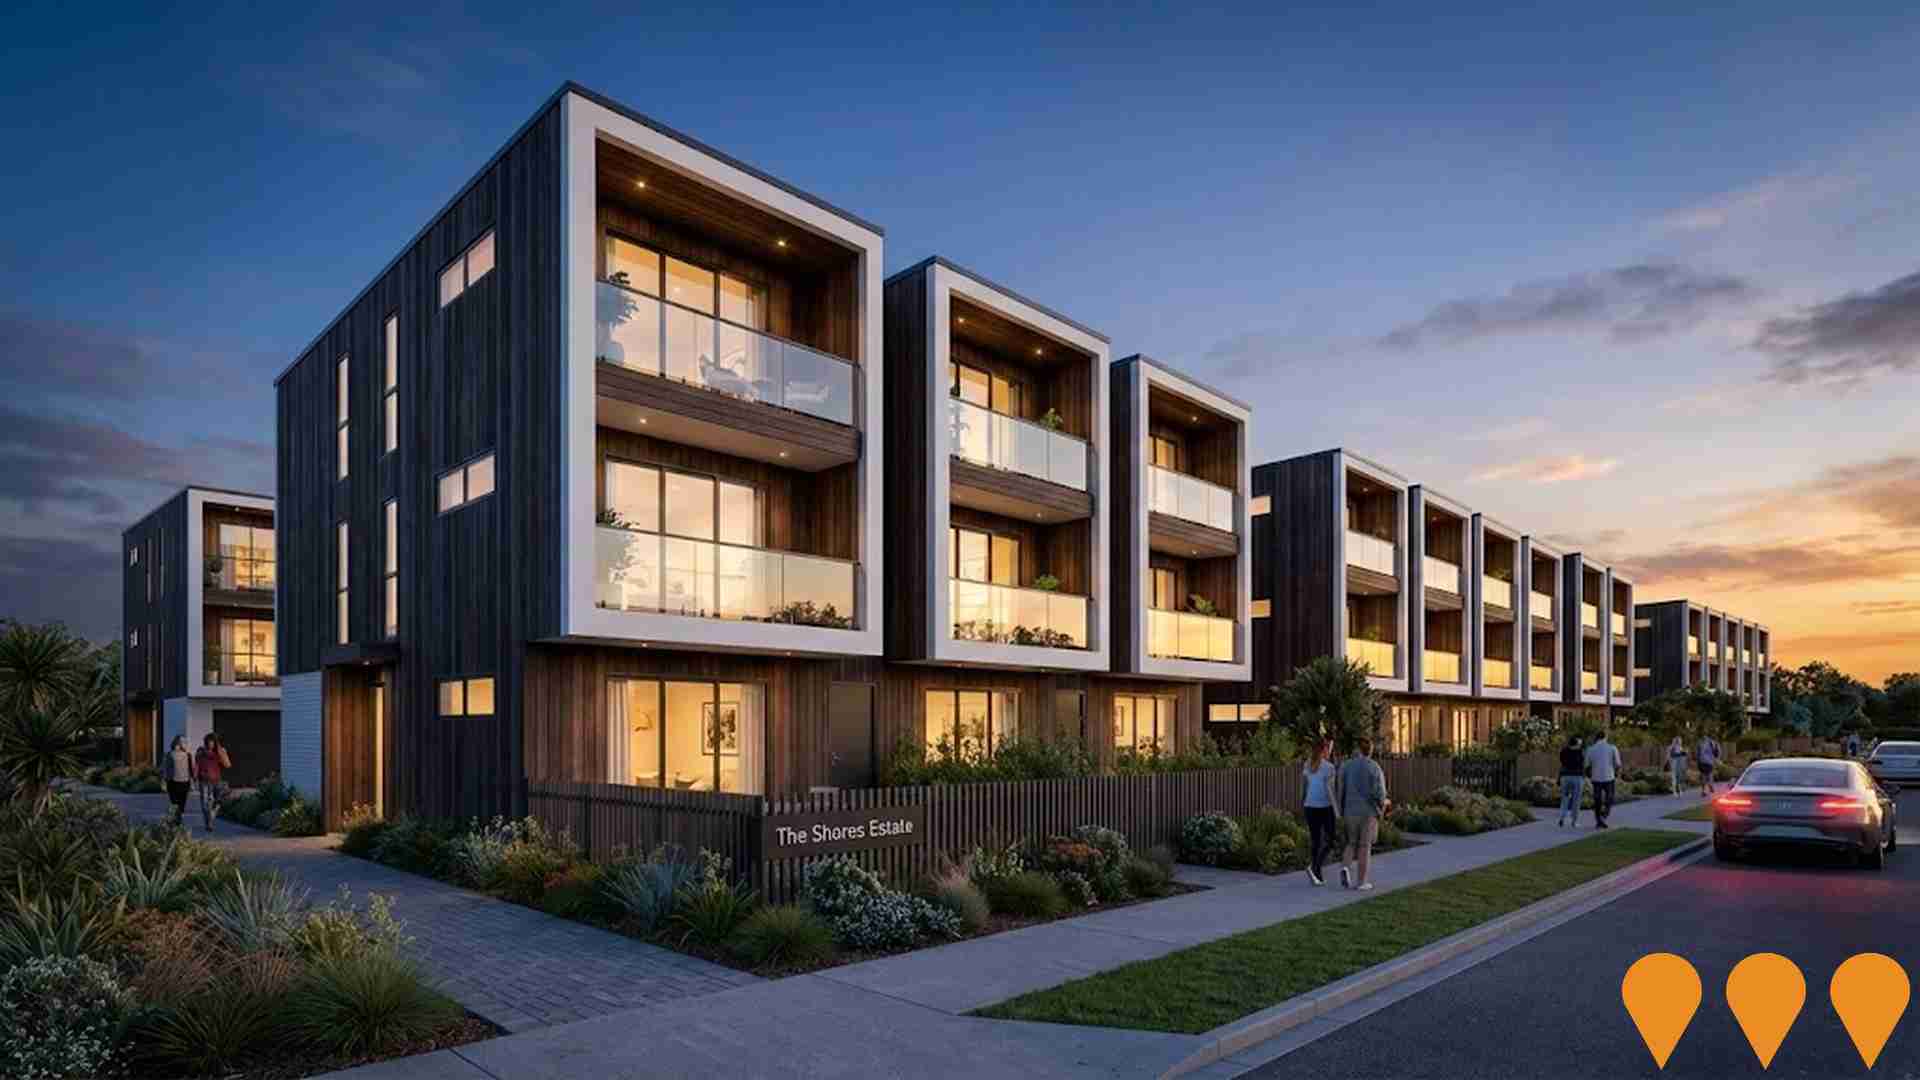
 Denotes AI-based impression for illustrative purposes only, not to be taken as definitive under any circumstances. Please follow links and conduct other investigations from the project's source for actual imagery. Developers and project owners wishing us to use original imagery please Contact Us and we will do so.
Frequently Asked Questions - Infrastructure
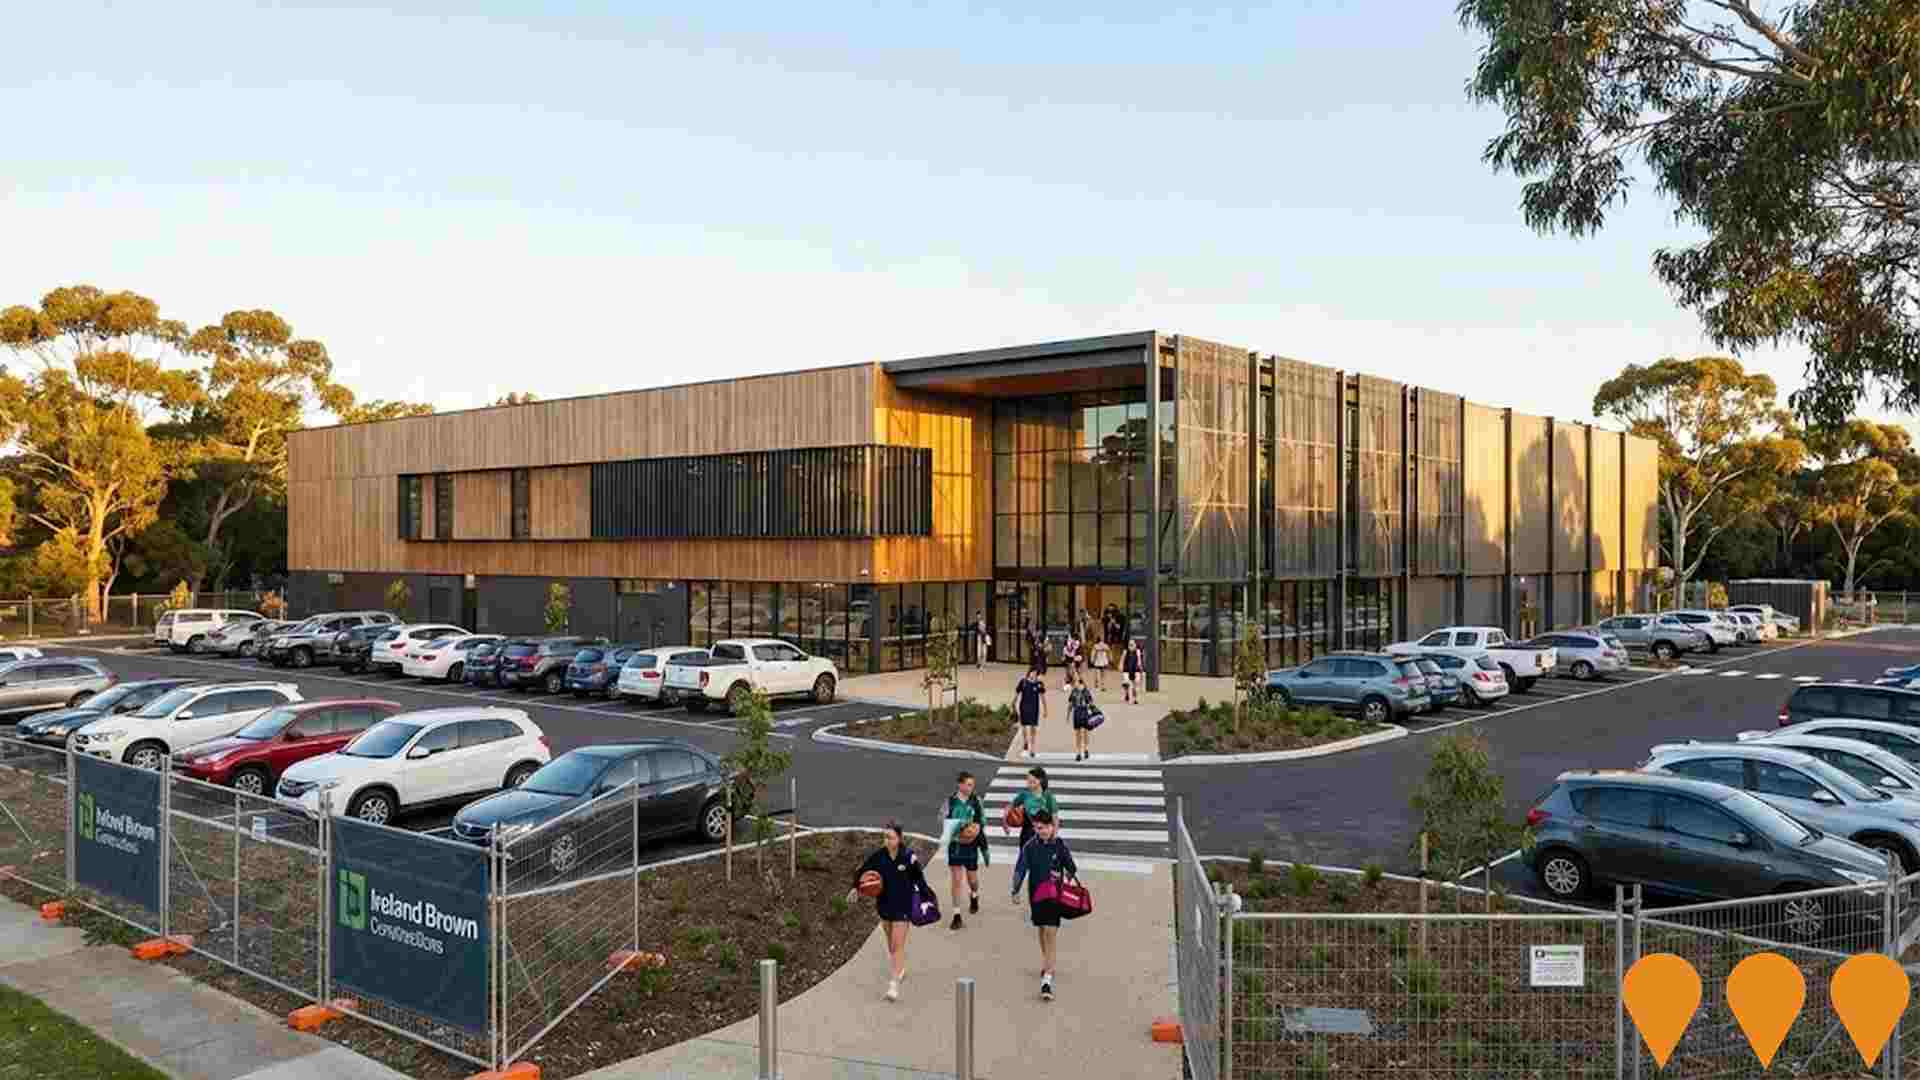
Frankston Basketball and Gymnastics Stadium Redevelopment
Frankston City's $60 million redevelopment of the existing stadium at Jubilee Park into a state-of-the-art two-storey facility featuring 10 indoor basketball/netball courts (6 new + 4 refurbished), a 1,000-seat show court, dedicated gymnastics hall with training pit, multi-purpose courts, cafe, function spaces, accessible changerooms and over 430 car spaces. Construction by Ireland Brown Constructions commenced 30 June 2025, targeting 5 Star Green Star rating and completion mid-2027.
Seaford North Reserve Sports Lighting Upgrade (Pitches 1 & 2)
Upgrade of sports field lighting at Seaford North Reserve to support night training and competition for Seaford United Soccer Club. Works formed part of Council's Sports Lighting Redevelopment program alongside Monterey Reserve, addressing non-compliant and inadequate lighting levels and enabling expanded junior and womens participation.

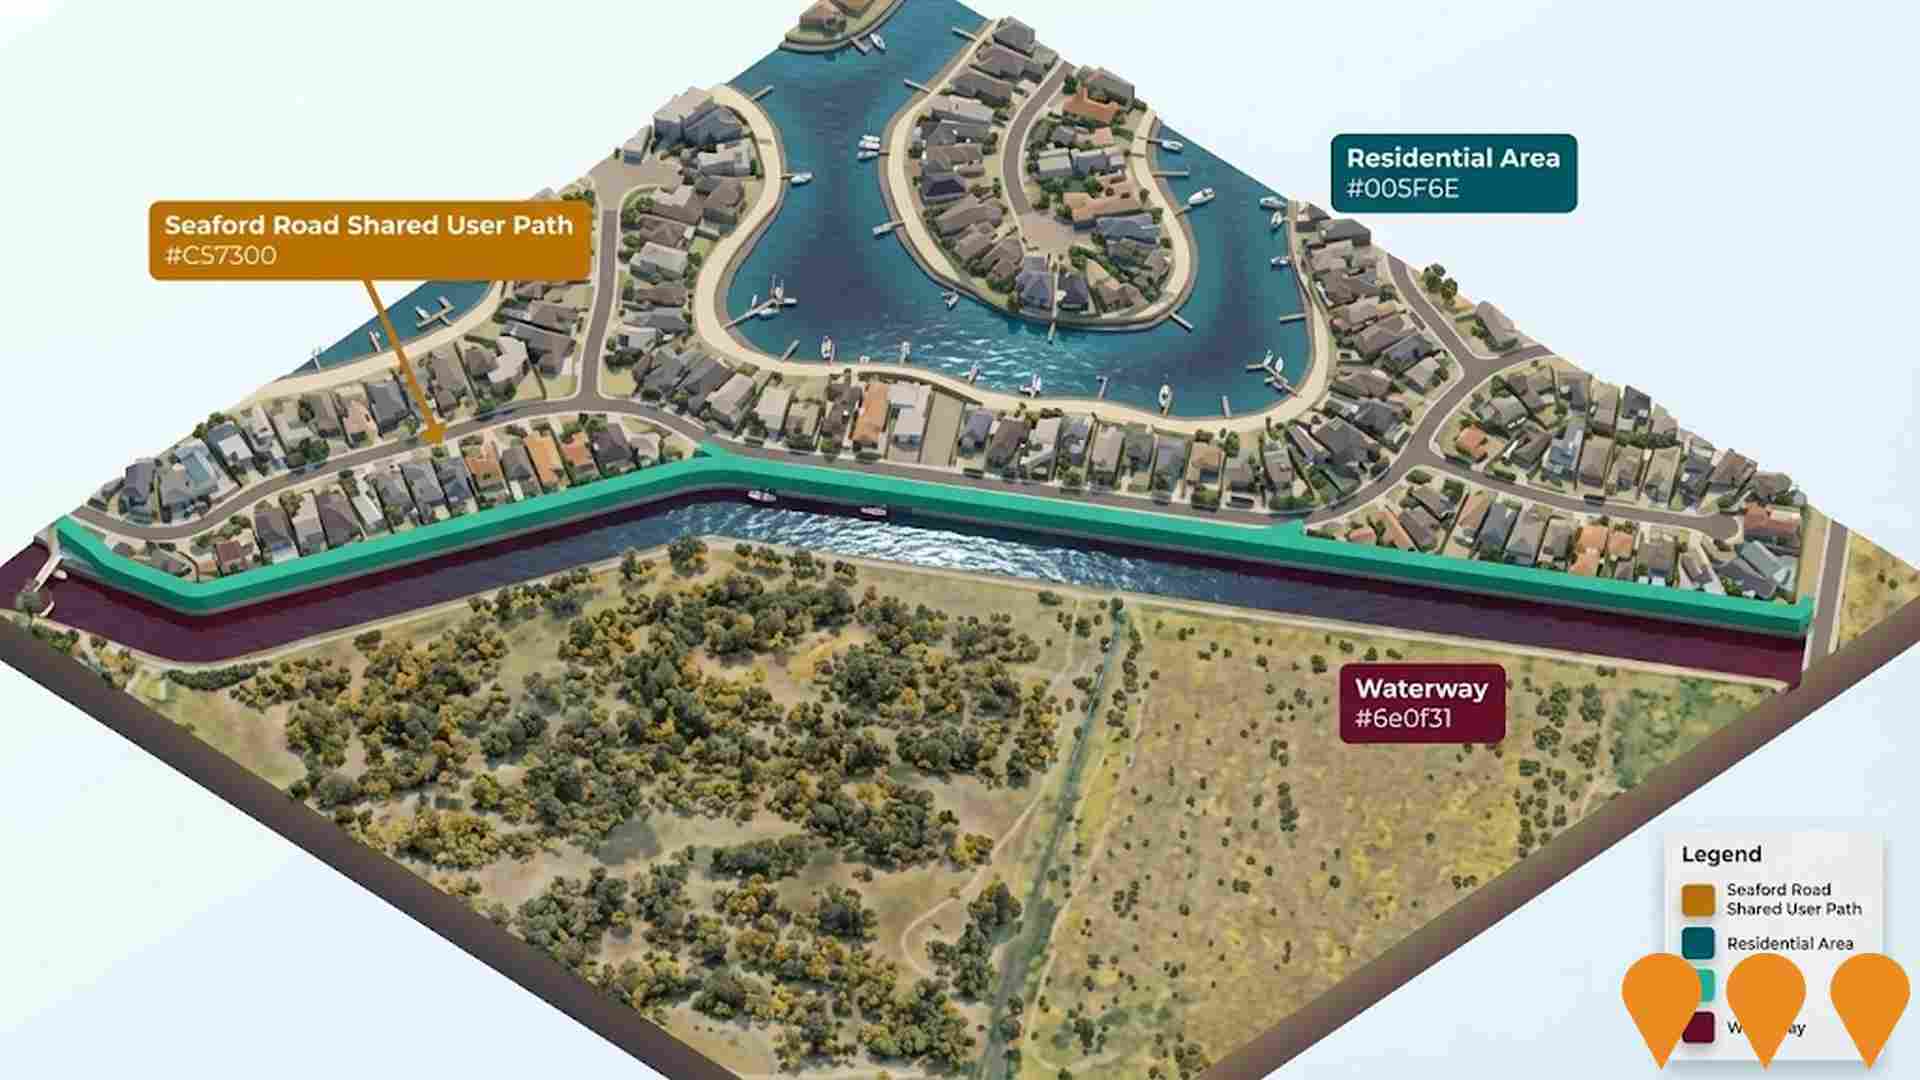
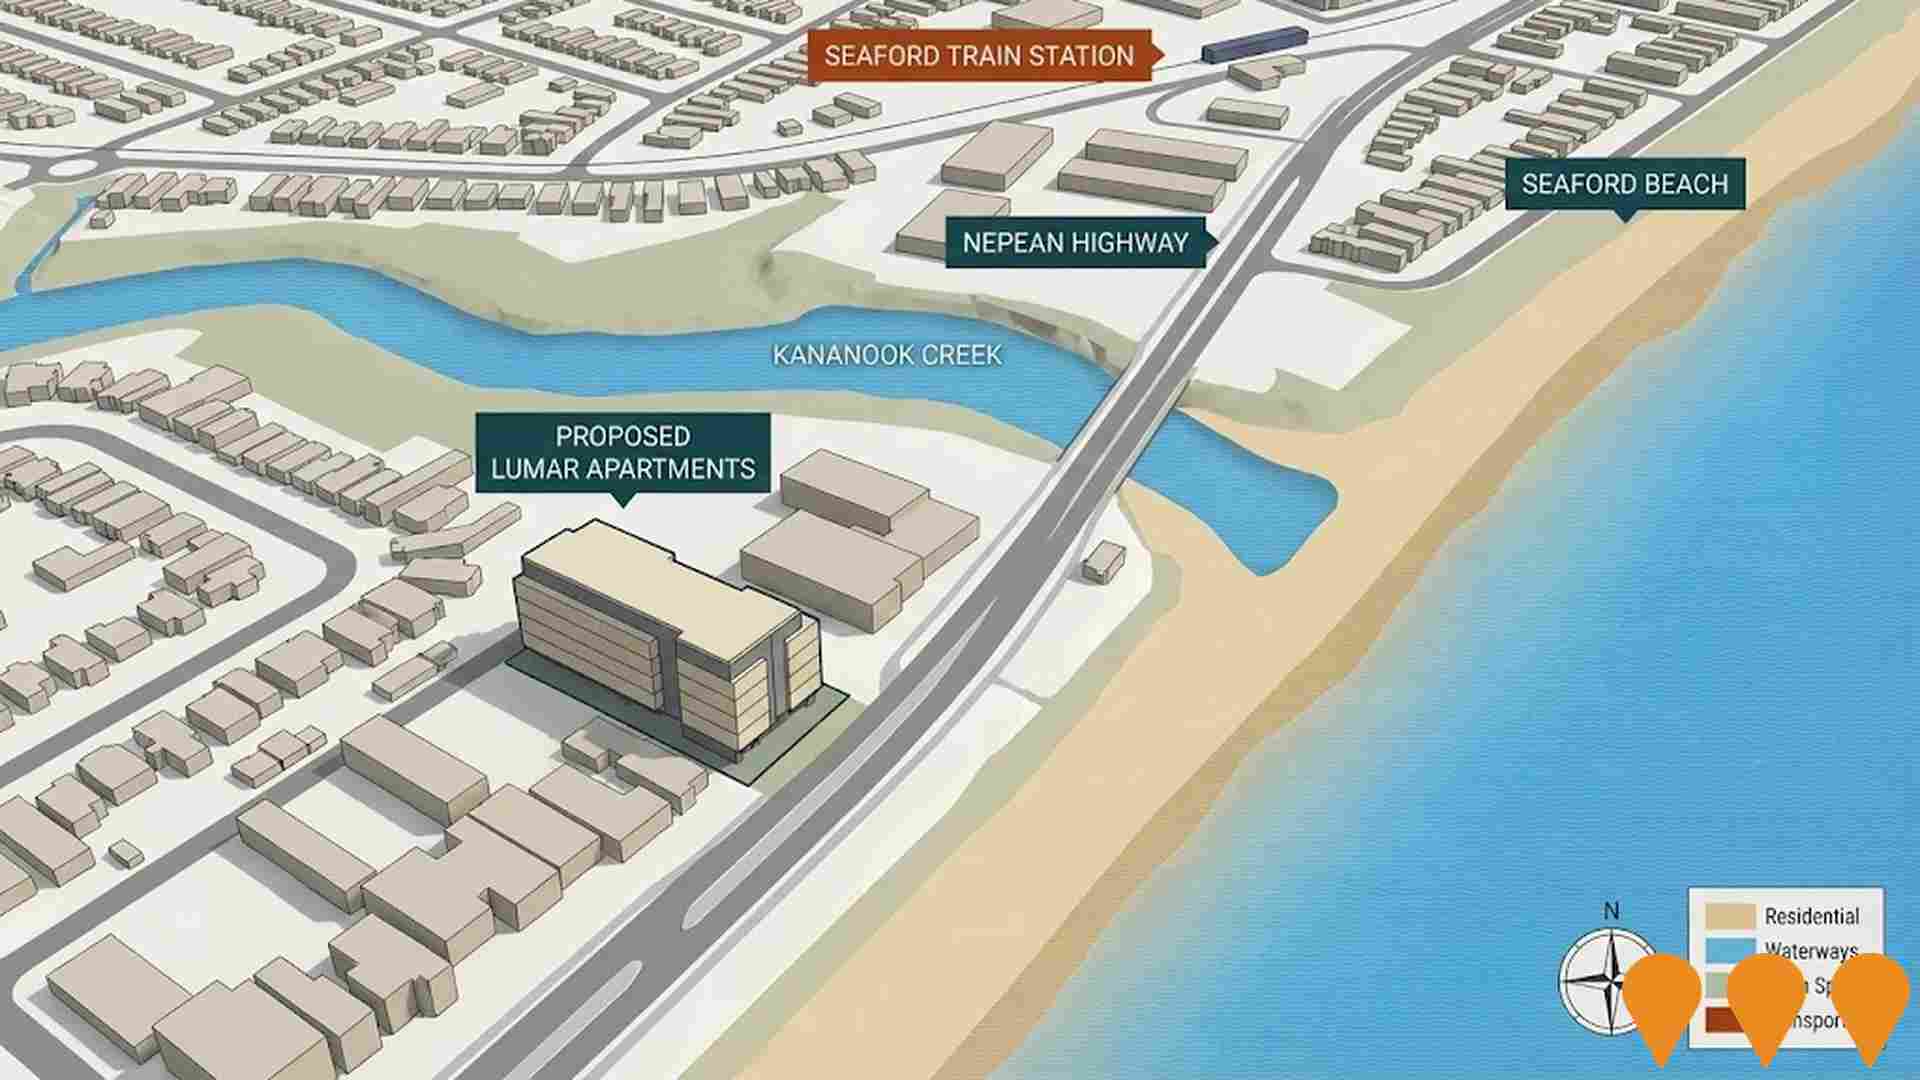
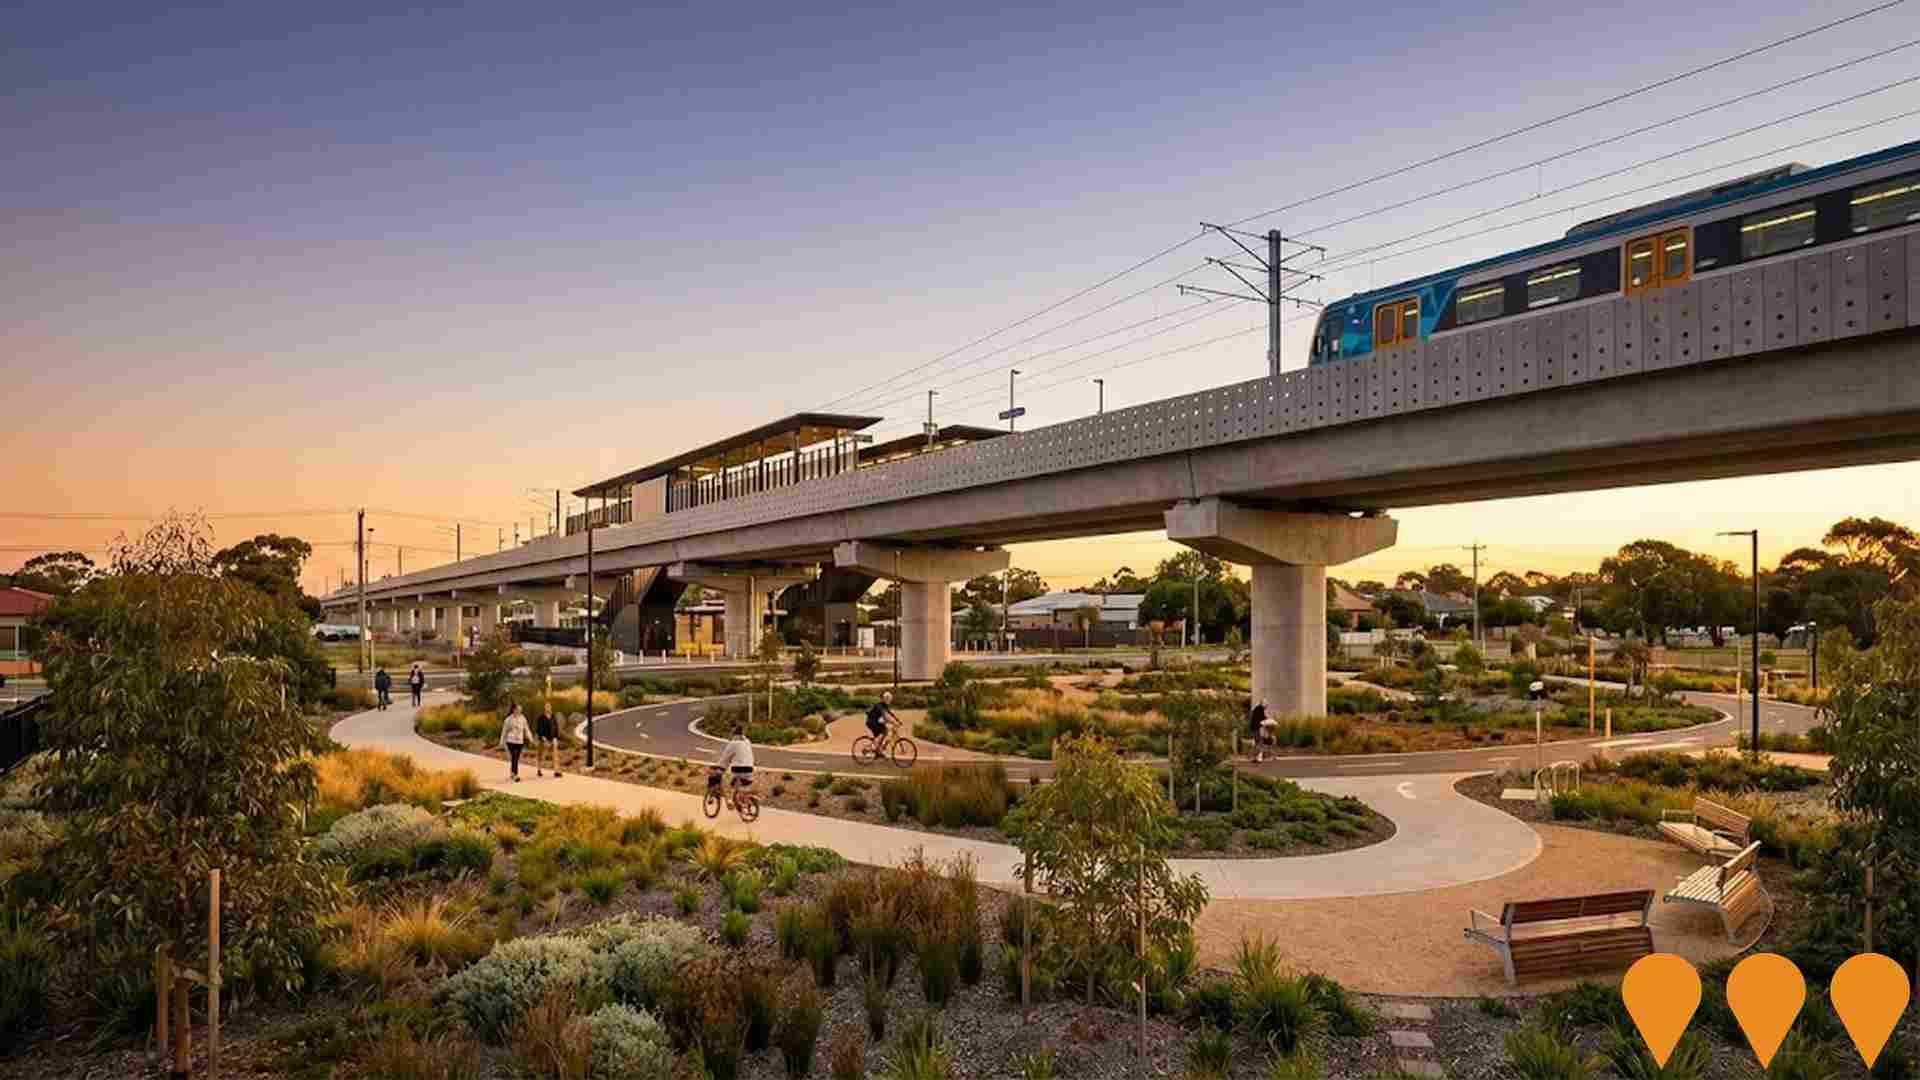
Seaford Level Crossing Removal - Armstrongs Road & Station Street
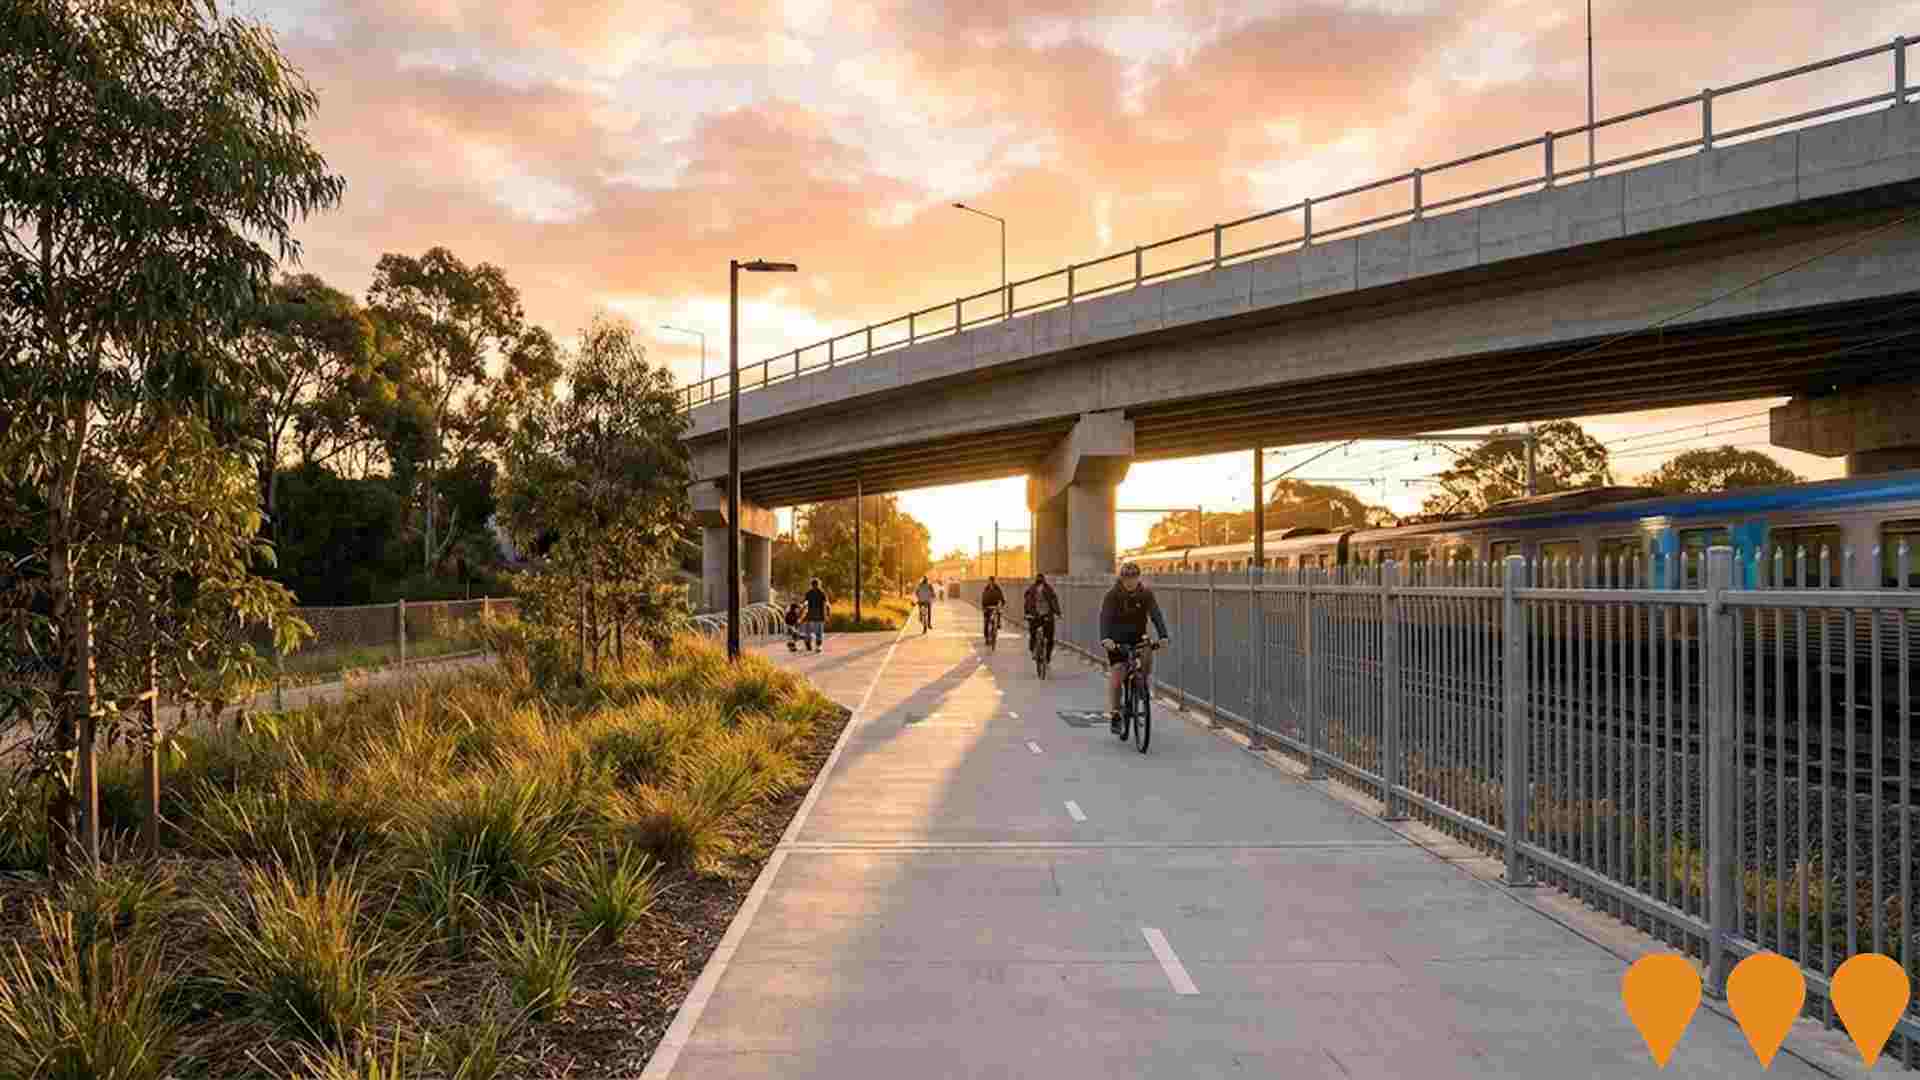
Removal of level crossings at Armstrongs Road and Station Street in Seaford as part of the Frankston Line level crossing removal program. The project will use rail bridge design due to proximity to Kananook Creek, creating opportunities for open space and improved cycling and walking connections.
Seaford Child, Youth & Family Centre Upgrade and Expansion
The project involves upgrading and expanding the Seaford Child, Youth and Family Centre to provide more kindergarten places and improved access to maternal and child health (MCH), immunisations, and youth services. Key features include two kindergarten rooms for up to 66 sessional places, two MCH consultation rooms, an additional allied health room, a Youth Hang-out room for ages 12-24, a new outdoor yard with shade, a community room for parent education, and additional car parking. The design emphasizes sustainability with energy efficiency and solar PV systems.
Kananook Commuter Car Park
Multi-level commuter car park at Kananook Station providing 325 free parking spaces across three levels including two undercover levels and an open top deck. Features smart parking guidance technology with individual space indicator lights, dedicated bicycle parking in secure lobby area, CCTV security system, and 24-hour access. Includes public art sculpture 'Meander' by Ben Fasham and exterior design reflecting Kananook Creek. Adjacent to Frankston Basketball Stadium with intersection upgrades at Wells Road and traffic signals for enhanced safety. Officially opened May 22, 2025. Future-proofed with provisions for additional level expansion.
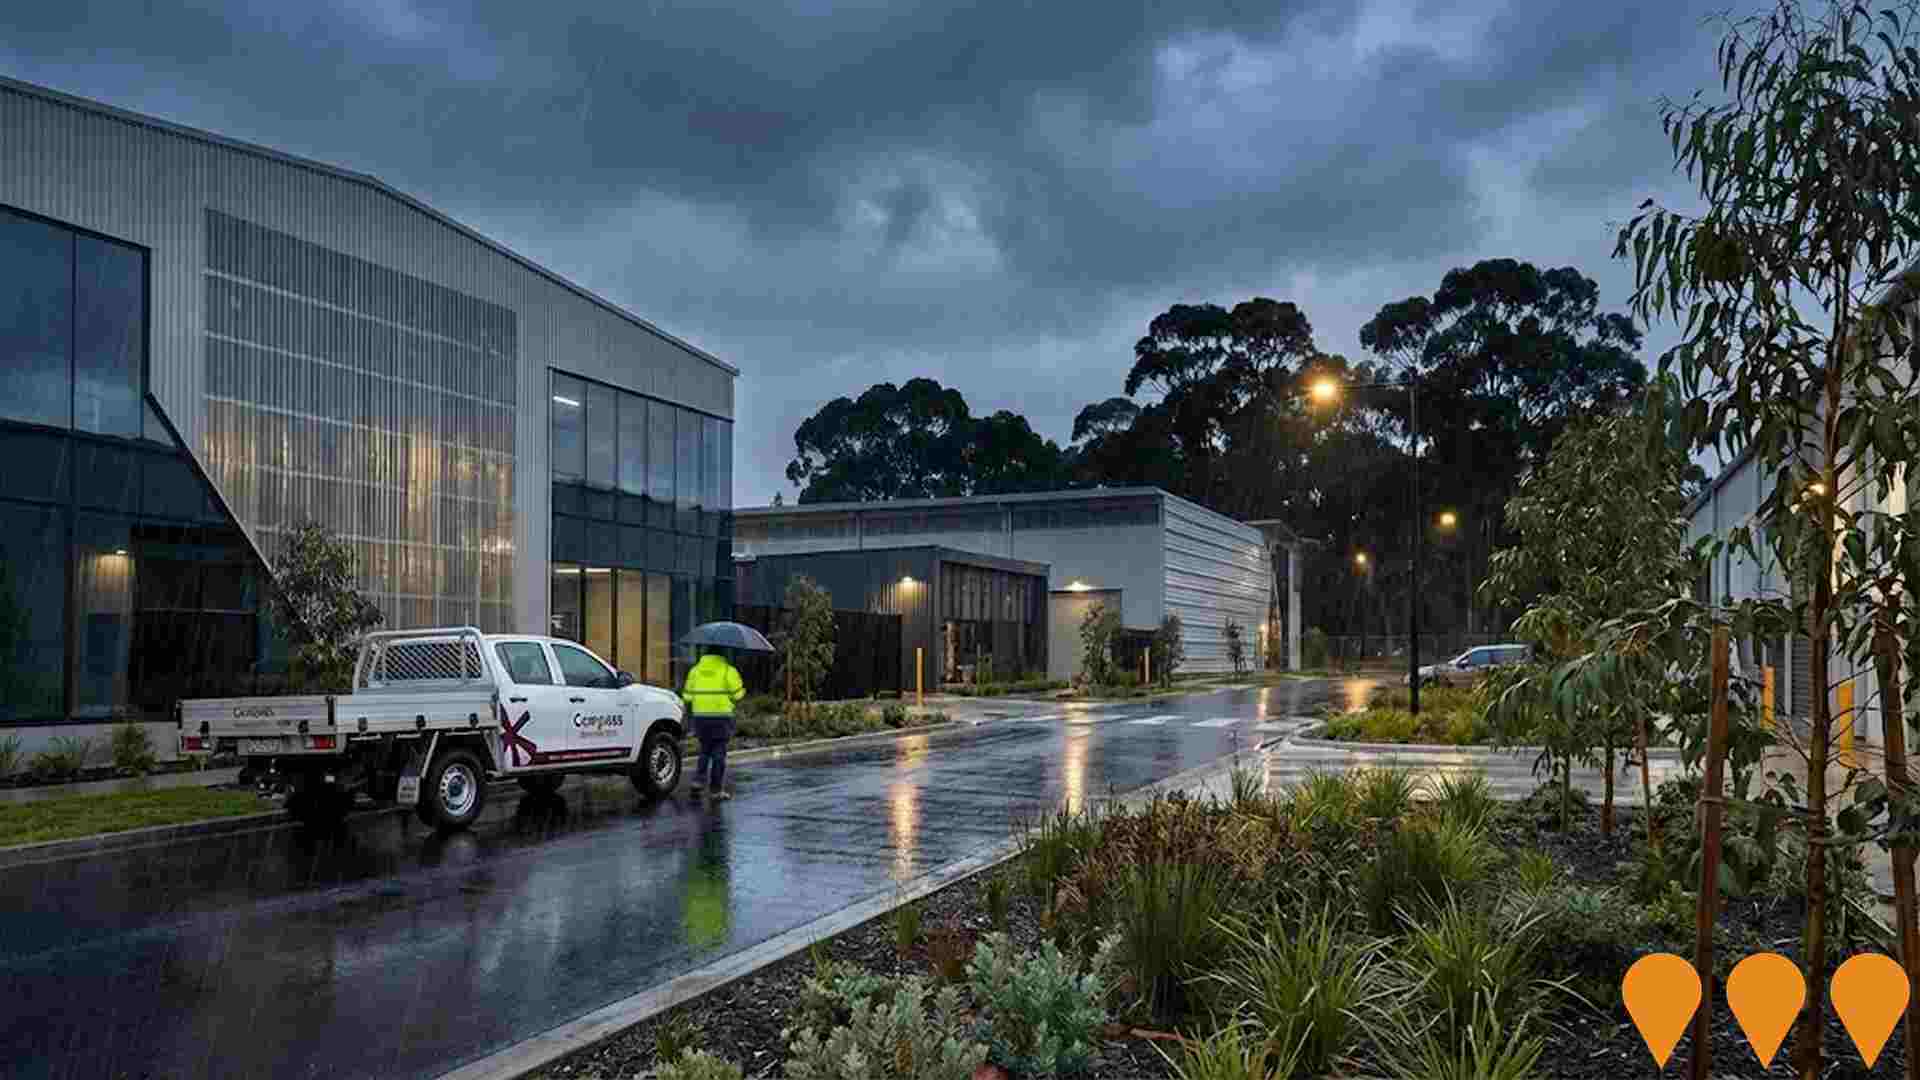
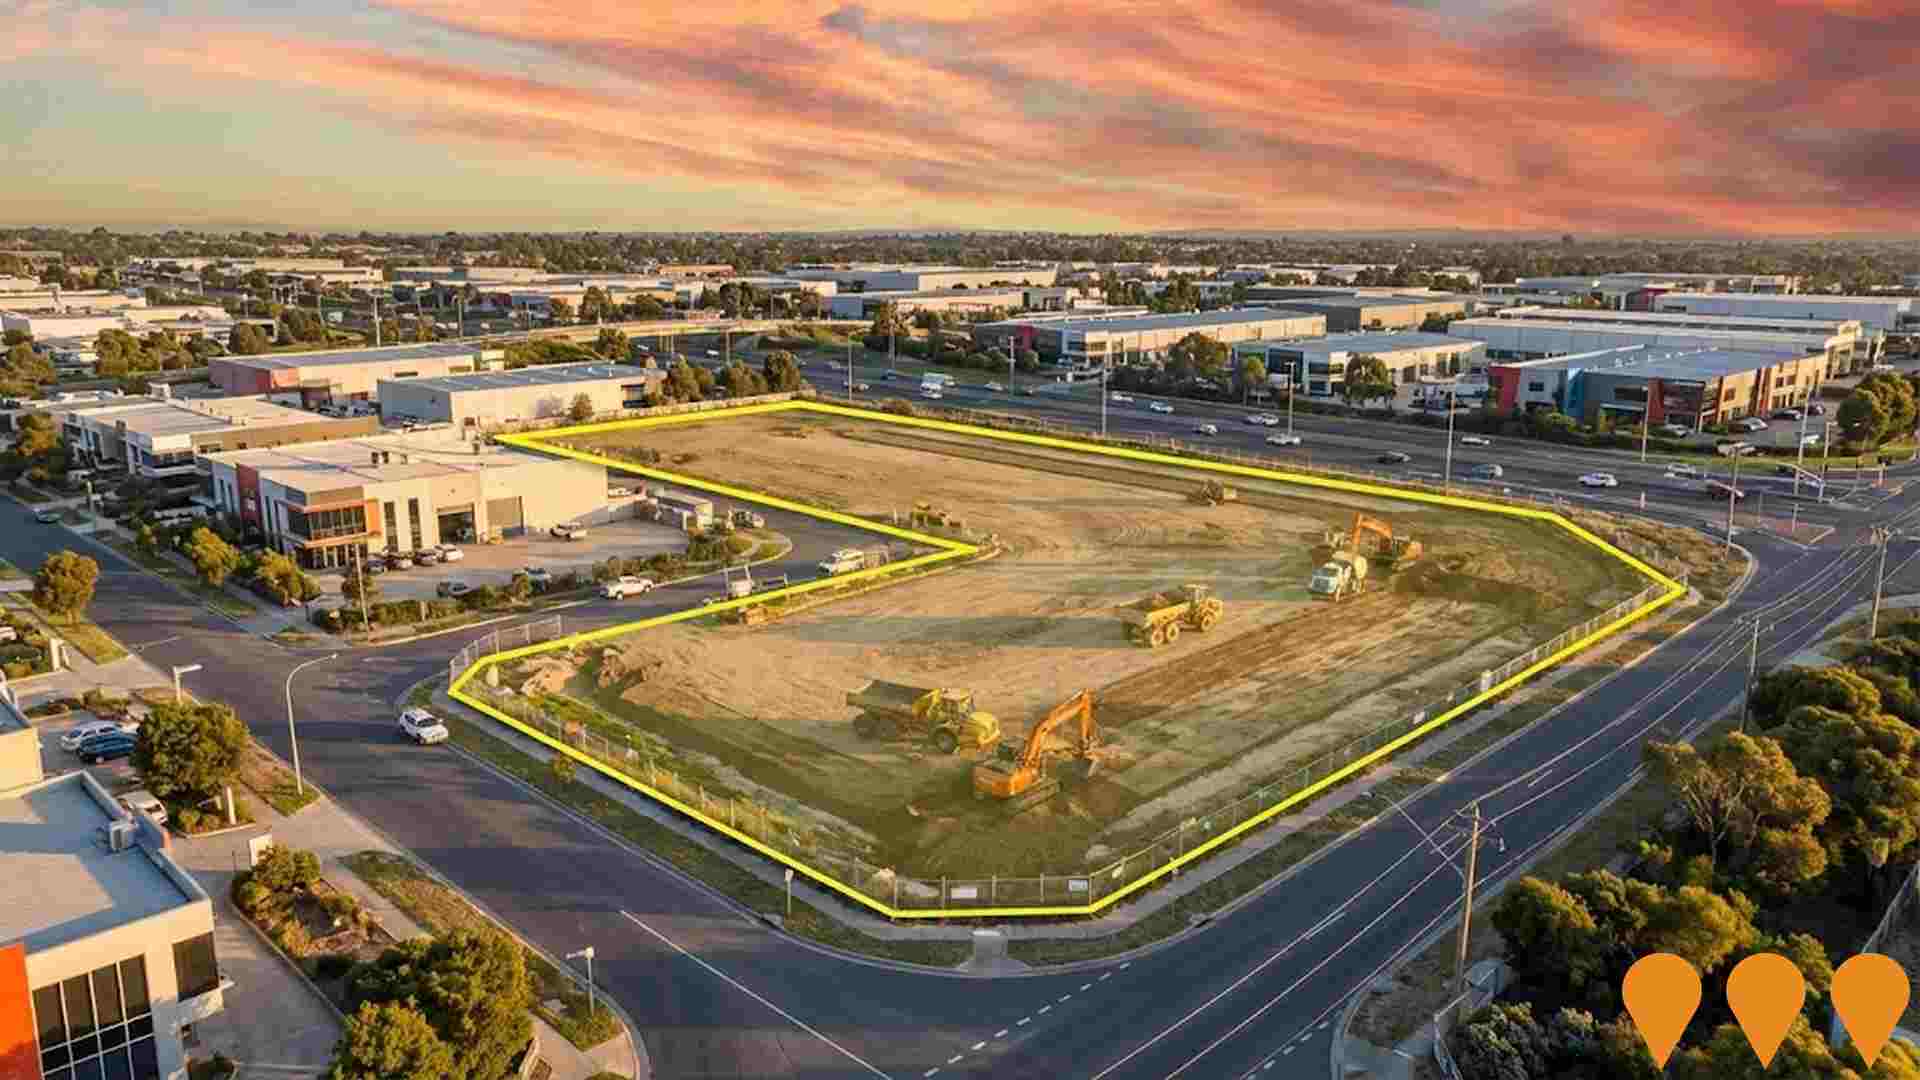
8A Klauer Street Industrial Development
Cameron and GO Commercial Industrial offer for sale a rare, large parcel of industrial land in Seaford's thriving industrial precinct. The last superlot adjoining Compass Business Park spans 16,150 sqm with private access to Klauer Street. It benefits from immediate access to Frankston-Dandenong Road and Eastlink, offering connectivity to major estates in the South East corridor. This opportunity allows securing a development site or establishing a business as an owner-occupier. Key features include Industrial 1 zoning, proximity to Frankston Freeway (1 min), Peninsula Link (2 min), Eastlink (4 min), Frankston CBD (5 min), and Mornington Peninsula (15 min).
Frankston Line Shared Use Path Extension
Extension of the shared use path along the Frankston Line, providing improved connections for pedestrians and cyclists. The path will enhance access to public transport, local beaches, and community facilities while supporting active transport options.
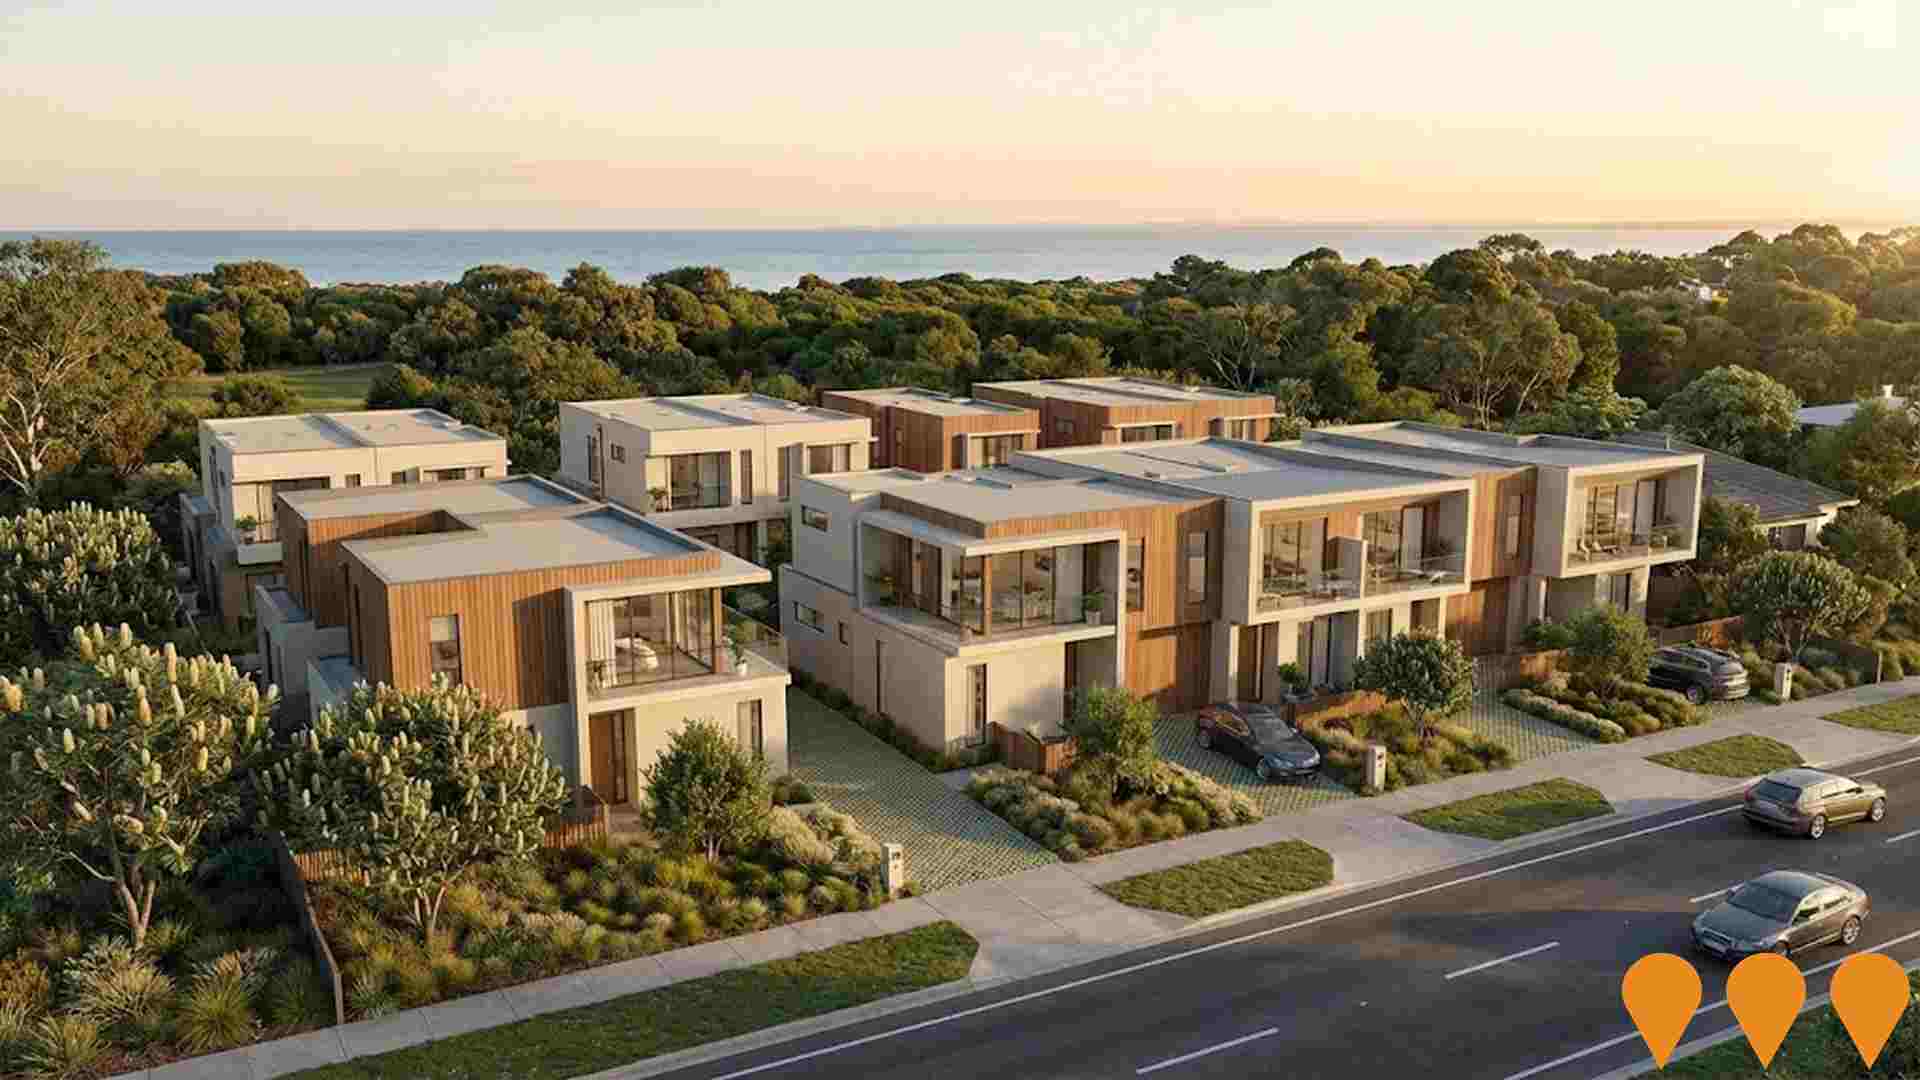
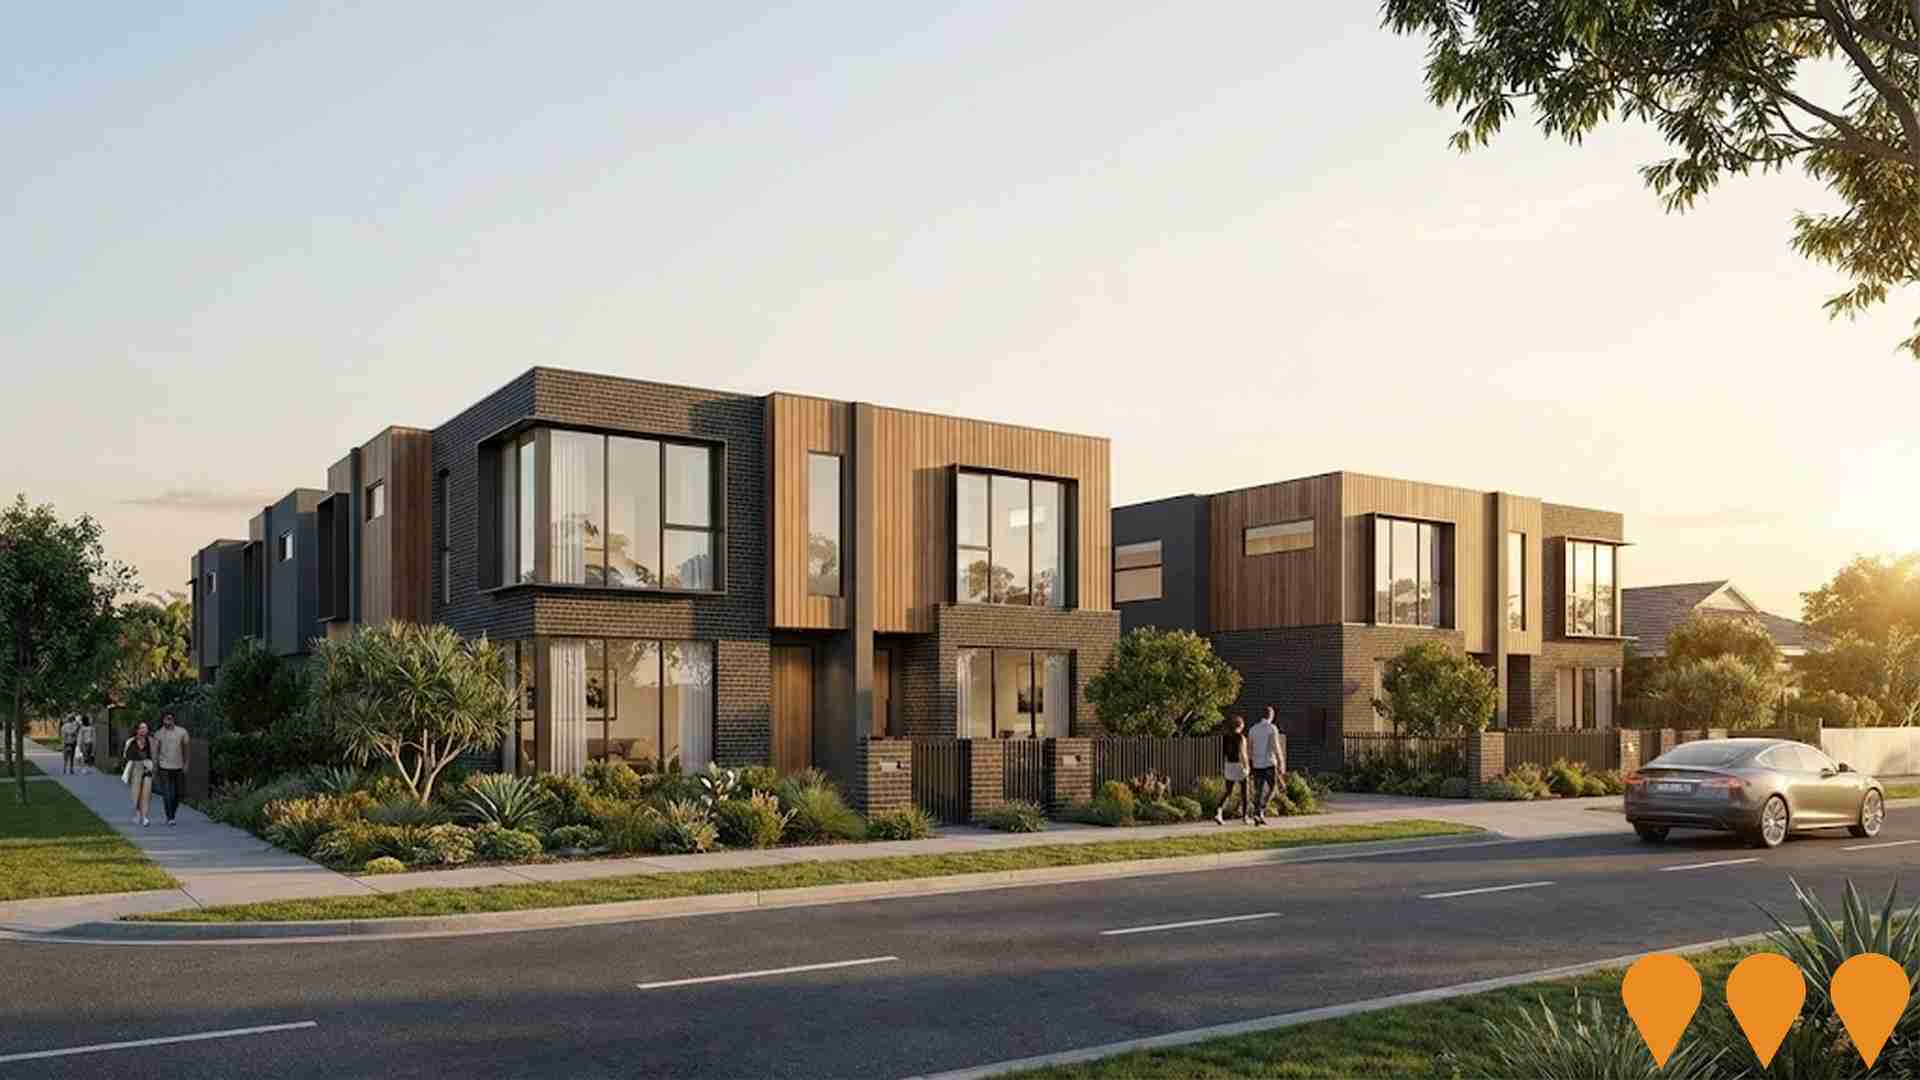
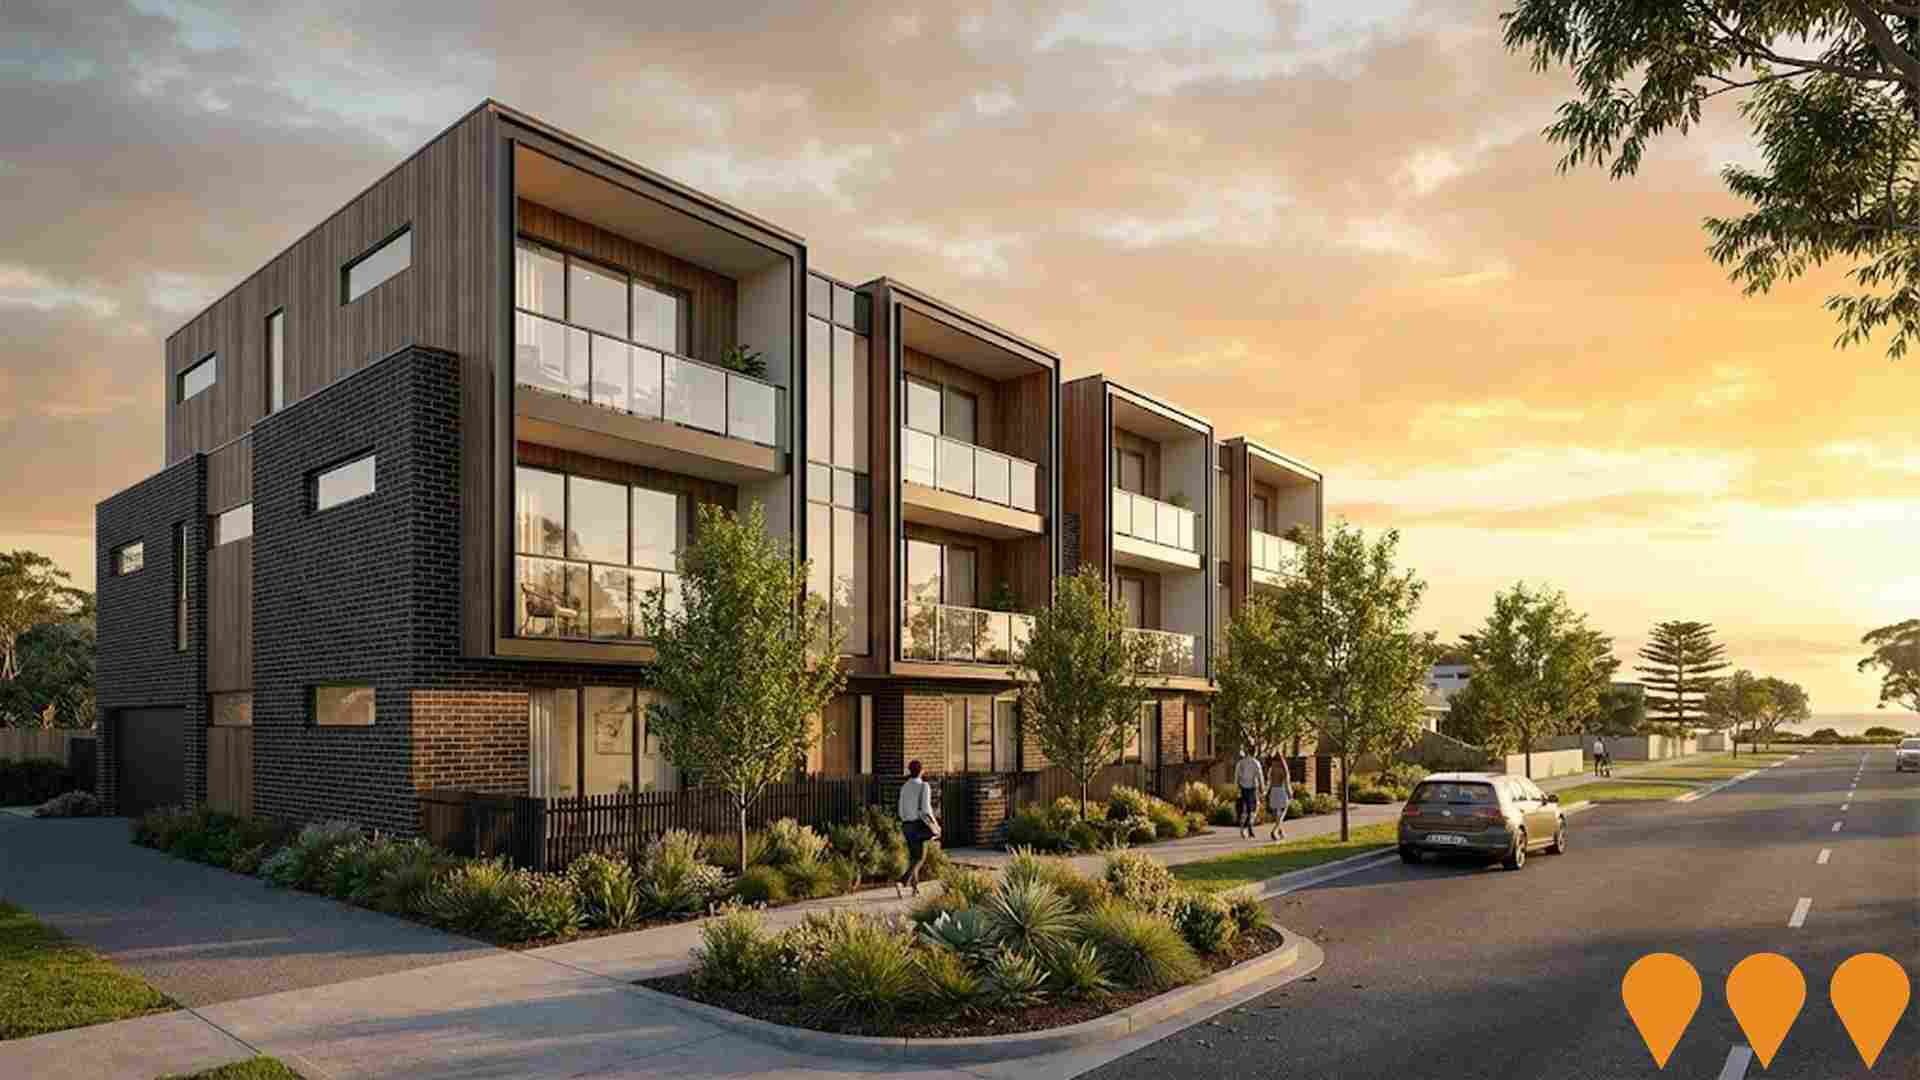
The Shores Estate
The Shores Estate is a prestigious collection of twelve impeccably designed townhouses offering luxury coastal living at Seaford. Located just steps from the beach, these architecturally designed homes feature 3-4 bedrooms, modern amenities, and capture stunning views of Port Phillip Bay or the tranquil creek.
Employment
Employment conditions in Seaford remain below the national average according to AreaSearch analysis
Seaford has a skilled workforce with essential services sectors well represented. Its unemployment rate was 5.2% in the past year, with an estimated employment growth of 2.9%.
As of September 2025, 9,313 residents are employed, while the unemployment rate is 0.5% higher than Greater Melbourne's rate of 4.7%. Workforce participation is lower at 61.6%, compared to Greater Melbourne's 64.1%. Leading employment industries include health care & social assistance, construction, and retail trade. Construction has notable concentration with levels at 1.5 times the regional average.
However, professional & technical services employ only 6.5% of local workers, below Greater Melbourne's 10.1%. The area offers limited local employment opportunities as indicated by Census data. Between September 2024 and September 2025, employment levels increased by 2.9%, labour force grew by 2.8%, resulting in a slight decrease in unemployment of 0.1 percentage points. In comparison, Greater Melbourne recorded employment growth of 3.0% with unemployment rising by 0.3 percentage points. State-level data from 25-Nov-25 shows Victoria's employment grew by 1.13% year-on-year, adding 41,950 jobs, with an unemployment rate of 4.7%. National employment forecasts suggest growth of 6.6% over five years and 13.7% over ten years. Applying these projections to Seaford's employment mix indicates local employment should increase by 6.4% over five years and 13.3% over ten years, though this is a simplified extrapolation for illustrative purposes only.
Frequently Asked Questions - Employment
Income
Income levels align closely with national averages, indicating typical economic conditions for Australian communities according to AreaSearch analysis
The Seaford SA2 had a median taxpayer income of $53,931 and an average of $63,005 in the financial year 2022. This was slightly lower than the national average, contrasting with Greater Melbourne's median income of $54,892 and average income of $73,761 during the same period. By September 2025, based on a 12.16% growth in wages since financial year 2022, estimated incomes would be approximately $60,489 (median) and $70,666 (average). According to the 2021 Census, personal income ranked at the 51st percentile ($809 weekly), while household income was at the 35th percentile. The majority of residents, 31.7% or 5,729 people, fell into the $1,500 - 2,999 income bracket, mirroring regional levels where 32.8% occupied this bracket. Housing affordability pressures were severe, with only 81.4% of income remaining after housing costs, ranking at the 33rd percentile. The area's SEIFA income ranking placed it in the 5th decile.
Frequently Asked Questions - Income
Housing
Seaford is characterized by a predominantly suburban housing profile, with above-average rates of outright home ownership
In Seaford, as per the latest Census evaluation, 73.7% of dwellings were houses, with the remaining 26.3% comprising semi-detached homes, apartments, and other types. This is compared to Melbourne metropolitan area's 79.8% houses and 20.2% other dwellings. Home ownership in Seaford stood at 28.7%, similar to Melbourne metro's level. The majority of dwellings were mortgaged (37.0%) or rented (34.3%). The median monthly mortgage repayment was $1,850, higher than Melbourne metro's average of $1,800. Median weekly rent in Seaford was $351, slightly lower than Melbourne metro's $356. Nationally, Seaford's mortgage repayments were below the Australian average of $1,863, and rents were less than the national figure of $375.
Frequently Asked Questions - Housing
Household Composition
Seaford features high concentrations of lone person households, with a lower-than-average median household size
Family households are 62.9% of all households, consisting of 25.3% couples with children, 22.5% couples without children, and 13.8% single parent families. Non-family households make up the remaining 37.1%, with lone person households at 33.7% and group households comprising 3.4%. The median household size is 2.3 people, which is smaller than the Greater Melbourne average of 2.5.
Frequently Asked Questions - Households
Local Schools & Education
Seaford performs slightly above the national average for education, showing competitive qualification levels and steady academic outcomes
The area's university qualification rate is 23.7%, significantly lower than Greater Melbourne's average of 37.0%. Bachelor degrees are the most common at 16.2%, followed by postgraduate qualifications (4.3%) and graduate diplomas (3.2%). Vocational credentials are prevalent, with 39.3% of residents aged 15+ holding them. This includes advanced diplomas (13.1%) and certificates (26.2%).
Educational participation is high, with 26.8% currently enrolled in formal education. This comprises 9.0% in primary, 6.5% in secondary, and 3.6% in tertiary education.
Frequently Asked Questions - Education
Schools Detail
Nearby Services & Amenities
Transport
Transport servicing is good compared to other areas nationally based on assessment of service frequency, route connectivity and accessibility
The public transport analysis indicates that Seaford has 90 active transport stops, offering a mix of train and bus services. These stops are served by 9 individual routes, collectively facilitating 4,396 weekly passenger trips. Transport accessibility is rated as good, with residents typically situated about 225 meters from the nearest transport stop.
Service frequency averages 628 trips per day across all routes, equating to roughly 48 weekly trips per individual stop.
Frequently Asked Questions - Transport
Transport Stops Detail
Health
Health performance in Seaford is lower than average with prevalence of common health conditions notable across both younger and older age cohorts
Seaford faces significant health challenges, with notable prevalence of common health conditions across both younger and older age cohorts.
Private health cover stands at approximately 51% of the total population (~9,235 people), slightly lagging behind the average SA2 area. The most prevalent medical conditions are mental health issues (impacting 10.2% of residents) and asthma (affecting 9.3%). In contrast, 64.1% of residents declare themselves completely clear of medical ailments, compared to 65.0% across Greater Melbourne. The area has 19.1% of residents aged 65 and over (3,452 people), which is higher than the 17.9% in Greater Melbourne. Health outcomes among seniors present some challenges, broadly aligned with the general population's health profile.
Frequently Asked Questions - Health
Cultural Diversity
In terms of cultural diversity, Seaford records figures broadly comparable to the national average, as found in AreaSearch's assessment of a number of language and cultural background related metrics
Seaford's cultural diversity aligns with the broader regional average, with 86.9% of residents being citizens, 78.9% born in Australia, and 89.8% speaking English exclusively at home. Christianity is the predominant religion in Seaford (40.4%), although Judaism is slightly overrepresented at 0.4%, compared to Greater Melbourne's 0.3%. The top three ancestry groups are English (29.9%), Australian (25.7%), and Irish (9.4%).
Some ethnic groups show notable variations: Russian is overrepresented at 0.6% in Seaford versus the regional average of 0.5%, Hungarian shows no significant difference at 0.4%, and Dutch are slightly underrepresented at 1.6%.
Frequently Asked Questions - Diversity
Age
Seaford's population is slightly older than the national pattern
Seaford has a median age of 40, which is slightly higher than Greater Melbourne's figure of 37 and Australia's median age of 38 years. The 65-74 age cohort is notably over-represented in Seaford at 10.0%, compared to the Greater Melbourne average, while the 25-34 year-olds are under-represented at 12.4%. Between 2021 and present, the 15-24 age group has increased from 9.2% to 10.3% of Seaford's population, while the 25-34 cohort has declined from 13.7% to 12.4%. By 2041, demographic modeling suggests significant changes in Seaford's age profile. The 75-84 age cohort is projected to expand by 519 people (43%), from 1,216 to 1,736. Notably, the combined 65+ age groups will account for 59% of total population growth, reflecting Seaford's aging demographic profile. Meanwhile, the 25-34 and 5-14 cohorts are expected to experience population declines.
