Chart Color Schemes
est. as @ -- *
ABS ERP | -- people | --
2021 Census | -- people
Sales Activity
Curious about local property values? Filter the chart to assess the volume and appreciation (including resales) trends and regional comparisons, or scroll to the map below view this information at an individual property level.
Find a Recent Sale
Sales Detail
Population
An assessment of population growth drivers in Chelsea Heights reveals an overall ranking slightly below national averages considering recent, and medium term trends
Chelsea Heights' population is approximately 5,456 as of November 2025. This represents an increase of 63 individuals since the 2021 Census, which reported a population of 5,393. The change is inferred from ABS's estimated resident population of 5,456 in June 2024 and five additional validated addresses post-Census. This results in a population density ratio of 1,705 persons per square kilometer, higher than the national average assessed by AreaSearch. Overseas migration contributed approximately 60.2% to recent population growth.
AreaSearch employs ABS/Geoscience Australia projections for each SA2 area, released in 2024 with a base year of 2022. For areas not covered, AreaSearch uses VIC State Government's Regional/LGA projections from 2023, adjusted using weighted aggregation methods to SA2 levels. Growth rates by age group are applied across all areas for years 2032 to 2041. Based on current demographic trends, Chelsea Heights is expected to grow by approximately 638 persons by 2041, indicating a total increase of about 11.7% over the 17-year period.
Frequently Asked Questions - Population
Development
The level of residential development activity in Chelsea Heights is very low in comparison to the average area assessed nationally by AreaSearch
Chelsea Heights has seen approximately seven new homes approved annually. Between FY21 and FY25, 38 homes were approved, with two more approved in FY26 so far. The population decline in recent years suggests that the new supply has likely been meeting demand, providing good options for buyers.
New properties are constructed at an average cost of $412,000. In FY26, $5.6 million in commercial development approvals have been recorded, indicating Chelsea Heights' primarily residential nature. Compared to Greater Melbourne, Chelsea Heights has significantly less development activity, 74.0% below the regional average per person. This constrained new construction typically reinforces demand and pricing for existing dwellings. Nationally, this activity is also lower, reflecting market maturity and possible development constraints.
New building activity consists of 80.0% detached houses and 20.0% medium and high-density housing, maintaining the area's suburban identity with a concentration of family homes suitable for buyers seeking space. With around 1130 people per dwelling approval, Chelsea Heights reflects a highly mature market. Population forecasts indicate that Chelsea Heights will gain 638 residents by 2041. At current development rates, housing supply may struggle to match population growth, potentially intensifying buyer competition and supporting price increases.
Frequently Asked Questions - Development
Infrastructure
Chelsea Heights has strong levels of nearby infrastructure activity, ranking in the top 30% nationally
Changes to local infrastructure significantly impact an area's performance. AreaSearch has identified a total of 0 projects likely to affect this area. Notable projects include The Dell by Stockland, Aspendale Gardens Shopping Centre Redevelopment, Monash Freeway Upgrade Stage 2, and Frankston Line Level Crossing Removal Program, with the following list providing details on those most relevant.
Professional plan users can use the search below to filter and access additional projects.
INFRASTRUCTURE SEARCH
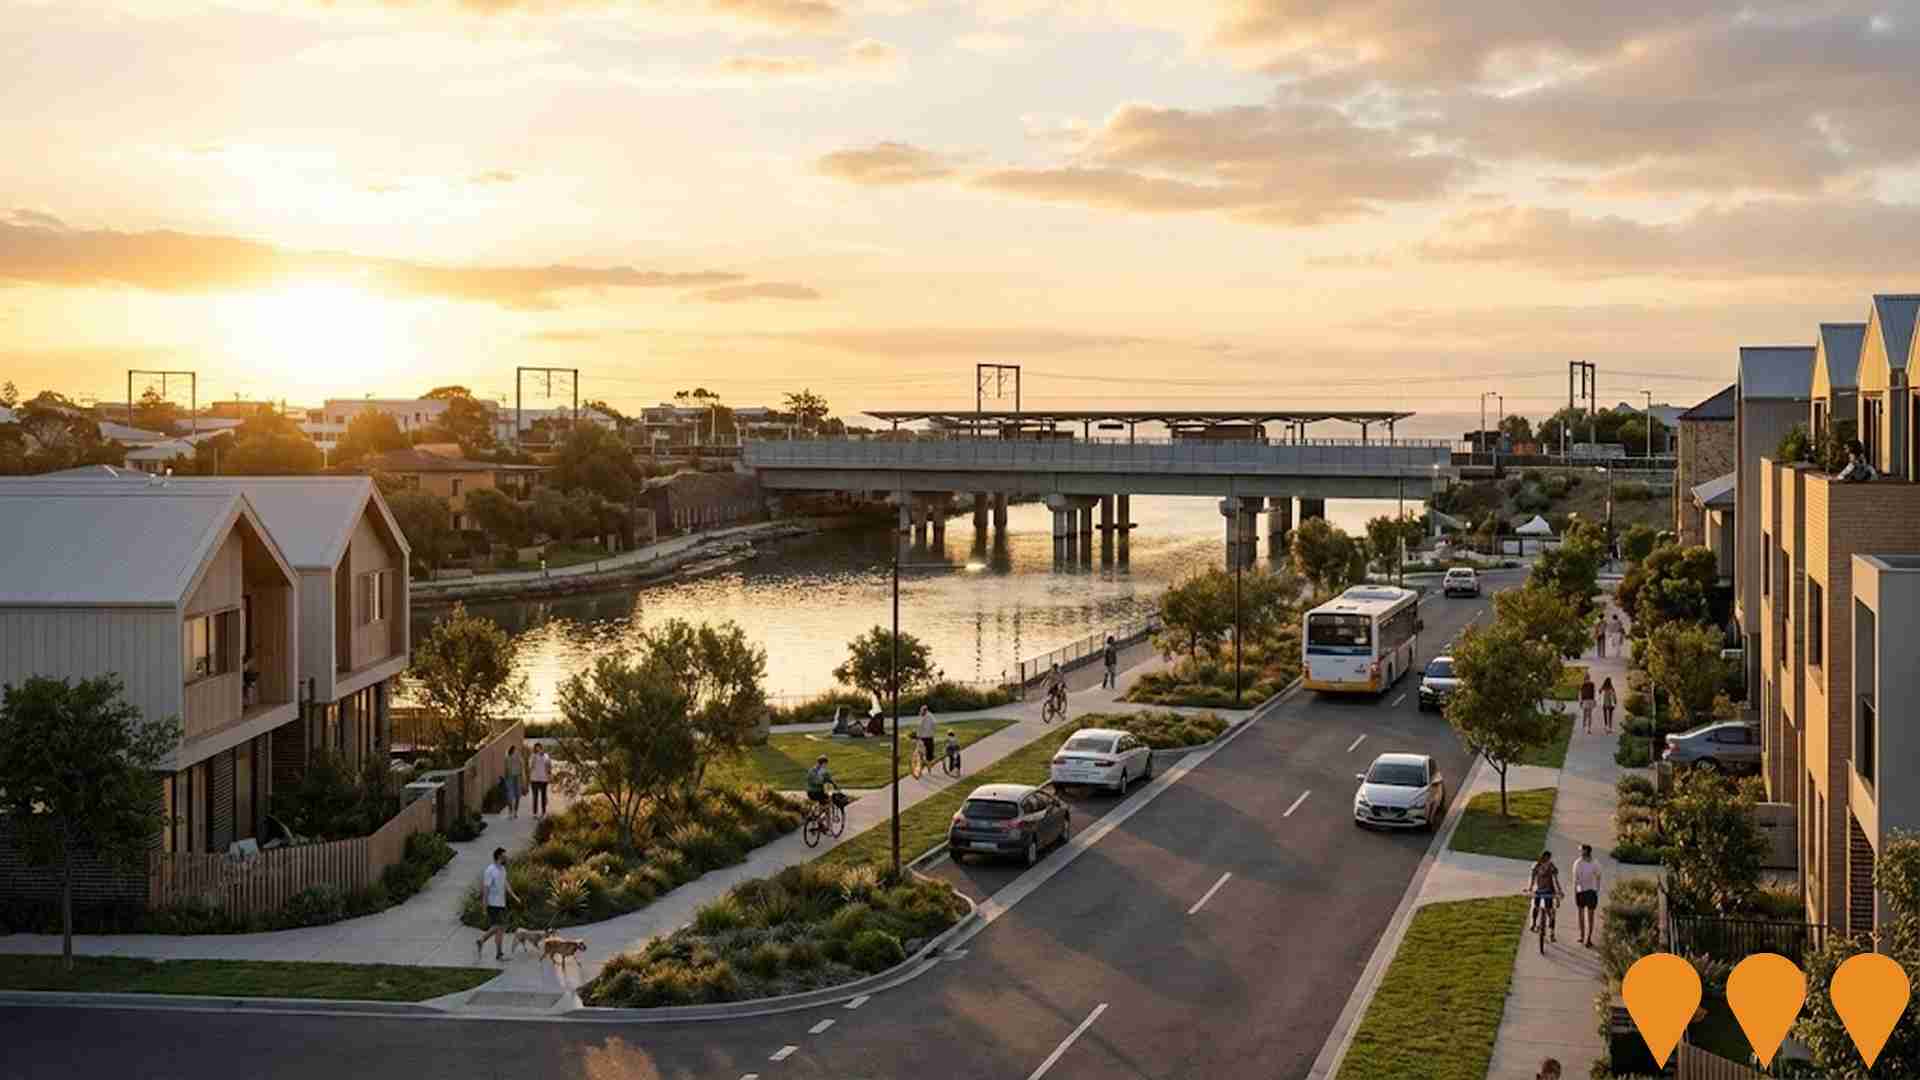
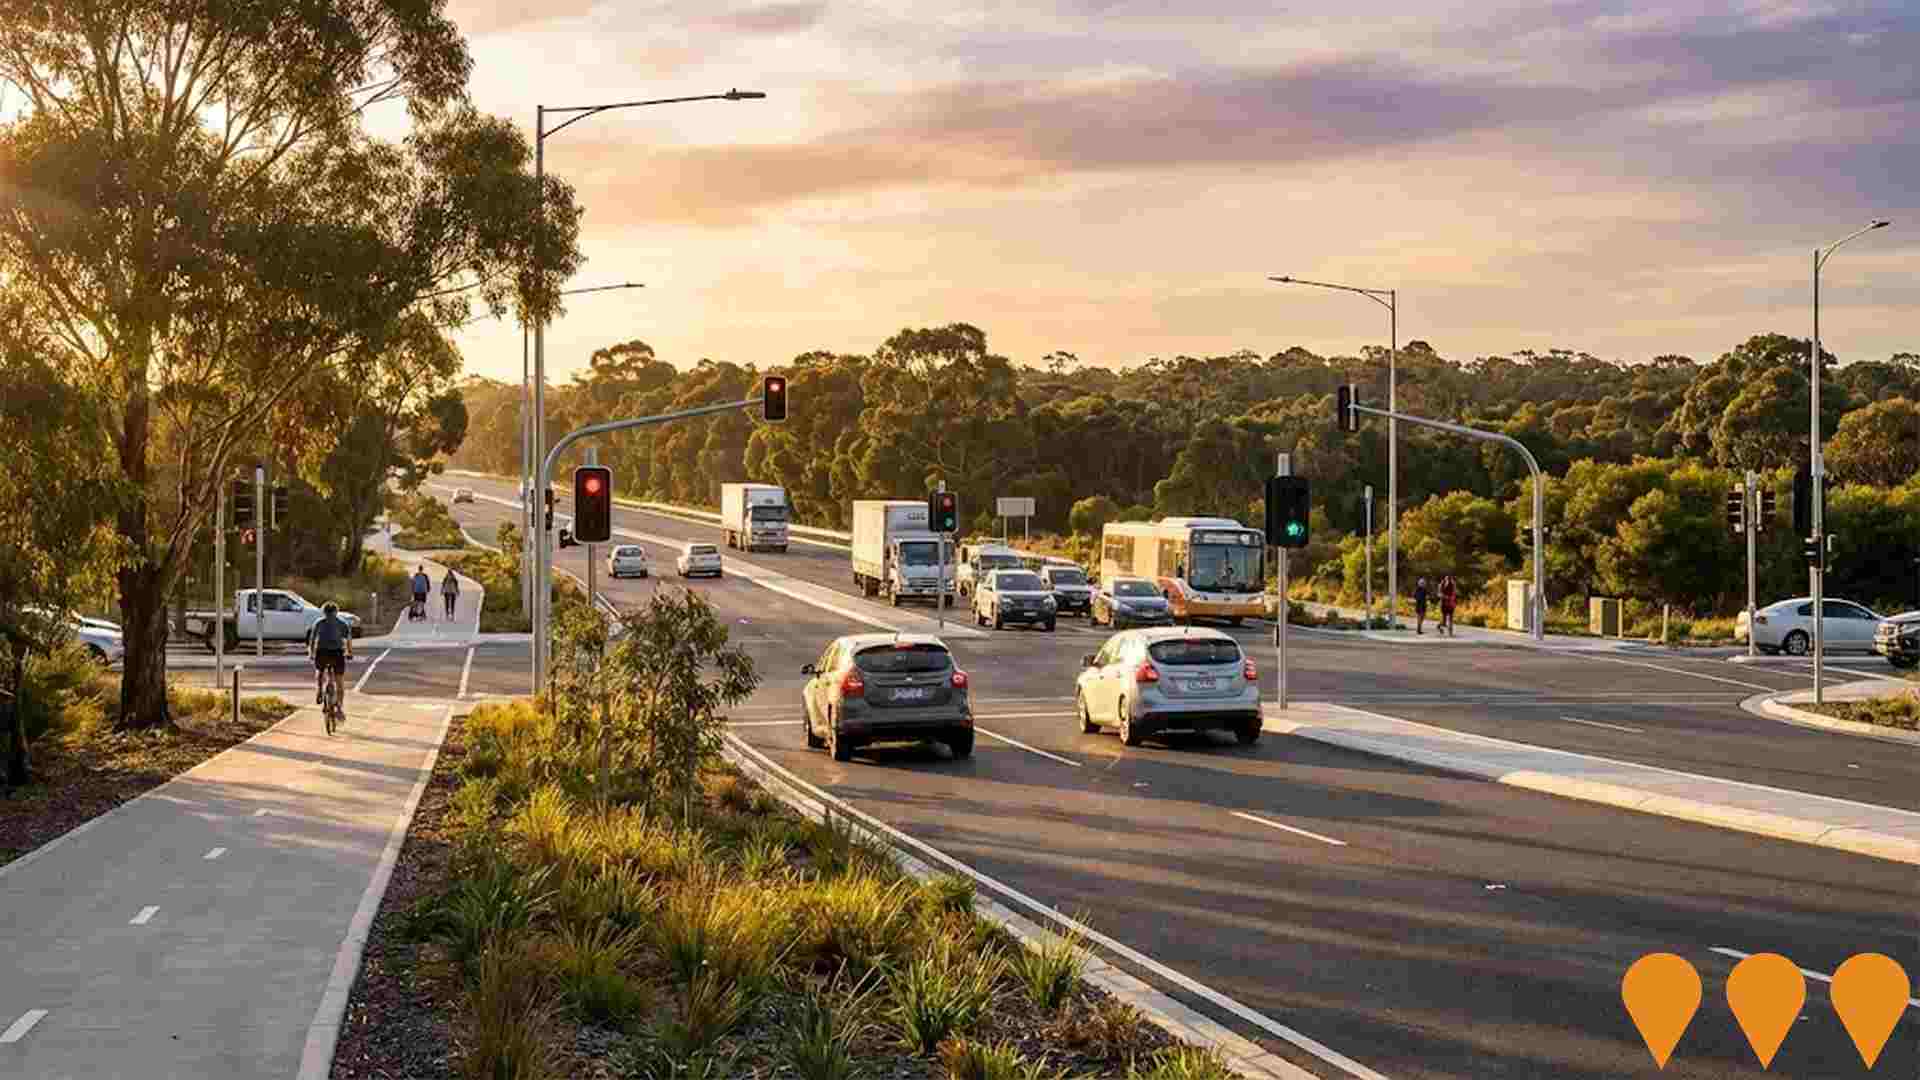
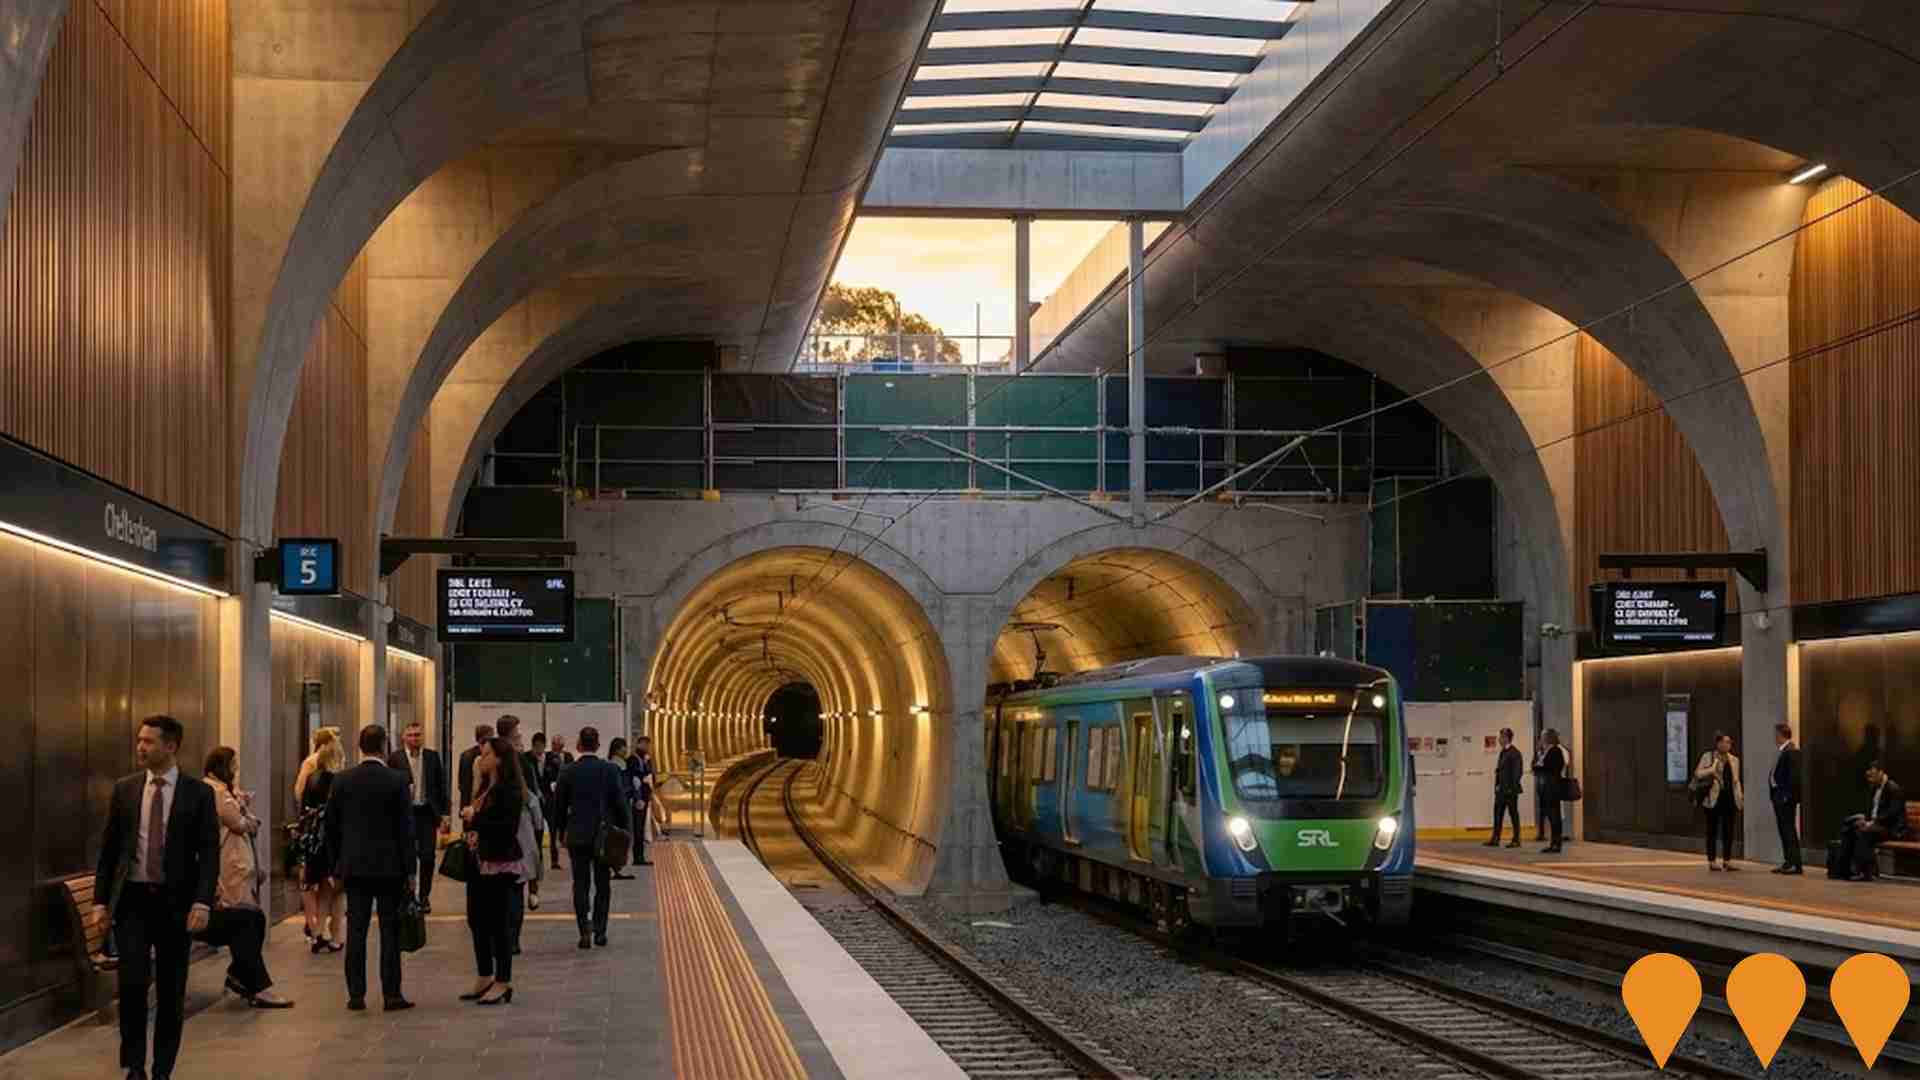
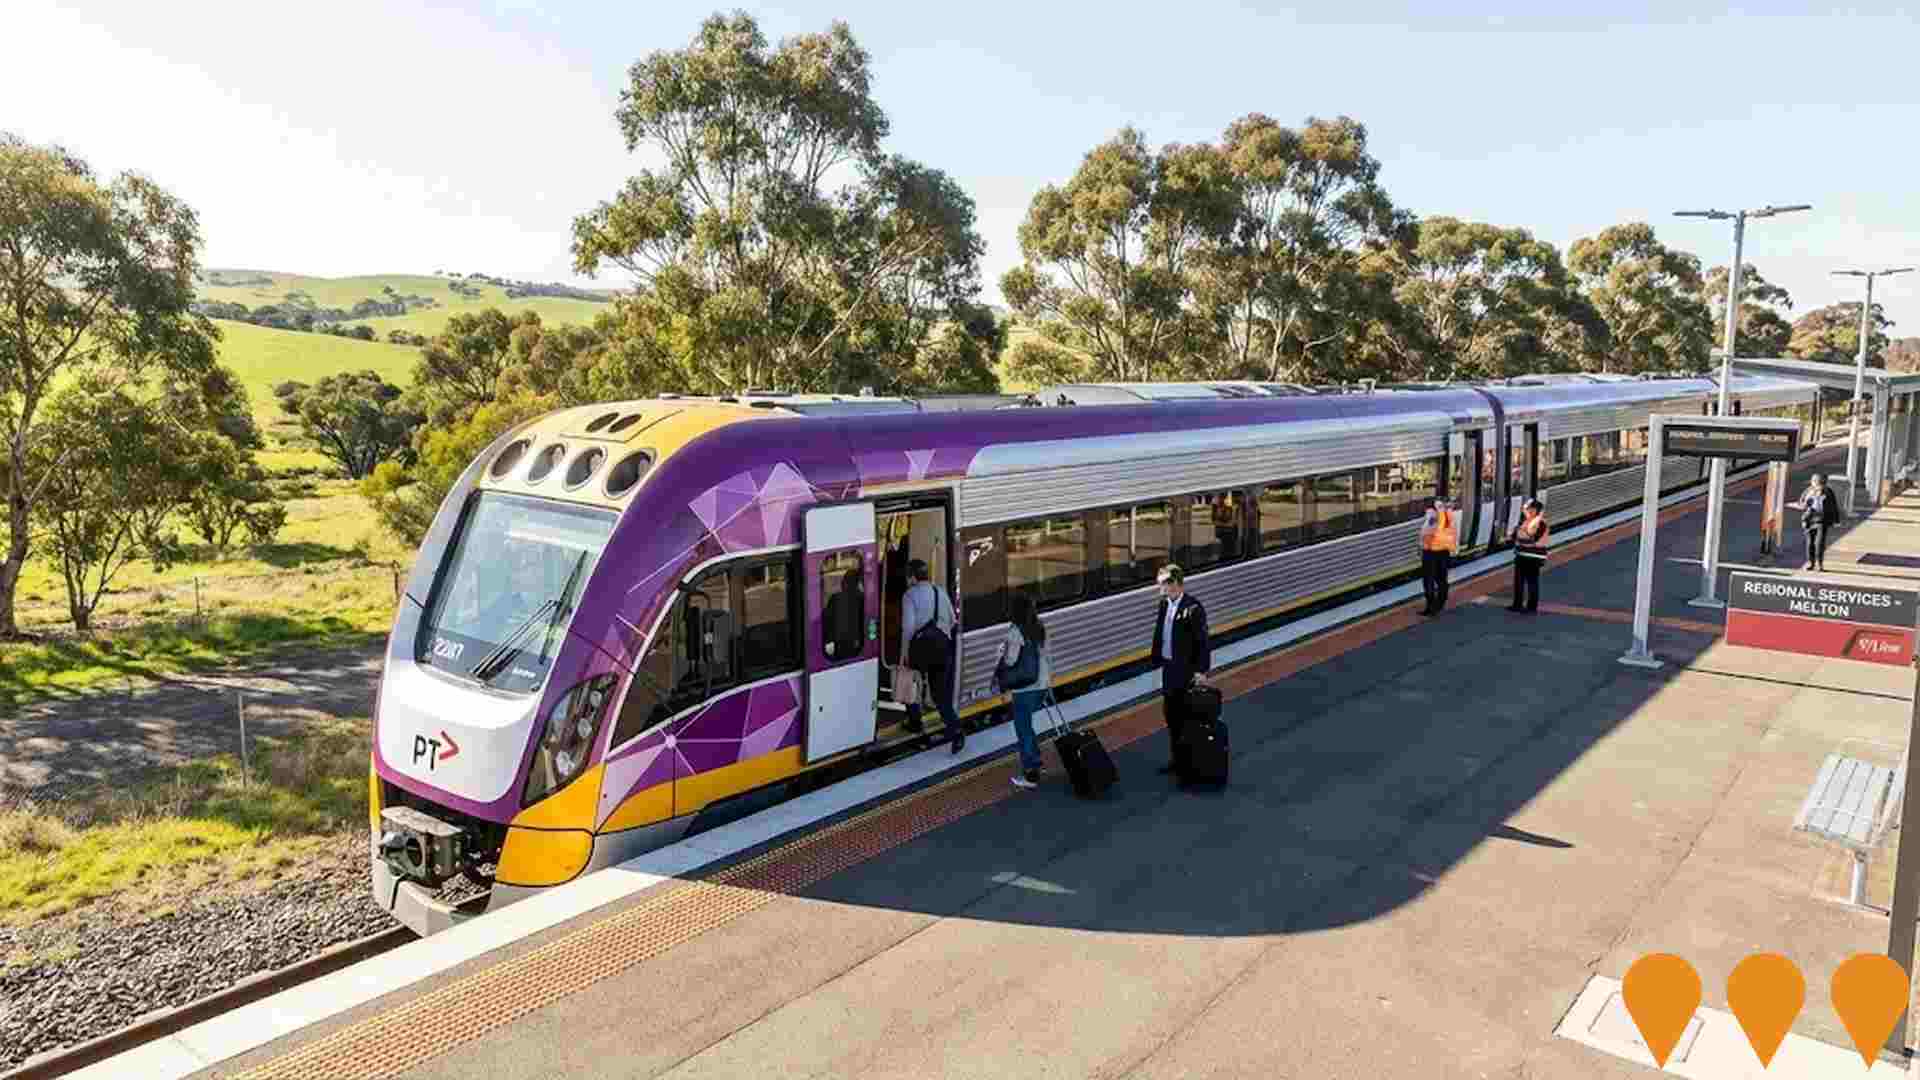
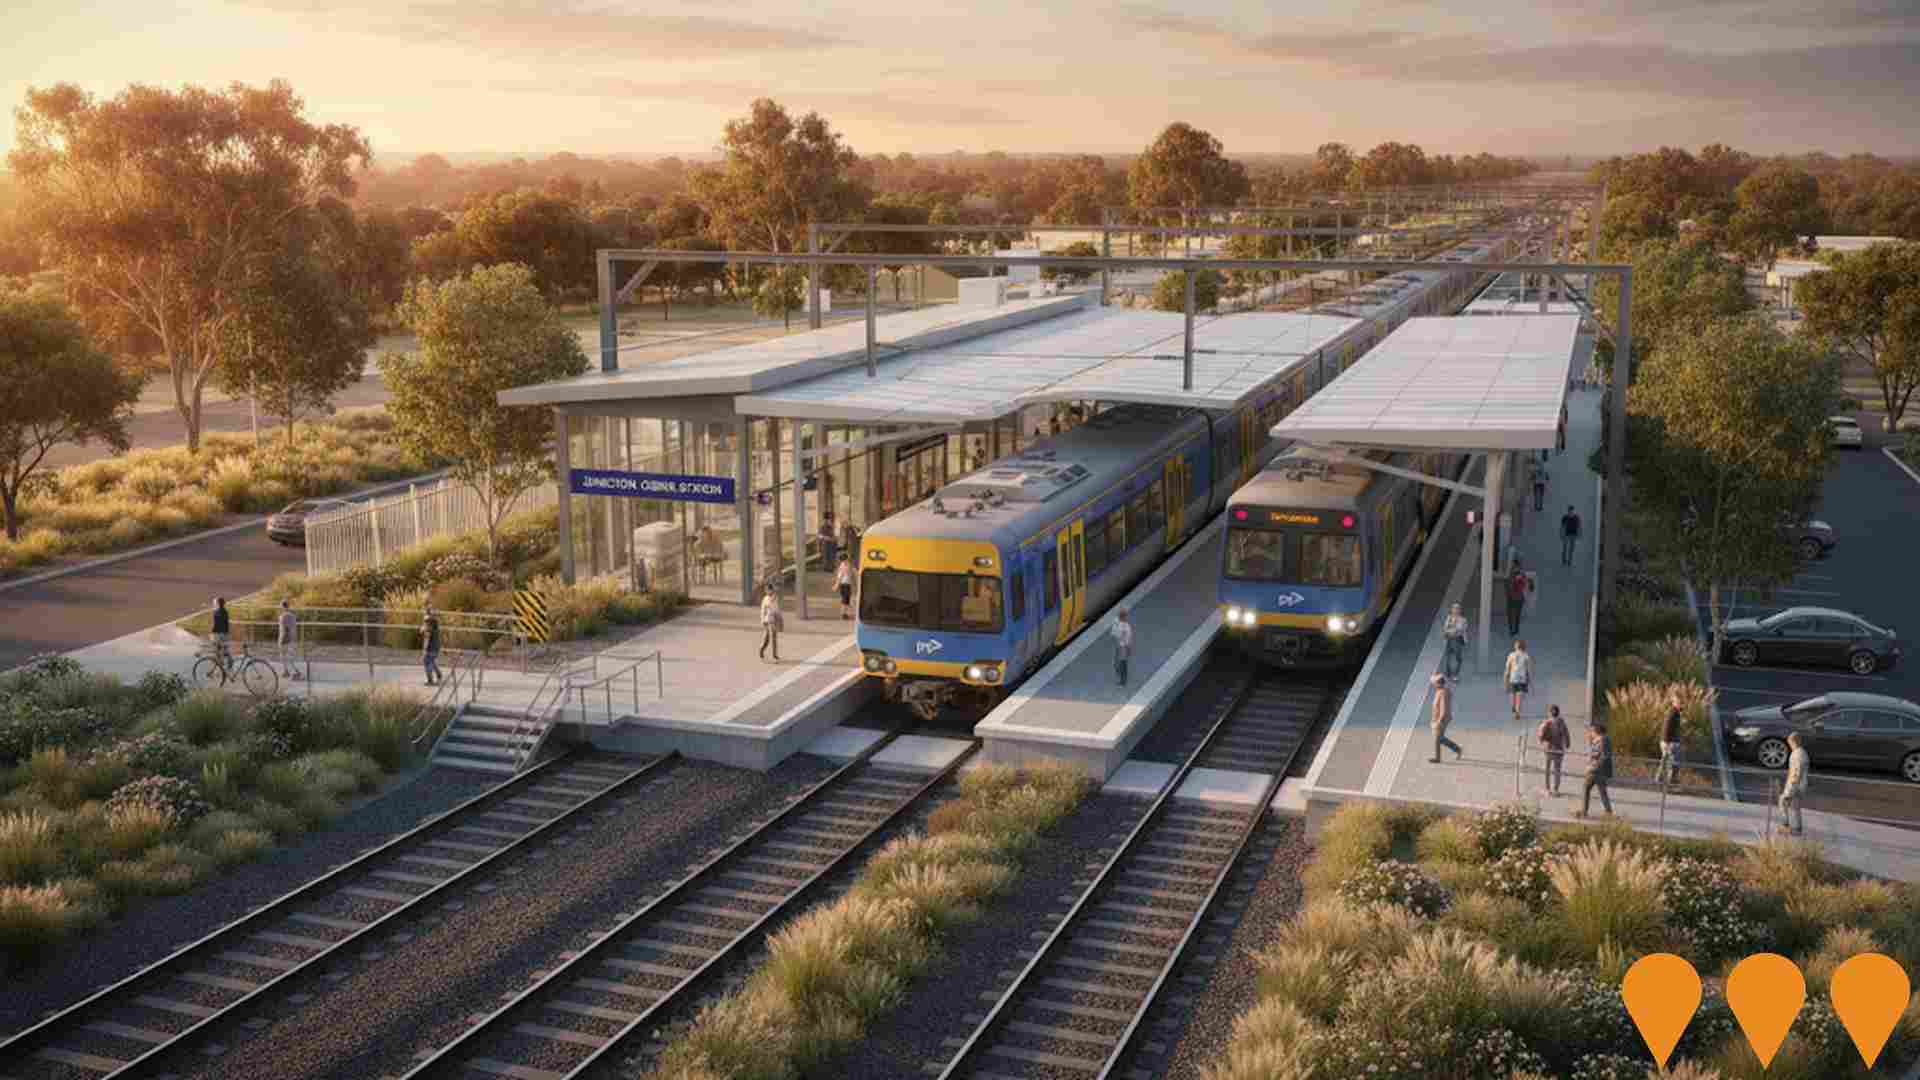
 Denotes AI-based impression for illustrative purposes only, not to be taken as definitive under any circumstances. Please follow links and conduct other investigations from the project's source for actual imagery. Developers and project owners wishing us to use original imagery please Contact Us and we will do so.
Frequently Asked Questions - Infrastructure
Peninsula Link Freeway
27-kilometre toll-free freeway connecting EastLink at Carrum Downs to Mornington Peninsula Freeway at Mount Martha. Features innovative noise walls, public art installations, and saves up to 40 minutes travel time.
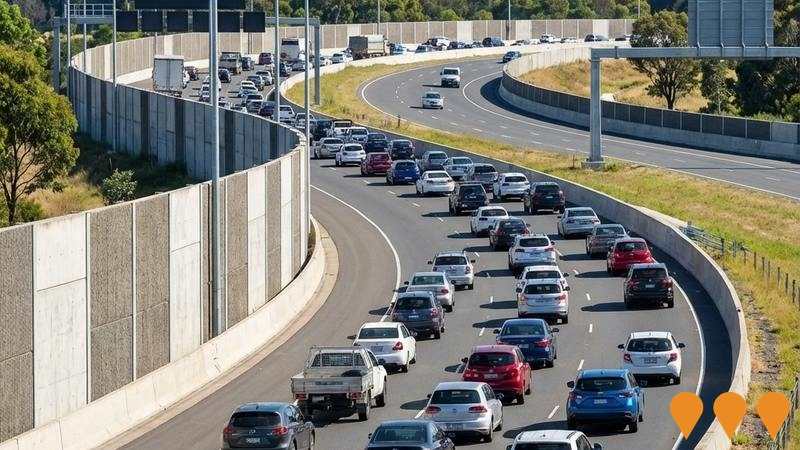
Level Crossing Removal - Caulfield to Dandenong
Major infrastructure project removing 9 level crossings by elevating the railway line between Caulfield and Dandenong on the Cranbourne-Pakenham corridor. Includes complete redevelopment of 5 elevated stations (Carnegie, Murrumbeena, Hughesdale, Clayton, and Noble Park) with modern facilities, improved accessibility, and integration with new public open space (22.5 hectares of parkland). Delivered as a single $1.6-2.4 billion package, significantly improving safety, reducing congestion, and enabling more train services.
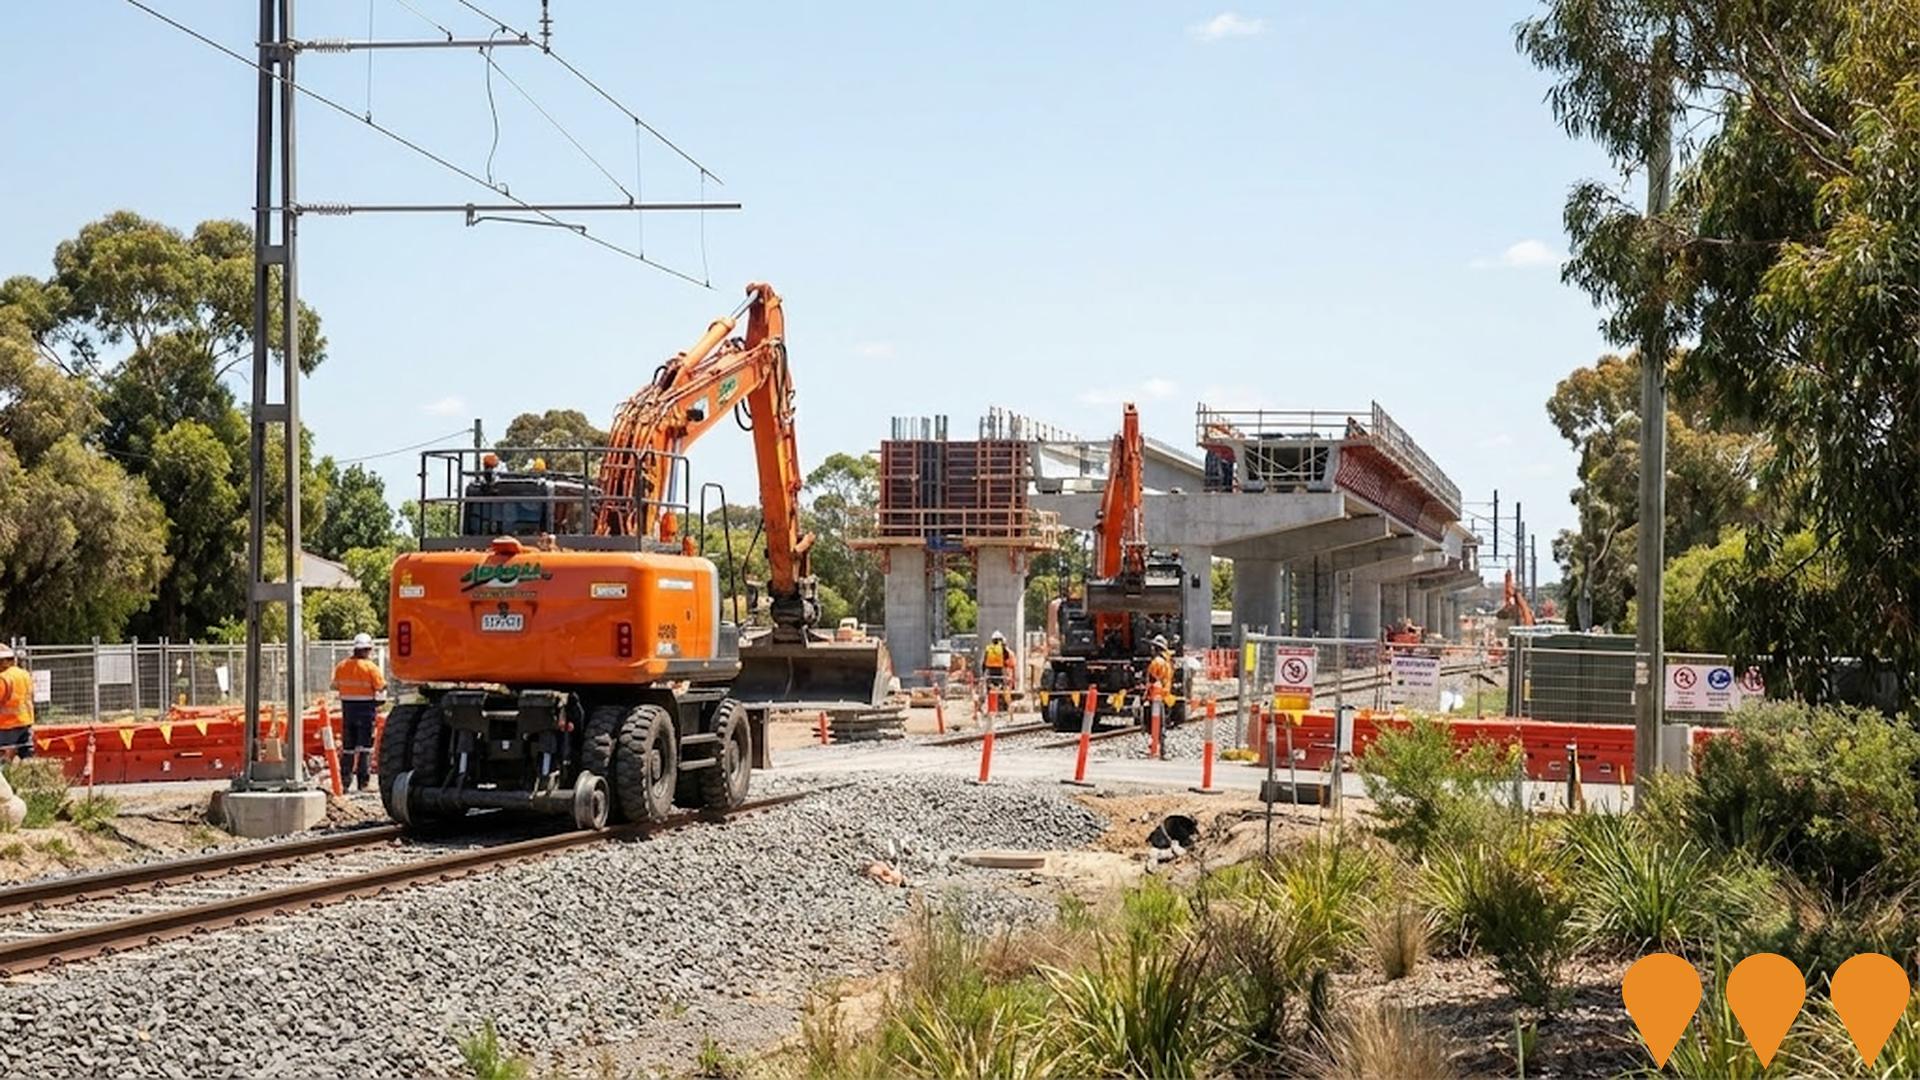
Monash Freeway Upgrade Stage 2
Major $1.4 billion freeway upgrade adding 36km of new lanes between Warrigal Road and Cardinia Road. Includes upgraded Beaconsfield interchange with new diamond configuration, Police Road connection, Jackson Road direct link to EastLink, O'Shea Road extension and widening, smart lane management systems, and shared cycling paths. Completed end of 2022, reducing travel times by up to 9 minutes during peak hours for 470,000 daily users.
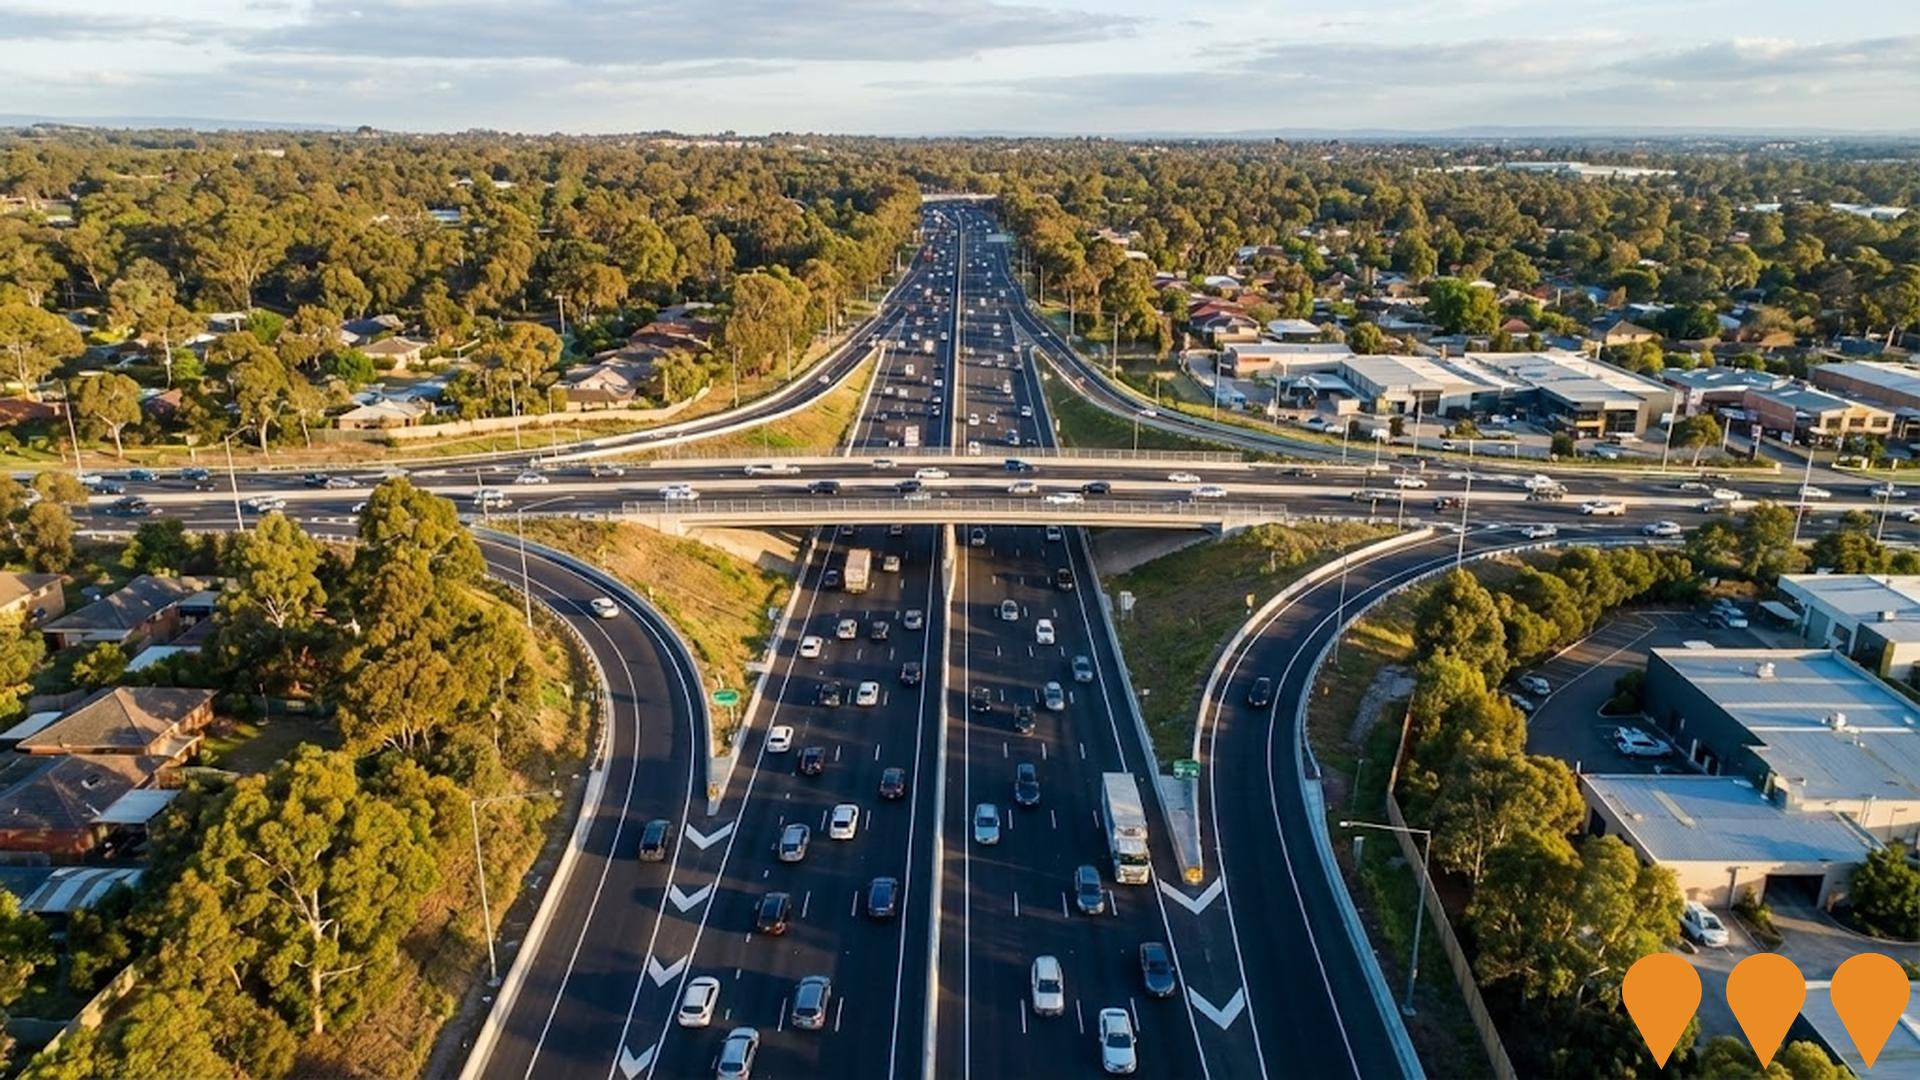
Frankston Line Level Crossing Removal Program
Victorian Government program to remove all 27 remaining level crossings on the Frankston Line by 2029, delivering a boom-gate-free corridor from Caulfield to Frankston. The project includes rebuilding 19 stations, major rail trench and elevated rail sections, new and upgraded stations at Cheltenham, Mentone, Mordialloc, Aspendale, Seaford and Frankston, plus extensive open space creation and active transport links. As of December 2025, 20 of the 27 crossings have been removed, with major works continuing at Mentone, Cheltenham, Bonbeach and Carrum, and planning advancing for the final stages toward Frankston.
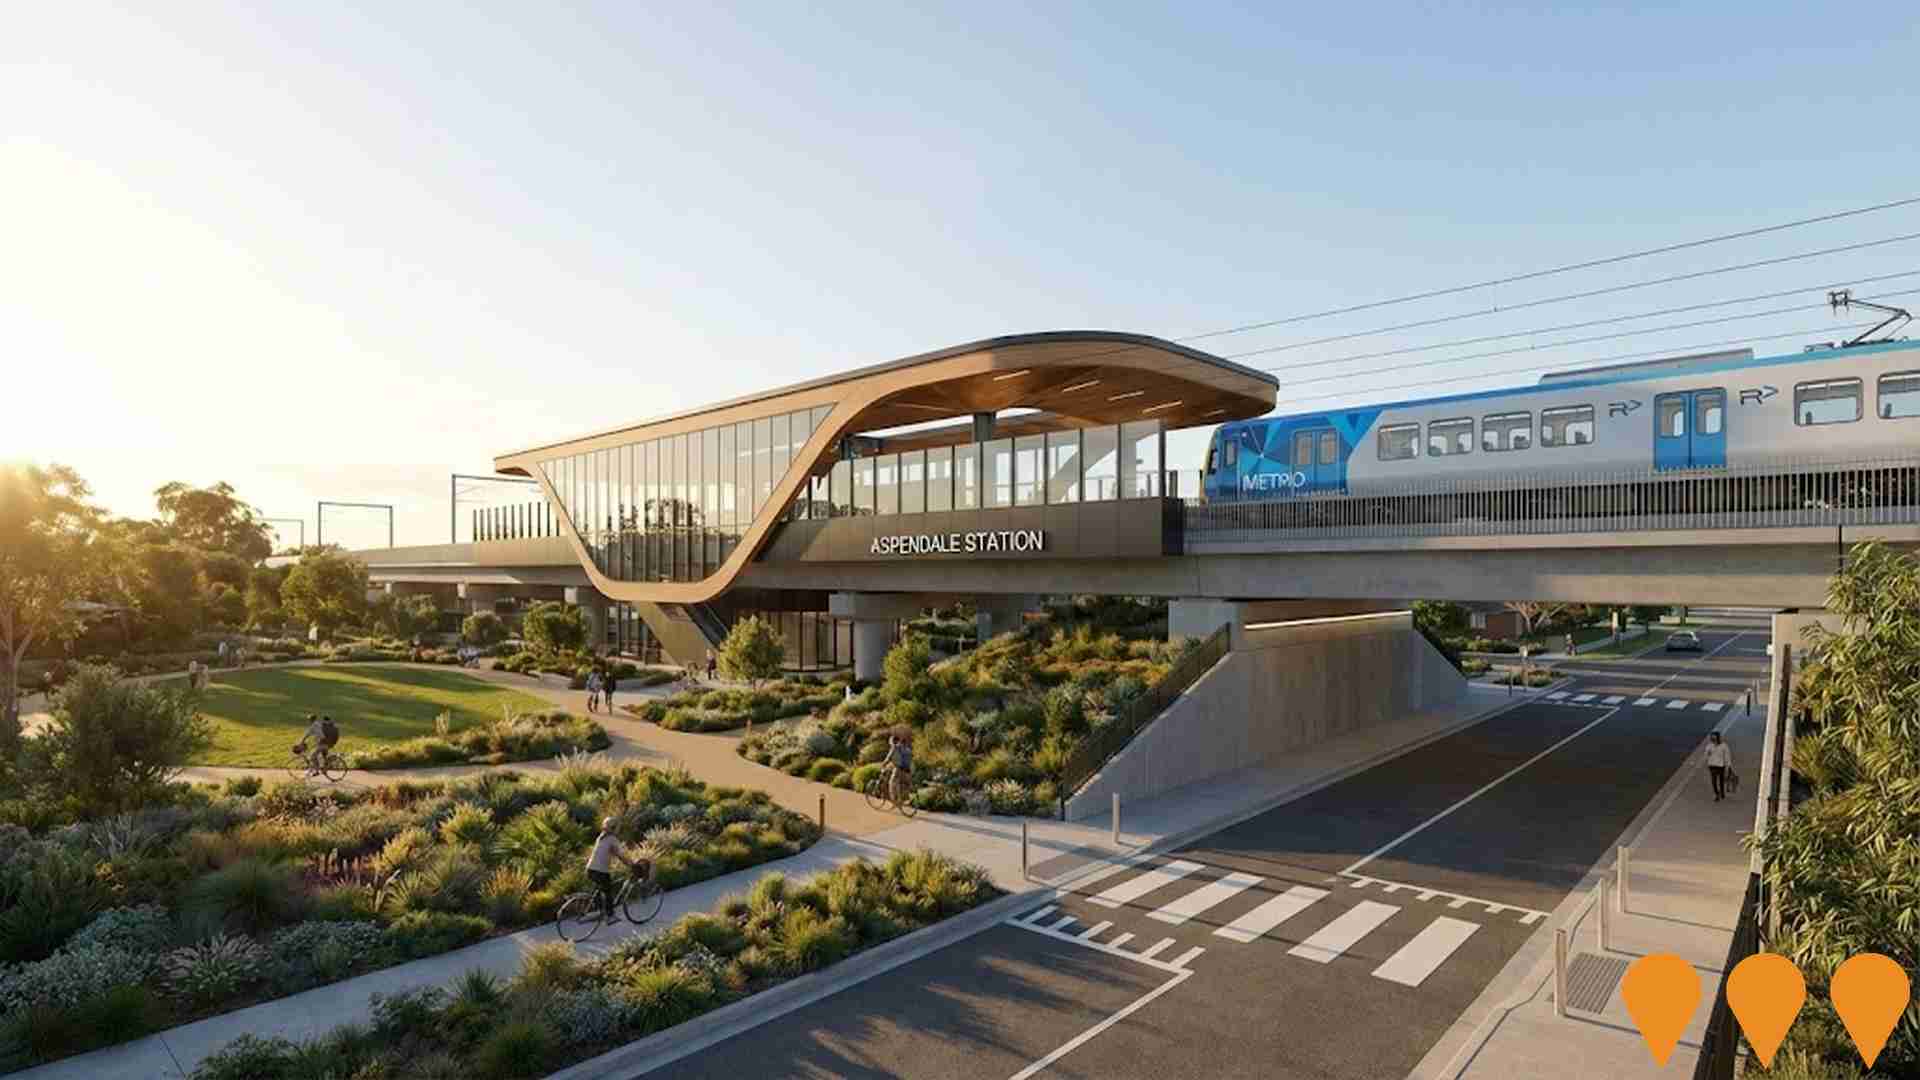
EastLink Freeway Noble Park Section
39km tollway connecting the Eastern and Mornington Peninsula Freeways, featuring innovative design with the railway line running in the freeway median through Noble Park. Operated by ConnectEast, owned by Horizon Roads consortium. The freeway serves approximately 250,000 vehicles daily and includes two 1.6km tunnels protecting the Mullum Mullum valley.
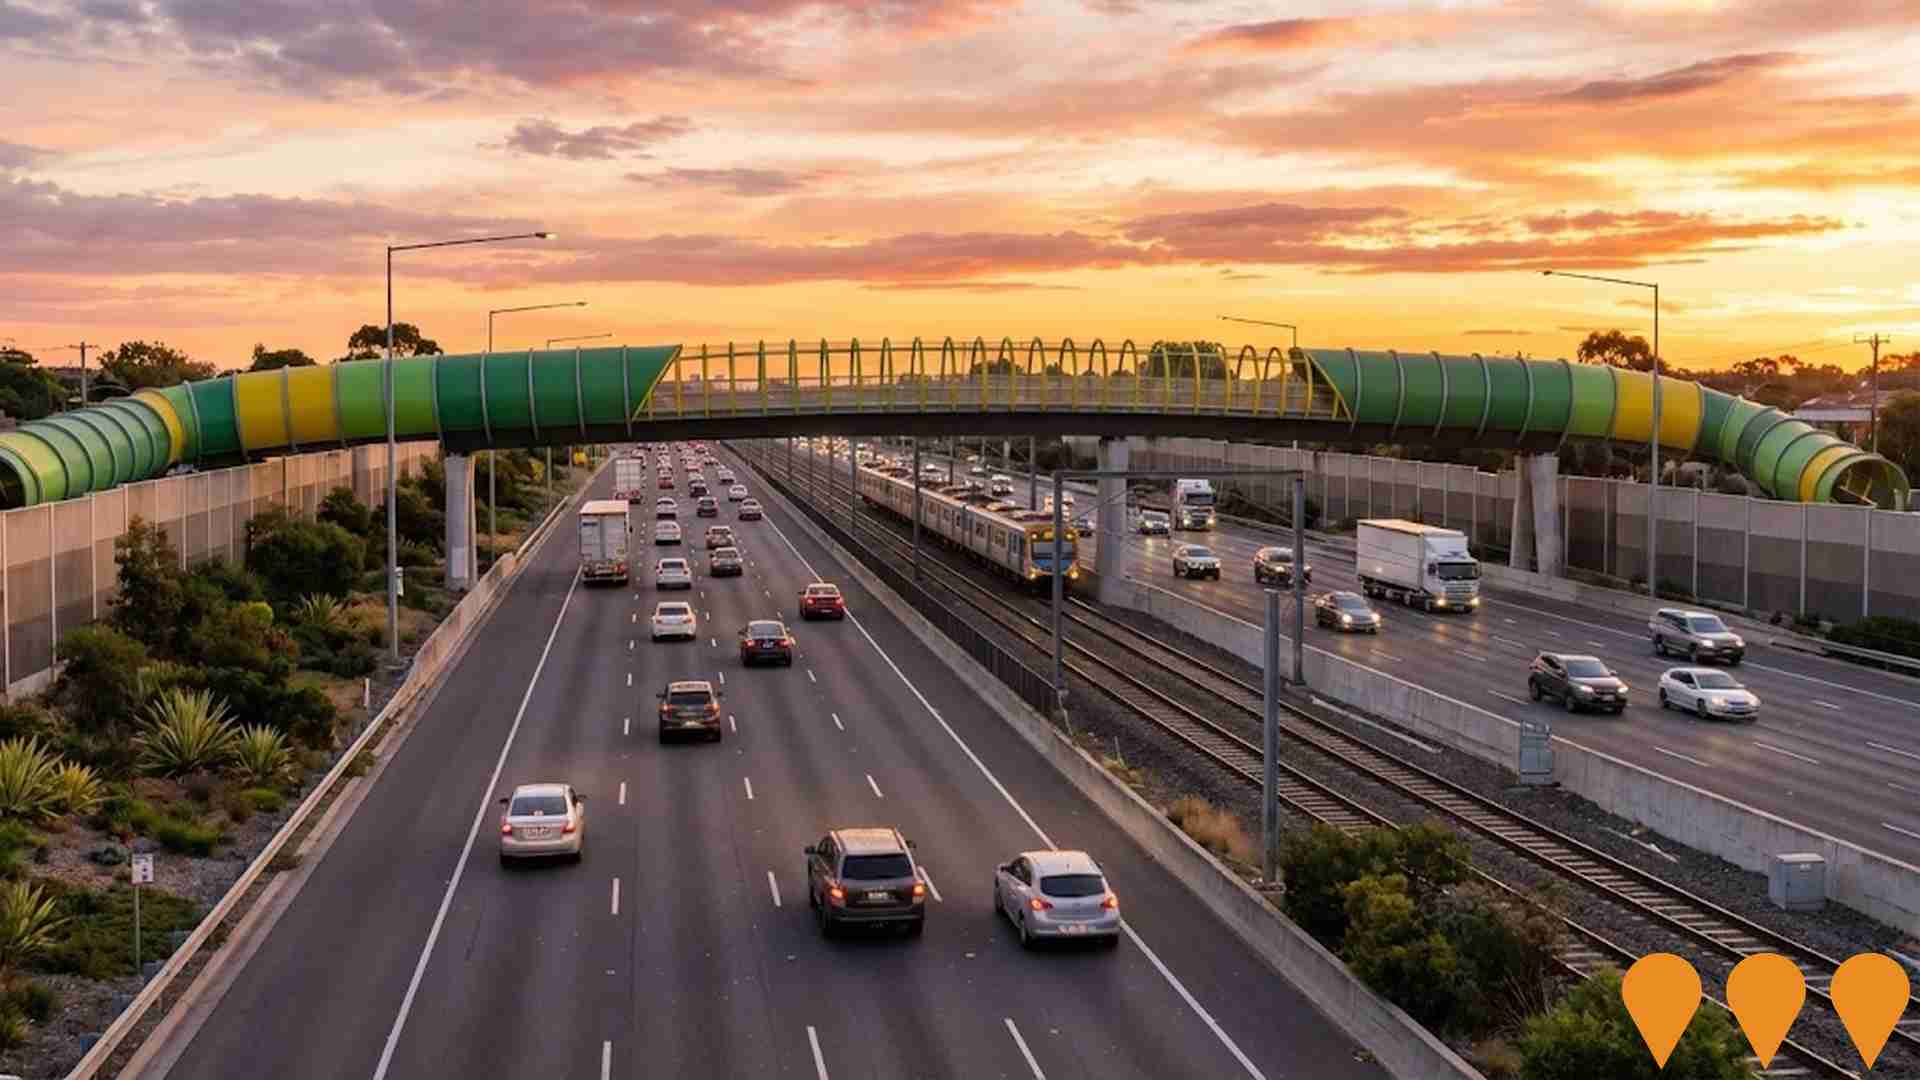
Cranbourne Line Upgrade
Major $1 billion upgrade including 8km track duplication between Cranbourne and Dandenong (completed February 2022), new Merinda Park Station (opened), removal of level crossings, and infrastructure to support 10-minute train services. Creates capacity for 121,000 additional passengers per week. Track duplication complete, with final level crossings at Webster Street and Camms Road to be removed by 2025. Will be the first level crossing-free line on Melbourne's network.
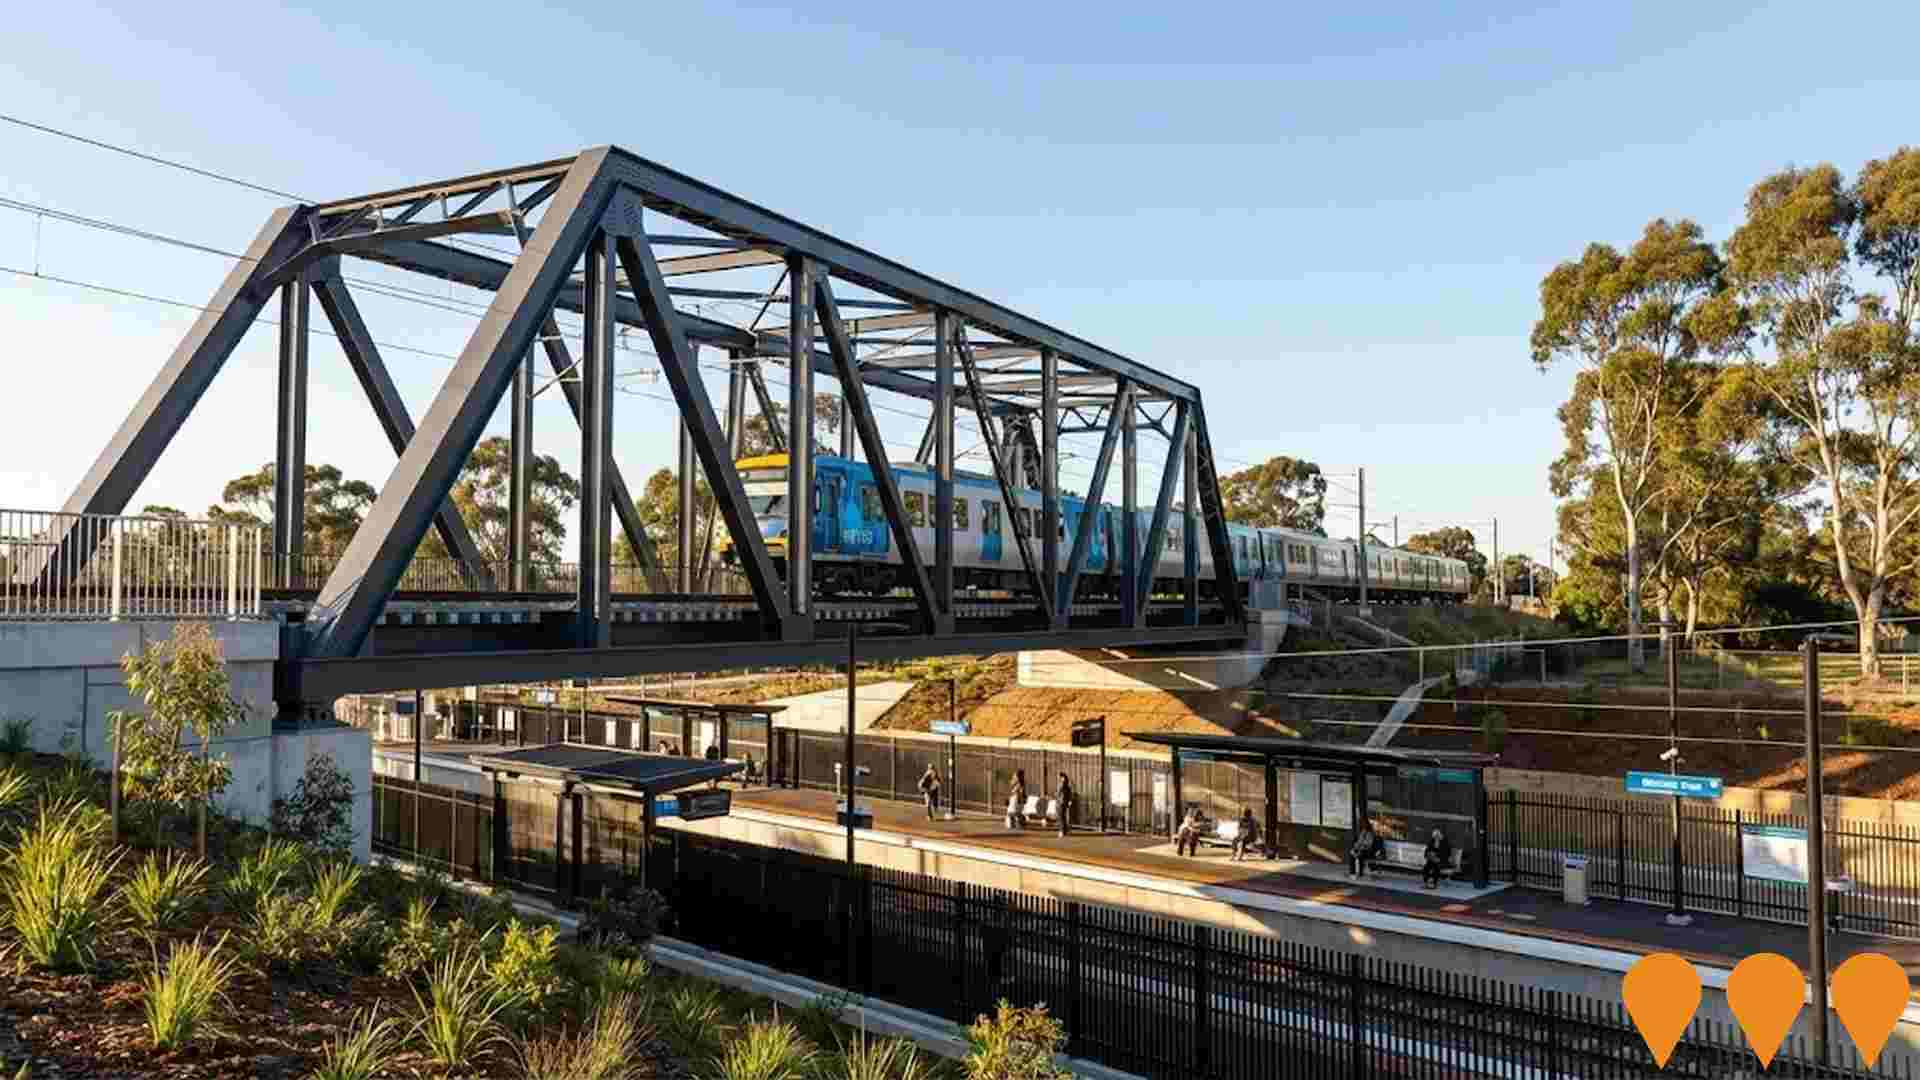
Aspendale Gardens Shopping Centre Redevelopment
Proposed expansion and modernisation of Aspendale Gardens Shopping Centre, which includes a Ritchies Supa IGA and approximately 17 specialty stores. The redevelopment may involve the development of a top floor of approximately 3700 sq. metres. Community discussion in 2021 noted concerns about a new proposed shopping center being approved near existing gambling venues. The shopping centre offers exposure to approximately 30,000 visitors weekly.
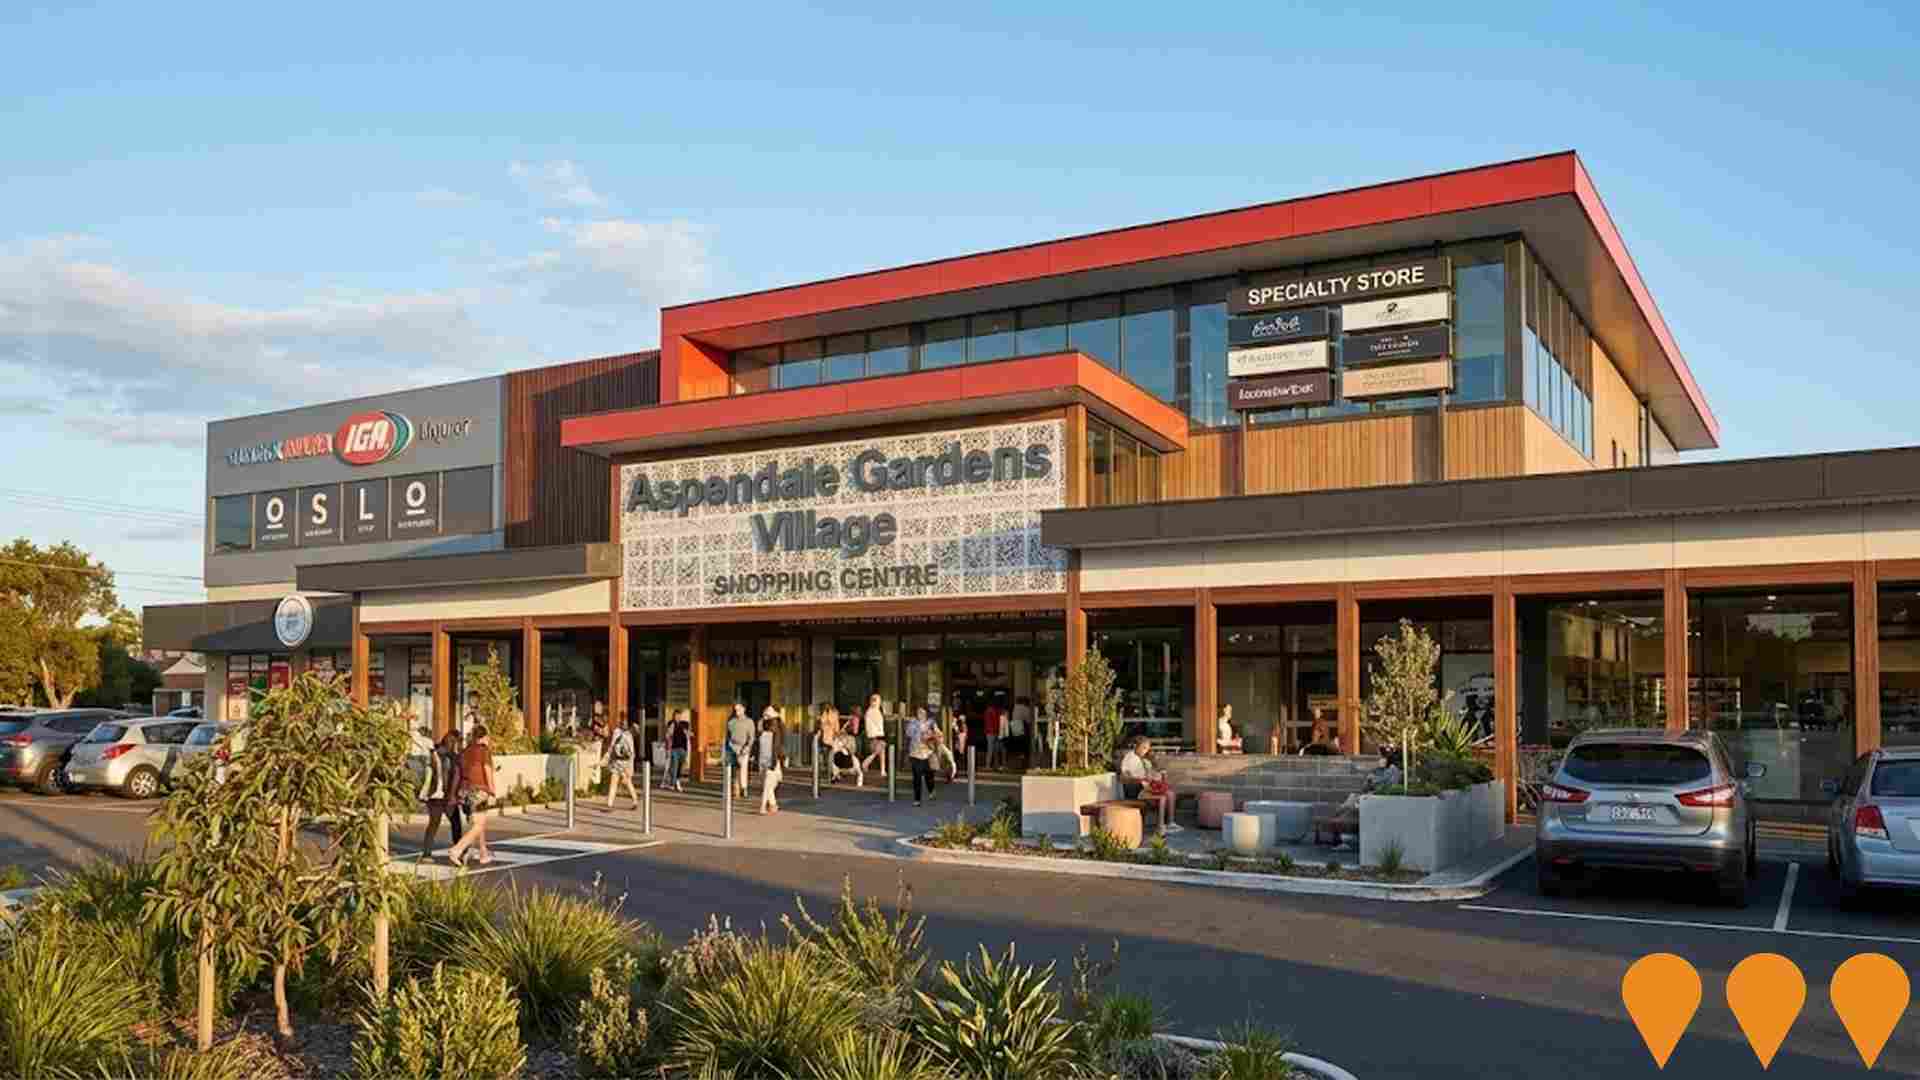
Frankston to Baxter Rail Upgrade
Proposed upgrade and duplication of the Frankston to Baxter railway line to improve services to the Mornington Peninsula. The project would enable more frequent train services and better connectivity for Peninsula residents. It includes electrification, new stations at Frankston East, Langwarrin, and Baxter. Cancelled in 2023 by the federal government due to underfunding, it has been proposed for revival by the opposition ahead of the 2025 federal election.
Employment
The labour market performance in Chelsea Heights lags significantly behind most other regions nationally
Chelsea Heights has a skilled workforce with notable representation in the construction sector. Its unemployment rate is 7.3%.
As of June 2025, 2848 residents are employed while the unemployment rate stands at 7.3%, which is 2.7% higher than Greater Melbourne's rate of 4.6%. Workforce participation is similar to Greater Melbourne's rate of 64.1%. The leading employment industries among Chelsea Heights' residents are health care & social assistance, construction, and manufacturing. Manufacturing particularly shows strong specialization with an employment share of 1.6 times the regional level.
Conversely, professional & technical services have lower representation at 6.3% compared to the regional average of 10.1%. The area offers limited local employment opportunities as indicated by the census working population versus resident population count. Between June 2024 and June 2025, Chelsea Heights' labour force increased by 1.4%, but employment declined by 1.4%, leading to a rise in unemployment rate of 2.6 percentage points. In comparison, Greater Melbourne saw employment grow by 3.5% and labour force grow by 4.0%, with unemployment rising by 0.5 percentage points. Jobs and Skills Australia's national employment forecasts from May 2025 suggest that Chelsea Heights' employment could increase by approximately 6.2% over five years and 13.0% over ten years, based on simple weighting extrapolations of industry-specific projections against the local employment mix.
Frequently Asked Questions - Employment
Income
The economic profile demonstrates above-average performance, with income metrics exceeding national benchmarks based on AreaSearch comparative assessment
AreaSearch's latest postcode level ATO data for financial year 2022 shows median income in Chelsea Heights is $53,213 and average income is $64,351. This compares to Greater Melbourne's median income of $54,892 and average income of $73,761. Based on Wage Price Index growth of 12.16% from financial year 2022 to September 2025, estimated incomes would be approximately $59,684 (median) and $72,176 (average). According to Census 2021 income data, Chelsea Heights' household, family, and personal incomes fall around the 53rd percentile nationally. The $1,500 - 2,999 earnings band includes 33.5% of individuals in Chelsea Heights (1,827 people), similar to metropolitan Melbourne at 32.8%. After housing costs, 85.6% of income remains for other expenses. Chelsea Heights' SEIFA income ranking places it in the 6th decile.
Frequently Asked Questions - Income
Housing
Chelsea Heights is characterized by a predominantly suburban housing profile, with above-average rates of outright home ownership
Chelsea Heights' dwellings, as per the latest Census, consisted of 79.0% houses and 21.0% other dwellings (semi-detached, apartments, 'other' dwellings). Melbourne metro had 54.8% houses and 45.2% other dwellings. Home ownership in Chelsea Heights was 40.4%, with mortgaged dwellings at 46.3% and rented ones at 13.3%. The median monthly mortgage repayment was $2,001, below Melbourne metro's average of $2,167. Median weekly rent was $412, compared to Melbourne metro's $410. Nationally, Chelsea Heights' mortgage repayments were higher than the Australian average of $1,863, and rents exceeded the national figure of $375.
Frequently Asked Questions - Housing
Household Composition
Chelsea Heights has a typical household mix, with a higher-than-average median household size
Family households account for 74.8% of all households, including 39.5% couples with children, 23.2% couples without children, and 11.4% single parent families. Non-family households make up the remaining 25.2%, with lone person households at 23.4% and group households comprising 1.6%. The median household size is 2.6 people, larger than the Greater Melbourne average of 2.4.
Frequently Asked Questions - Households
Local Schools & Education
The educational profile of Chelsea Heights exceeds national averages, with above-average qualification levels and academic performance metrics
The area faces educational challenges, with university qualification rates at 24.7%, significantly lower than the SA4 region average of 46.0%. This presents both a challenge and an opportunity for targeted educational initiatives. Bachelor degrees are most common at 16.9%, followed by postgraduate qualifications at 5.2% and graduate diplomas at 2.6%. Trade and technical skills are prominent, with 36.2% of residents aged 15+ holding vocational credentials - advanced diplomas at 12.1% and certificates at 24.1%.
Educational participation is high, with 28.9% of residents currently enrolled in formal education, including 10.3% in primary, 7.7% in secondary, and 4.0% pursuing tertiary education. Chelsea Heights Primary School serves the area, enrolling 406 students as of the latest data. The school focuses exclusively on primary education, with socio-educational conditions above average (ICSEA: 1050). Secondary options are available in surrounding areas due to limited local school capacity (7.4 places per 100 residents vs regional average of 15.7).
Frequently Asked Questions - Education
Schools Detail
Nearby Services & Amenities
Transport
Transport servicing is good compared to other areas nationally based on assessment of service frequency, route connectivity and accessibility
The analysis found 41 active public transport stops in Chelsea Heights. These stops serve a mix of bus routes, totalling seven different ones. Each week, these routes facilitate 1,486 passenger trips combined.
The accessibility to public transport is rated as excellent, with residents on average being located 154 meters from the nearest stop. On average, there are 212 trips per day across all routes, which equates to approximately 36 weekly trips per individual stop.
Frequently Asked Questions - Transport
Transport Stops Detail
Health
Chelsea Heights's residents are relatively healthy in comparison to broader Australia with common health conditions slightly more prevalent than average across both younger and older age cohorts
Chelsea Heights' health metrics are close to national benchmarks. Common health conditions are slightly more prevalent than average across both younger and older age cohorts.
The rate of private health cover is approximately 52% of the total population, which is around 2,831 people, compared to 58.2% in Greater Melbourne. The most common medical conditions are asthma and arthritis, affecting 8.6% and 7.8% of residents respectively. Approximately 68.8% of residents report being completely clear of medical ailments, compared to 70.4% across Greater Melbourne. The area has 19.9% of residents aged 65 and over, which is around 1,084 people. This aligns broadly with the general population's health profile.
Frequently Asked Questions - Health
Cultural Diversity
Chelsea Heights was found to be more culturally diverse than the vast majority of local markets in Australia, upon assessment of a range of language and cultural background related metrics
Chelsea Heights, surveyed in June 2021, showed higher cultural diversity than most local areas, with 26.1% of residents born overseas and 17.2% speaking a language other than English at home. Christianity was the predominant religion, accounting for 48.5%. Judaism, though small at 0.3%, was overrepresented compared to Greater Melbourne's 1.1%.
The top three ancestry groups were English (25.5%), Australian (25.2%), and Other (8.4%). Notable differences existed in Russian (0.9% vs regional 1.0%), Sri Lankan (1.2% vs 0.6%), and Hungarian (0.4% vs 0.4%) representation.
Frequently Asked Questions - Diversity
Age
Chelsea Heights's population is slightly older than the national pattern
Chelsea Heights has a median age of 40, which is slightly higher than Greater Melbourne's figure of 37 and Australia's national average of 38 years. Compared to Greater Melbourne, Chelsea Heights has an over-representation of the 75-84 age group (8.2% locally) and an under-representation of the 25-34 year-olds (7.9%). Between 2021 and the present, the 75-84 age group has increased from 6.3% to 8.2%, while the 15-24 cohort has risen from 10.9% to 12.1%. Conversely, the 25-34 age group has decreased from 9.9% to 7.9%. By 2041, demographic projections suggest significant changes in Chelsea Heights' age profile. The 75-84 age cohort is expected to grow by 182 people (41%), increasing from 444 to 627 individuals. Notably, the combined 65+ age groups are projected to account for 56% of total population growth, reflecting the area's aging demographic trend. Meanwhile, the 5-14 and 0-4 age cohorts are expected to experience population declines.

