Chart Color Schemes
This analysis uses Suburbs and Localities (SAL) boundaries, which can materially differ from Statistical Areas (SA2) even when sharing the same name.
SAL boundaries are defined by Australia Post and the Australian Bureau of Statistics to represent commonly-known suburb names used in postal addresses.
Statistical Areas (SA2) are designed for census data collection and may combine multiple suburbs or use different geographic boundaries. For comprehensive analysis, consider reviewing both boundary types if available.
est. as @ -- *
2021 Census | -- people







Curious about local property values? Filter the chart to assess the volume and appreciation (including resales) trends and regional comparisons, or scroll to the map below view this information at an individual property level.
Find a Recent Sale

Sales Detail
Bindoon has an estimated 1,508 residents, up from 1,215 at the 2021 Census — a change of 293 people, or 24.1%. Growth has averaged 3.7% a year over five years, faster than 93% of areas nationally. Interstate and internal migration accounts for 75.0% of that increase. Fewer than ten people live on each square kilometre, across a boundary that takes in surrounding rural land. Population is estimated from ABS Estimated Resident Population releases and GNAF address data, re-based from the 2021 Census and updated annually.
Detail
Based on evaluation of ABS population updates for the wider region, and new addresses validated by AreaSearch since the Census, the population of the suburb of Bindoon is estimated to be approximately 1,508 as of May 2026. This represents a growth of 293 people (24.1%) from the 2021 Census, which recorded a population of 1,215 people. The variation is calculated from the resident population of 1,485, estimated by AreaSearch following analysis of the most recent ERP data release by the ABS (June 2025) and an extra 62 validated new addresses since the Census date.
This population level translates to a density ratio of 4.6 persons per square kilometer, which offers plenty of space per person. The 24.1% expansion in the suburb of Bindoon since the 2021 census was higher than the national average (9.3%), as well as the SA4 region, establishing it as a regional growth leader. Population expansion for the area was chiefly propelled by interstate migration which accounted for roughly 75.0% of total population gains during recent times, though all indicators including natural growth and overseas migration were positive contributors. AreaSearch is using ABS/Geoscience Australia projections for each SA2 region, as published in 2024 with 2022 as the base year. For any SA2 regions not represented in this dataset, and to project growth across all locations in the years after 2032, AreaSearch is employing the growth rates by age cohort supplied by the ABS in its latest Greater Capital Region projections (published in 2023, based on 2022 data). Factoring in the projected demographic changes, a population rise just below the median of Australia's regional locations is anticipated in the suburb of Bindoon, with the area projected to grow by 166 persons to 2041 based on compiled SA2-level projections, showing an increase of 9.5% in total over the 16 years.
Frequently Asked Questions - Population
40 new dwellings have been approved in Bindoon over the past five years, an average of 8 a year. That places the area in the 77th percentile for residential development activity nationally, about 5 approvals per 1,000 residents a year. Approvals are currently running at an annualised 25, running ahead of that longer-run average. Figures come from ABS building approvals aggregated to this Suburb (SAL) boundary and are updated monthly as the ABS releases them.
Detail
According to AreaSearch analysis of ABS building approval figures, distributed from statistical area data, Bindoon has recorded approximately 8 residential properties approved annually, amounting to an estimated 40 homes over the last 5 financial years. Thus far in FY-26, 23 approvals have been logged. With an average of 6.2 new residents per year arriving per dwelling built over the last 5 financial years (between FY-21 and FY-25), demand heavily outstrips new supply, which typically leads to price increases and heightened buyer competition, while new homes are being constructed at an average value of $444,000, indicating that developers are targeting the premium market with upscale projects.
Compared to the Rest of WA, Bindoon displays matching development levels (per person), reinforcing market stability in line with regional trends, though building activity has quickened recently. Meanwhile, recent development has consisted entirely of standalone homes, maintaining the area's low density character with a focus on detached housing that appeals to buyers seeking space. The area has approximately 112 people per dwelling approval, pointing to an expanding market. Population projections suggest Bindoon will add 143 residents through to 2041 (from the most recent AreaSearch quarterly estimate). With current building rates, housing supply should sufficiently satisfy demand, producing positive conditions for buyers while potentially permitting growth that surpasses current projections.
Frequently Asked Questions - Development
Development applications around Bindoon
Loading development applications…
| Lodged | Address | Description | Type | Distance | Status |
|---|
SOURCE: Planning portals and council registers, compiled by AreaSearch. Distance & bearing measured from the suburb midpoint.
AreaSearch tracks one current infrastructure or development project inside Bindoon. A further 107 sit in the immediately surrounding suburbs, taking the tracked pipeline within reach of the area to $42.3 billion. 40 are already under construction and 35 are due for completion within three years. The pipeline spans residential development, transport & logistics and communities, precincts & urban renewal. Records are compiled from Infrastructure Australia, state agencies, council planning portals and public announcements, reviewed and updated daily, then ranked by proximity, construction stage, completion horizon and project scale.
Detail
Few elements can affect an area's performance as much as adjustments to local infrastructure, major developments and planning schemes. In total, 2 projects have been identified by AreaSearch that are expected to have an influence on the area. Major projects include Shire of Chittering Local Planning Scheme 6 Amendment 75 (Education Establishment Zone), Bindoon Bypass, WA Police Satellite Technology Upgrade, and Western Australia Agricultural Supply Chain Improvements, with the subsequent list detailing those expected to be of most significance.
Professional plan users can use the search below to filter and access additional projects.
INFRASTRUCTURE SEARCH
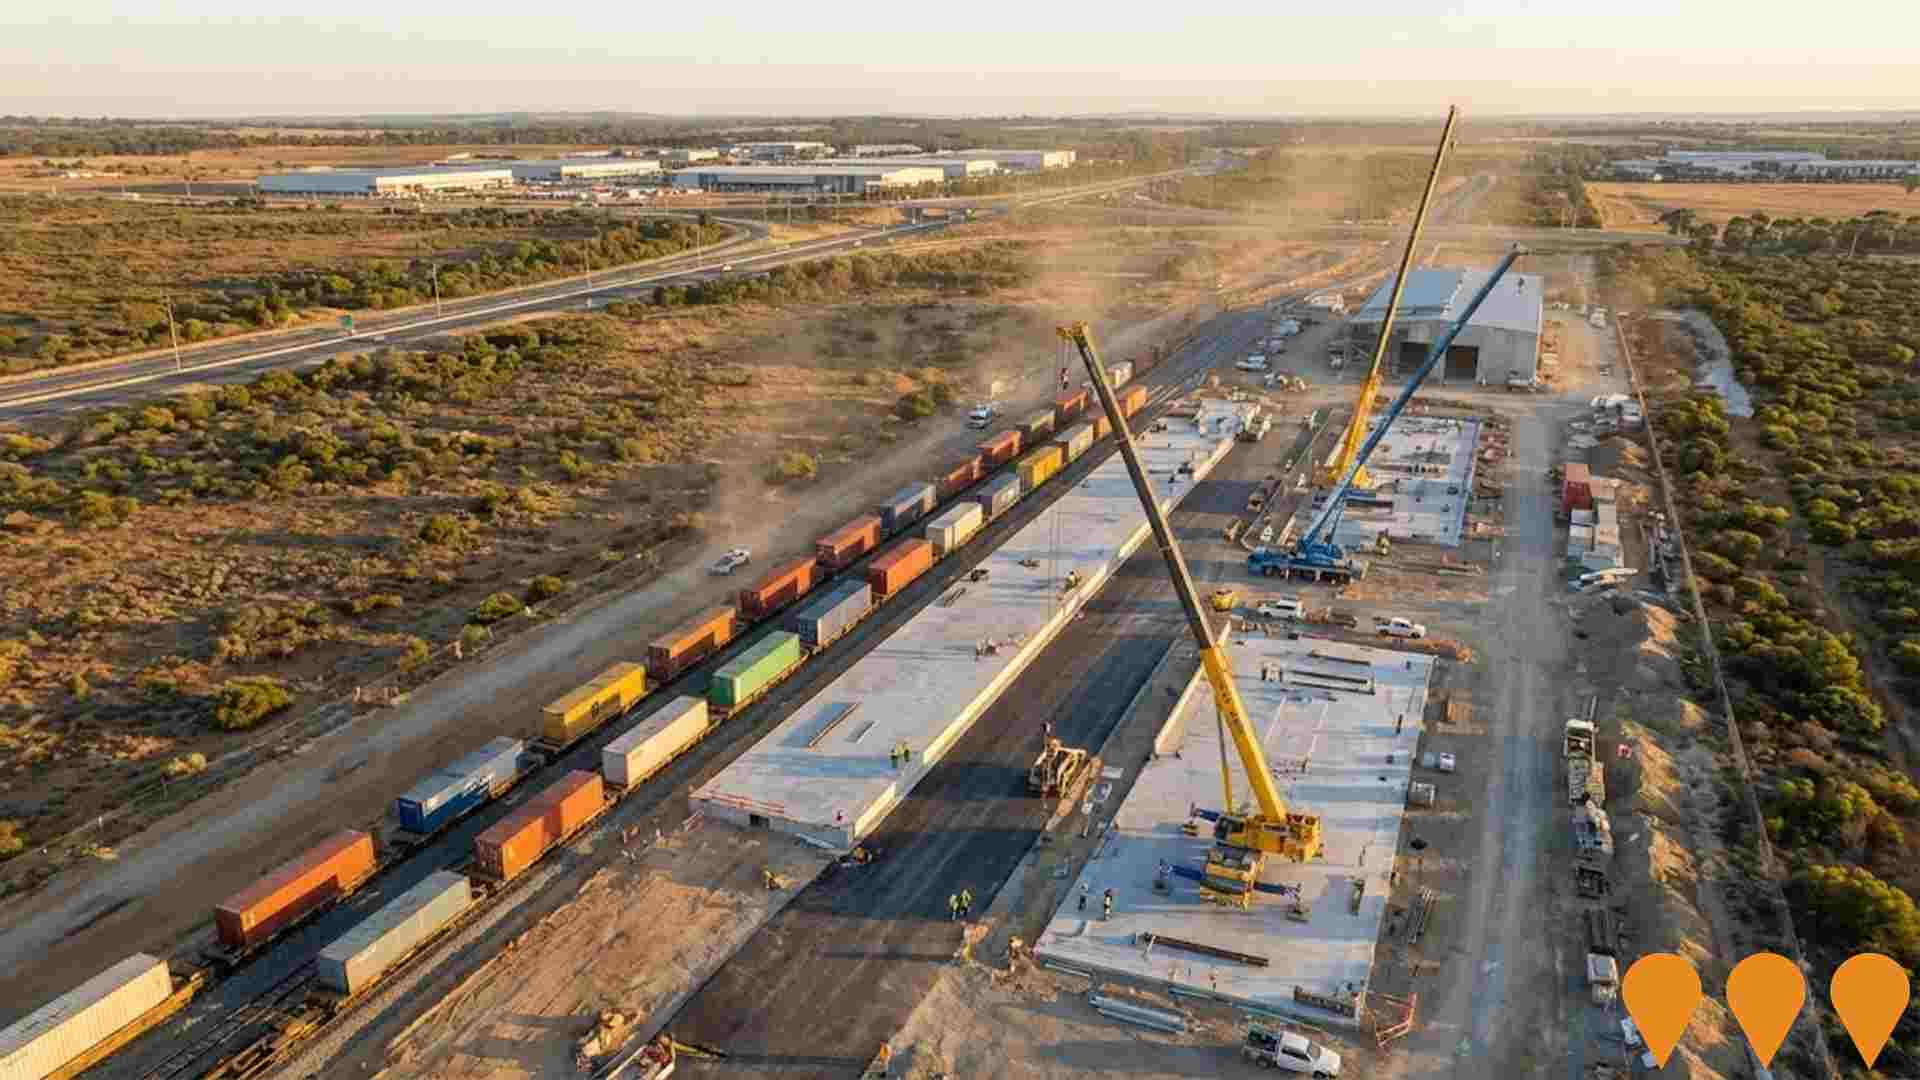
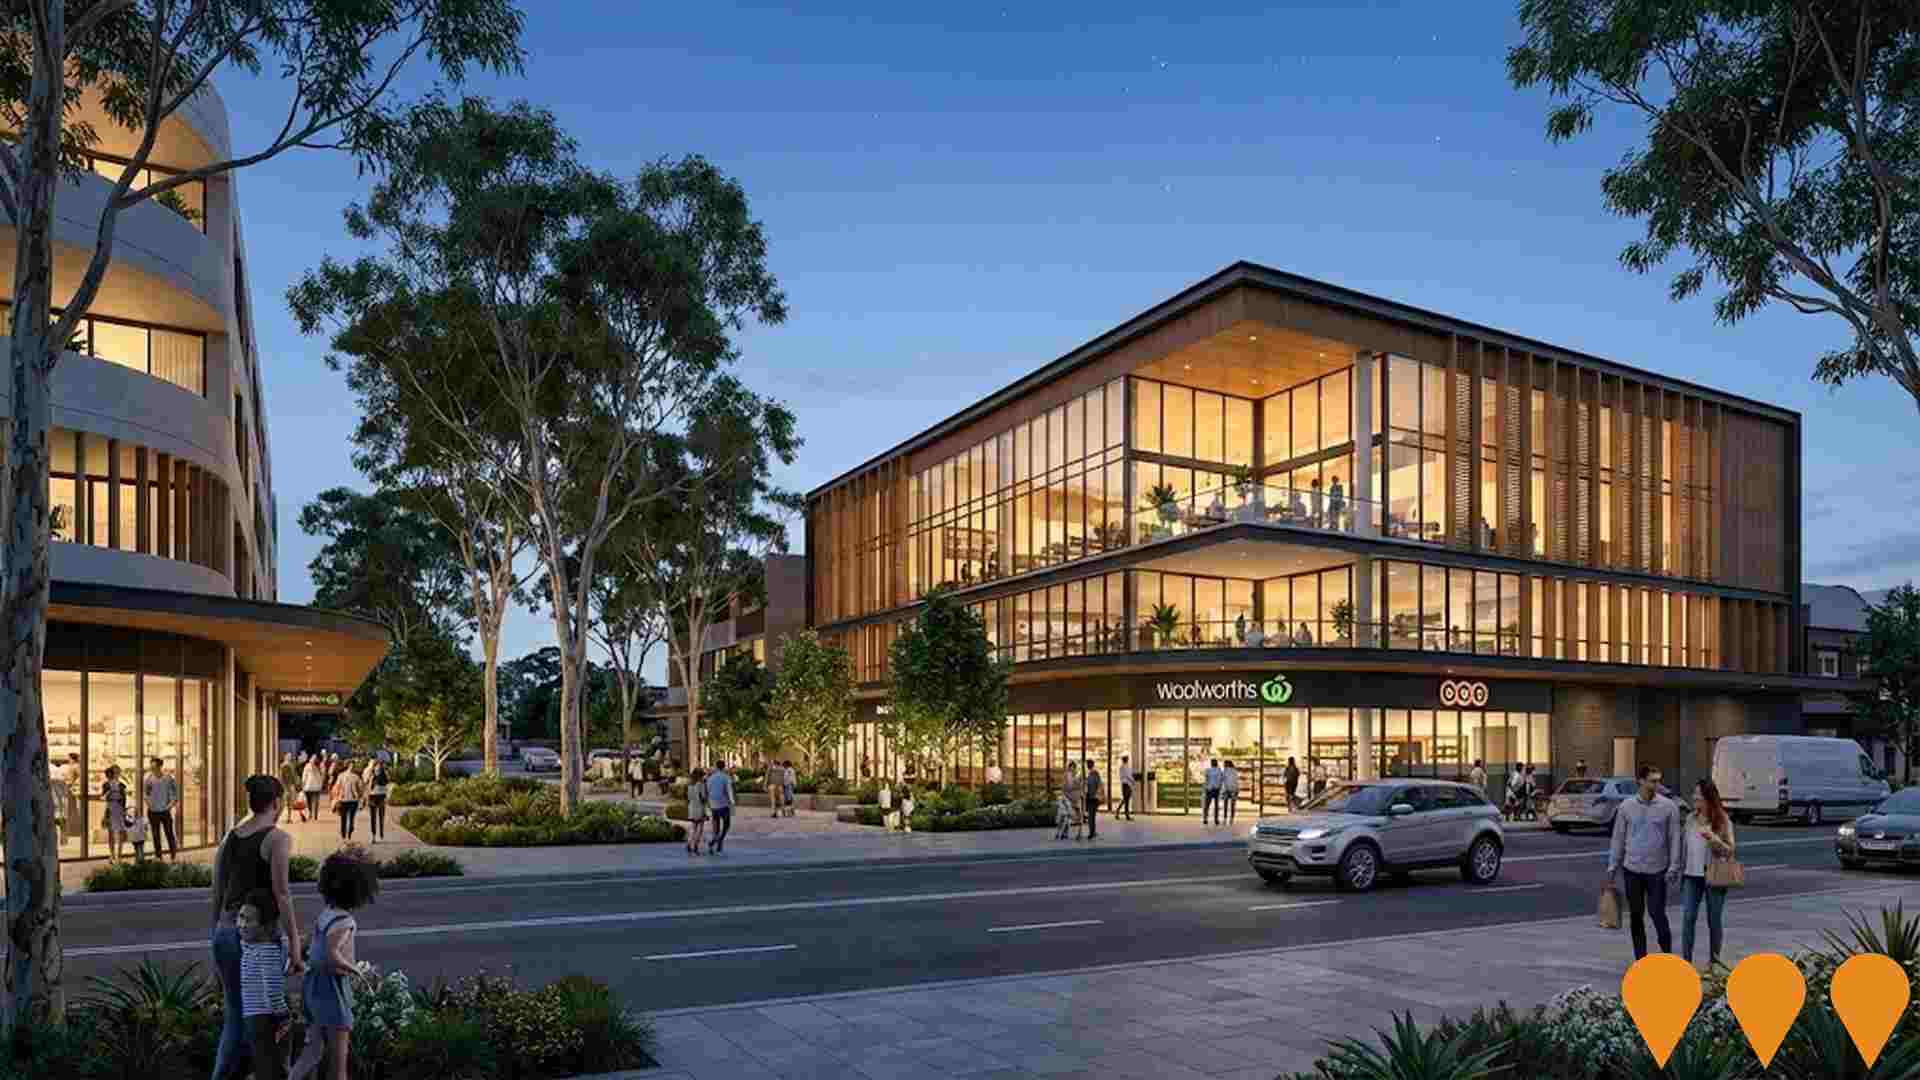
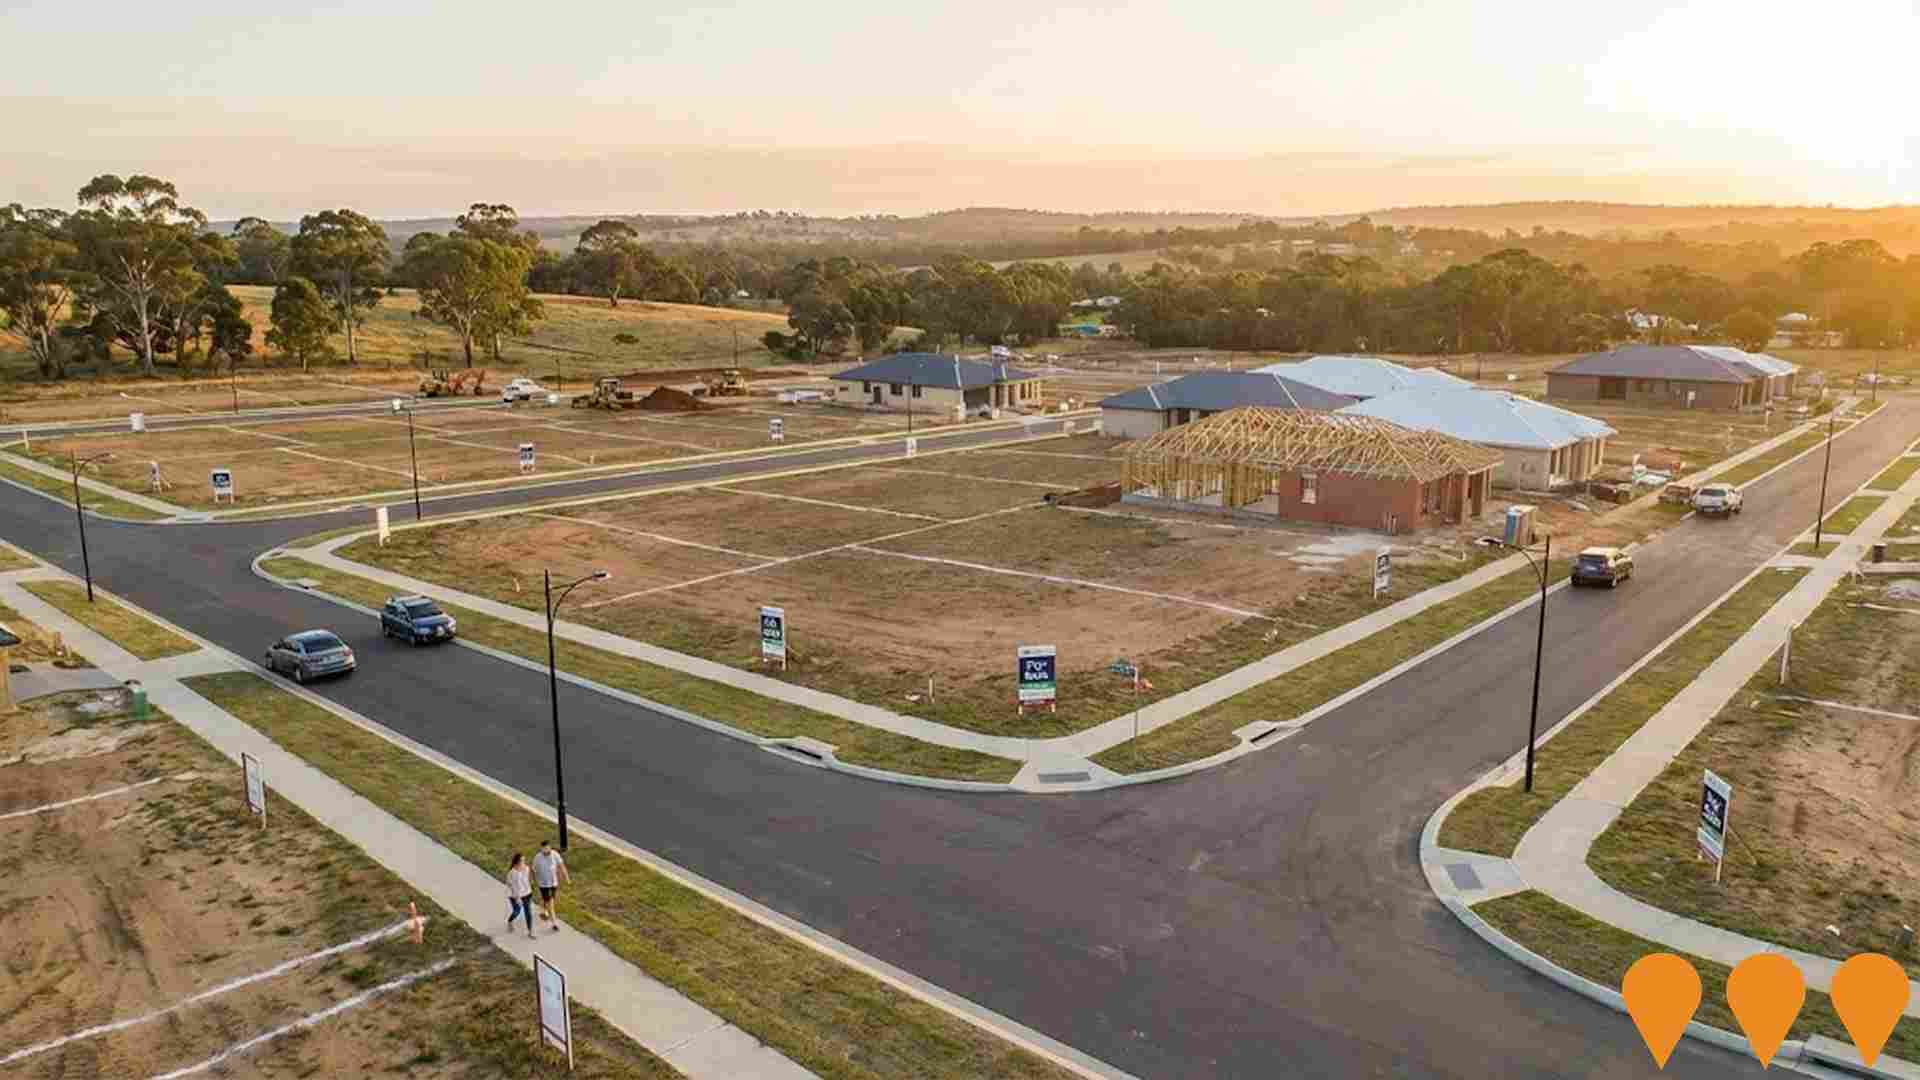
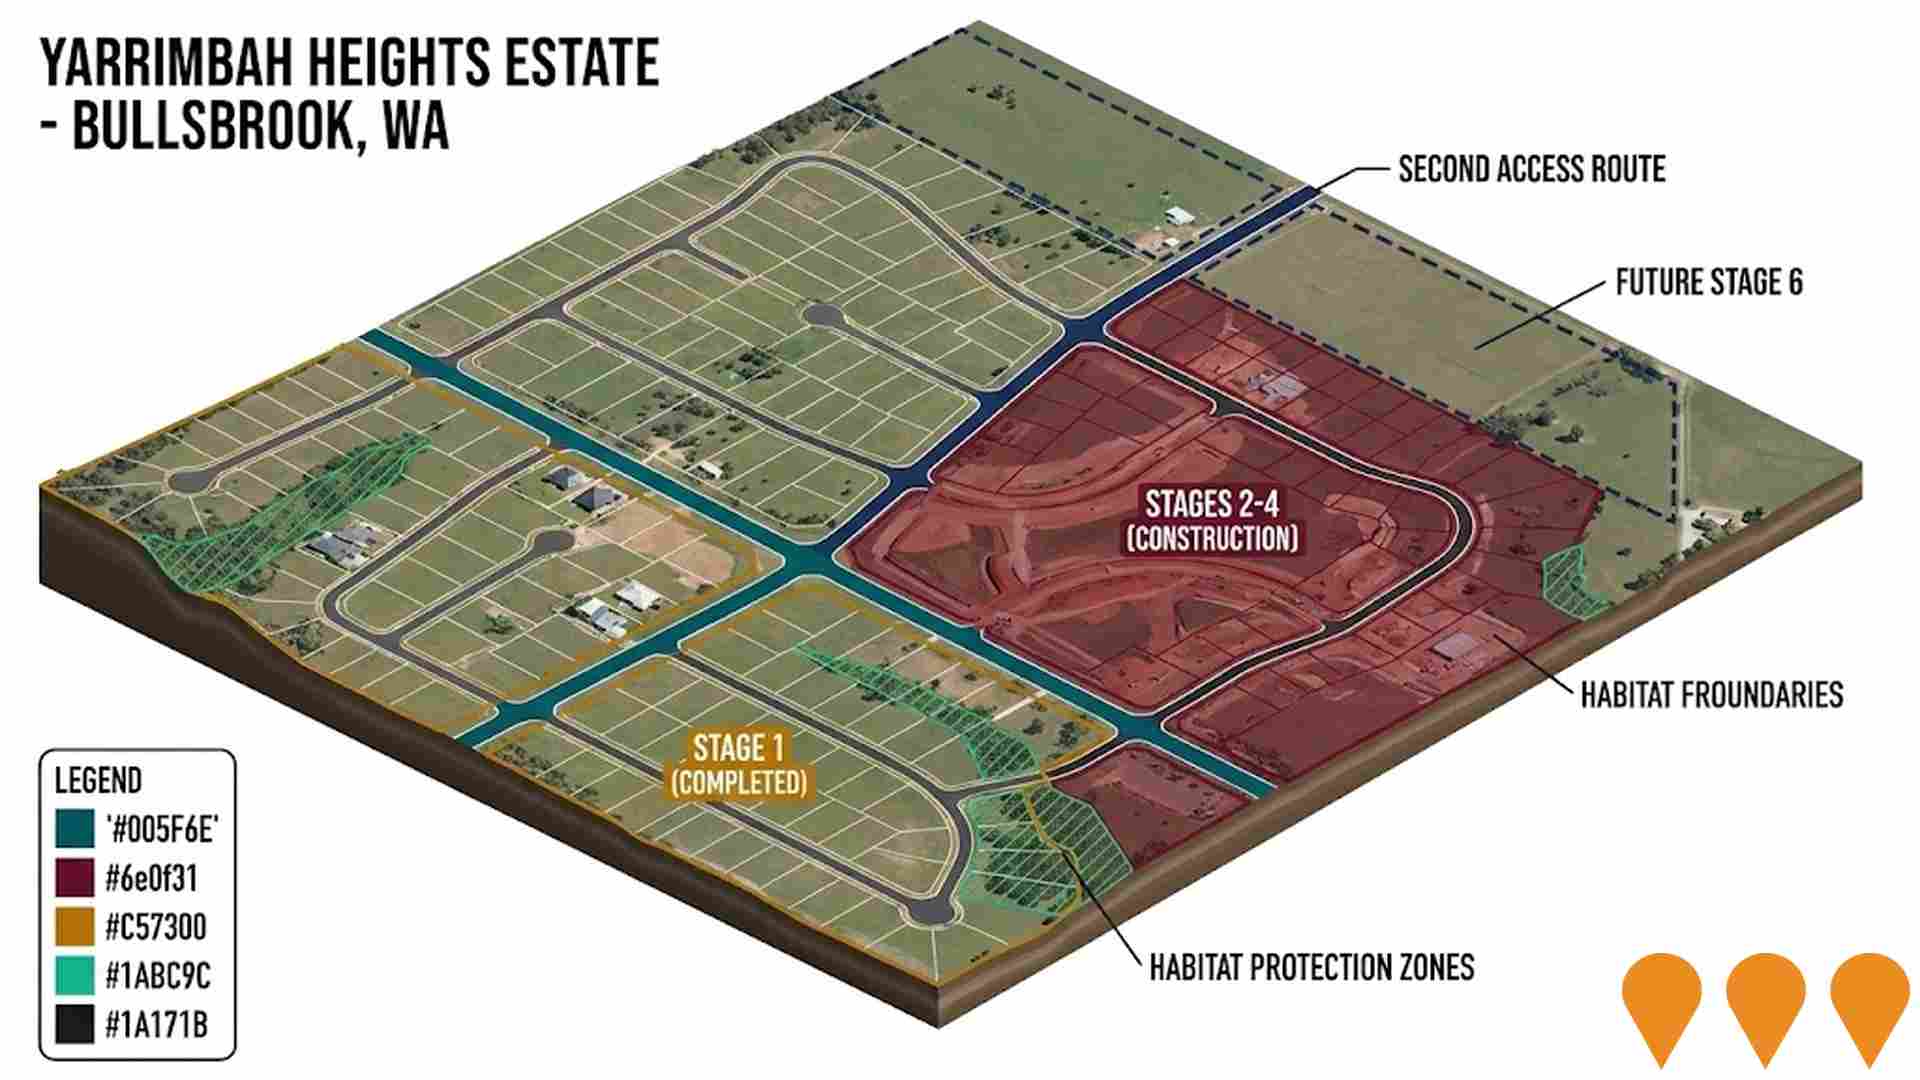
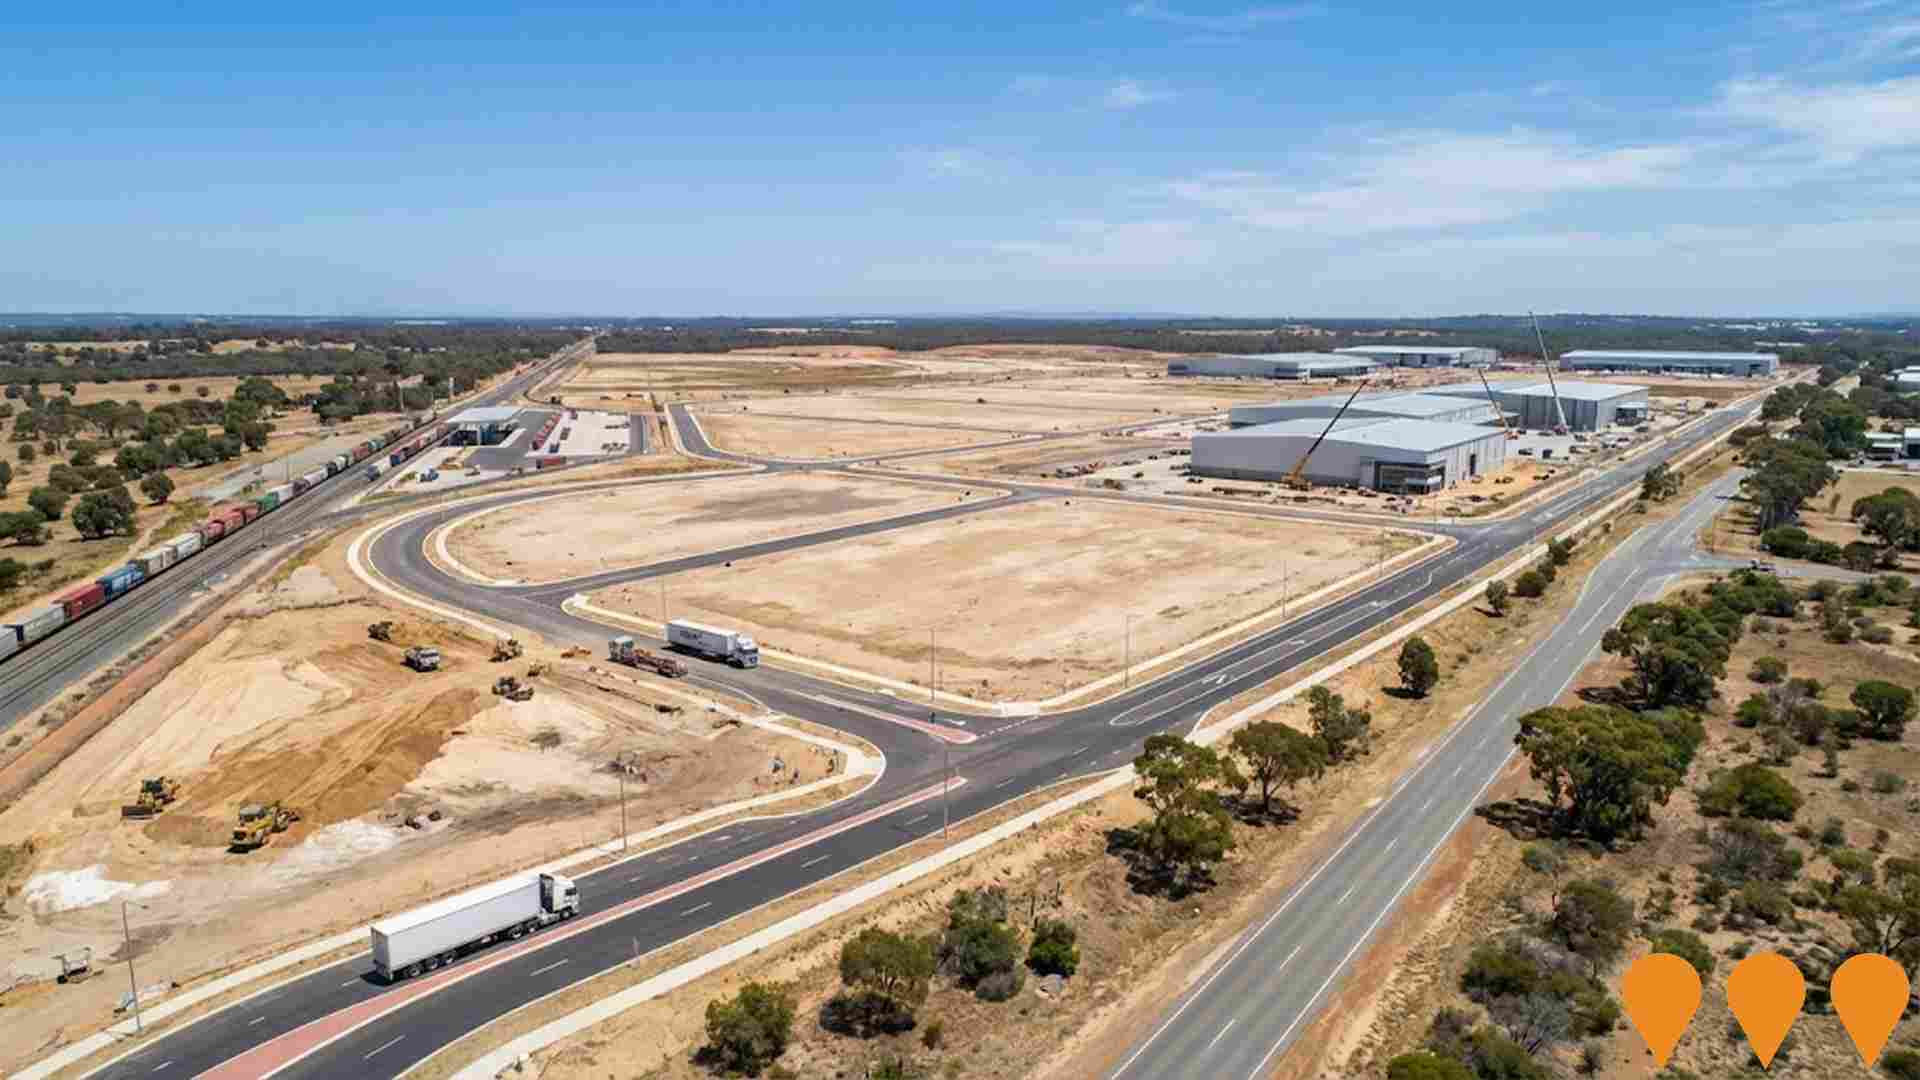
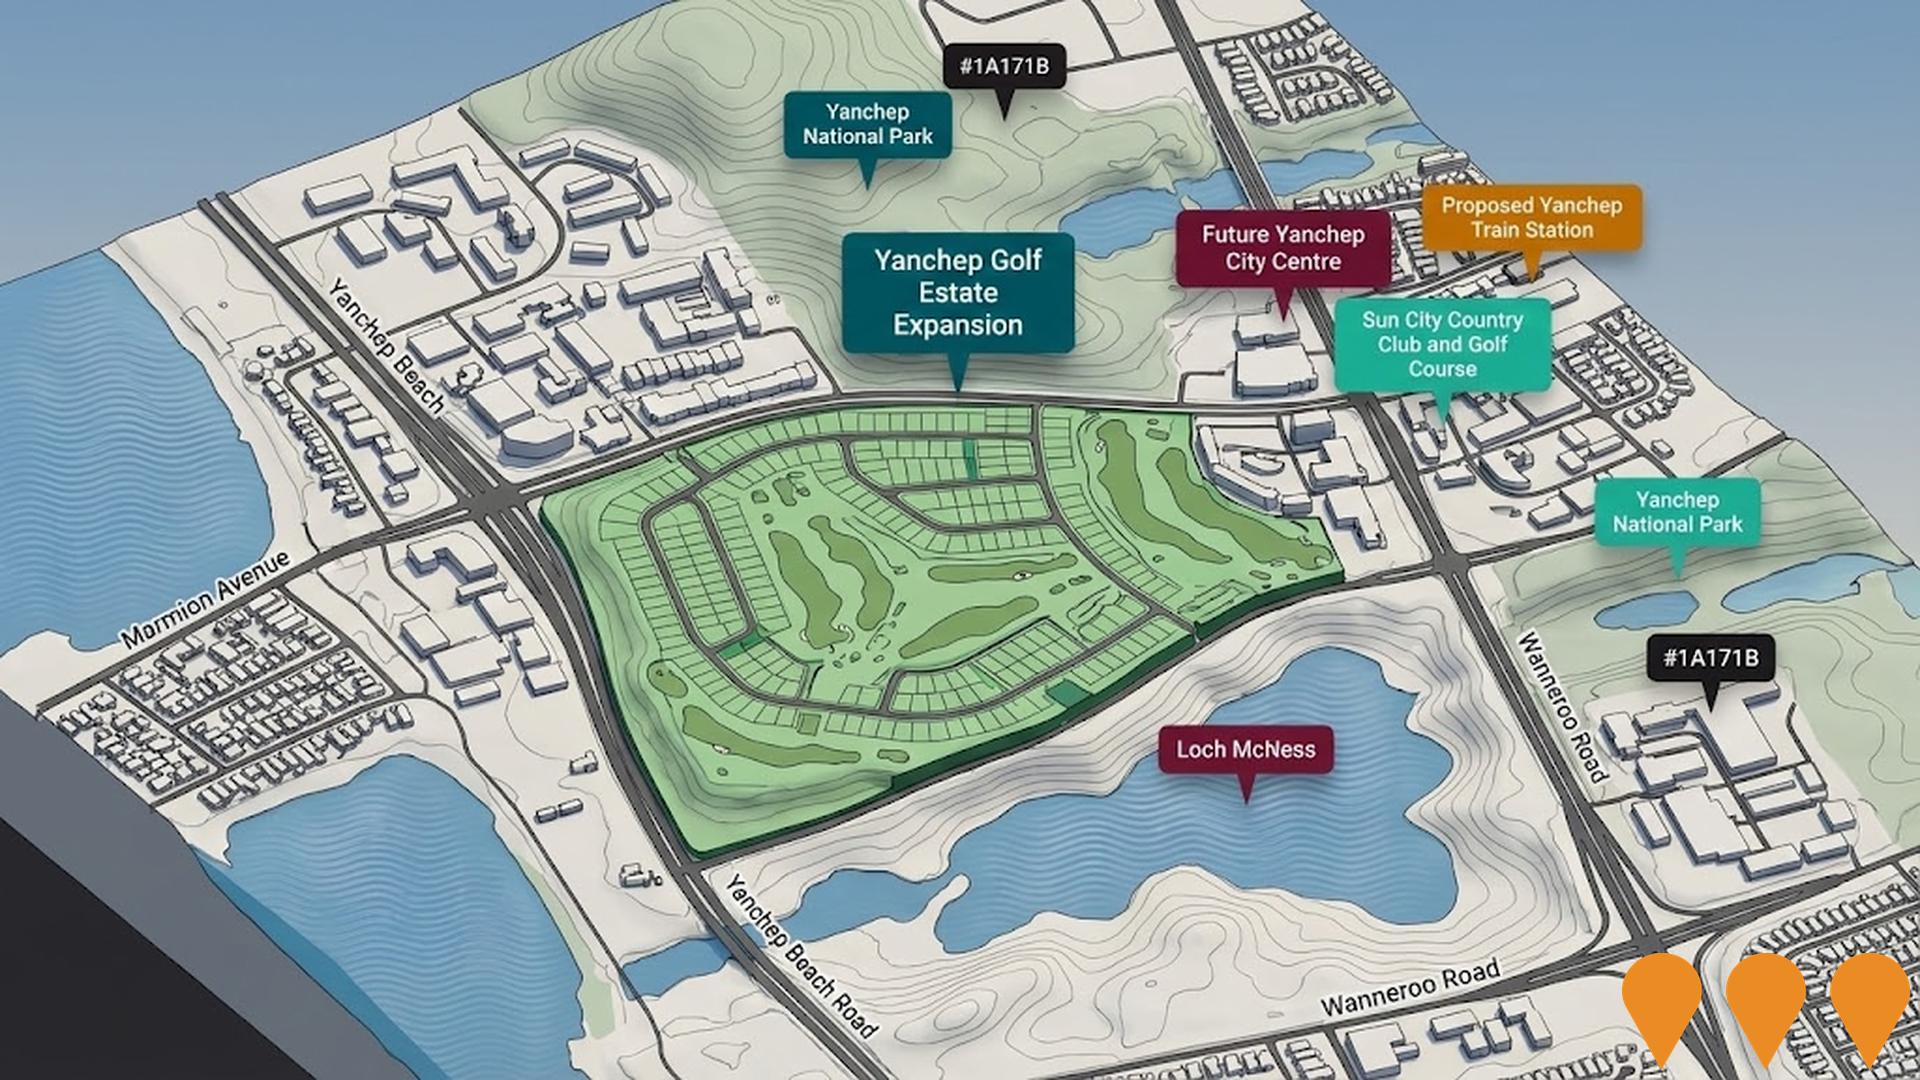
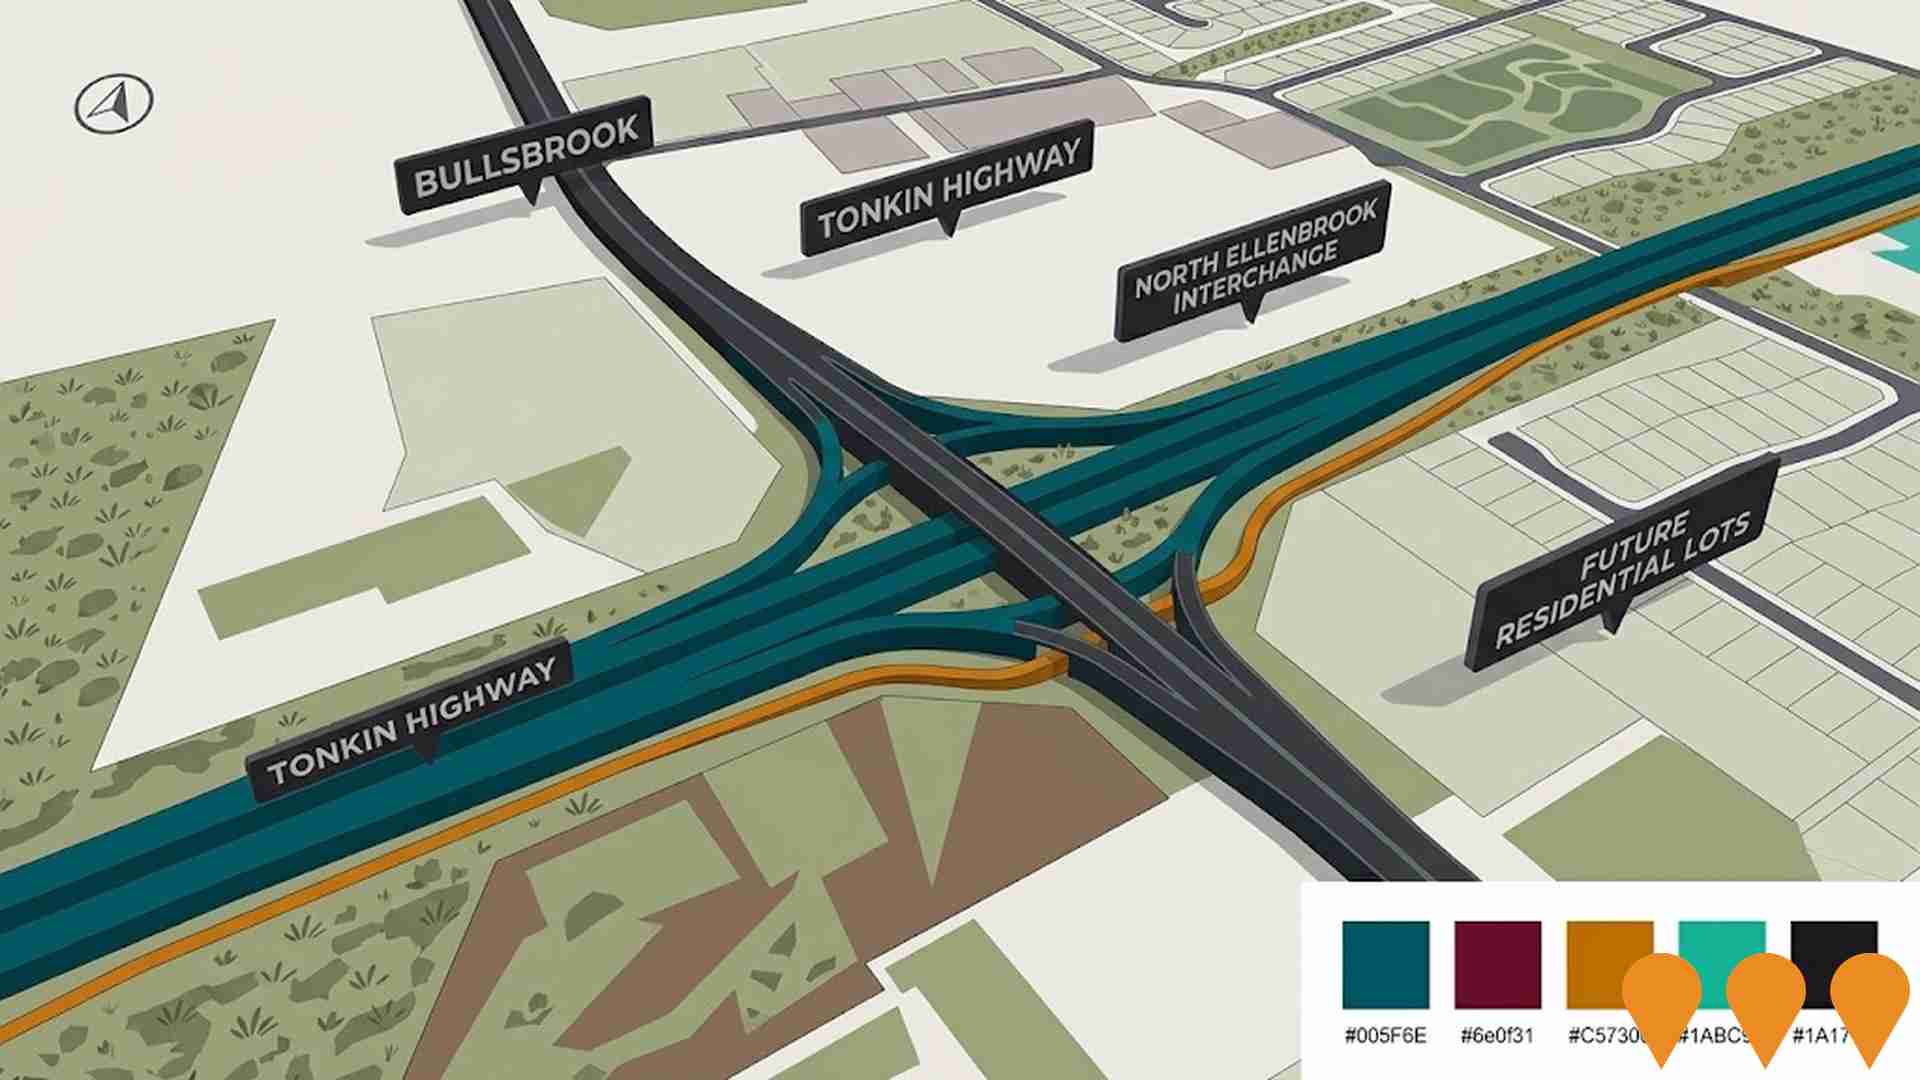
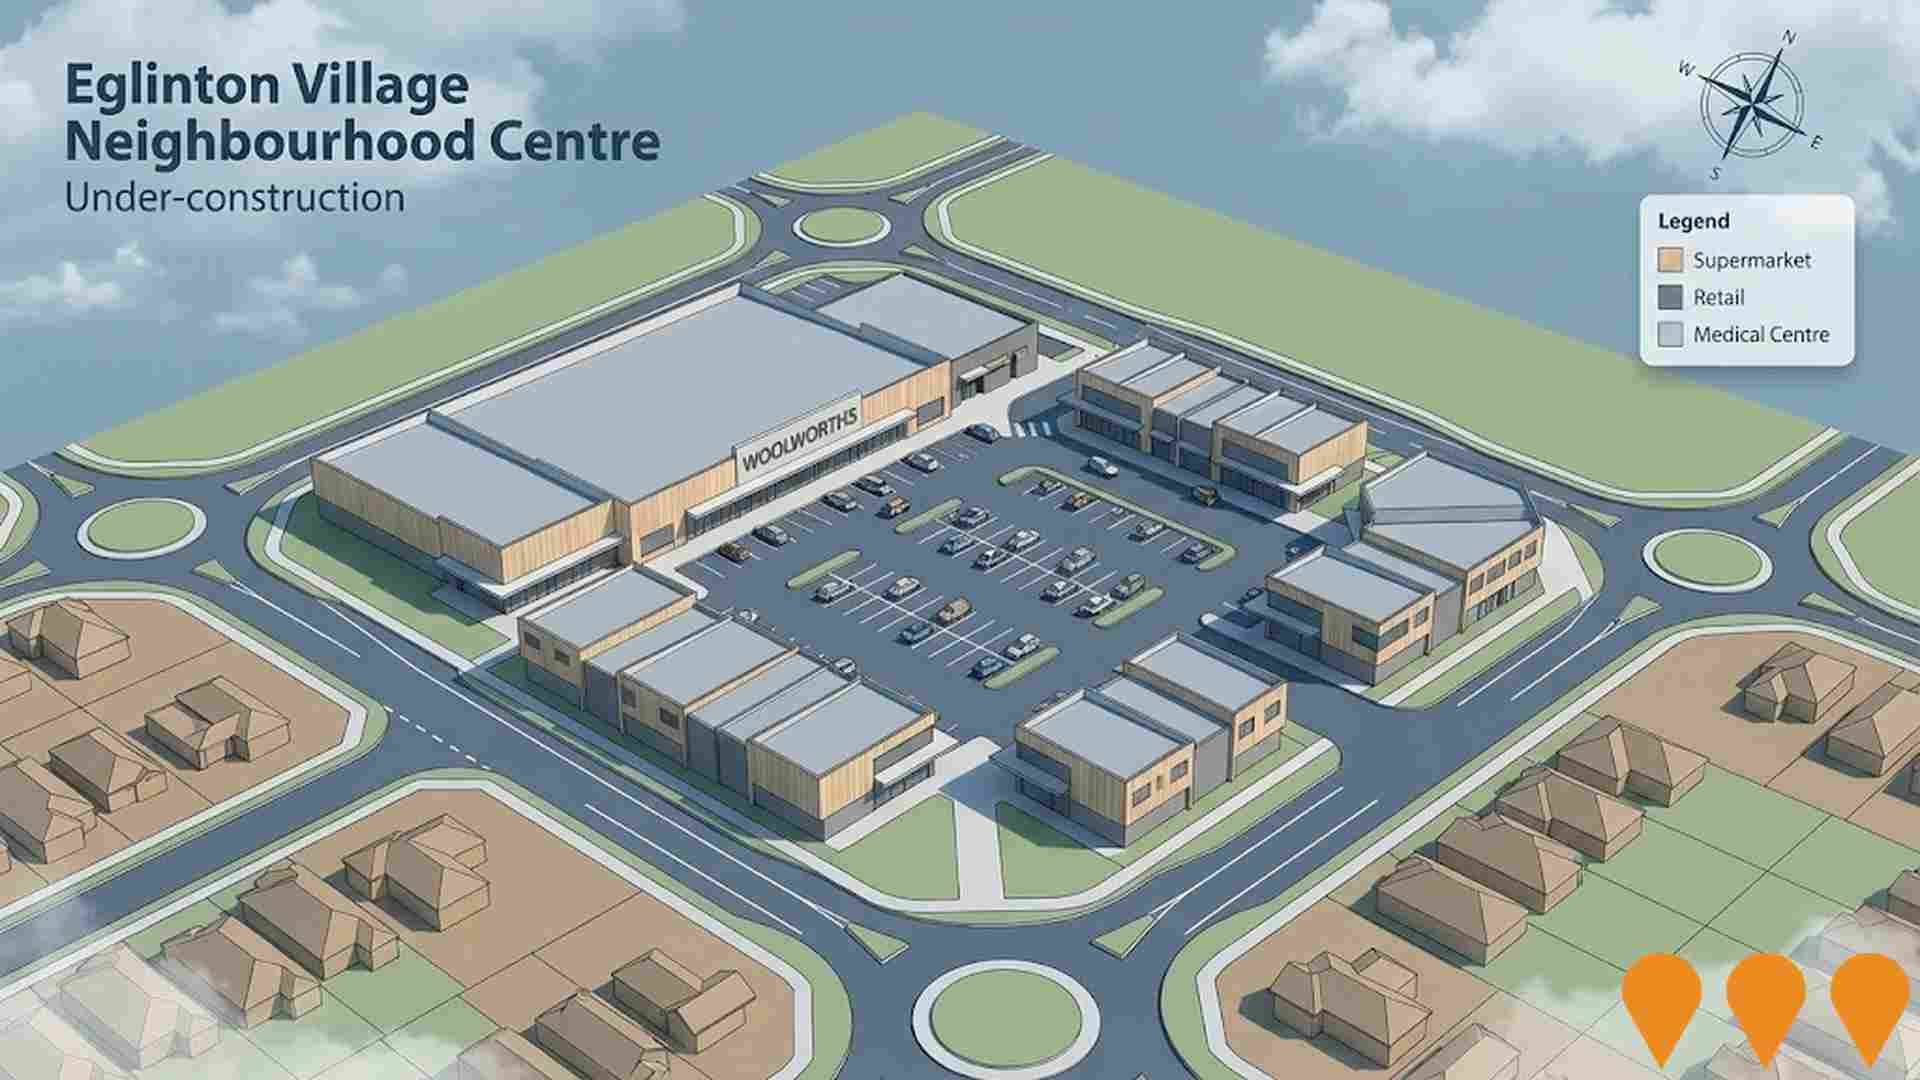
 Denotes AI-based impression for illustrative purposes only, not to be taken as definitive under any circumstances. Please follow links and conduct other investigations from the project's source for actual imagery. Developers and project owners wishing us to use original imagery please Contact Us and we will do so.
Frequently Asked Questions - Infrastructure
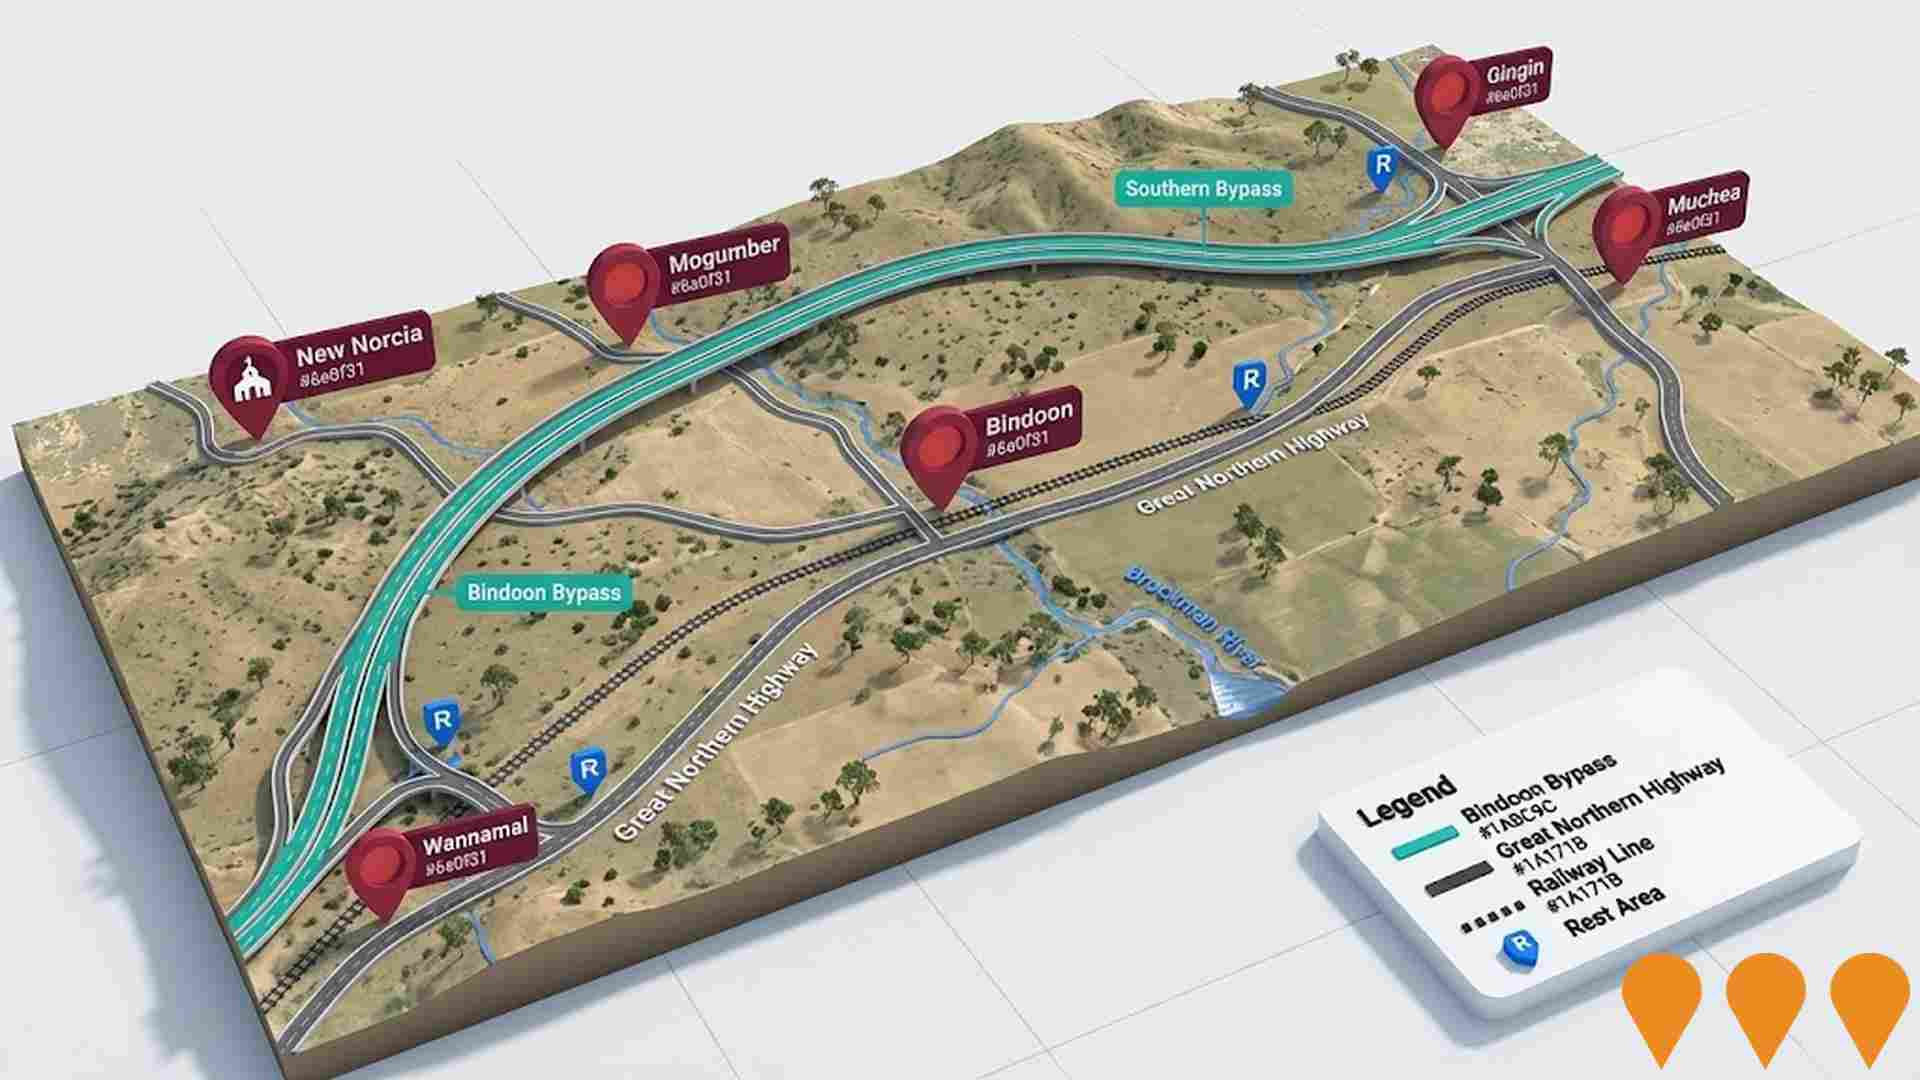
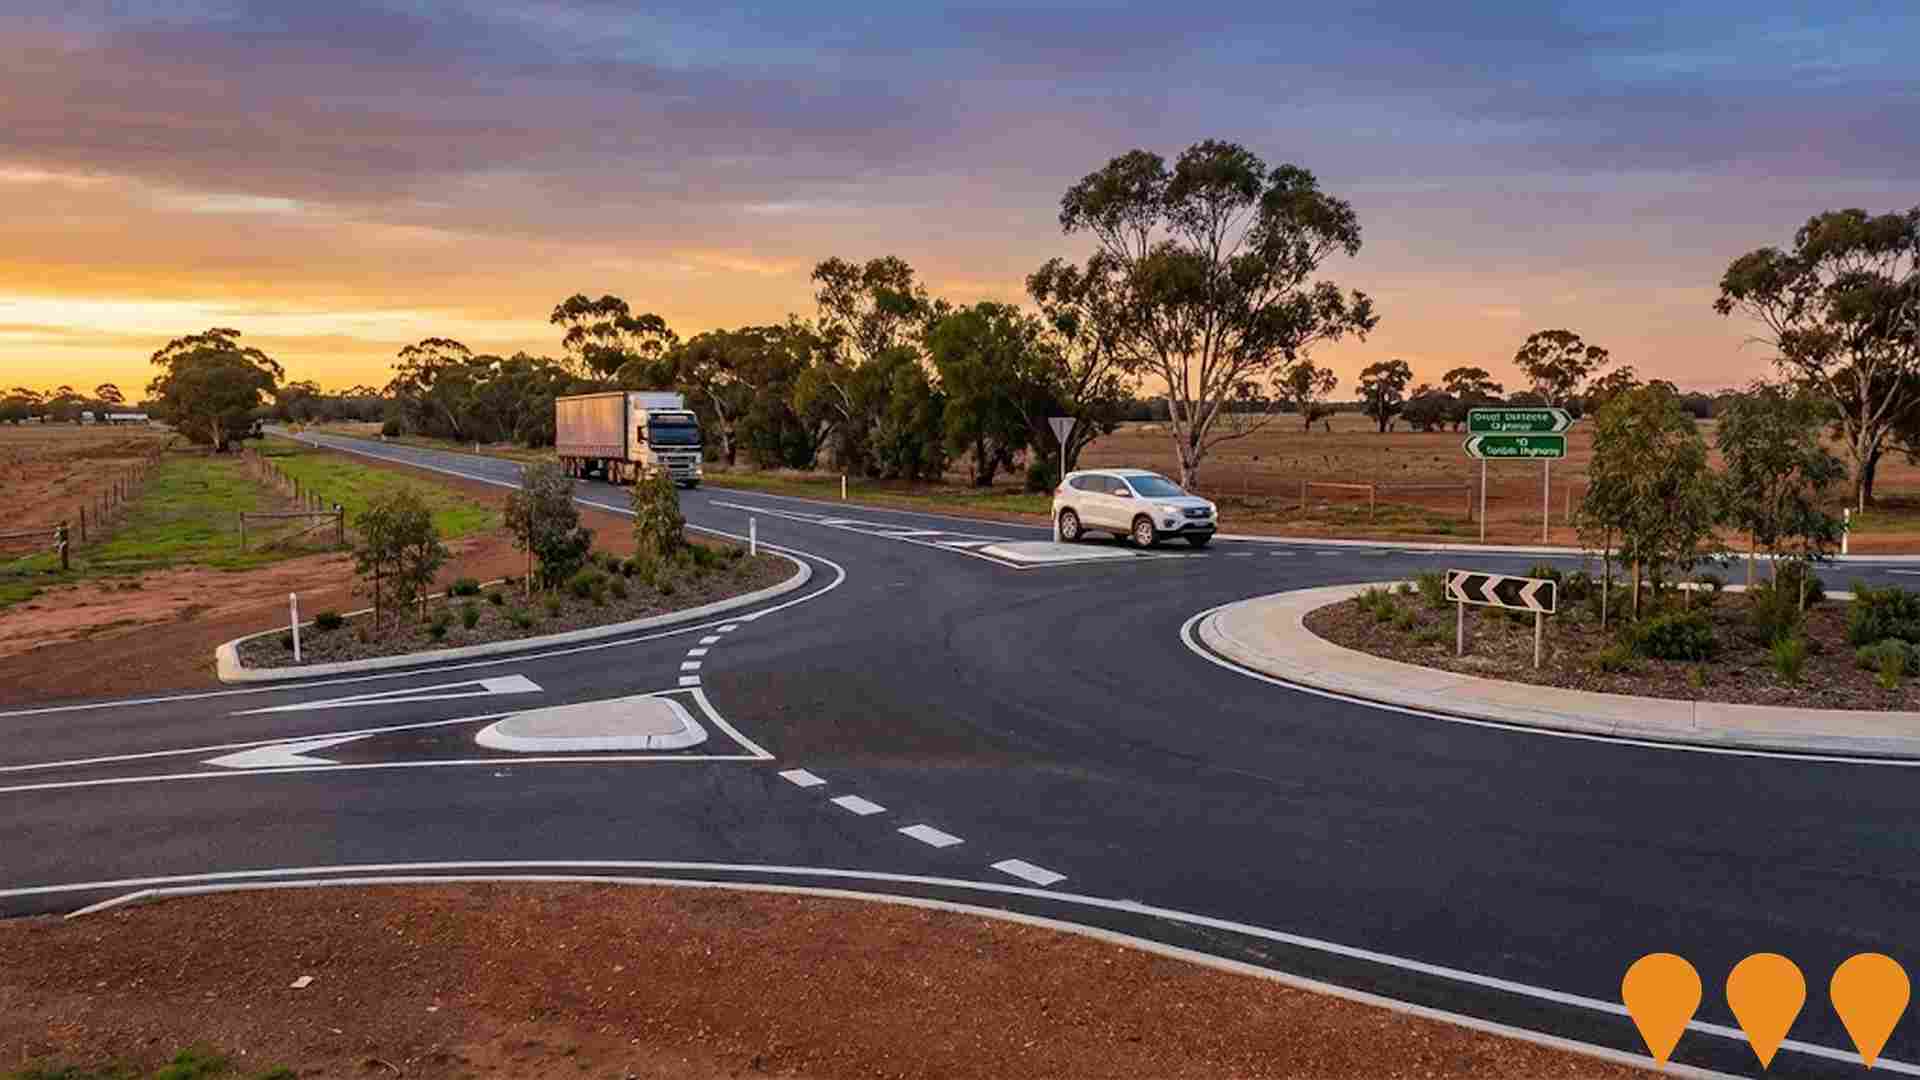
Bindoon Bypass
A new 64-kilometre section of the Great Northern Highway, bypassing the town of Bindoon. This project aims to improve travel times, road safety, and freight efficiency, enabling access for triple road trains to travel the entire length of the corridor down to Muchea. The project is jointly funded by the Australian Federal and State Governments.
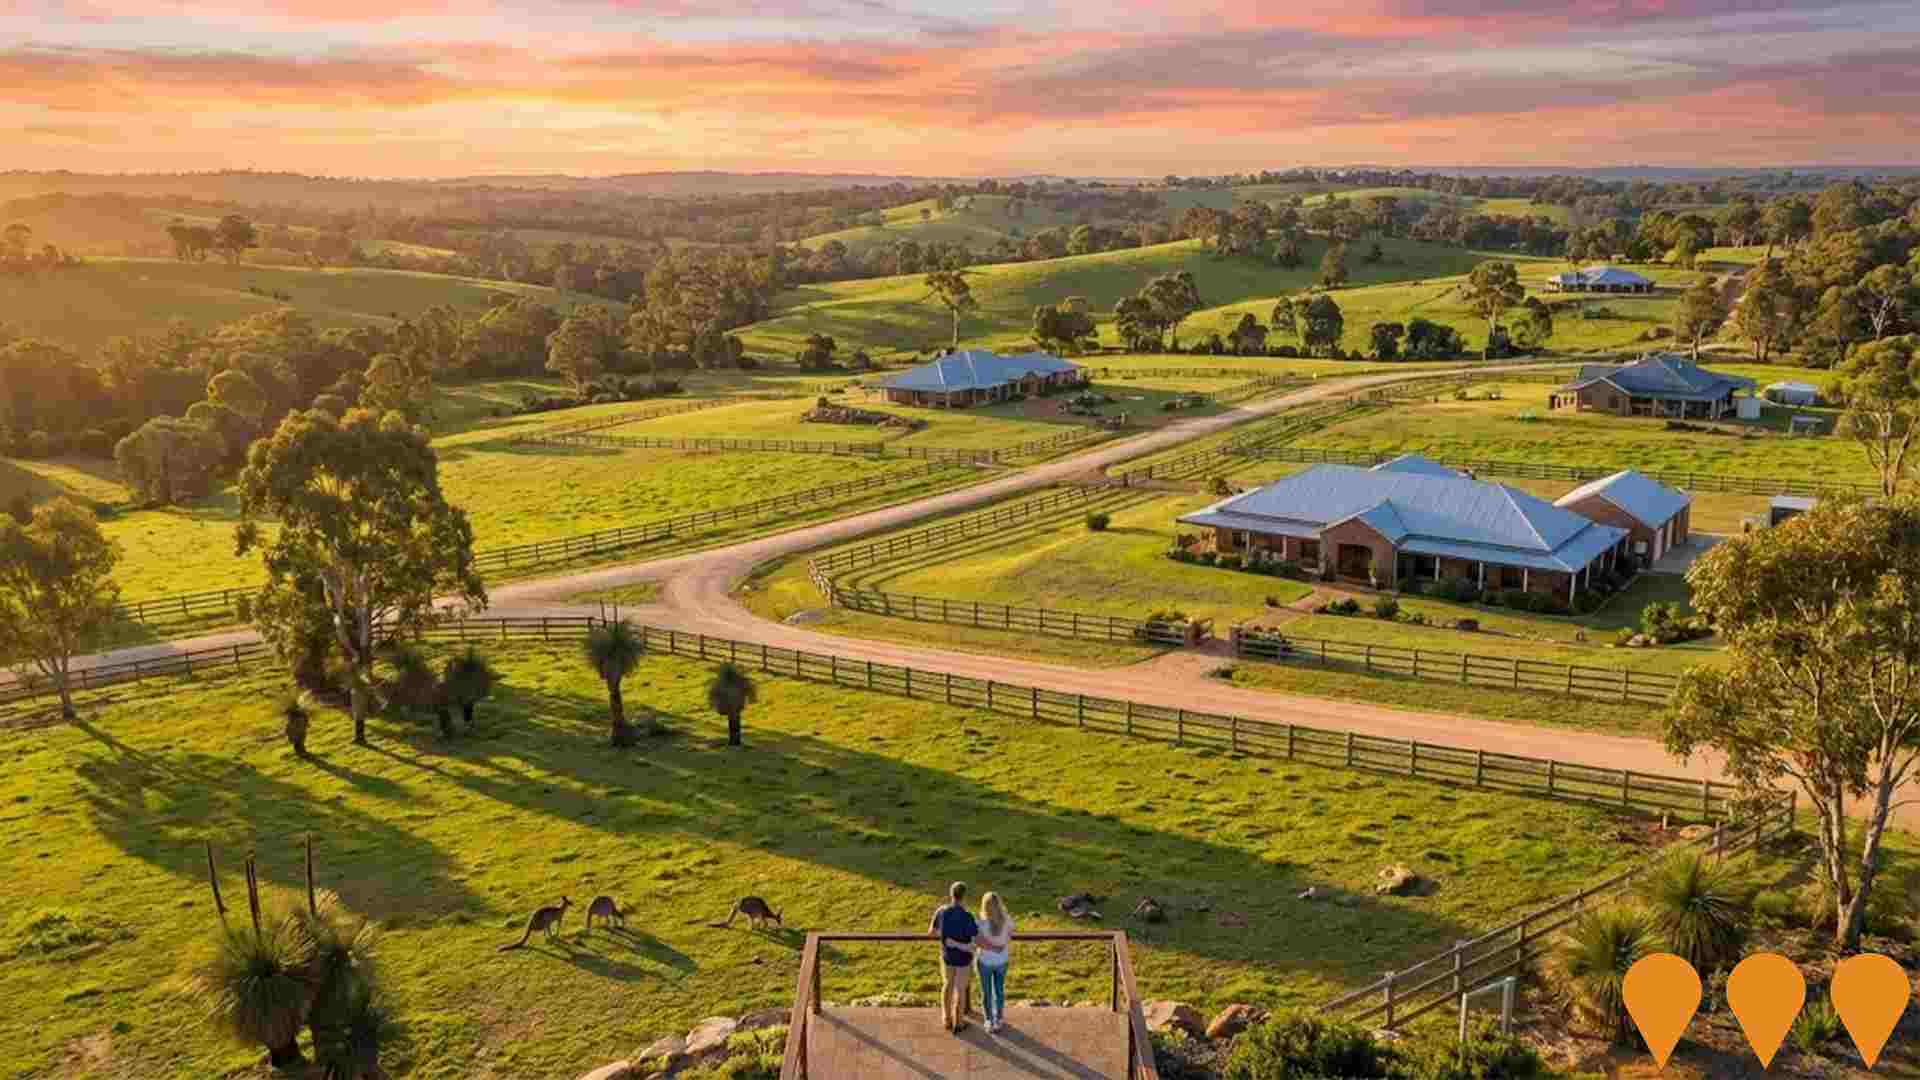
Maryville Downs Estate
A rural living estate located in Lower Chittering, offering 2 to 10 hectare lots. The estate is characterized by green rolling hills and stunning views, promoting a tranquil lifestyle approximately an hour north of the Perth CBD.
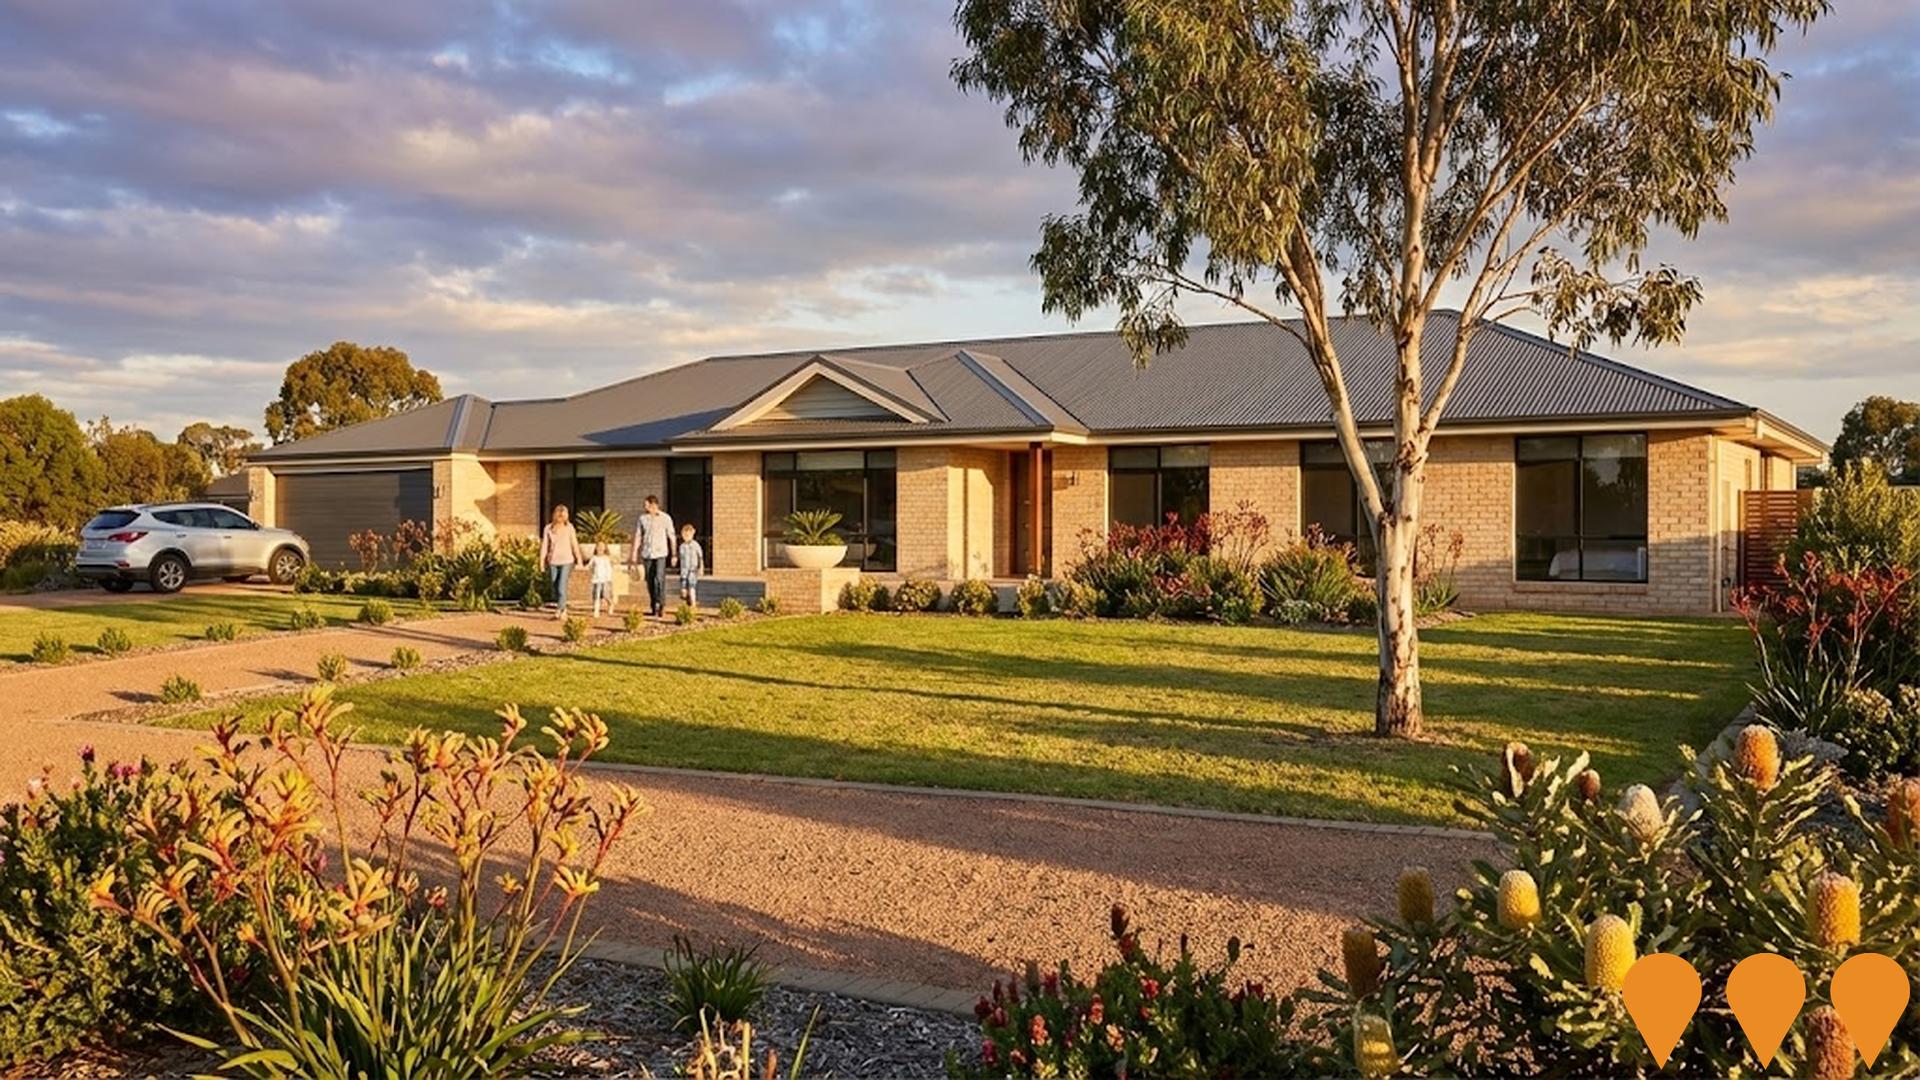
Ridgeview Estate
Ridgeview Estate is a boutique rural house and land estate on Morley Road in Lower Chittering, delivering 18 lifestyle lots from about 2ha to nearly 10ha with hillside views, river access and natural bushland. Civil works for the subdivision are scheduled from late 2024 with titles expected around November 2025 and full estate completion targeted for April 2027. Lots are being marketed to buyers seeking generous rural properties within easy driving distance of the Perth metropolitan area.
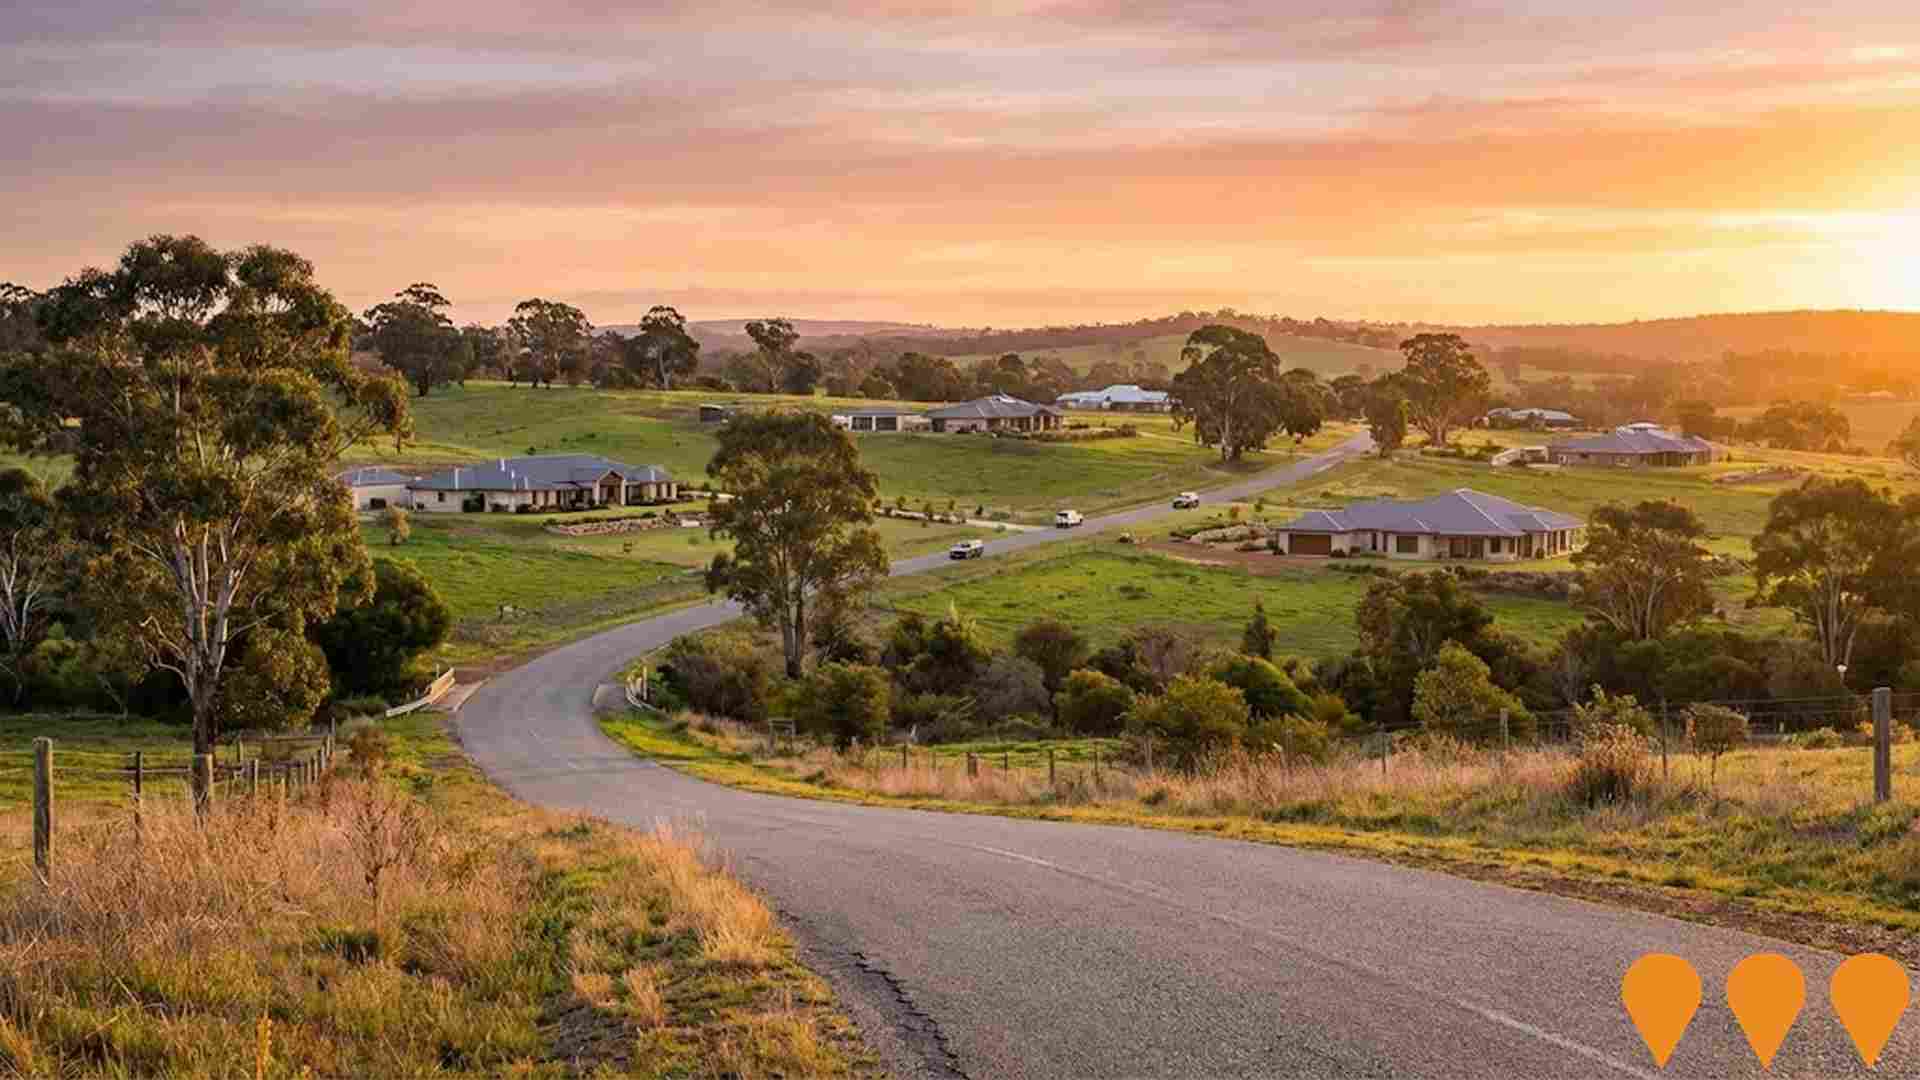
Maryville Downs
Maryville Downs is a rural lifestyle estate in Lower Chittering developed by QUBE Property Group. The project delivers 2 to 10 hectare lots in a semi rural setting about an hour north of Perth, with green rolling hills, large building envelopes and easy access to Bullsbrook and the wider Swan region. Land releases have sold out and the estate now functions as an established rural residential community.
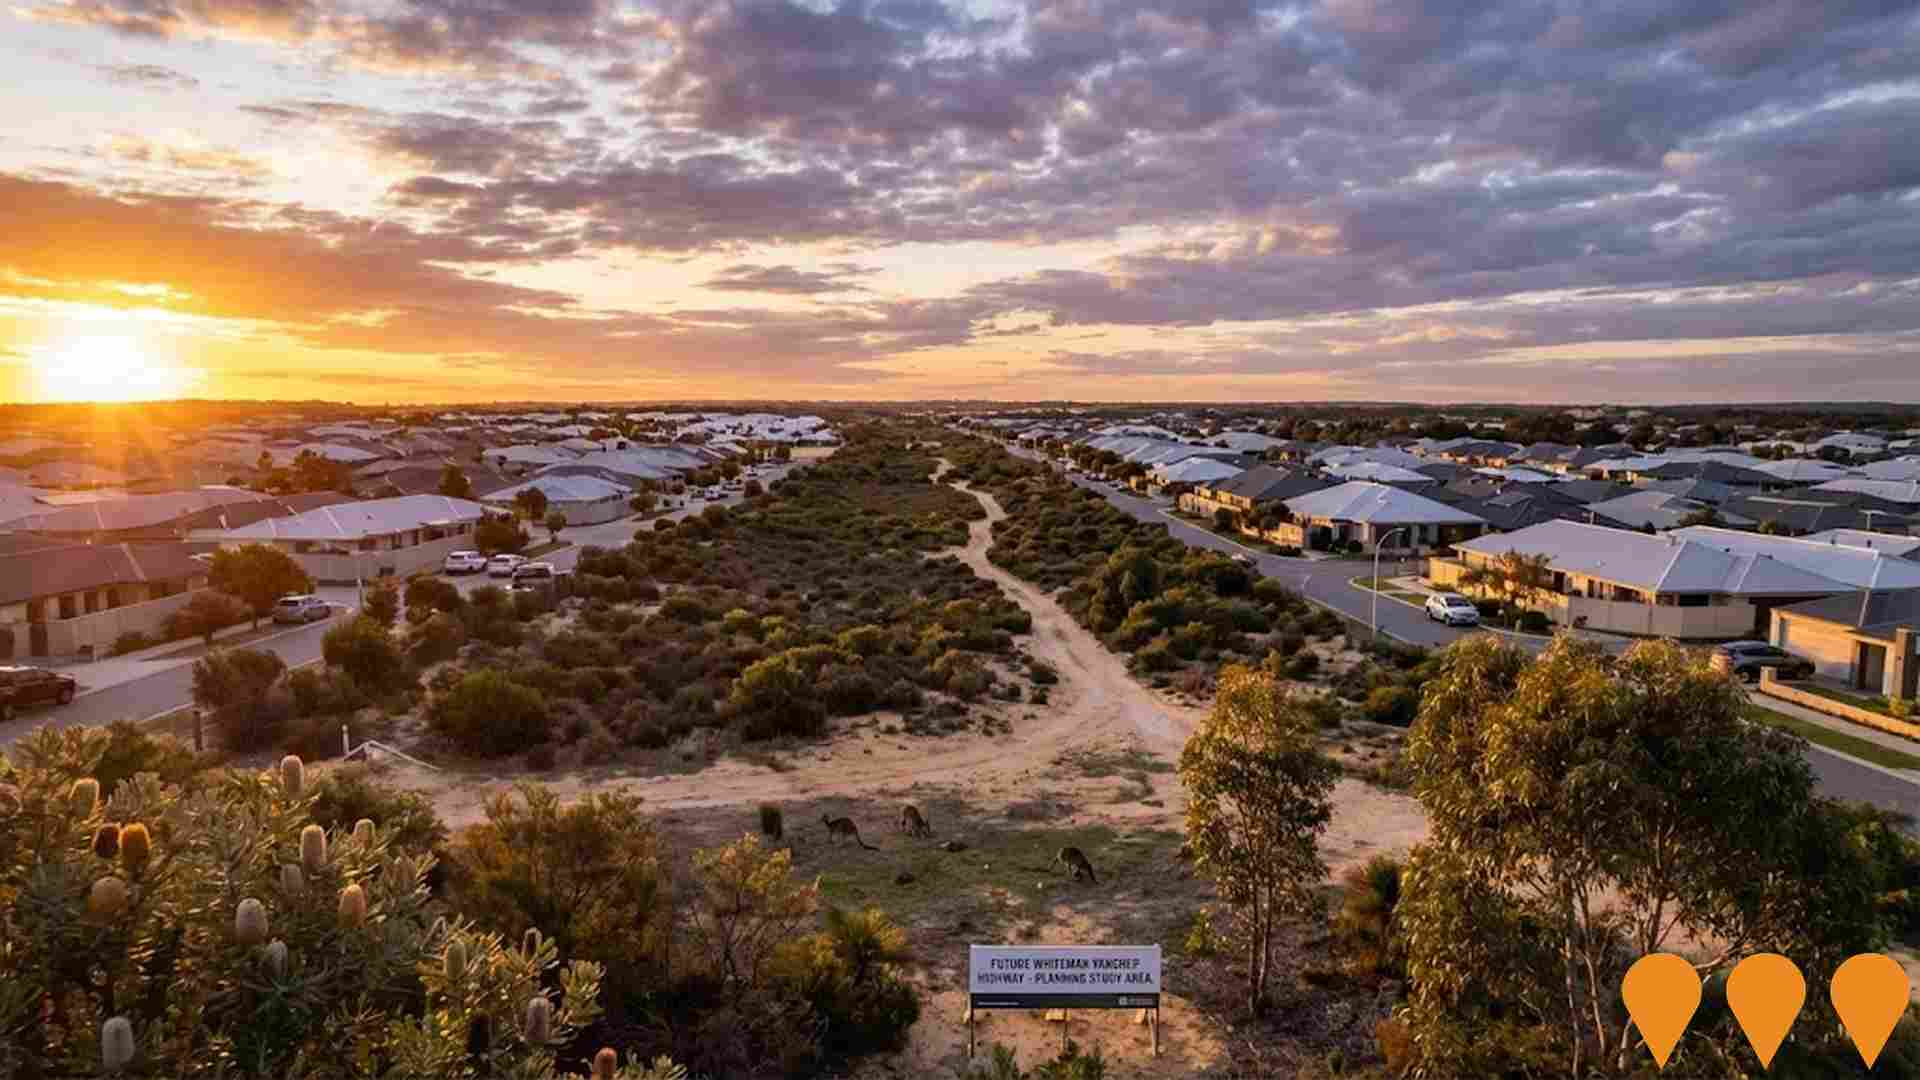
Whiteman Yanchep Highway Planning (Neaves Road North Corridor)
Alignment definition study and Planning Control Area (PCA 173) declared to protect the road reservation for the future Whiteman Yanchep Highway (previously the East Wanneroo North-South Route). This proposed new north-south route is intended to ease pressure on the Mitchell Freeway and facilitate regional freight and commuter traffic movement. It is currently a planning study only with no funding available for construction.
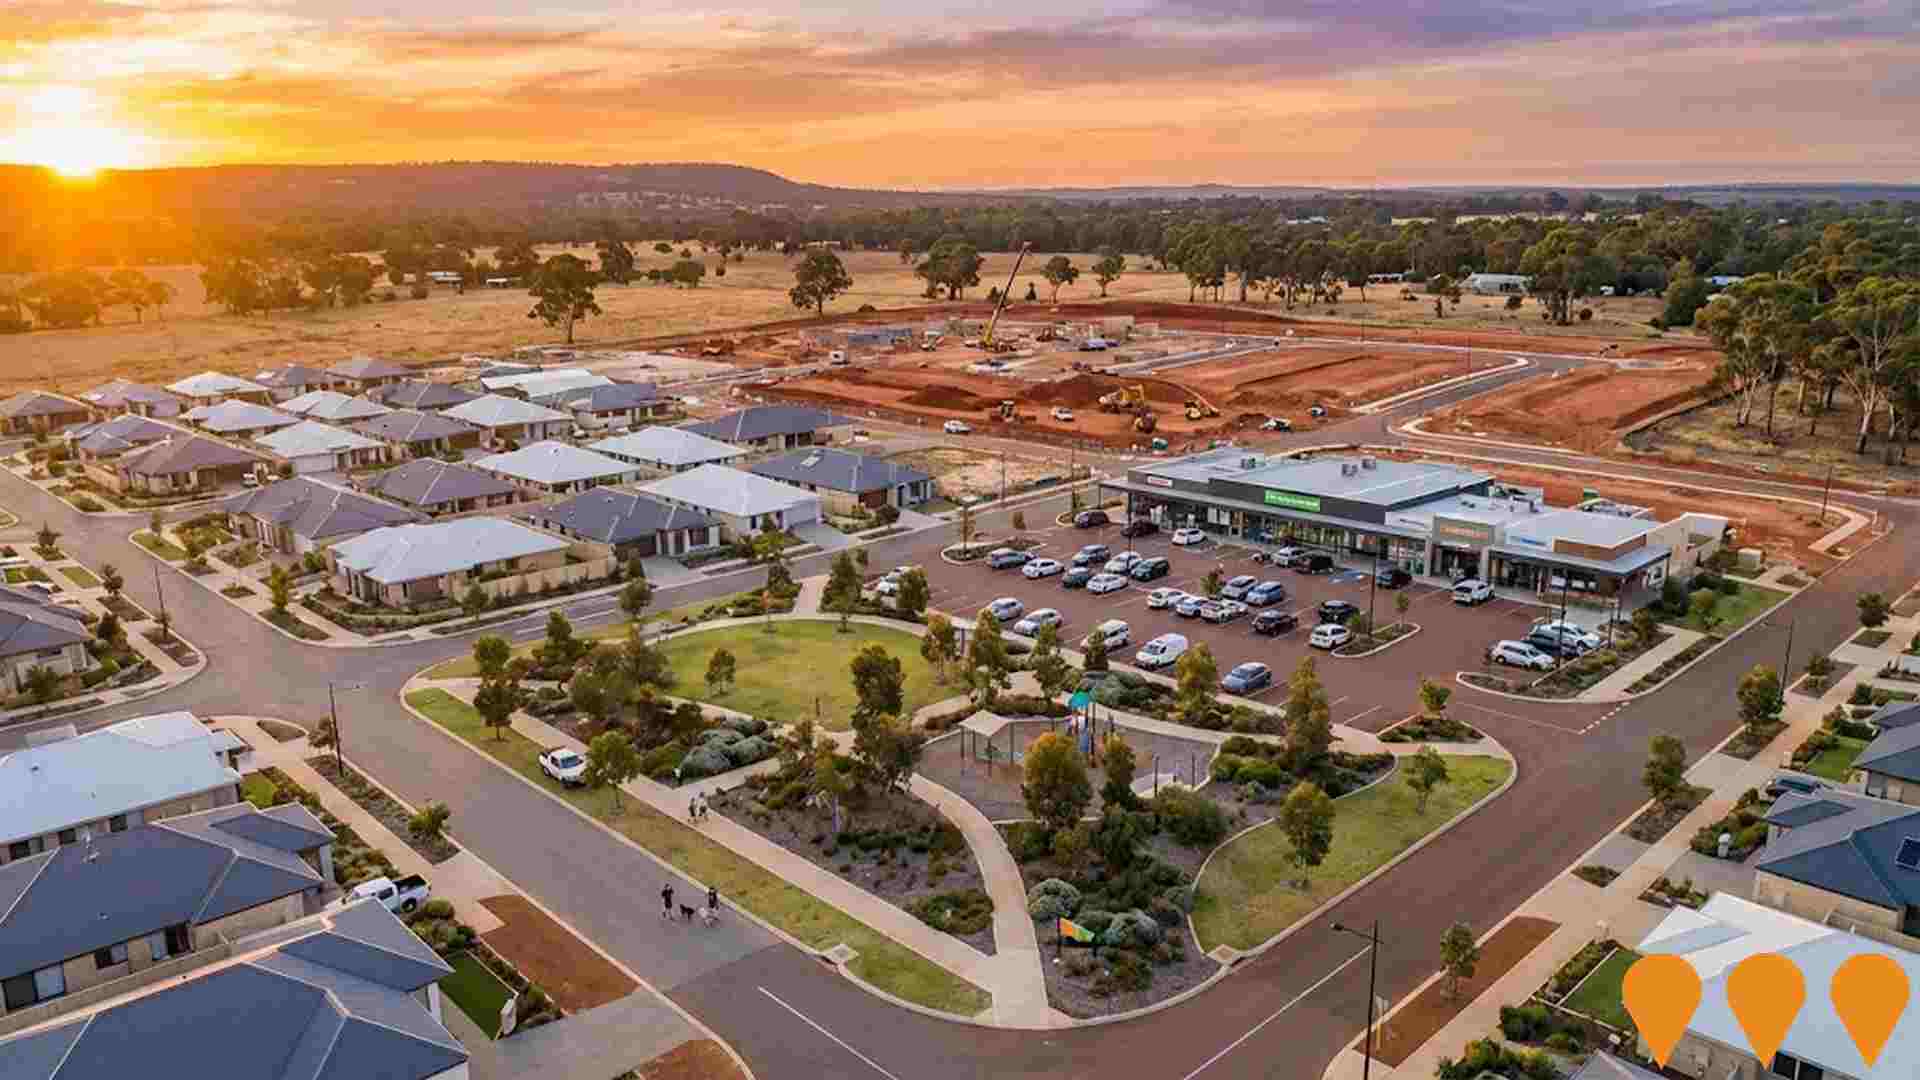
Kingsford Town Centre
Neighbourhood shopping centre within the Kingsford masterplanned community in Bullsbrook, anchored by a full-line Woolworths supermarket (3,600 m2), BWS liquor and 15 specialty tenancies. Stage 1 of the broader mixed-use town centre that will eventually include tavern, childcare, medical centre, main street retail and community facilities.

The Views Bullsbrook Estate
Residential land estate in the Bullsbrook foothills with views to the Perth hills and sunset coast, developed across two stages totalling approximately 22 hectares and around 187 lots. Lots ranged from family sized blocks to smaller downsizer options, with house and land packages marketed via local builders. Both Stage 1 and Stage 2 are now titled and sold out, with the estate no longer listed among active releases by its project marketer. Located on Amalfi Drive close to Bullsbrook College, the Swan Valley wine region, and the NorthLink WA corridor into Perth.Estate promoted by Bullsbrook Syndicate Pty Ltd with sales handled by Jones Realty & Projects and Stage Property.
Bullsbrook Heights Private Estate
Private residential estate in Perth's foothills, 25 minutes to Perth Airport. Limited land available with easy access to NorthLink Highway connecting to Perth CBD. Close to schools, library, and local amenities.


672 residents of Bindoon are employed, from a labour force of 678. Unemployment sits at 0.9%, with participation at 54.7%. Weighted for its industry mix, the area's sectors are forecast to grow about 5.3% nationally over five years. That reflects industry composition only and makes no allowance for local population growth, so in an area growing as fast as this one it understates the likely rise in local jobs. Unemployment and labour force come from ABS Small Area Labour Markets, updated quarterly; the industry and occupation profile is from the 2021 Census.
Detail
Bindoon possesses a balanced workforce encompassing white and blue collar jobs, with manufacturing and industrial sectors highly represented, and an unemployment rate of just 0.9%, based on AreaSearch compilation of statistical area data. As of March 2026672 residents are employed while the unemployment rate is 2.6% below Regional WA's rate of 3.5%, and workforce participation is significantly lower (54.7% compared to Regional WA's 65.6%). Based on Census feedback, a low 11.4% of residents were recorded working from home, although Covid-19 lockdown influences should be taken into account. The primary sectors of employment among residents are agriculture, forestry & fishing, health care & social assistance, and education & training.
The area has a specific employment concentration in agriculture, forestry & fishing, with an employment share of 1.5 times the regional level. Conversely, accommodation & food has a minor presence with 2.6% employment compared to 7.1% regionally. The location seems to provide restricted employment opportunities locally, as shown by the comparison of Census working population versus resident population. Based on AreaSearch analysis of SALM and ABS data, compiled from broader statistical areas, over the 12 months to March 2026, labour force numbers decreased by 5.2% alongside a 5.6% employment drop, resulting in the unemployment rate rising by 0.5 percentage points. In contrast, Regional WA experienced an employment decline of 0.1% and labour force expansion of 0.3%, with a 0.4 percentage point increase. Jobs and Skills Australia's national employment forecasts from May-25 can provide additional perspective into potential future demand within Bindoon. These projections, spanning five and ten-year intervals, have been matched against the local employment profile to estimate growth patterns. While national employment is projected to grow by 6.6% over five years and 13.7% over ten years, growth rates vary greatly between industry sectors. Applying these industry-specific projections to Bindoon's employment profile indicates local employment should rise by 5.3% over five years and 11.9% over ten years (please note this is a basic weighting extrapolation for illustrative purposes and does not take into account localised population projections).
Frequently Asked Questions - Employment
Median household income in Bindoon is $1,375 a week (about $72,000 a year), with median personal income at $655 a week. ATO records put median taxable income at $46,622 a year against an average of $59,128. Household income is from the 2021 Census; taxable income is from ATO Taxation Statistics for the latest financial year available, indexed forward using the ABS Wage Price Index.
Detail
The income level in Bindoon is lower than average on a national scale according to the most recent ATO data compiled by AreaSearch for financial year 2023. The median income among taxpayers in Bindoon is $46,622 and the average income is $59,128, which contrasts with figures for Regional WA of $59,973 and $74,392 respectively. Based on Wage Price Index expansion of 10.93% since financial year 2023, current estimates would be approximately $51,718 (median) and $65,591 (average) as of March 2026. Census data indicates household, family and personal incomes in Bindoon all place between the 20th and 26th percentiles nationally.
Distribution details show the $1,500 - 2,999 weekly earnings band contains 26.8% of the community (404 individuals), matching the region where 31.1% reside in this bracket. After housing expenses, 85.9% of income is retained, though this is positioned at only the 28th percentile nationally.
Frequently Asked Questions - Income
Bindoon had 424 occupied dwellings at the 2021 Census, 96% detached houses and 4% apartments. 39% are owned with a mortgage, 14% rented and 47% owned outright. At that Census the median rent was $300 a week and the median mortgage repayment $1,688 a month. Rent absorbs 21.8% of household income here and mortgage repayments 28.3%. Dwelling stock, tenure and housing costs are 2021 Census measures — the only source that counts dwellings at this boundary size.
Detail
Dwelling composition within Bindoon, as assessed at the latest Census, consisted of 95.8% houses and 4.2% other dwellings (semi-detached, apartments, 'other' dwellings), compared to Regional WA's 88.5% houses and 11.6% other dwellings. Meanwhile, the rate of home ownership in Bindoon was significantly higher than that of Regional WA, at 46.9%, with the remaining dwellings being mortgaged (39.3%) or rented (13.8%). The median monthly mortgage payment in the area was higher than the Regional WA average at $1,688, while the median weekly rent figure was recorded at $300, compared to Regional WA's $1,560 and $265.
Nationally, Bindoon's mortgage repayments are lower than the Australian average of $1,863, while rents are substantially below the national figure of $375.
Frequently Asked Questions - Housing
Bindoon counted 424 households at the 2021 Census, an estimated 526 today, averaging 2.4 people each. 25% are couples with children, against 40% couples without children. 23% of households are people living alone, and families average 2.0 children. Household and family composition is measured only by the Census, so these are 2021 figures.
Detail
Family households make up the majority at 77.6% of all households, consisting of 25.3% couples with children, 40.3% couples without children, and 9.6% single parent families. Non-family households constitute the remaining 22.4%, with single person households at 23.0% and group households comprising 1.2% of the total. The median household size of 2.4 people is slightly below the Regional WA average of 2.5.
Frequently Asked Questions - Households
14.6% of adults in Bindoon hold a university qualification, including 9.7% with a bachelor degree and 2.0% with postgraduate qualifications, lower than 85% of areas nationally. A further 30.5% hold a vocational qualification. 2 schools serve the area, with 220 enrolment places and an average ICSEA of 800 against a national benchmark of 1,000. Qualifications come from the 2021 Census; school enrolments, ICSEA and results come from ACARA's current release.
Detail
The region encounters educational obstacles, with university qualification levels (14.6%) significantly below the Australian average of 30.4%. This represents both a difficulty and an opening for targeted educational programs. Bachelor degrees are most common at 9.7%, followed by graduate diplomas (2.9%) and postgraduate qualifications (2.0%). Vocational and technical skills are highly represented, with 43.0% of residents aged 15+ holding trade credentials – advanced diplomas (12.5%) and certificates (30.5%). Educational enrolment is remarkably high, with 30.1% of residents currently participating in formal study. This includes 14.6% in secondary education, 10.8% in primary education, and 1.8% undertaking tertiary studies.
Frequently Asked Questions - Education
Schools Detail
Getting around Bindoon means driving: households keep an average of 1.9 vehicles, and scheduled services reach only a handful of stops. Service data is built from operators' published GTFS timetables; vehicle ownership is from the 2021 Census.
Detail
Public transport analysis shows 4 active transport stops operating within Bindoon consisting of a mix of buses. These stops are serviced by 1 individual routes, collectively offering 4 weekly passenger trips. Transport accessibility is classified as limited, with residents typically located 1907 meters from the nearest transport stop. As a primarily residential area, most residents commute outward - private vehicle remains the main method at 88%, with 7% walking. Vehicle ownership averages 1.9 per household, exceeding the regional average. A relatively low 11.4% of residents work from home (2021 Census; may reflect COVID-19 conditions).
Service frequency averages no trips per day across all routes, translating to approximately 1 weekly trip per individual stop.
Frequently Asked Questions - Transport
Transport Stops Detail
65.9% of residents in Bindoon report no long-term health condition. 5.5% need daily assistance with core activities, and 50.7% hold private health cover. The standardised death rate runs at 6.5 per 1,000 residents. Health conditions, assistance needs and insurance are 2021 Census measures; the death rate comes from current ABS releases.
Detail
Bindoon faces notable health difficulties, based on AreaSearch's evaluation of mortality rates and chronic condition prevalence, with common health conditions somewhat widespread across both younger and older age brackets, and the rate of private health insurance found to be relatively low at approximately 51% of the total population (~764 people). This compares to 56.4% across Regional WA and a national average of 55.7%. The most frequent medical conditions in the area were found to be arthritis and mental health problems, affecting 9.1 and 8.0% of residents, respectively, while 65.9% reported themselves as entirely free of medical conditions compared to 69.3% across Regional WA.
The working-age population experiences notable health difficulties with elevated chronic condition rates. The area has 26.7% of residents aged 65 and over (402 people), which is higher than the 19.2% in Regional WA. Health outcomes among seniors are especially positive, with national rankings higher than the general population.
Frequently Asked Questions - Health
Bindoon is largely Australian-born, at 77.4% of residents, with 7.5% speaking a language other than English at home. The largest reported ancestries are English (35.1%) and Australian (30.6%). 5.5% of residents identify as Aboriginal and/or Torres Strait Islander. Ancestry, language and country of birth are counted only by the Census, so these are 2021 figures.
Detail
Bindoon was found to be close to the wider region's average regarding cultural diversity, with 84.6% of its population being citizens, 77.4% born in Australia, and 92.5% speaking only English at home. The predominant religion in Bindoon was found to be Christianity, which accounts for 48.0% of residents. This compares to 44.6% across Regional WA. Regarding ancestry (parental country of birth), the top three represented groups in Bindoon are English, representing 35.1% of the population, Australian, representing 30.6% of the population, and Scottish, representing 7.3% of the population. Furthermore, there are notable differences in the representation of specific other ethnic cohorts: Dutch is overrepresented at 2.1% of Bindoon (versus 1.5% regionally), Australian Aboriginal at 5.5% (versus 6.1%) and Maori at 0.7% (versus 1.0%).
Frequently Asked Questions - Diversity
The median resident of Bindoon is 48, older than 90% of areas nationally. That is 1 year younger than at the 2021 Census. 18.9% of residents are aged 15 to 34. Age cohorts are not raw Census counts: the Census split is re-based to the latest ABS population estimates and state projections.
Detail
Bindoon's median age of 48 years is considerably higher than Regional WA's 40 and also significantly older than the national benchmark of 38. Compared to the Regional WA average, the 65 - 74 age group is notably over-represented (14.4% locally), while 25 - 34 year-olds are under-represented (7.9%). In the period since 2021, the 35 to 44 age group has expanded from 9.3% to 11.1% of the population, while the 15 to 24 cohort rose from 9.5% to 11.0%. In contrast, the 45 to 54 cohort has decreased from 13.8% to 10.9% and the 65 to 74 group fell from 15.5% to 14.4%.
Demographic modeling implies Bindoon's age profile will change significantly by 2041. The 25 to 34 age cohort is projected to expand notably, increasing by 44 people (38%) from 119 to 164. Conversely, population drops are projected for the 85+ and 75 to 84 cohorts.
Frequently Asked Questions - Age
Data & MethodBoundaries, Sources & Method for Bindoon
8 of 14 data sections on this page were updated within the last 12 months — the newest current to Aug 2026.
Everything is aggregated to the Suburb (SAL) boundary shown above, on a 2021 Census baseline. Only 3 sections — housing, households and cultural diversity — still wait on the 2026 Census.
The ledger — source, cycle and currency by section
| Section | Source & update cycle | Currency |
|---|---|---|
| Updated within the last 12 months 8 sections | ||
| Population | ABS, GNAF, Geoscience Australia Annual (ABS ERP) | May 2026 3 months ago headline measures · 2021 Census baseline |
| Re-based to the ABS Estimated Resident Population (June 2025 release) and updated with new dwellings from GNAF address data. Current to May 2026, with the 2021 Census supplying the small-area baseline. | ||
| Age profile | ABS, Geoscience Australia, State governments Annual | May 2026 3 months ago headline measures · 2021 Census baseline |
| Age cohorts are re-based to the latest ABS population estimates and state projections, current to May 2026. Each cohort is held as a Census baseline and a current estimate. | ||
| Development & approvals | ABS, GNAF Monthly (ABS approvals) | Jun 2026 2 months ago headline measures · May 2026 baseline |
| Property sales & rents | Valuer General, Rental Board, ABS Weekly sales, quarterly rents | Aug 2026 this month all 21 measures |
| Sales from the state Valuer General register, refreshed weekly, and rents from quarterly rental bond lodgements. Both are read live each time this page loads, current to Aug 2026. | ||
| Employment | ABS, DEWR, JSA Quarterly (ABS SALM) | Mar 2026 5 months ago headline measures · 2021 Census baseline |
| Unemployment and labour force from ABS Small Area Labour Markets, current to Mar 2026. The growth outlook applies Department of Employment (now Jobs and Skills Australia) forecasts for all 19 industry divisions to the local industry mix, so it measures sector composition rather than local expansion and makes no allowance for population growth. Job demand comes from the same agency via its Internet Vacancy Index; industry and occupation structure from the 2021 Census. | ||
| Education | ABS, ACARA Annual (ACARA) | Aug 2026 this month headline measures · 2021 Census baseline |
| Transport | ABS, State Transport Departments Each timetable release | Jul 2026 last month headline measures · 2021 Census baseline |
| Services & amenities | Provider directories, ACECQA Continuous | Jul 2026 last month all 14 measures |
| Annual and financial-year sources 3 sections | ||
| Infrastructure projects | Infrastructure Australia, State agencies, Local governments Daily | Jul 2025 about a year ago all 1 projects tracked here |
| Project pipeline maintained continuously from Infrastructure Australia, state agencies, local government and public announcements. Records are added and revised daily; this area was last updated Jul 2025. | ||
| Income | ABS, ATO Annual (ATO) | FY 2023 3 years ago headline measures · 2021 Census baseline |
| ATO taxable income statistics for FY 2023, indexed forward using the Wage Price Index. Census household income provides the distribution detail. | ||
| Health | ABS, ATO Annual | 2024 2 years ago headline measures · 2021 Census baseline |
| Census-measured — next update: 2026 Census 3 sections No more current small-area source exists for these, so they are labelled as Census-measured rather than implied to be current. | ||
| Housing | ABS 5-yearly (Census) | 2021 Census next update 2026 all 30 measures |
| Households | ABS 5-yearly (Census) | 2021 Census next update 2026 all 18 measures |
| Cultural diversity | ABS, Geoscience Australia 5-yearly (Census) | 2021 Census next update 2026 all 44 measures |
"Currency" is the most recent release feeding that section. Where the Census supplies the structural baseline underneath a current headline figure, the row says so.
How the numbers are built
Population
The Census provides the small-area baseline, aggregated from mesh blocks to this boundary. It is then re-based to the ABS Estimated Resident Population (June 2025 release), and new dwellings built since Census night are counted from address data — 62 validated new addresses here. The headline figure is therefore a current estimate for May 2026, not a 2021 count (1,215 at the 2021 Census → 1,508 now). Annual growth rates are compound (CAGR), not simple averages.
Age profile
Cohort shares are not raw Census counts. Every cohort is held as a pair — the Census baseline and a current estimate — and the split is re-based using ERP and state population projections, current to May 2026. Median age is the Census median plus modelled change since. Charts that show both are labelled "2021 Census vs Current Estimate".
Property sales
Sourced from the state valuation authority's sales register — current, not Census, and refreshed weekly. Medians are calculated from settled transactions in the period shown; periods with very low transaction counts are flagged or suppressed, because a handful of sales can move a median substantially.
Rents
Derived from state rental bond lodgement data, by dwelling type and bedroom count. Bonds are lodged at the start of a new tenancy, so this reflects new lettings, not the whole rented stock.
Development & infrastructure
Building approvals come from current ABS releases; development applications are collected from council and state planning portals; the infrastructure pipeline is compiled from Infrastructure Australia and local government sources. Applications are matched to this boundary by address or coordinates, so very recent lodgements may not yet appear.
Employment & income
Industry and occupation structure comes from the Census, but the headline labour-market indicators do not. Unemployment and labour force are derived from ABS Small Area Labour Markets (quarterly). The employment outlook applies Department of Employment forecasts for all 19 industry divisions to this area's own industry mix (the agency is now Jobs and Skills Australia), as does the Internet Vacancy Index used for job demand. Because it is weighted on industry composition alone, that outlook carries no allowance for local population growth — in fast-growing areas the real rise in local jobs will typically be higher. Income combines Census household income with ATO taxable-income statistics for FY 2023, indexed forward using the Wage Price Index.
Education, transport & amenities
School enrolments, ICSEA and performance come from ACARA's current release, not the Census. Public transport stops and service frequency are derived from GTFS timetable feeds published by state transport departments. Services and amenities are proximity and count scores built from provider directories, refreshed on their own cycle. The Census contributes only the travel-to-work and qualification measures.
Rankings and benchmarks. Where we rank this area, the comparison set is every area of the same boundary type — suburbs against suburbs, SA2s against SA2s. Benchmarks compare this area against its greater capital city region and the national figure for the same measure and period.
Limits worth knowing. Small areas carry larger error margins, and the ABS introduces small random adjustments to Census counts to protect confidentiality — so totals may not sum exactly. Estimates re-based from regional data describe the area's expected trajectory, not a direct count of it. Figures are indicative for research and are not financial, planning or valuation advice.
Cross-check us. The Census baseline for this boundary is at ABS 2021 Census QuickStats (SAL50126). QuickStats reports 2021 only — the figures on this page are more current wherever the ledger shows a later date.