Chart Color Schemes
This analysis uses ABS Statistical Areas Level 2 (SA2) boundaries, which can materially differ from Suburbs and Localities (SAL) even when sharing similar names.
SA2 boundaries are defined by the Australian Bureau of Statistics and are designed to represent communities for statistical reporting (e.g., census and ERP).
Suburbs and Localities (SAL) represent commonly-used suburb/locality names (postal-style areas) and may use different geographic boundaries. For comprehensive analysis, consider reviewing both boundary types if available.
est. as @ -- *
ABS ERP | -- people | --
2021 Census | -- people
Sales Activity
Curious about local property values? Filter the chart to assess the volume and appreciation (including resales) trends and regional comparisons, or scroll to the map below view this information at an individual property level.
Find a Recent Sale
Sales Detail
Population
An assessment of population growth drivers in Meekatharra reveals an overall ranking slightly below national averages considering recent, and medium term trends
Meekatharra's population is approximately 3,353 as of November 2025. This figure represents a growth of 200 people from the 2021 Census total of 3,153, marking an increase of 6.3%. The change is inferred from the estimated resident population of 3,347 in June 2024 and six validated new addresses since the Census date. This results in a population density ratio of 0.00 persons per square kilometer. Meekatharra's growth rate of 6.3% since the census is within 1.2 percentage points of its SA3 area (7.5%), indicating strong growth fundamentals. The primary driver for this growth was overseas migration, contributing approximately 71.4% of overall population gains during recent periods.
AreaSearch uses ABS/Geoscience Australia projections released in 2024 with a base year of 2022 for each SA2 area. For areas not covered by this data and to estimate post-2032 growth, AreaSearch employs growth rates by age cohort provided by the ABS in its latest Greater Capital Region projections (released in 2023 based on 2022 data). Future population trends anticipate above-median growth for Australia's non-metropolitan areas, with Meekatharra projected to increase by 616 persons to 2041, reflecting an 18.2% total increase over the 17-year period.
Frequently Asked Questions - Population
Development
Residential development activity is lower than average in Meekatharra according to AreaSearch's national comparison of local real estate markets
Meekatharra has recorded approximately five residential properties granted approval annually. Over the past five financial years, from FY21 to FY25, 27 homes were approved, with none yet in FY26. On average, 6.8 new residents arrived per year for each dwelling constructed during these years.
This significant demand outpaces supply, typically putting upward pressure on prices and increasing buyer competition. The average cost of developing new dwellings was $228,000, below the regional average, suggesting more affordable housing options. In FY26, $25.2 million in commercial approvals have been registered, indicating balanced commercial development activity compared to the Rest of WA, where Meekatharra has significantly less development activity, 61.0% below the regional average per person. This limited new supply generally supports stronger demand and values for established dwellings, which is also under the national average, suggesting the area's established nature and potential planning limitations. Recent construction comprises 75.0% detached dwellings and 25.0% townhouses or apartments, maintaining the area's traditional low density character with a focus on family homes appealing to those seeking space.
The estimated population per dwelling approval is 1884 people, reflecting its quiet, low activity development environment. Population forecasts indicate Meekatharra will gain 610 residents by 2041, from the latest AreaSearch quarterly estimate. If current construction levels persist, housing supply may lag population growth, likely intensifying buyer competition and underpinning price growth.
Frequently Asked Questions - Development
Infrastructure
Meekatharra has limited levels of nearby infrastructure activity, ranking in the 12thth percentile nationally
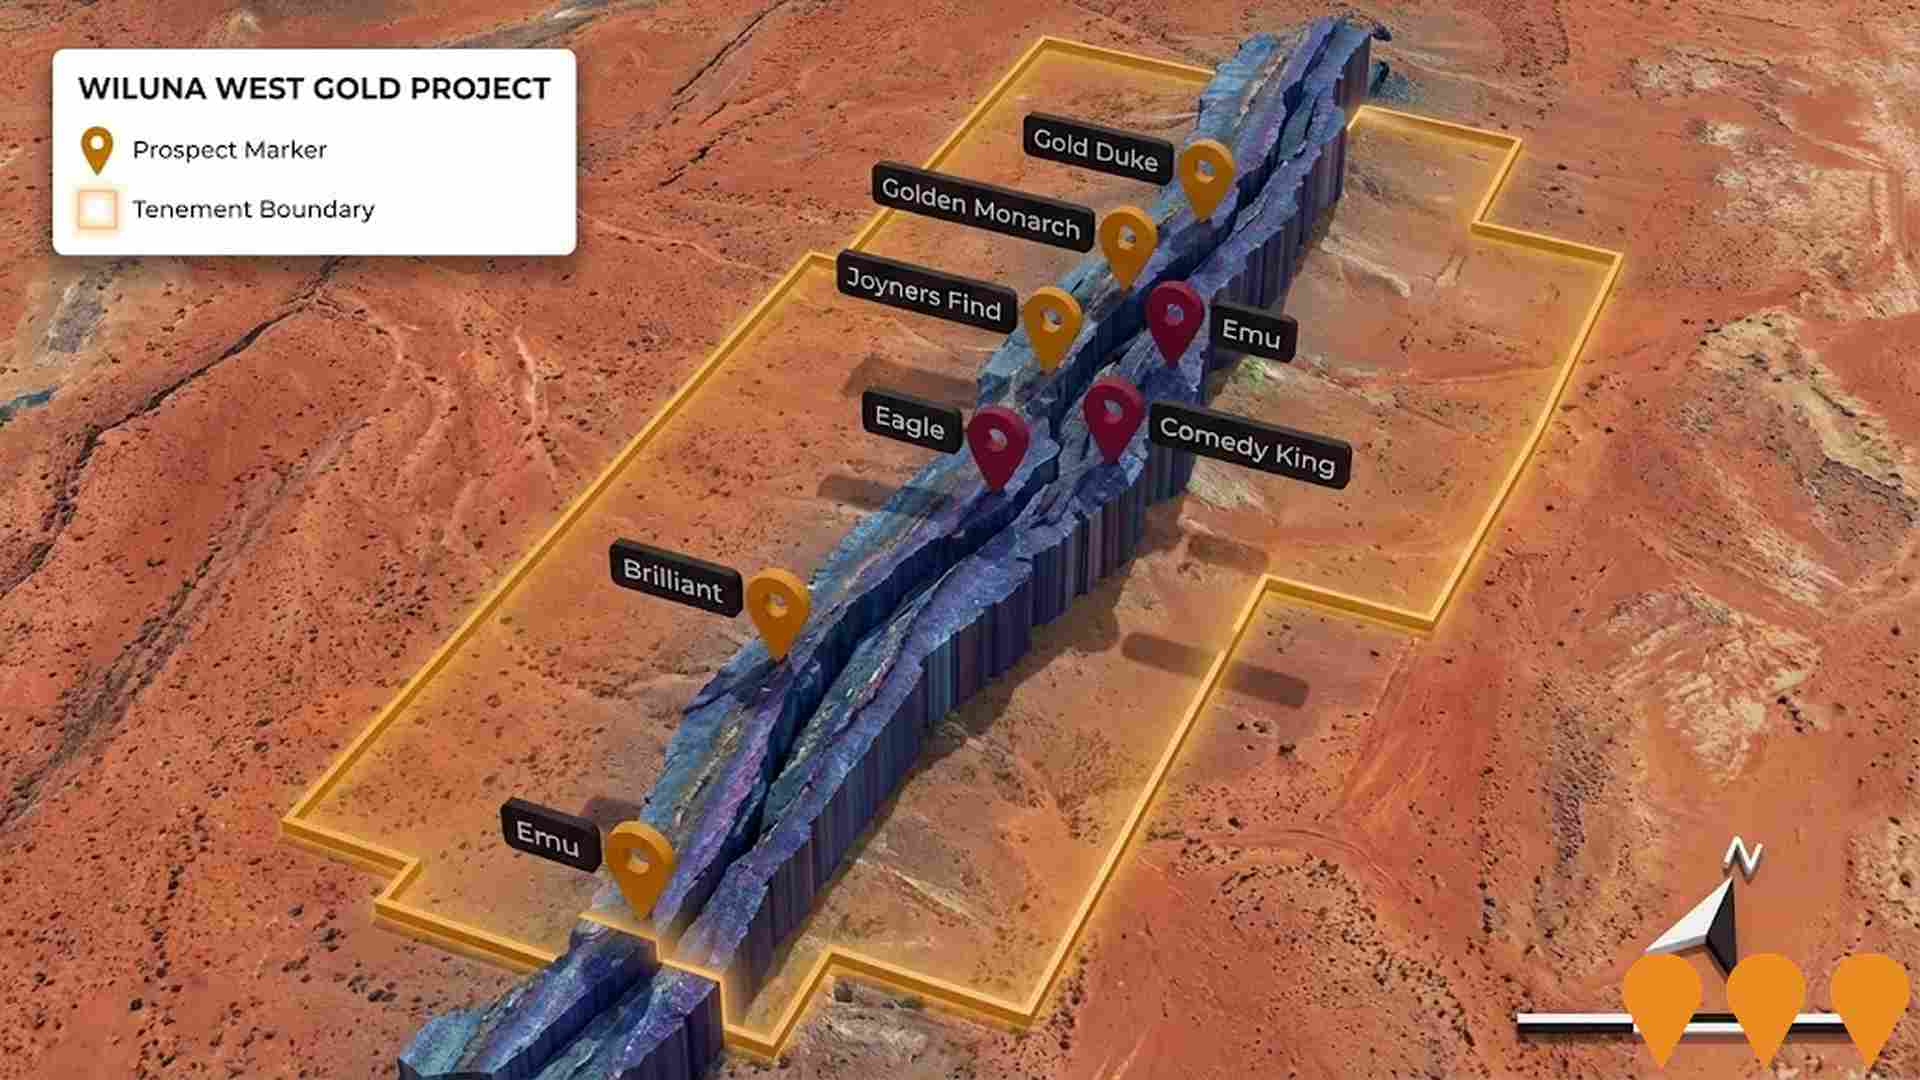
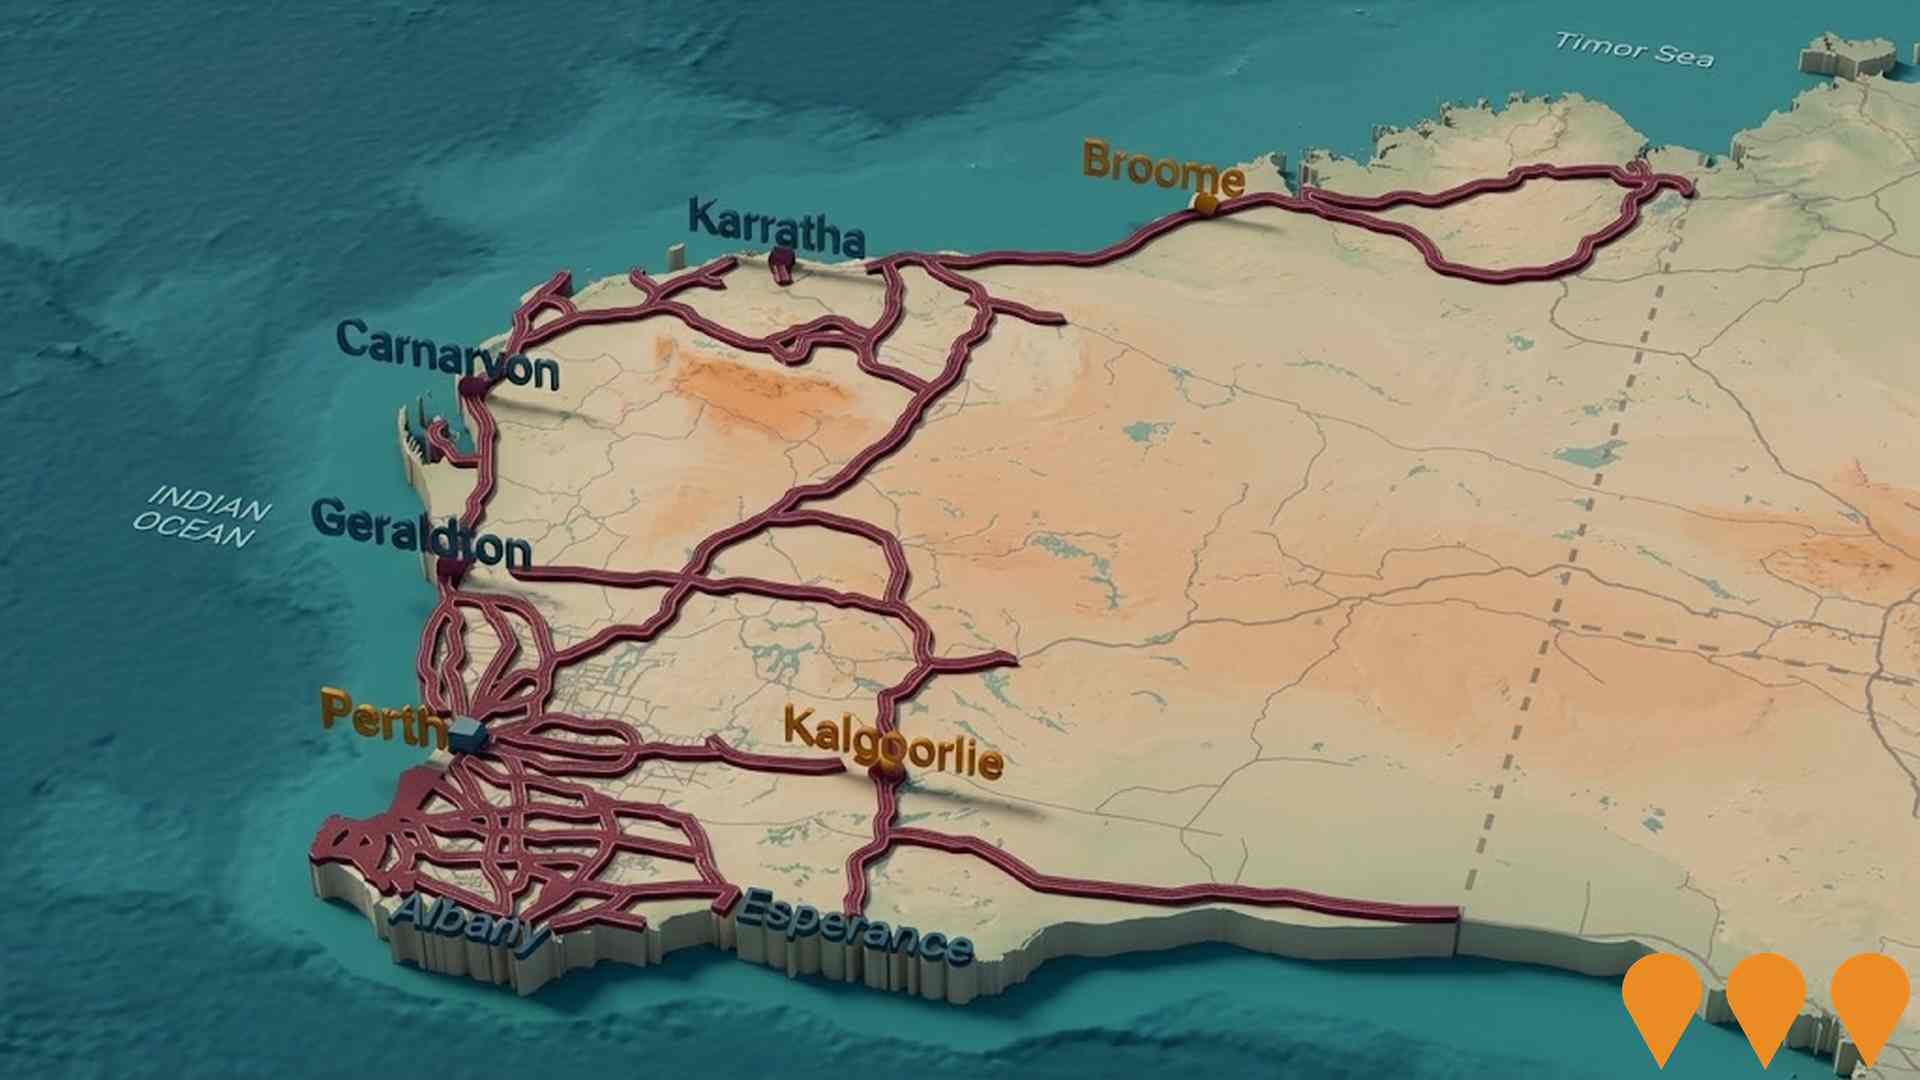
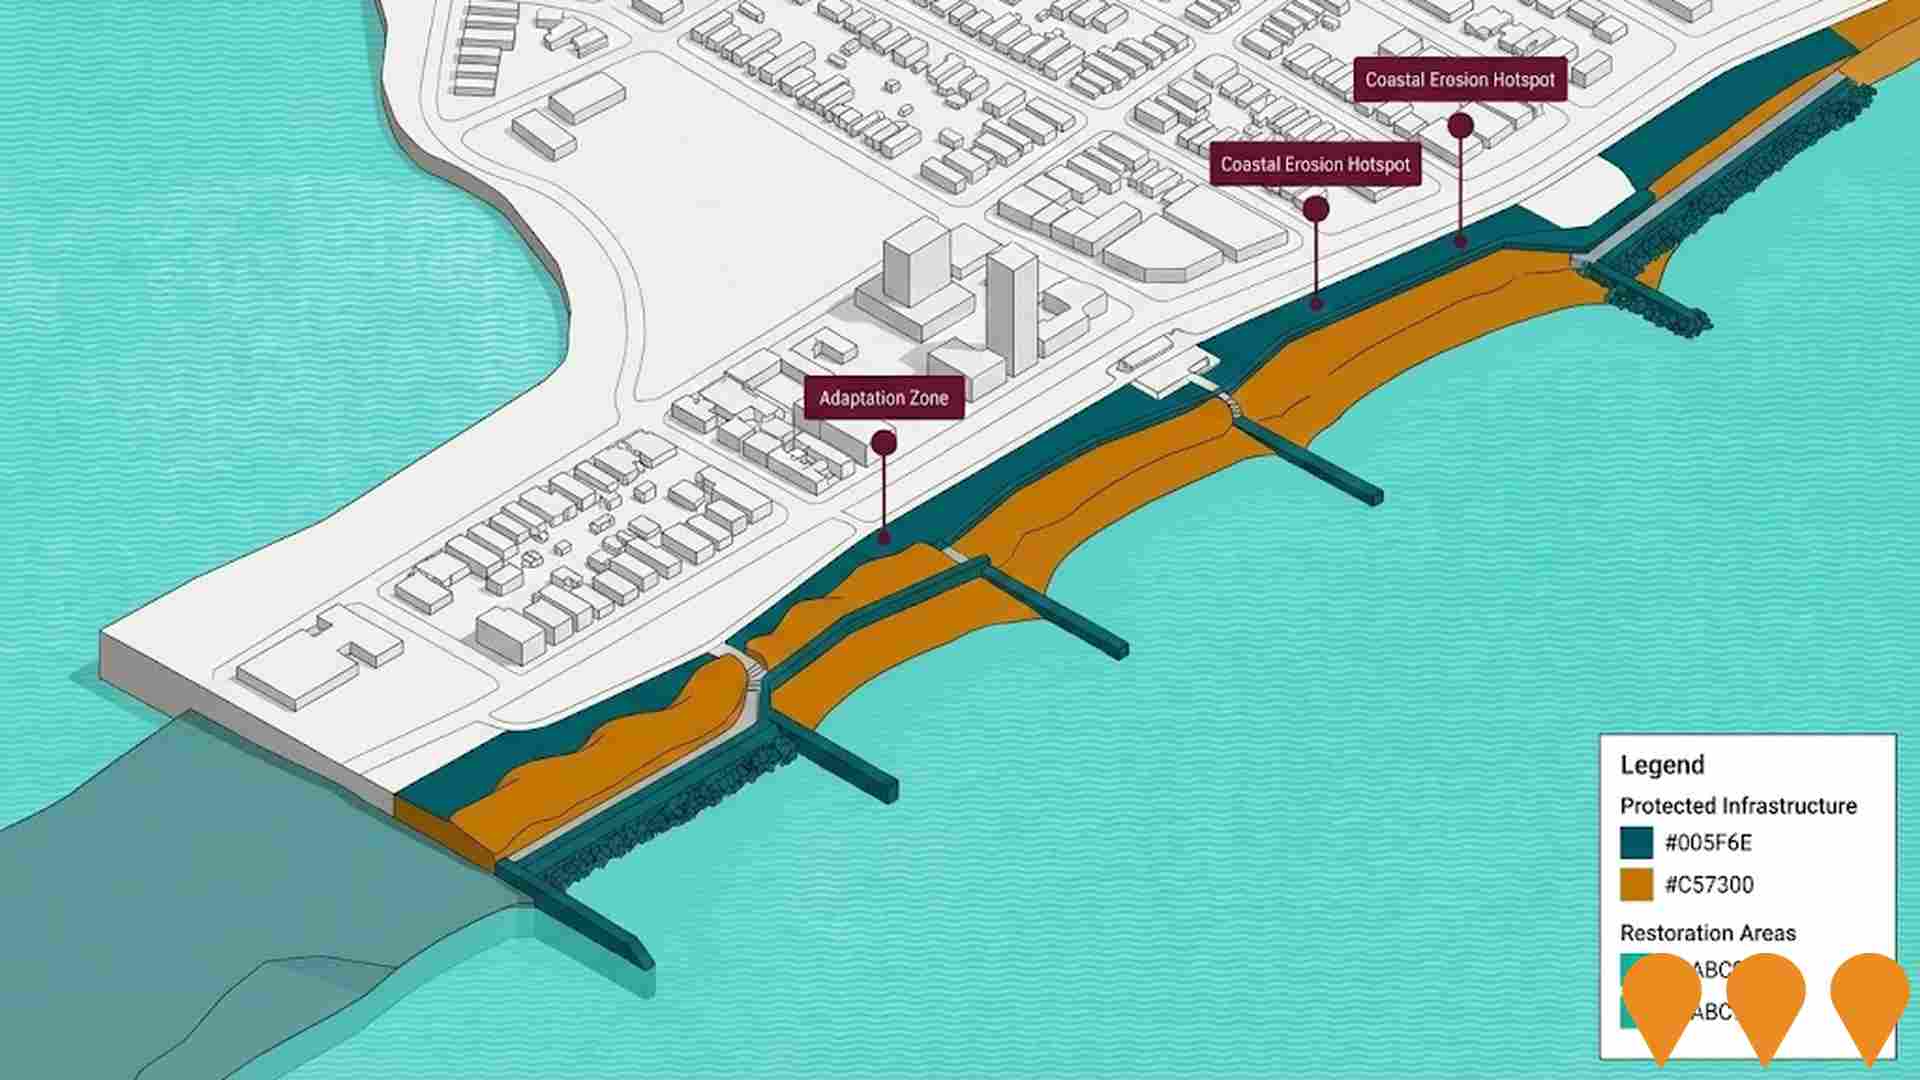
Changes to local infrastructure significantly influence an area's performance. AreaSearch has identified 40 projects likely impacting the region. Notable initiatives include the Goldfields Highway Upgrade (Wiluna to Meekatharra), Yeelirrie Uranium Project, Wiluna West Iron Ore Project, and Wiluna West Gold Project. Relevant projects are detailed below.
Professional plan users can use the search below to filter and access additional projects.
INFRASTRUCTURE SEARCH
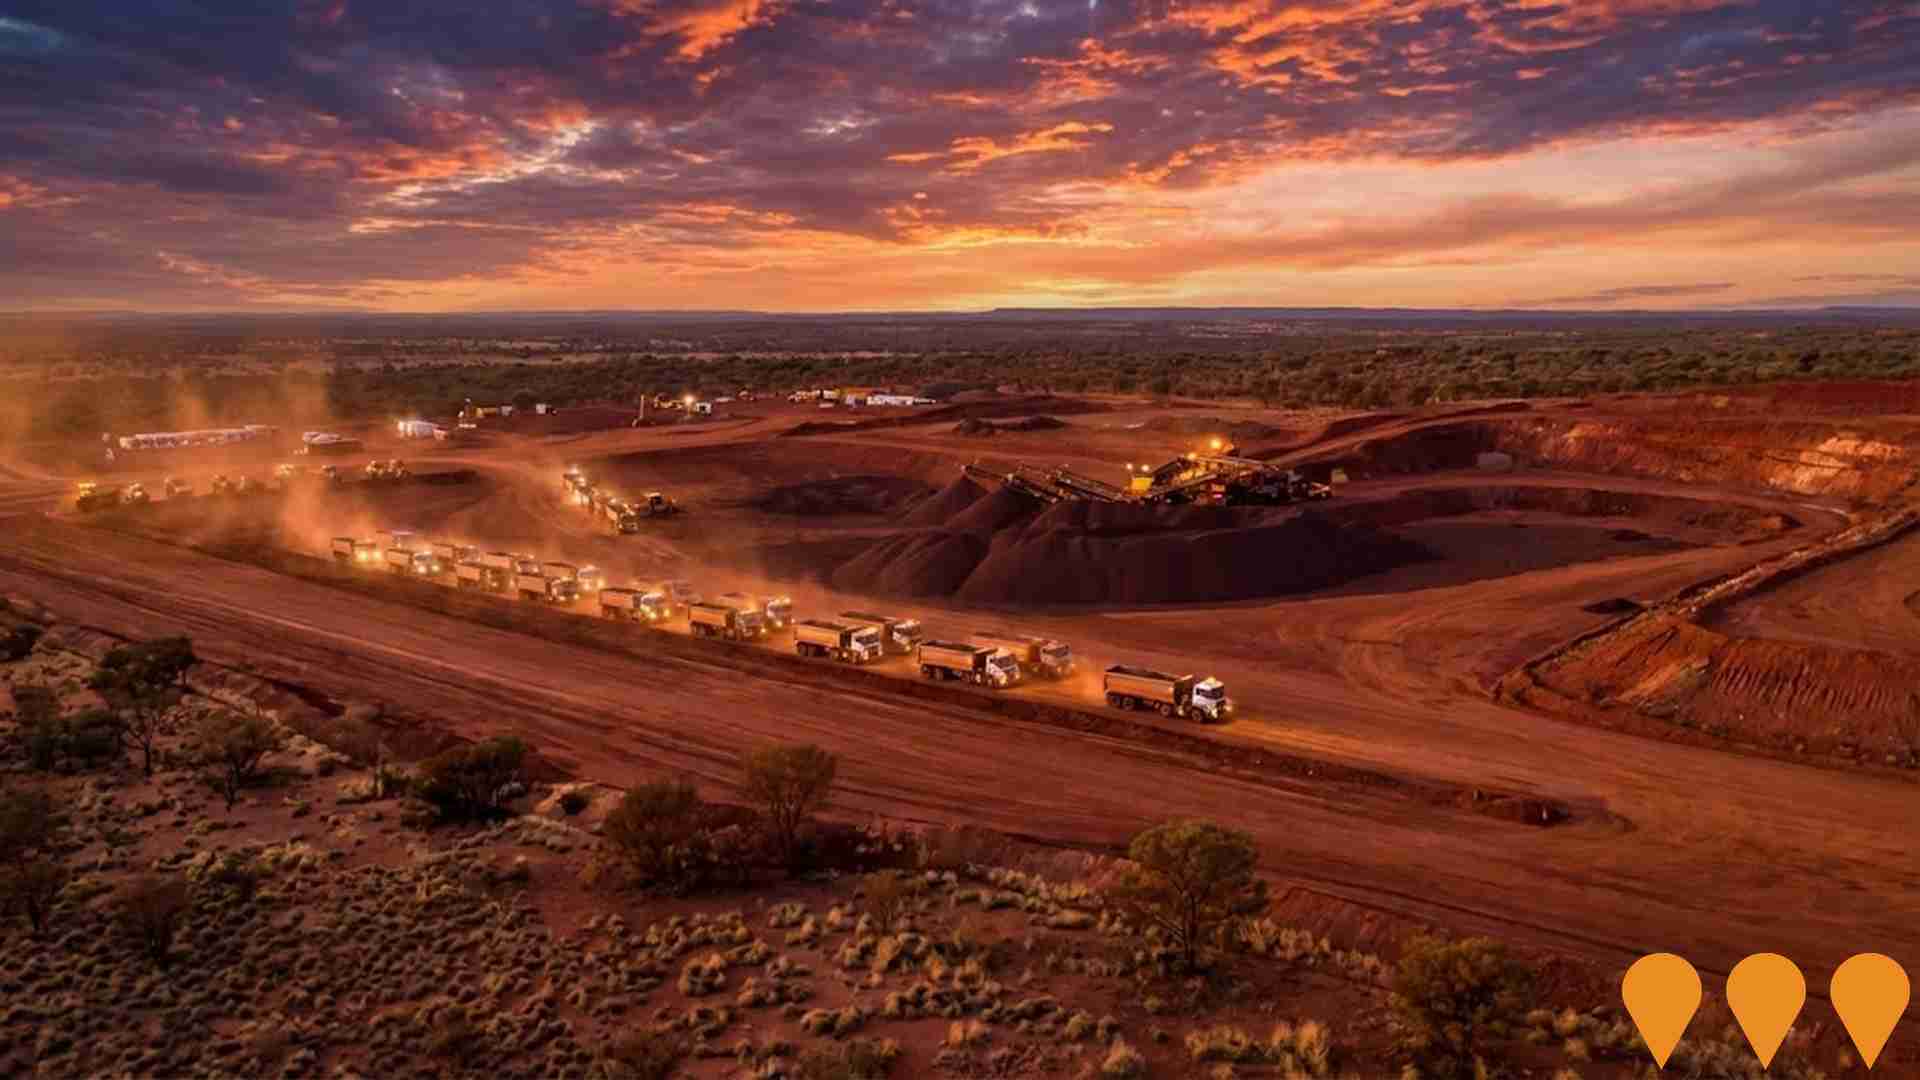
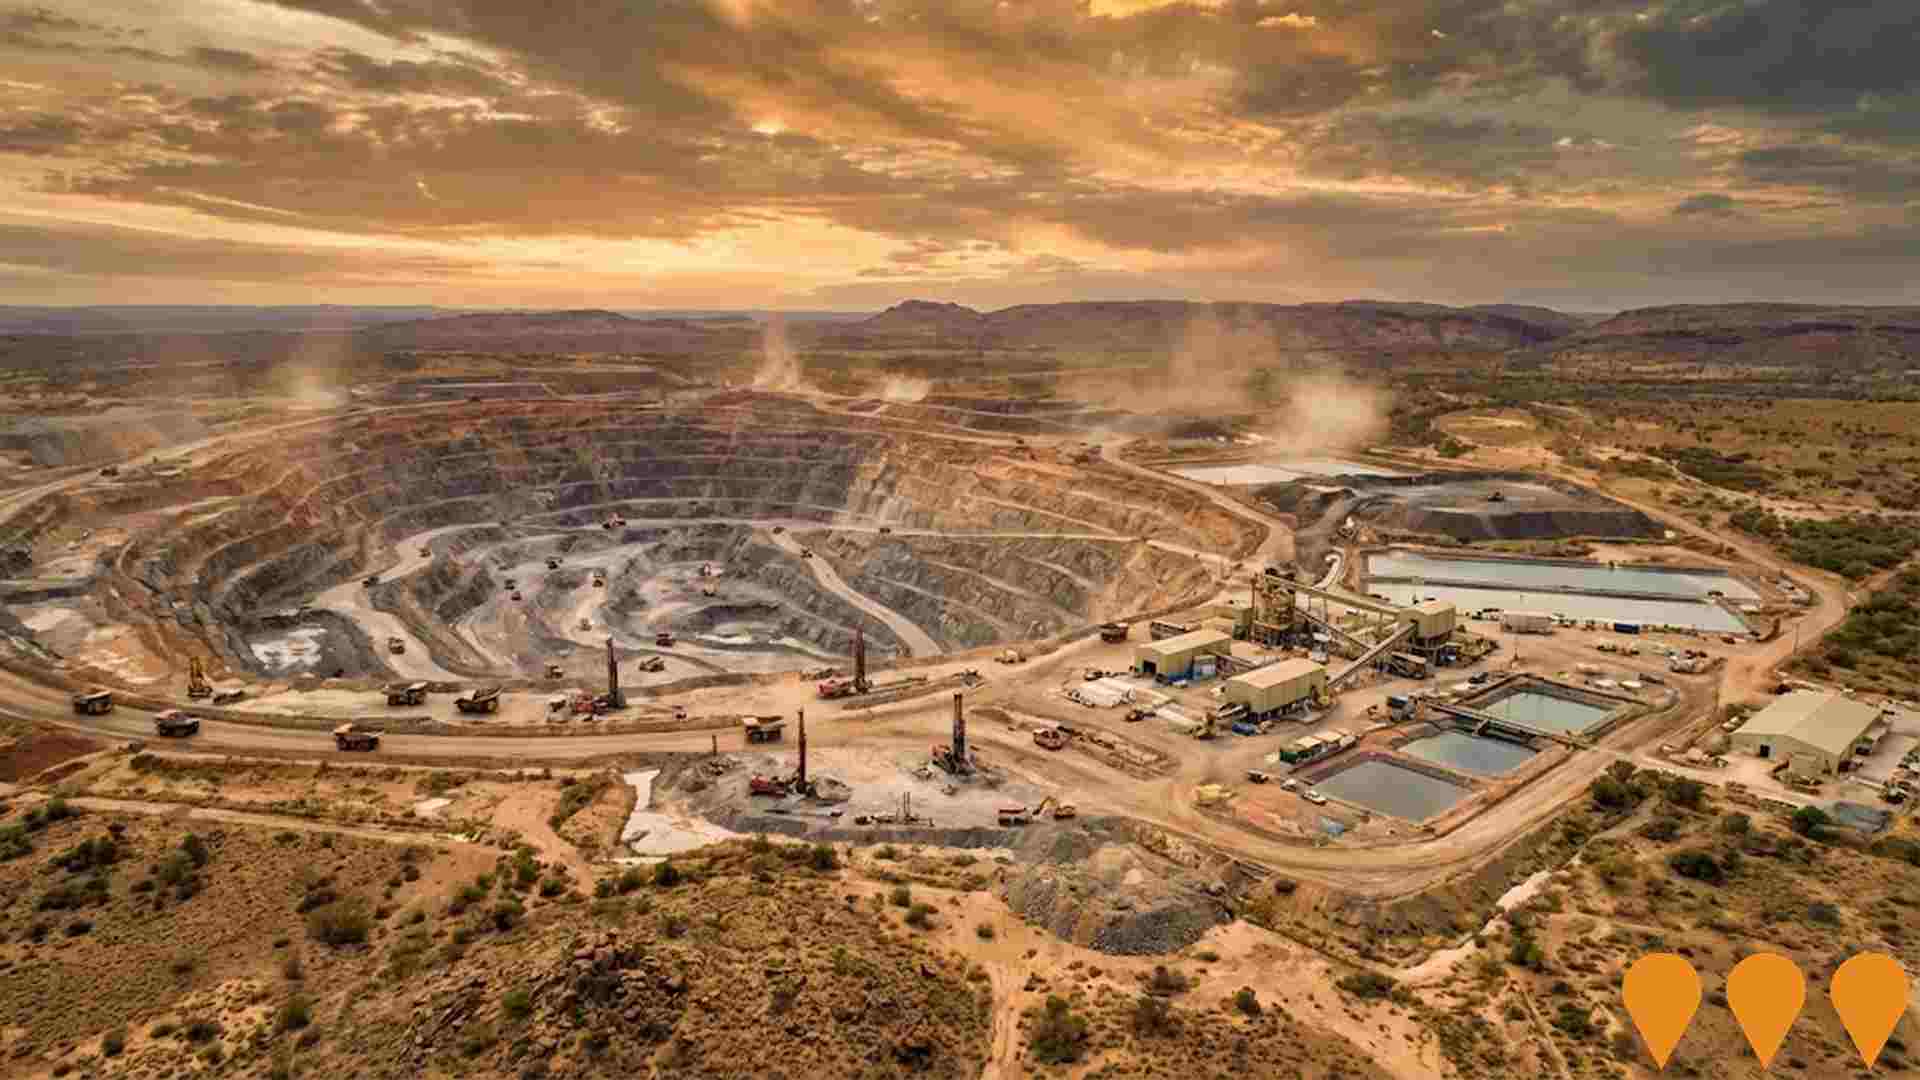
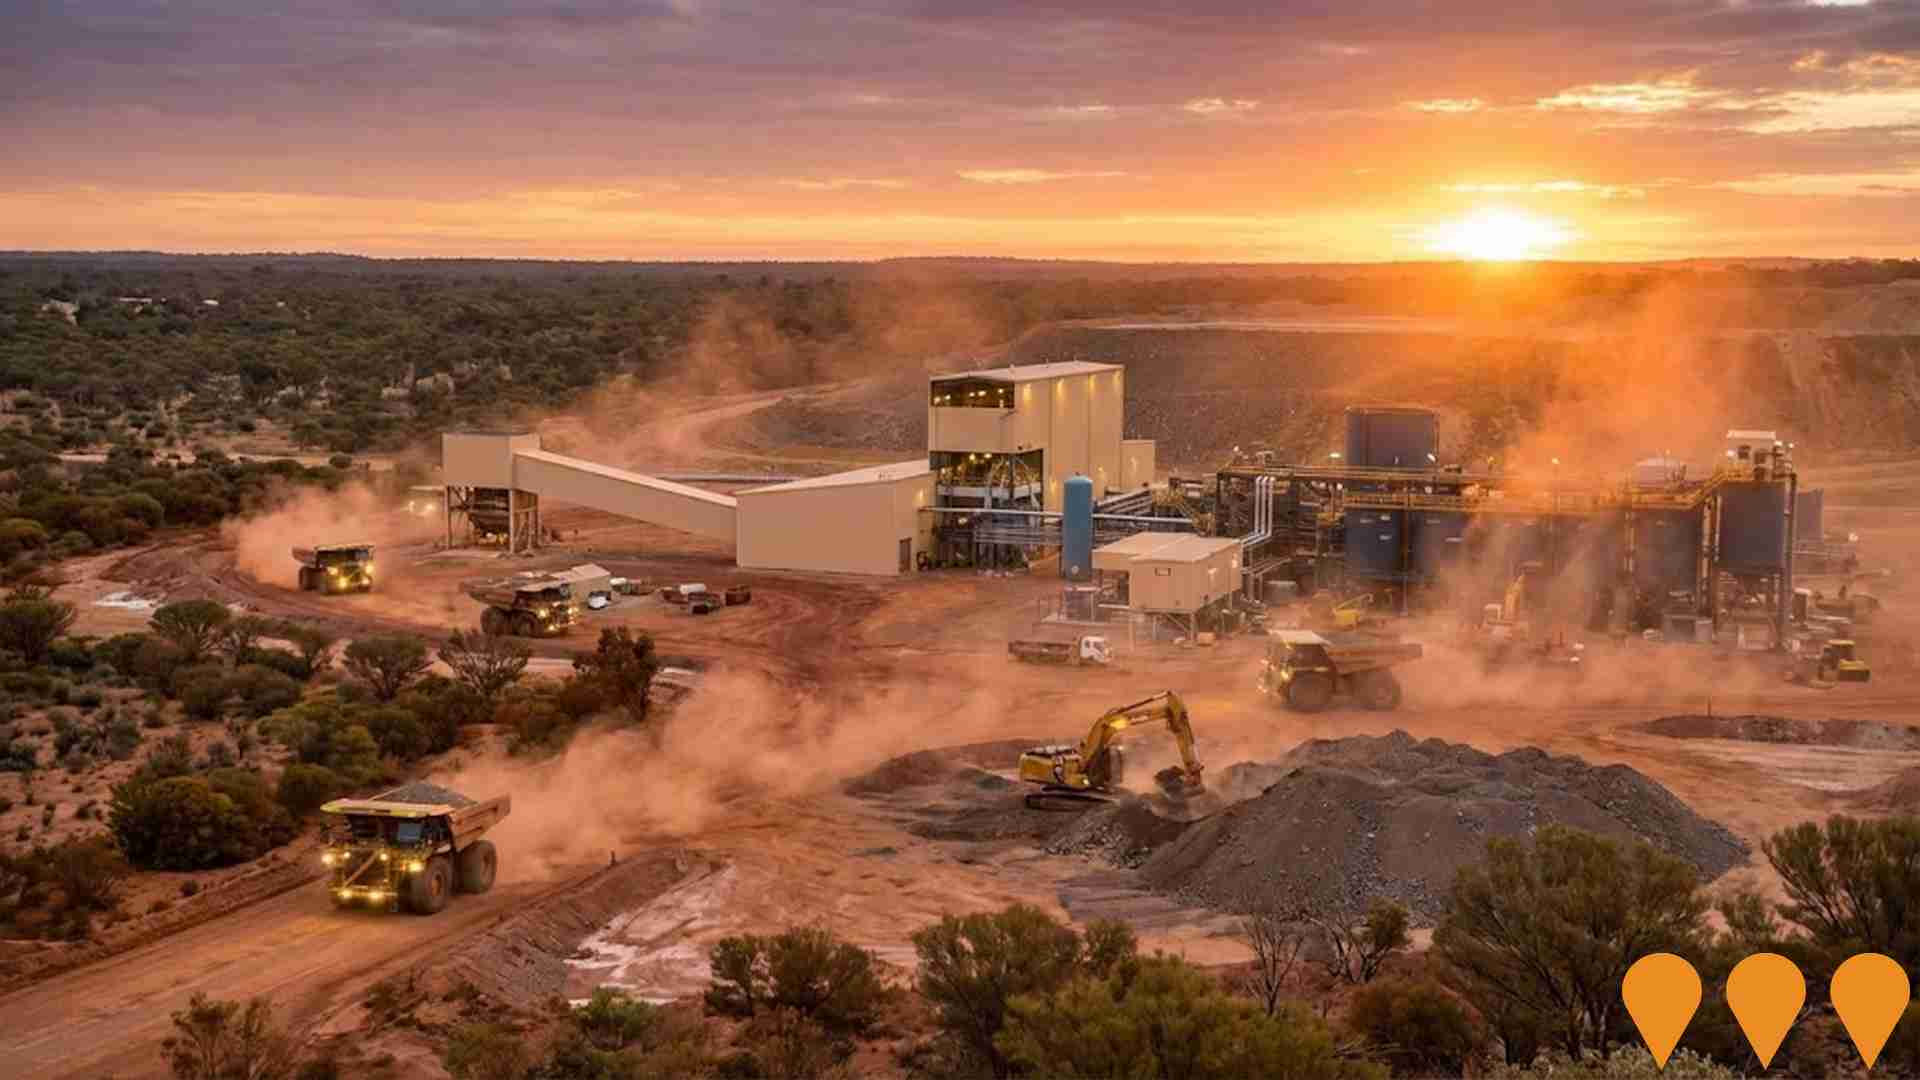
 Denotes AI-based impression for illustrative purposes only, not to be taken as definitive under any circumstances. Please follow links and conduct other investigations from the project's source for actual imagery. Developers and project owners wishing us to use original imagery please Contact Us and we will do so.
Frequently Asked Questions - Infrastructure
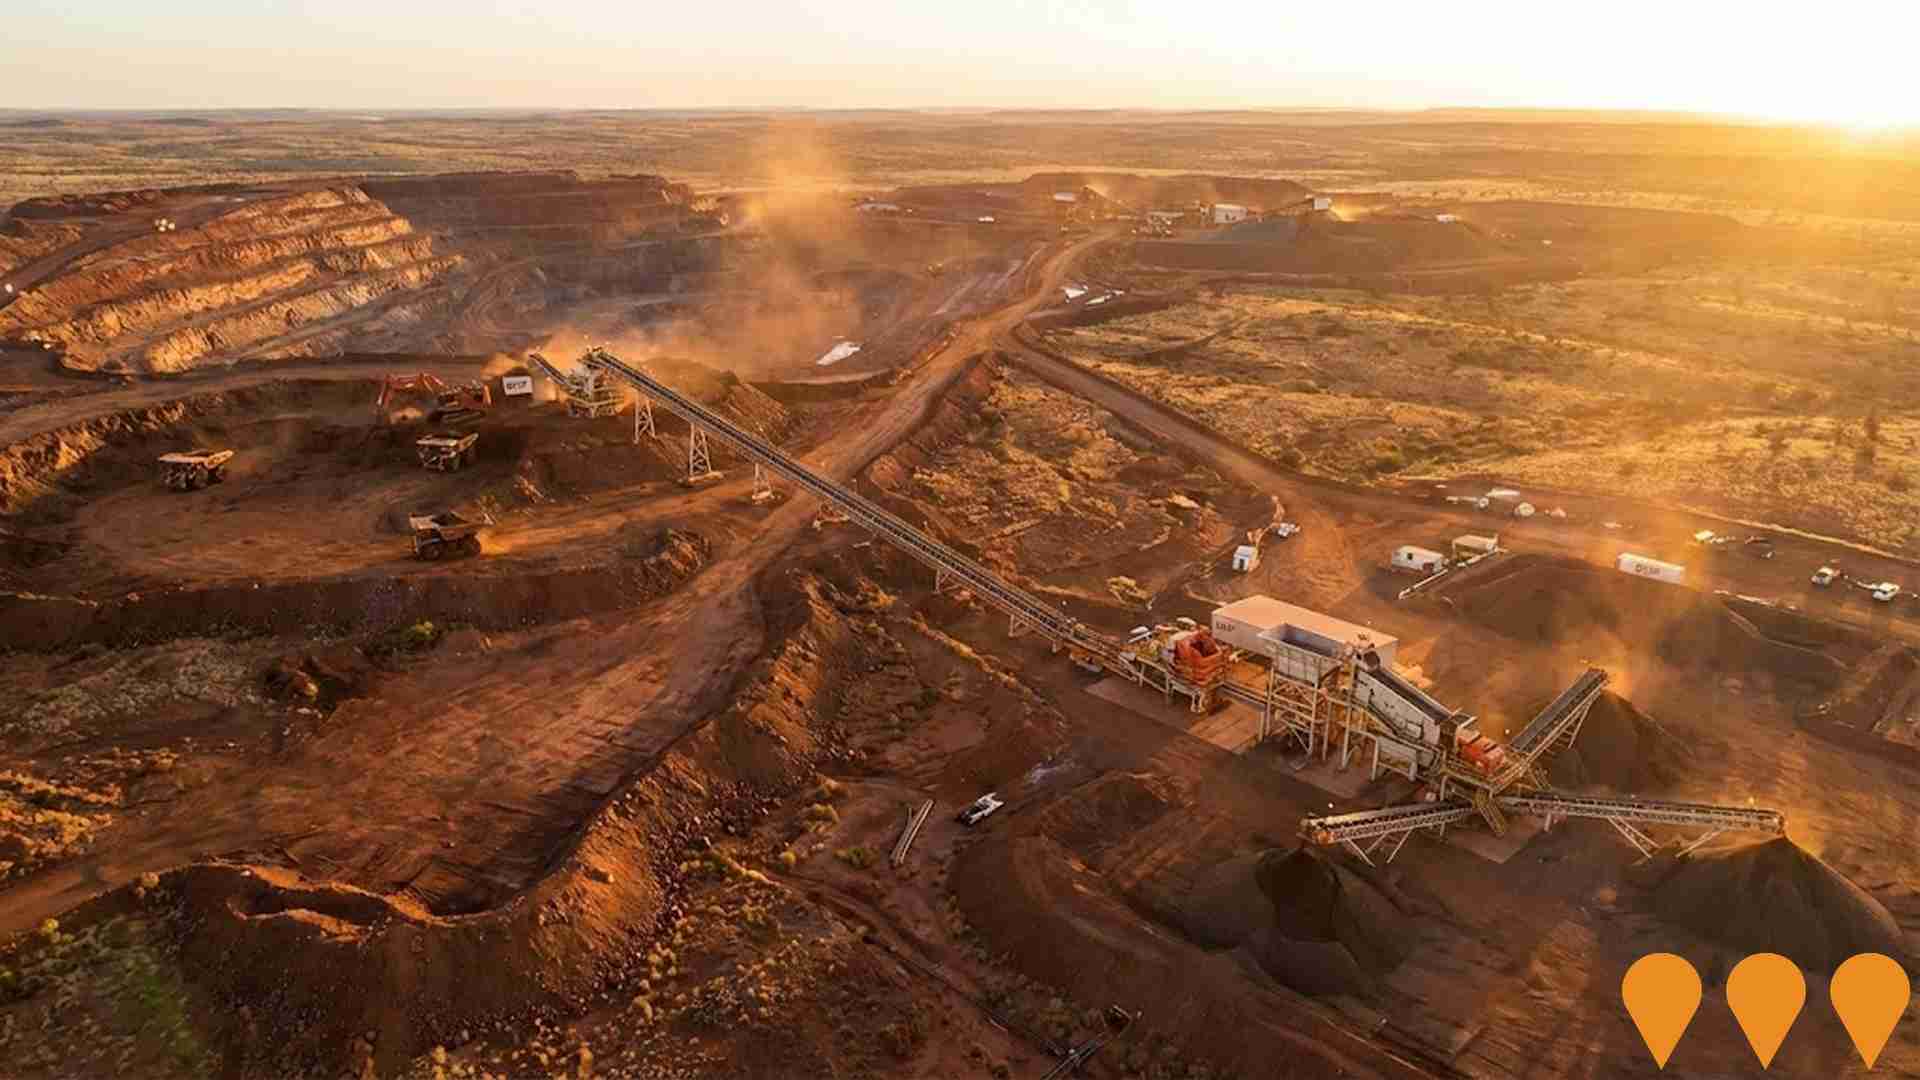
Western Ridge Iron Ore Project
BHP's Western Ridge Iron Ore Project is a greenfield mining development adjacent to the existing Mt Whaleback operations in the Pilbara region. It forms part of the WA Iron Ore growth program to sustain production capacity at approximately 330 Mtpa. The project includes two new iron ore deposits (Western Ridge North and Western Ridge South), associated crushing and screening infrastructure, overland conveyors and supporting non-process infrastructure.
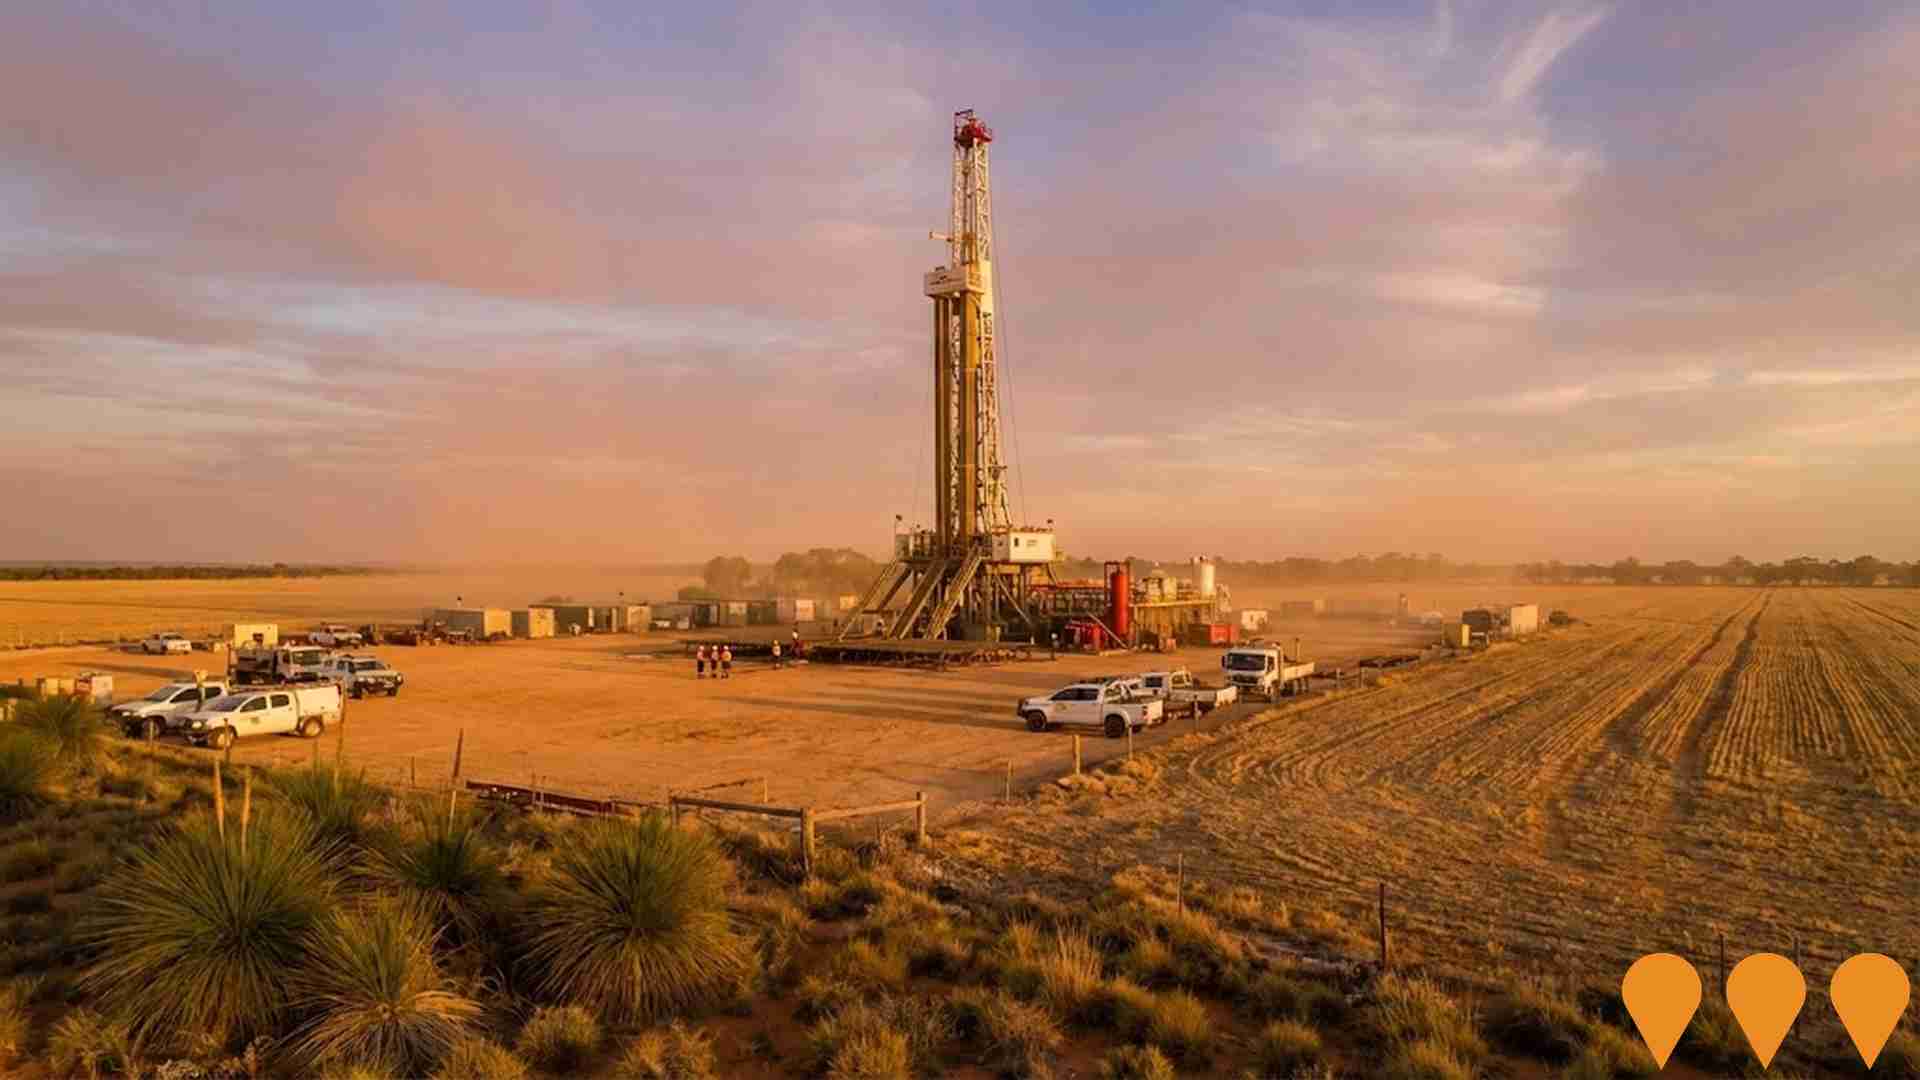
Waitsia Gas Project Stage 2
Further development of the Waitsia onshore gas field near Dongara (Perth Basin). Stage 2 adds additional production wells and a new Waitsia Gas Plant designed for up to 250 TJ/day, with gas exported via the Dampier to Bunbury Natural Gas Pipeline to the North West Shelf for LNG processing, and later to the WA domestic market. As of mid-2025 the plant is in final commissioning with ongoing delays disclosed by the joint venture; first sustained sales gas is targeted following resolution of quality issues.

Lockyer Conventional Gas Project
Development of a central gas processing facility (CPF) by Mineral Resources with a nominal production capacity of 250 terajoules per day, associated pipelines, and up to six natural gas production wellheads. The project aims to supply the WA domestic gas market and potentially LNG export. Located in Petroleum Exploration Permits EP 368 and 426 in the onshore Perth Basin, the facility will collect natural gas from conventional wells and transport via gas gathering lines to a central processing facility. Processed gas will then be transported via an export pipeline to the Dampier to Bunbury Natural Gas Pipeline. The proposal is currently under assessment by the EPA and involves clearing up to 6.2 hectares of native vegetation within a 304.5 ha Development Envelope.
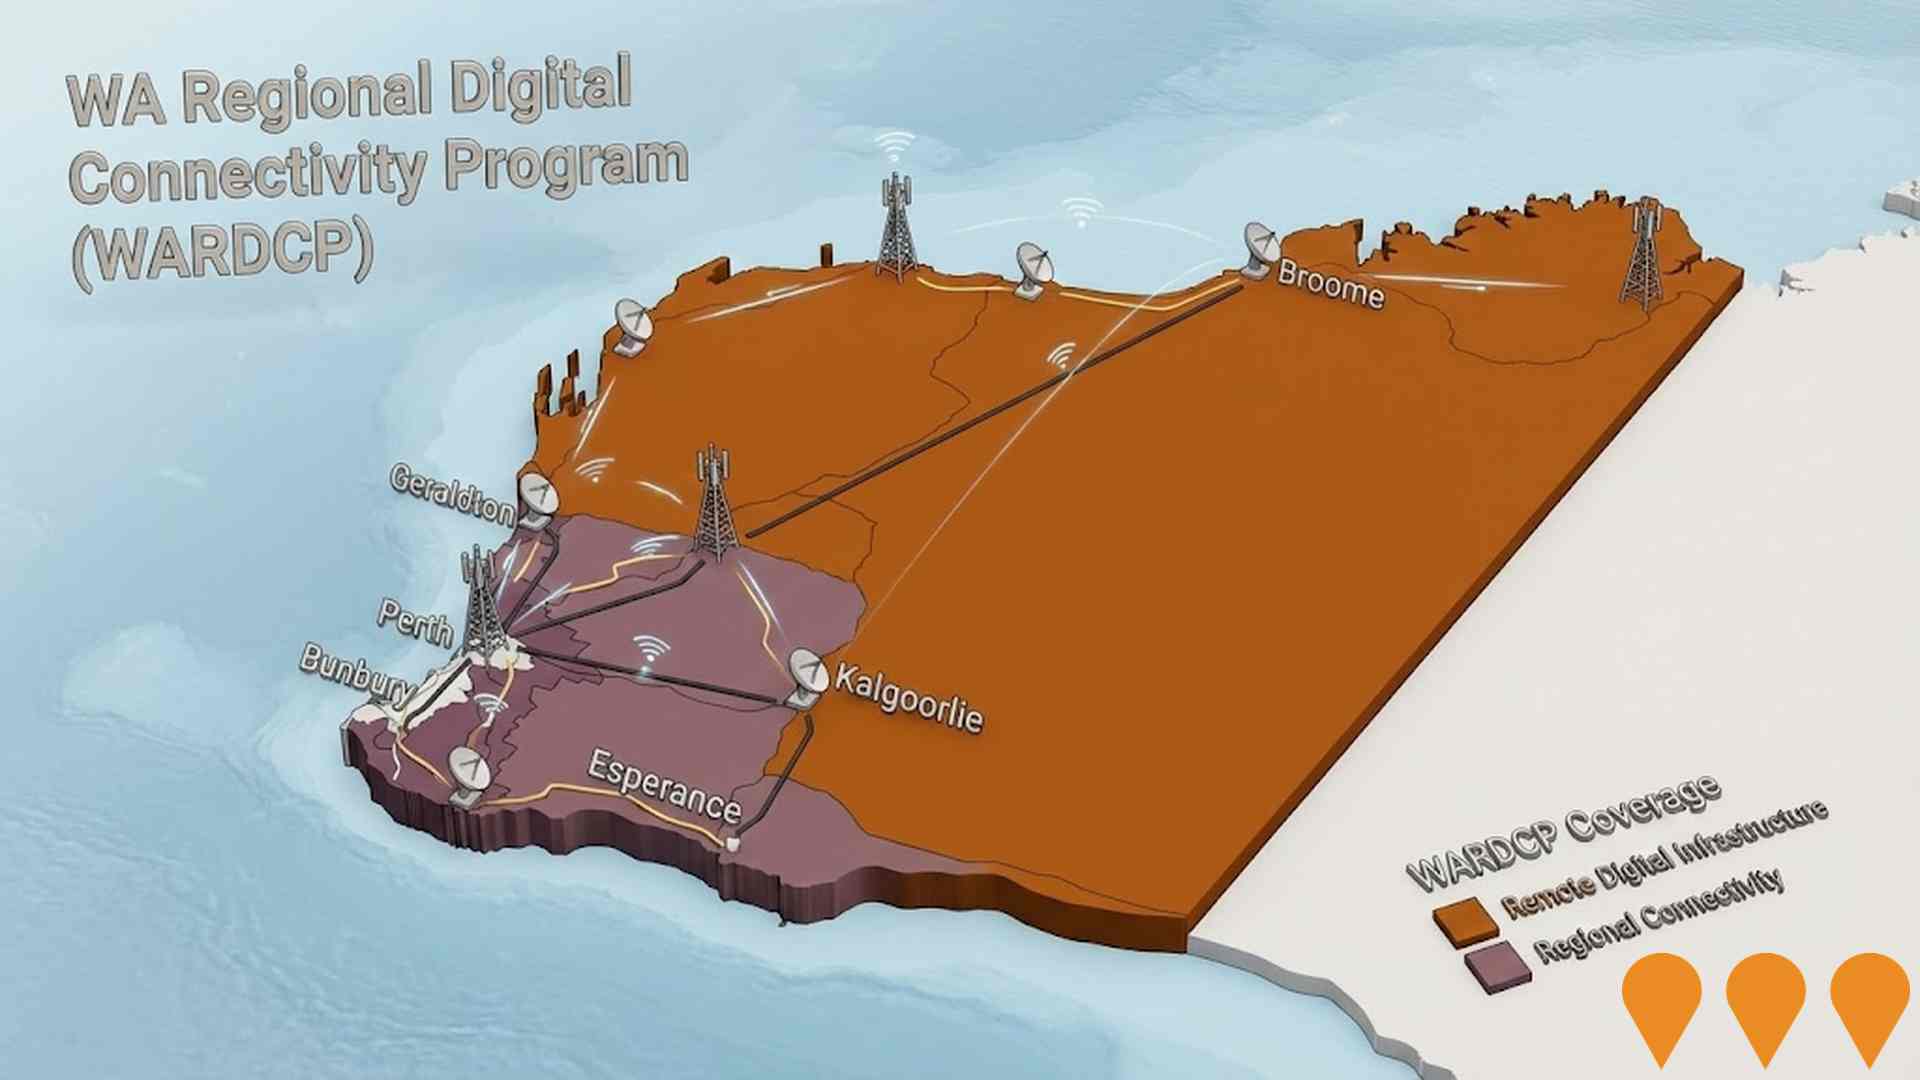
WA Regional Digital Connectivity Program (WARDCP)
Statewide co-investment program delivering new and upgraded mobile, fixed wireless and broadband infrastructure to improve reliability, coverage and performance for regional and remote Western Australia. Current workstreams include the Regional Telecommunications Project, State Agriculture Telecommunications Infrastructure Fund, and the WA Regional Digital Connectivity Program (WARDCP).
Newman Airport Terminal Expansion
Expansion of Newman Airport terminal facilities to accommodate increased passenger traffic and improved services for the mining industry and tourism.
Newman Waste Management Facility
New waste management and recycling facility to serve Newman and surrounding communities with modern waste processing and environmental protection measures.
Goldfields Highway Upgrade (Wiluna to Meekatharra)
Progressive upgrade and sealing of the Goldfields Highway between Wiluna and Meekatharra to improve transport efficiency, safety, and connectivity for the mining and pastoral industries. The project is being delivered in packages, with several sections already completed and others in development.
Yeelirrie Uranium Project
The Yeelirrie project is one of Australia's largest undeveloped uranium deposits. It has received state and federal environmental approvals. However, the project's progression is contingent on improved uranium market conditions. Cameco has requested an extension to the state-level environmental approvals.
Employment
Employment conditions in Meekatharra face significant challenges, ranking among the bottom 10% of areas assessed nationally
Meekatharra has a skilled workforce with strong representation in manufacturing and industrial sectors. The unemployment rate was 8.0% as of September 2025.
There were 1,735 residents employed while the unemployment rate was 4.7% higher than Rest of WA's rate of 3.3%. Workforce participation lagged significantly at 45.5%, compared to Rest of WA's 59.4%. Leading employment industries among residents comprised mining, public administration & safety, and education & training. Mining had notably high concentration with employment levels at 2.9 times the regional average.
Conversely, health care & social assistance showed lower representation at 5.5% versus the regional average of 11.9%. There were 1.5 workers for every resident as per the Census, indicating Meekatharra functions as an employment hub hosting more jobs than residents and attracting workers from surrounding areas. Between September 2024 and September 2025, labour force remained stable by 0.0% while employment declined by 1.1%, resulting in a rise of 1.0 percentage points in the unemployment rate. By comparison, Rest of WA recorded employment growth of 1.4% and labour force growth of 1.2%, with unemployment falling by 0.2 percentage points. Jobs and Skills Australia's national employment forecasts from May-25 suggest potential future demand within Meekatharra. These projections estimate national employment to expand by 6.6% over five years and 13.7% over ten years, with varying growth rates between industry sectors. Applying these projections to Meekatharra's employment mix suggests local employment should increase by 4.3% over five years and 10.5% over ten years.
Frequently Asked Questions - Employment
Income
Income figures position the area below 75% of locations analysed nationally by AreaSearch
AreaSearch's latest postcode level ATO data for financial year 2022 shows Meekatharra SA2 had a median income among taxpayers of $50,577 and an average of $63,545. This is slightly below the national average. The Rest of WA had a median income of $57,323 and an average of $71,163 during the same period. Based on Wage Price Index growth of 14.2% since financial year 2022, current estimates for Meekatharra SA2 would be approximately $57,759 (median) and $72,568 (average) as of September 2025. The 2021 Census data indicates individual earnings at the 80th percentile nationally were $1,024 weekly, while household income ranked at the 13th percentile. Income brackets show that 28.7% of Meekatharra SA2's population (962 individuals) fall within the $1,500 - $2,999 income range, reflecting a pattern seen in the broader area where 31.1% similarly occupy this range. Housing costs are modest with 93.7% of income retained, but total disposable income ranks at just the 23rd percentile nationally.
Frequently Asked Questions - Income
Housing
Meekatharra is characterized by a predominantly suburban housing profile, with above-average rates of outright home ownership
In Meekatharra, as per the latest Census, 86.8% of dwellings were houses while 13.2% comprised semi-detached homes, apartments, and other types. This is similar to Non-Metro WA's distribution of 87.5% houses and 12.5% other dwellings. Home ownership in Meekatharra stood at 38.4%, with mortgaged properties at 7.8% and rented ones at 53.9%. The median monthly mortgage repayment was $650, lower than Non-Metro WA's average of $1,517. Weekly rent in Meekatharra was recorded at $120, compared to Non-Metro WA's $250. Nationally, Meekatharra's mortgage repayments were significantly lower than the Australian average of $1,863, and rents were substantially below the national figure of $375.
Frequently Asked Questions - Housing
Household Composition
Meekatharra features high concentrations of lone person households and group households, with a lower-than-average median household size
Family households compose 56.6% of all households, including 13.5% couples with children, 27.2% couples without children, and 13.2% single parent families. Non-family households constitute the remaining 43.4%, with lone person households at 39.6% and group households comprising 4.4%. The median household size is 2.2 people, which is smaller than the Rest of WA average of 2.4.
Frequently Asked Questions - Households
Local Schools & Education
Meekatharra faces educational challenges, with performance metrics placing it in the bottom quartile of areas assessed nationally
The area's university qualification rate is 17.7%, significantly lower than the Australian average of 30.4%. This disparity presents both a challenge and an opportunity for targeted educational initiatives. Bachelor degrees are most prevalent at 13.0%, followed by postgraduate qualifications (3.4%) and graduate diplomas (1.3%). Vocational credentials are prominent, with 48.2% of residents aged 15+ holding such qualifications - advanced diplomas at 9.3% and certificates at 38.9%.
Educational participation is high, with 41.5% of residents currently enrolled in formal education. This includes 18.1% in primary education, 10.6% in secondary education, and 4.1% pursuing tertiary education.
Frequently Asked Questions - Education
Schools Detail
Nearby Services & Amenities
Transport
Transport servicing is very low compared to other areas nationally based on assessment of service frequency, route connectivity and accessibility
Meekatharra has ten active public transport stops, all of which are bus stops. These stops are served by one route in total, offering four weekly passenger trips combined. Transport accessibility is limited, with residents on average 58621 meters away from the nearest stop.
Service frequency averages zero trips per day across all routes, resulting in approximately zero weekly trips per individual stop.
Frequently Asked Questions - Transport
Transport Stops Detail
Health
Health outcomes in Meekatharra are marginally below the national average with common health conditions slightly more prevalent than average across both younger and older age cohorts
Meekatharra shows below-average health indicators with common conditions more prevalent than average across both younger and older age groups. Private health cover rate is approximately 51% (around 1,716 people), compared to 53.7% across Rest of WA.
Diabetes and mental health issues are the most common medical conditions, affecting 7.9 and 6.3% respectively. About 71.9% of residents report no medical ailments, compared to 66.8% in Rest of WA. The area has 12.6% (422 people) aged 65 and over, lower than the 18.3% in Rest of WA. Health outcomes among seniors are above average, outperforming the general population in health metrics.
Frequently Asked Questions - Health
Cultural Diversity
The level of cultural diversity witnessed in Meekatharra was found to be slightly above average when compared nationally for a number of language and cultural background related metrics
Meekatharra, surveyed in 2016, had a cultural diversity index higher than average, with 21.1% of its residents born overseas and 17.5% speaking a language other than English at home. Christianity was the predominant religion, accounting for 44.9% of the population. Notably, the 'Other' religious category comprised 1.1%, compared to the regional average of 0.5%.
In terms of ancestry, the top three groups were English (24.2%), Australian Aboriginal (24.0%), and Australian (21.0%). These percentages differed significantly from the regional averages of 30.7% for English, 6.9% for Australian Aboriginal, and 30.2% for Australian. Specifically, Maori (1.1%) and Welsh (0.7%) were overrepresented compared to their regional averages of 0.7% and 0.5%, respectively. French ancestry was also notably higher at 0.6%.
Frequently Asked Questions - Diversity
Age
Meekatharra's population is slightly younger than the national pattern
Meekatharra's median age is 37, which is lower than the Rest of WA figure of 40, but nearly matches Australia's median age of 38 years. The 25-34 cohort is notably over-represented in Meekatharra at 21.4%, compared to the Rest of WA average, while the 5-14 year-olds are under-represented at 8.2%. This concentration of the 25-34 age group is well above the national figure of 14.5%. Between 2021 and present, the 35 to 44 age group has grown from 14.3% to 16.3%, while the 25 to 34 cohort increased from 19.7% to 21.4%. Conversely, the 65 to 74 cohort has declined from 9.4% to 8.1%, and the 45 to 54 age group dropped from 14.6% to 13.4%. Demographic modeling indicates Meekatharra's age profile will significantly evolve by 2041. The 35 to 44 age cohort is projected to expand notably, increasing by 234 people (43%) from 547 to 782. Conversely, both the 75 to 84 and 55 to 64 age groups are expected to see reduced numbers.
