Chart Color Schemes
This analysis uses ABS Statistical Areas Level 2 (SA2) boundaries, which can materially differ from Suburbs and Localities (SAL) even when sharing similar names.
SA2 boundaries are defined by the Australian Bureau of Statistics and are designed to represent communities for statistical reporting (e.g., census and ERP).
Suburbs and Localities (SAL) represent commonly-used suburb/locality names (postal-style areas) and may use different geographic boundaries. For comprehensive analysis, consider reviewing both boundary types if available.
est. as @ -- *
ABS ERP | -- people | --
2021 Census | -- people
Sales Activity
Curious about local property values? Filter the chart to assess the volume and appreciation (including resales) trends and regional comparisons, or scroll to the map below view this information at an individual property level.
Find a Recent Sale
Sales Detail
Population
Northampton - Mullewa - Greenough has shown very soft population growth performance across periods assessed by AreaSearch
Northampton-Mullewa-Greenough's population is around 5,905 as of Nov 2025. This reflects an increase from the 2021 Census figure of 5,679 people, a growth of 226 individuals (4.0%). The change is inferred from ABS estimated resident population figures: 5,862 in June 2024 and an additional 44 validated new addresses since the Census date. This results in a population density ratio of 0.20 persons per square kilometer. Overseas migration contributed approximately 77.4% to recent population gains.
AreaSearch uses ABS/Geoscience Australia projections for each SA2 area, released in 2024 with a base year of 2022. For areas not covered by this data and post-2032 growth estimation, AreaSearch utilises ABS Greater Capital Region projections from 2023 based on 2022 data. Future demographic trends suggest the area will increase by approximately 296 persons to reach 2041, reflecting a total gain of 4.3% over the 17 years.
Frequently Asked Questions - Population
Development
AreaSearch analysis of residential development drivers sees Northampton - Mullewa - Greenough recording a relatively average level of approval activity when compared to local markets analysed countrywide
Northampton - Mullewa - Greenough has approved approximately 42 residential properties annually. Between financial years FY-21 and FY-25, around 213 homes were granted approval, with an additional 18 approved so far in FY-26. Over these five years, the average number of new residents per year was zero for each new home approved.
This indicates that supply is meeting or exceeding demand, offering greater buyer choice and potential population growth above projections. The average construction value of new properties during this period was $246,000, which is below regional levels, suggesting more affordable housing options for buyers. In FY-26, $9.5 million worth of commercial development approvals have been recorded, indicating balanced commercial development activity in the area compared to the rest of WA. Northampton - Mullewa - Greenough has seen 72.0% more construction activity per person than the rest of WA, providing greater choice for buyers.
Recent building activity consists solely of standalone homes, preserving the low-density nature of the location and attracting space-seeking buyers. There are approximately 154 people per dwelling approval in the area, further indicating a low-density market. According to the latest AreaSearch quarterly estimate, Northampton - Mullewa - Greenough is projected to add 253 residents by 2041. With current construction levels, housing supply should adequately meet demand, creating favourable conditions for buyers while potentially enabling growth that exceeds current forecasts.
Frequently Asked Questions - Development
Infrastructure
Northampton - Mullewa - Greenough has limited levels of nearby infrastructure activity, ranking in the 1stth percentile nationally
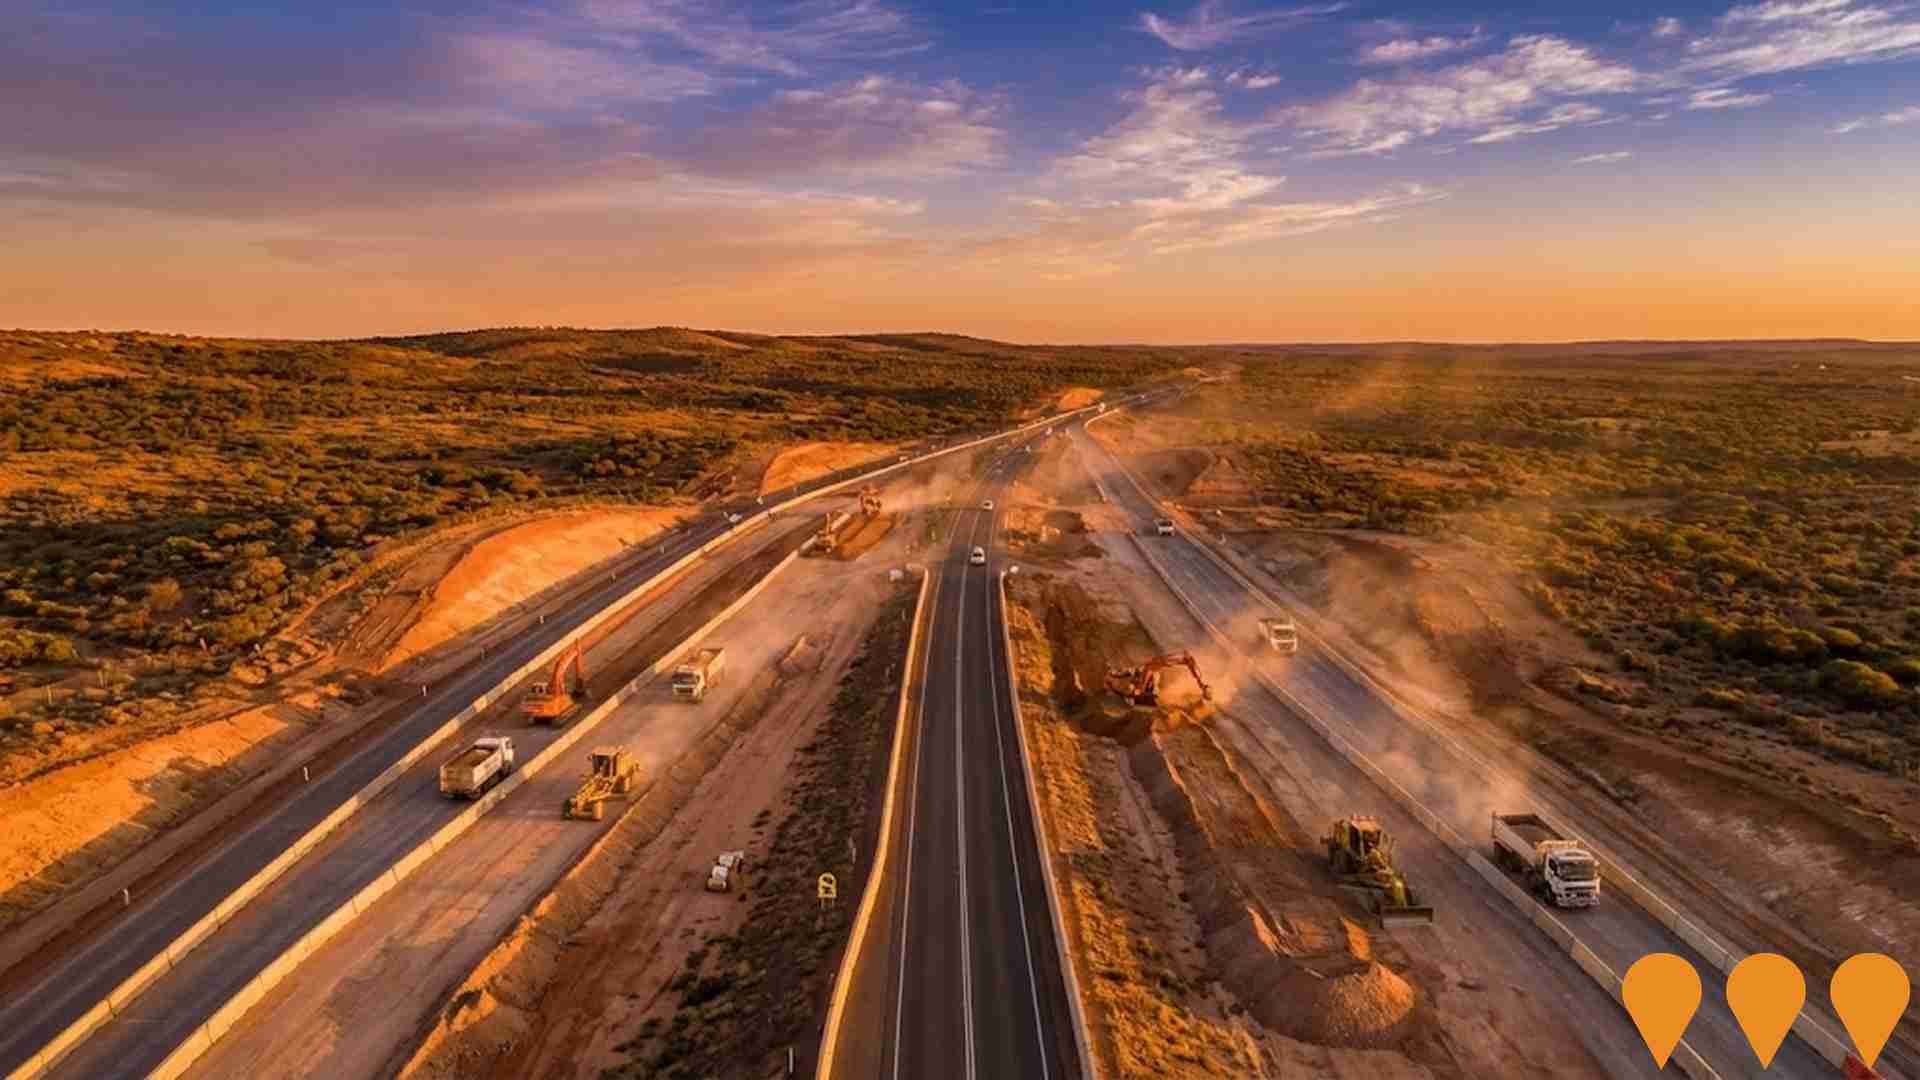
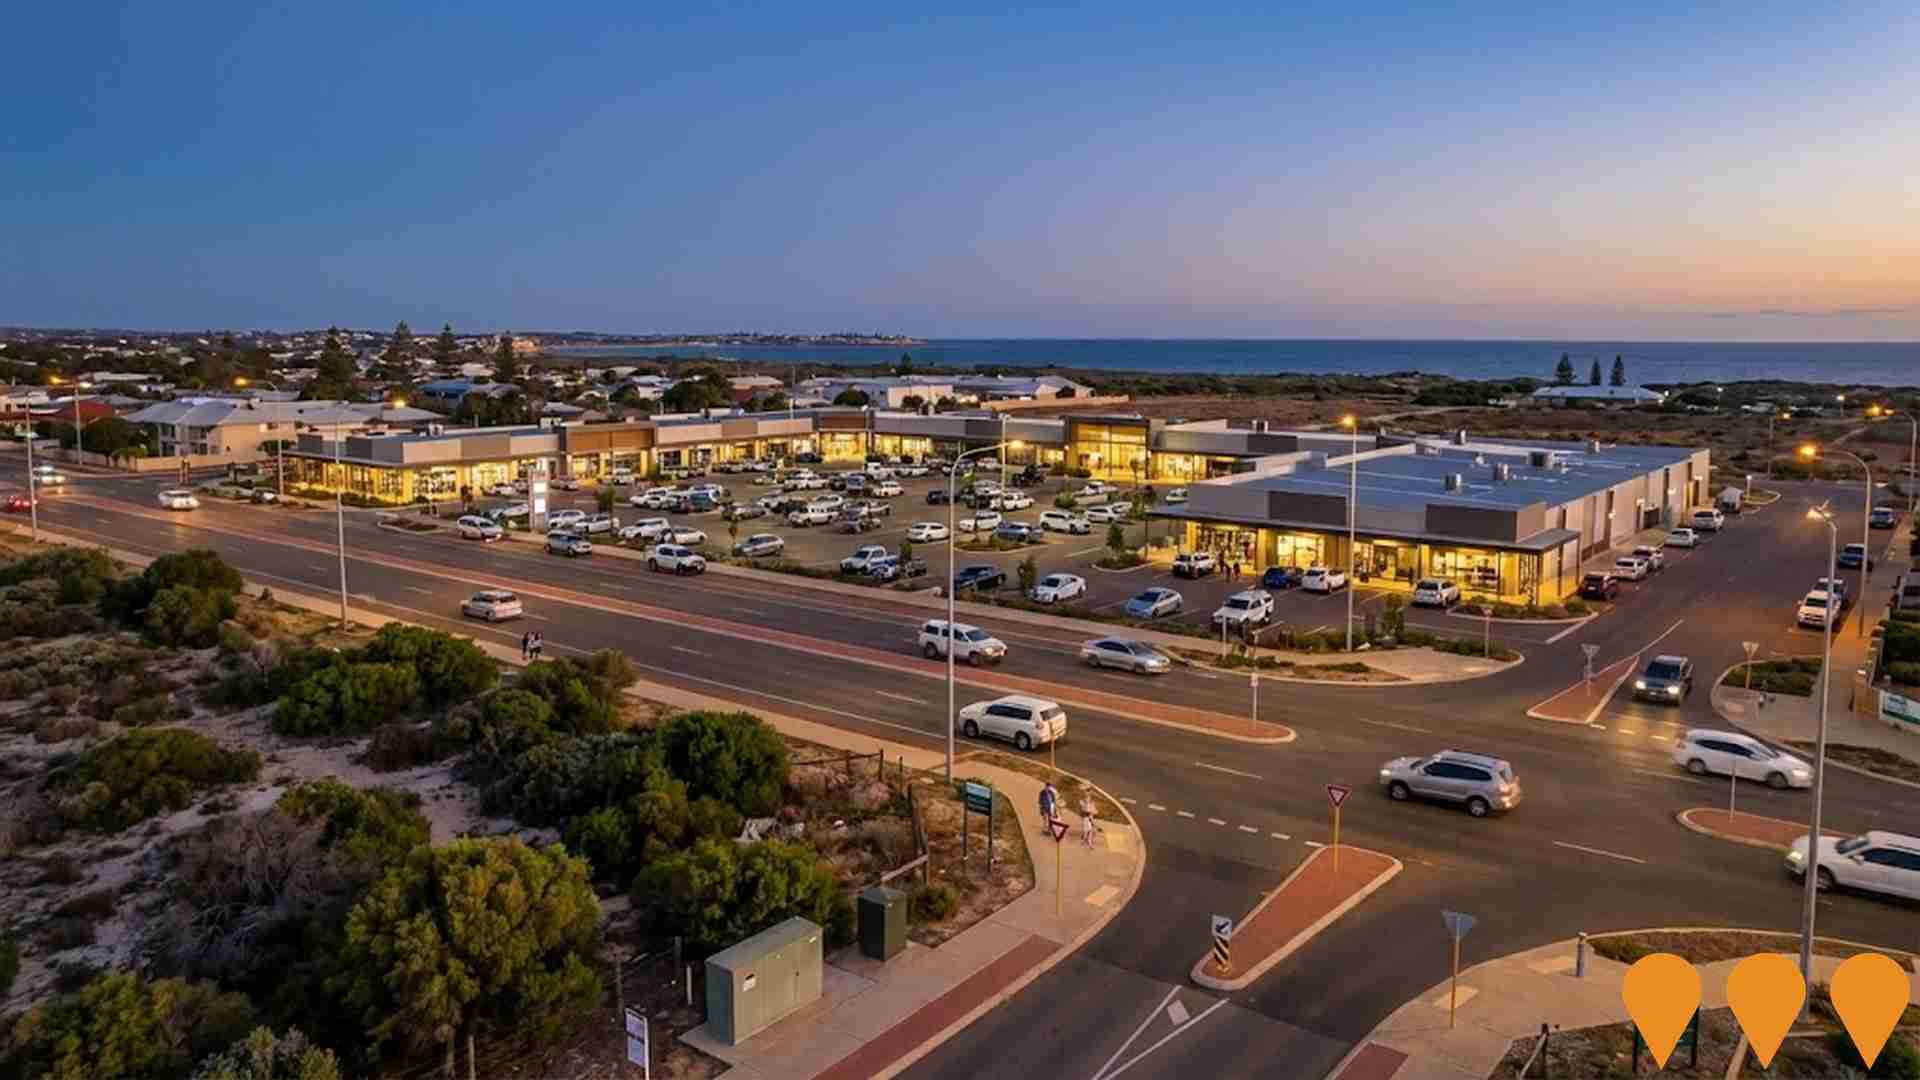
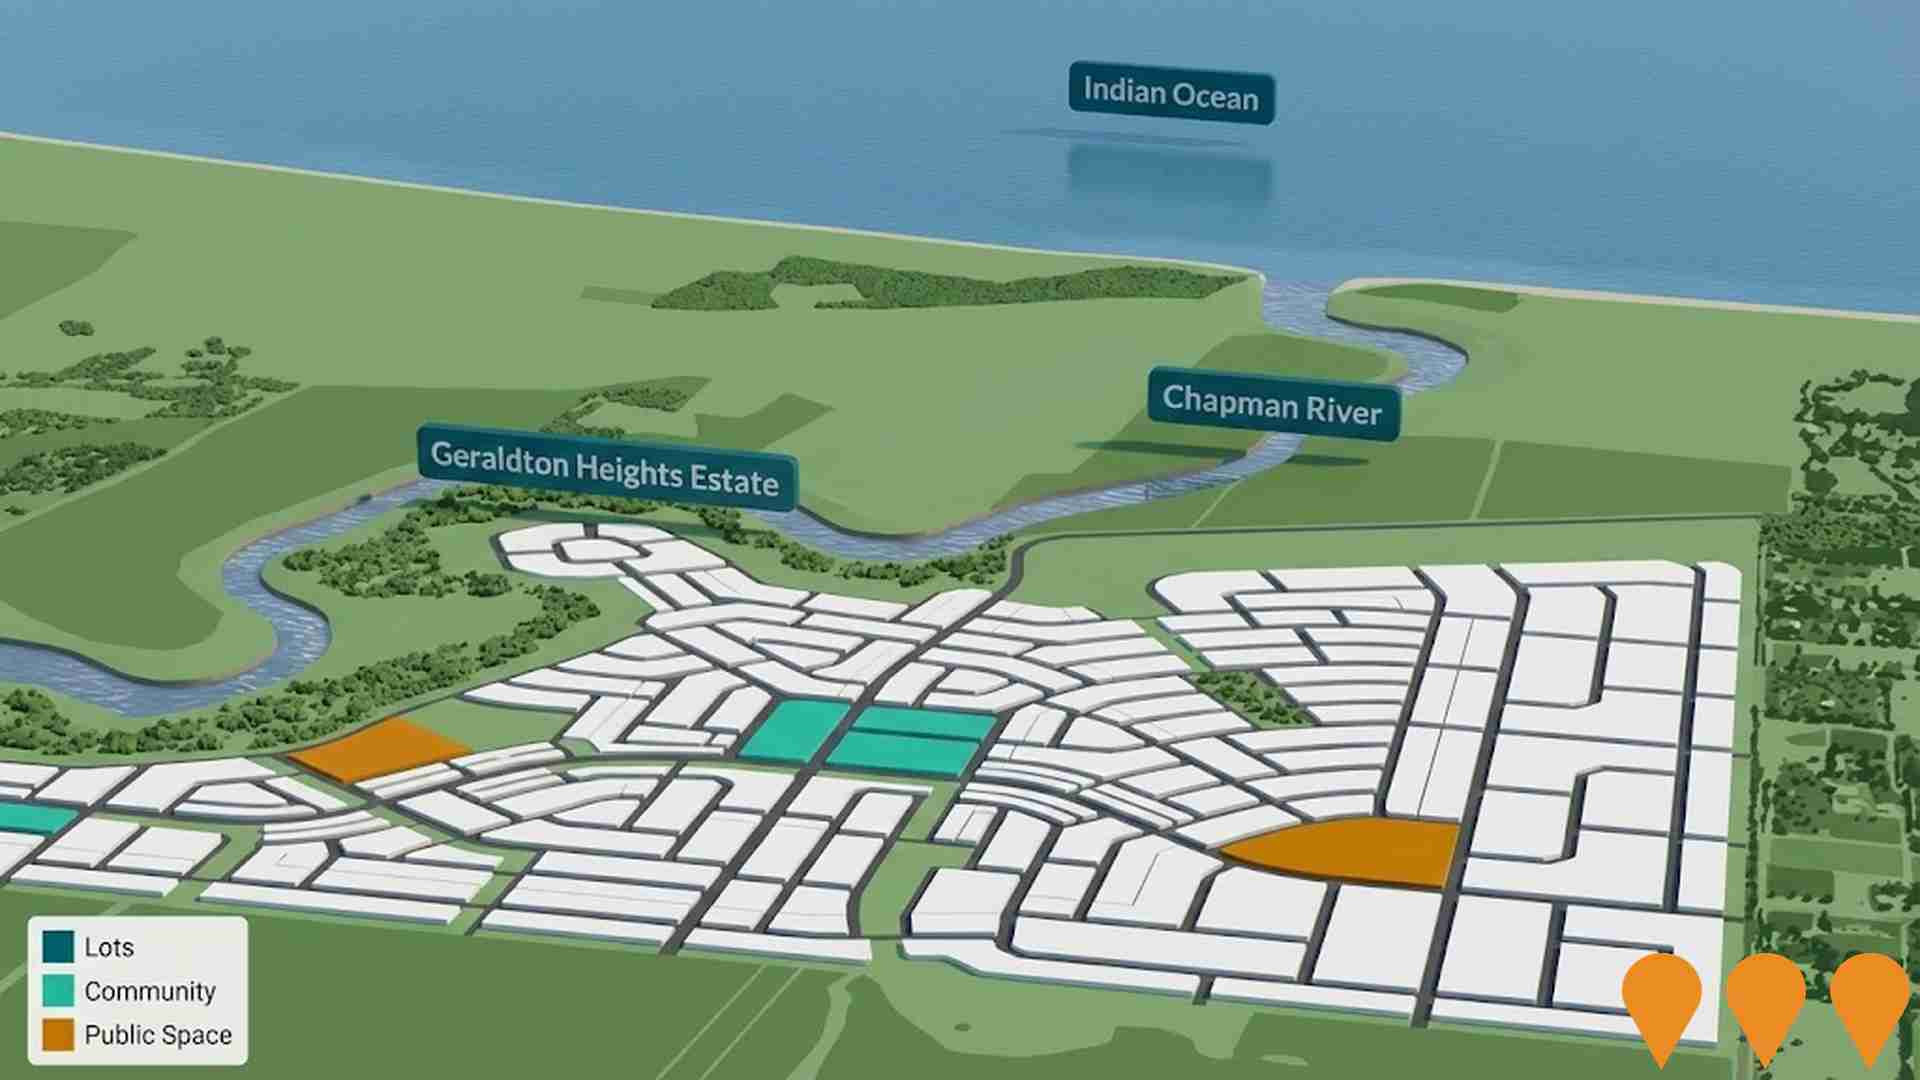
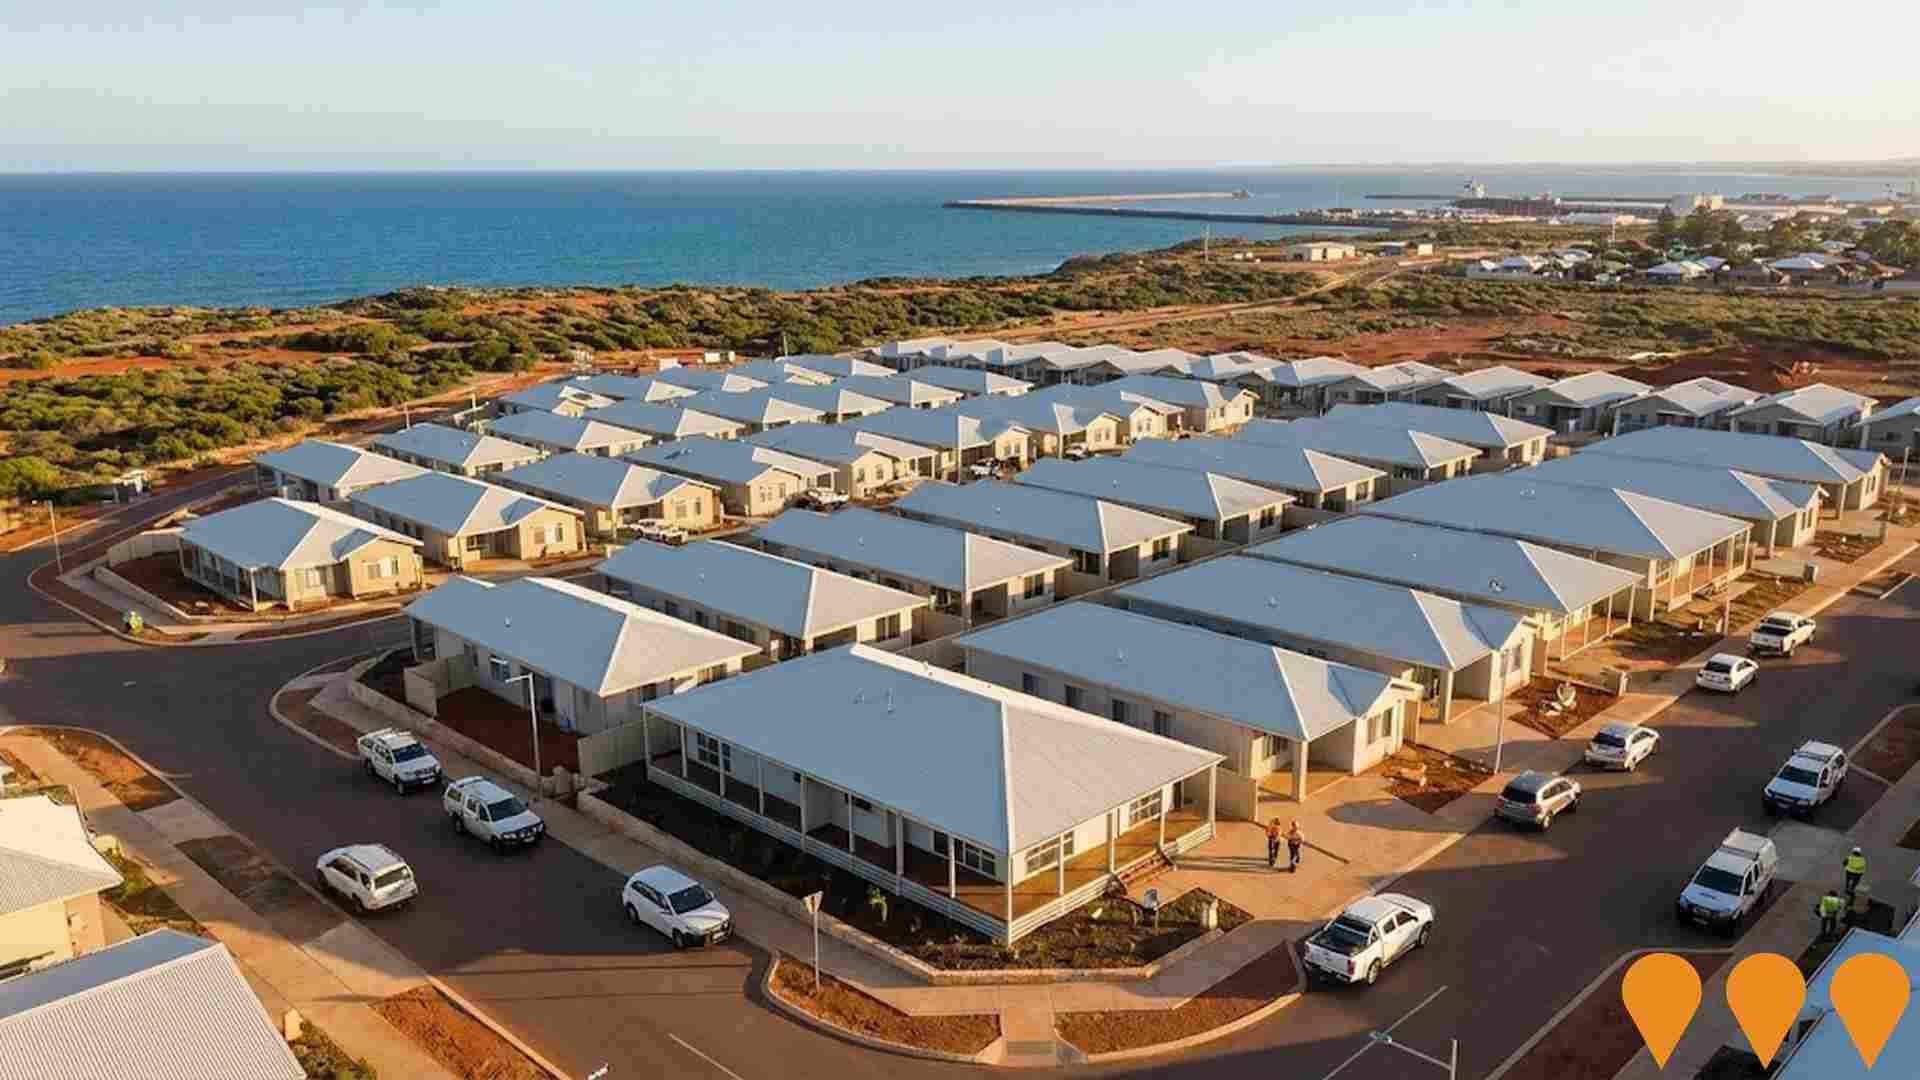
Changes in local infrastructure significantly impact an area's performance. AreaSearch has identified 29 projects likely affecting the region. Notable ones include North West Coastal Highway Upgrades (Oakajee Strategic Industrial Area Access), Proposed Northern Commercial Retail Hub (Lot 55 Chapman Road), Glenfield Commercial Retail Hub, and Geraldton Heights Estate. The following list details those most relevant.
Professional plan users can use the search below to filter and access additional projects.
INFRASTRUCTURE SEARCH
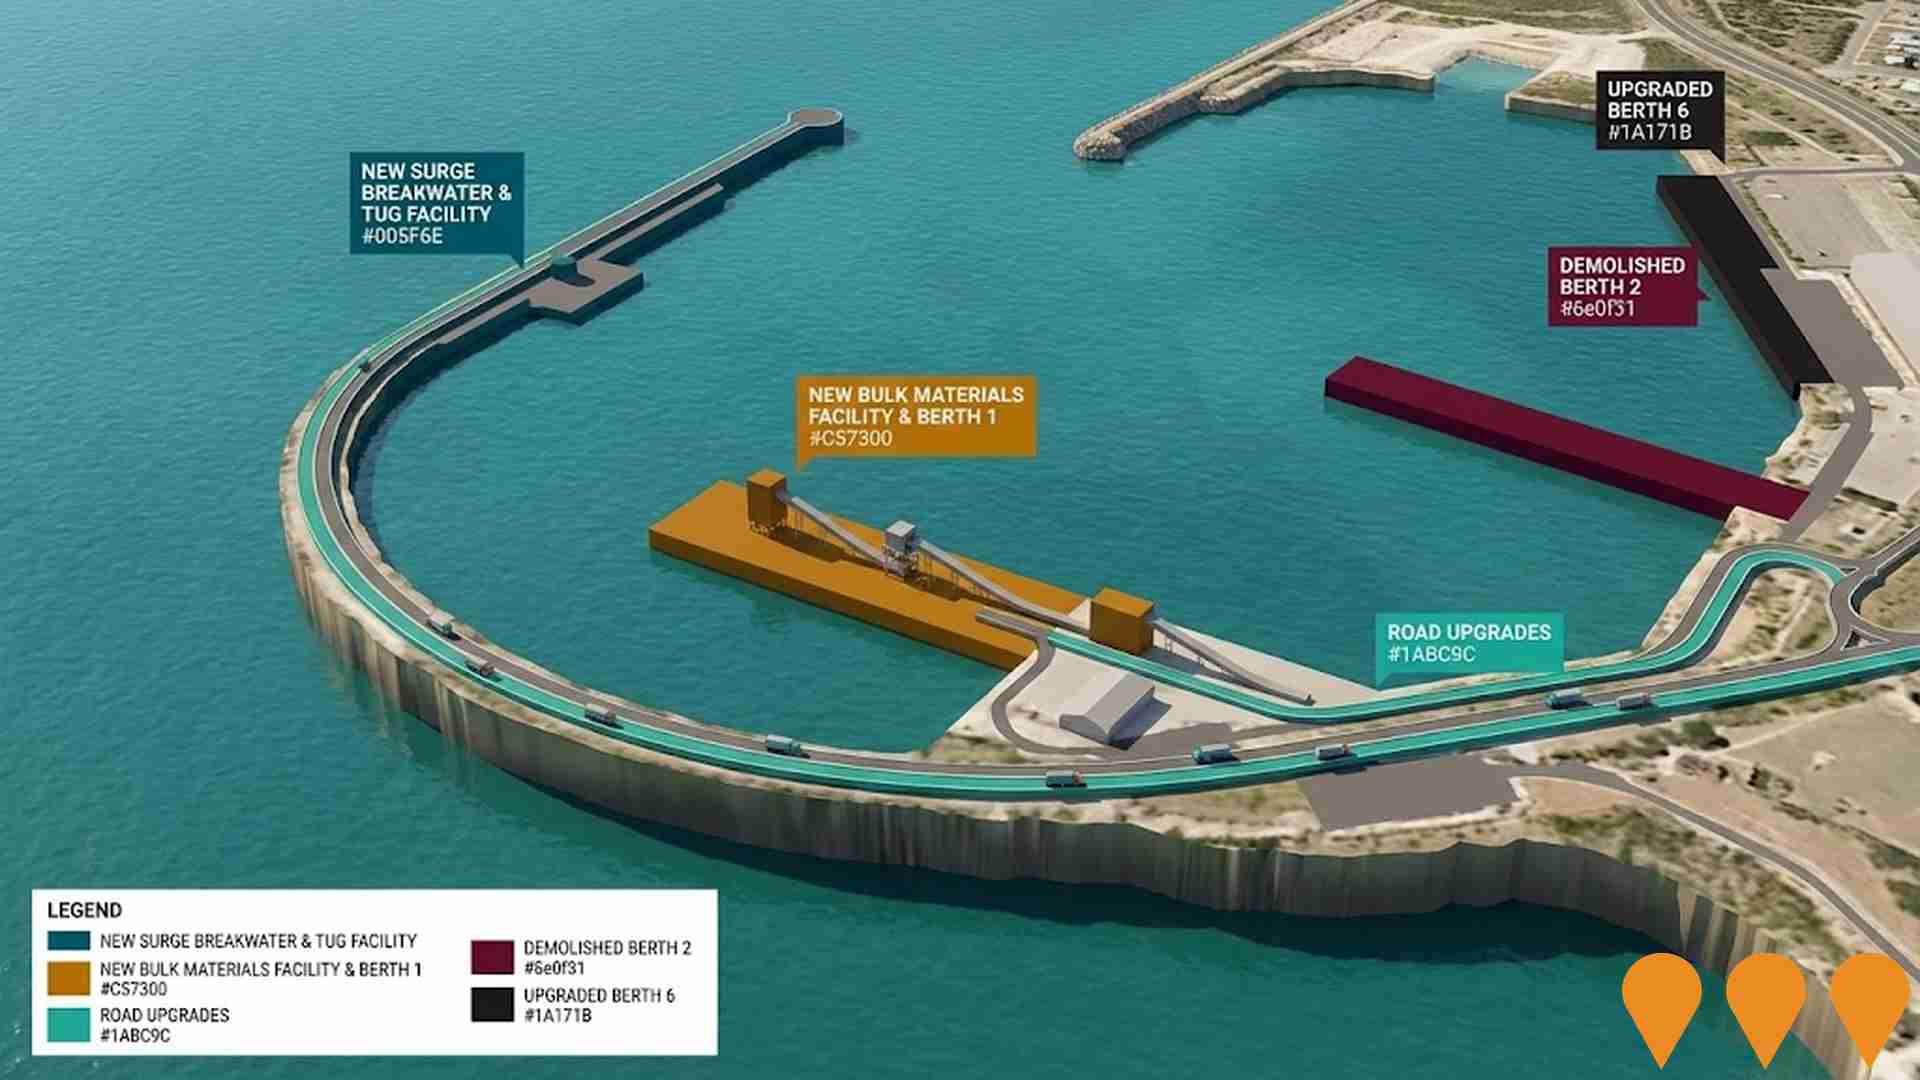
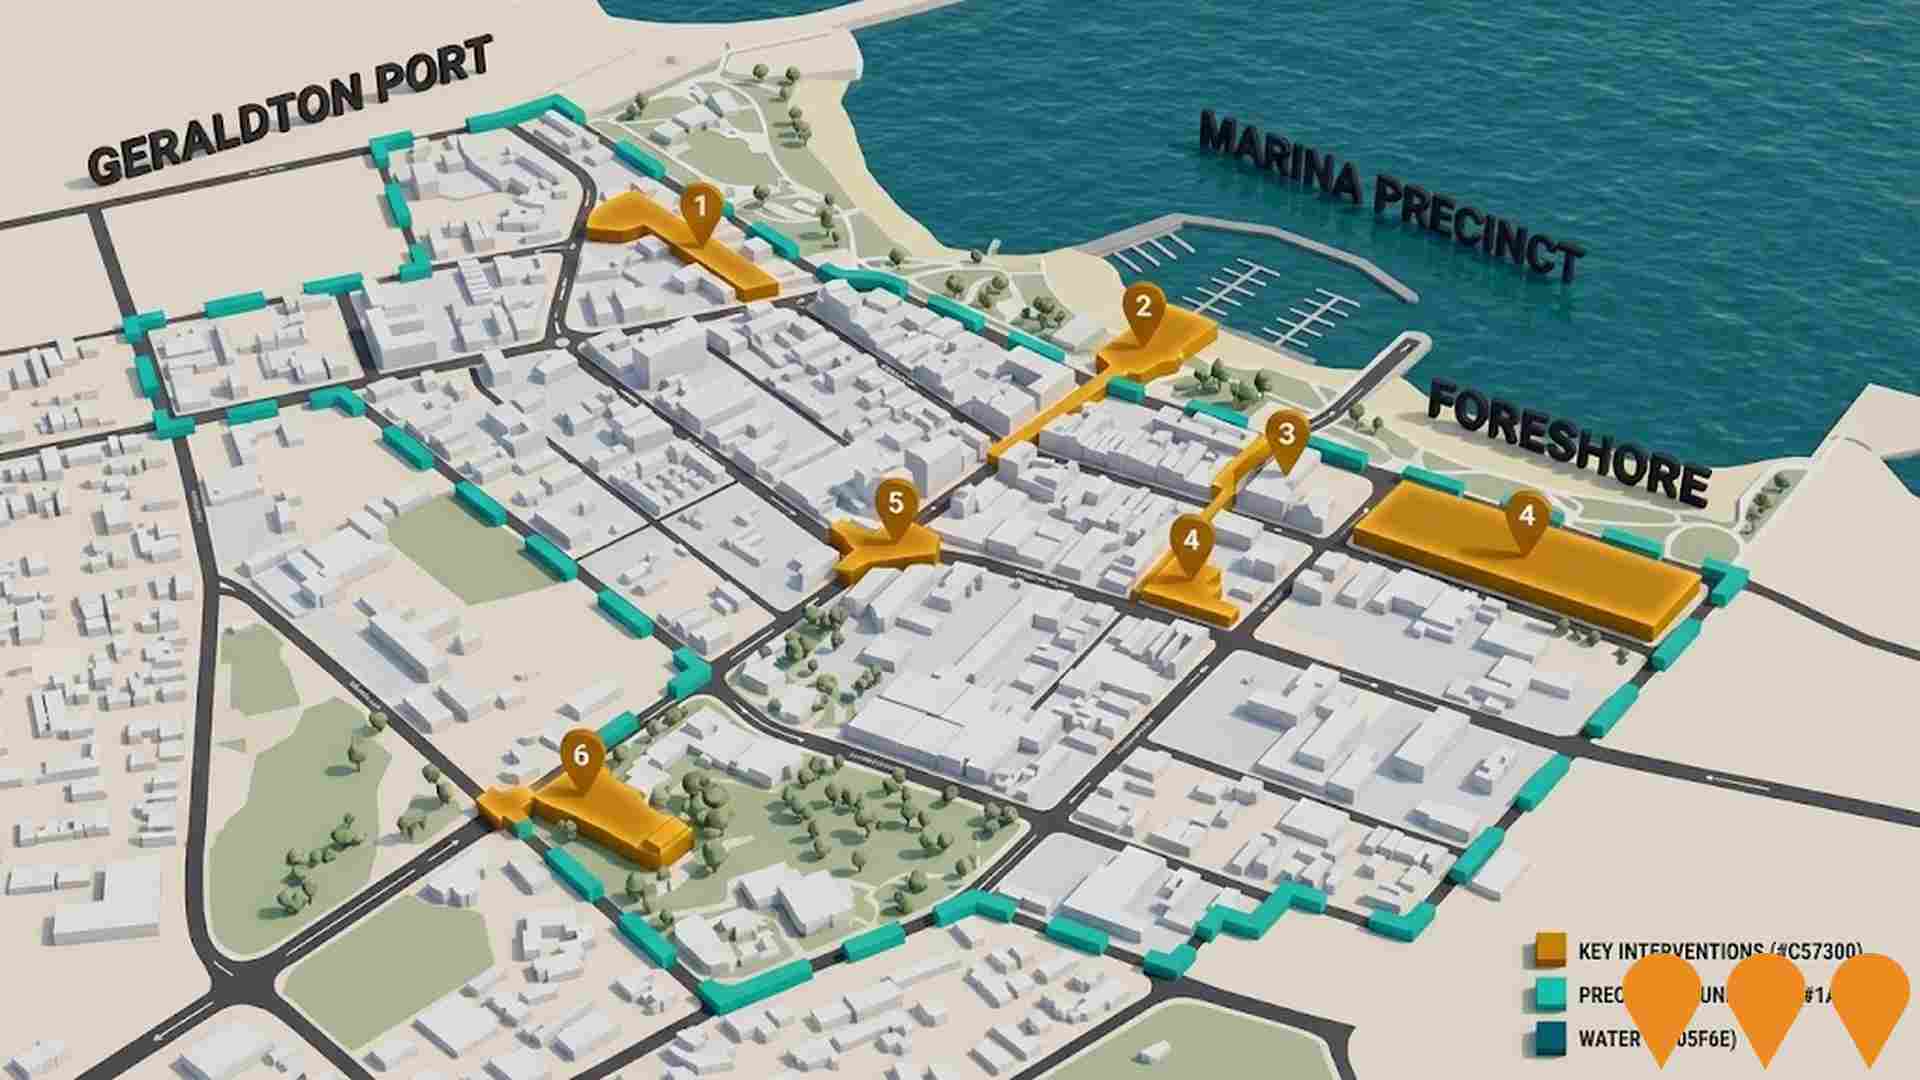
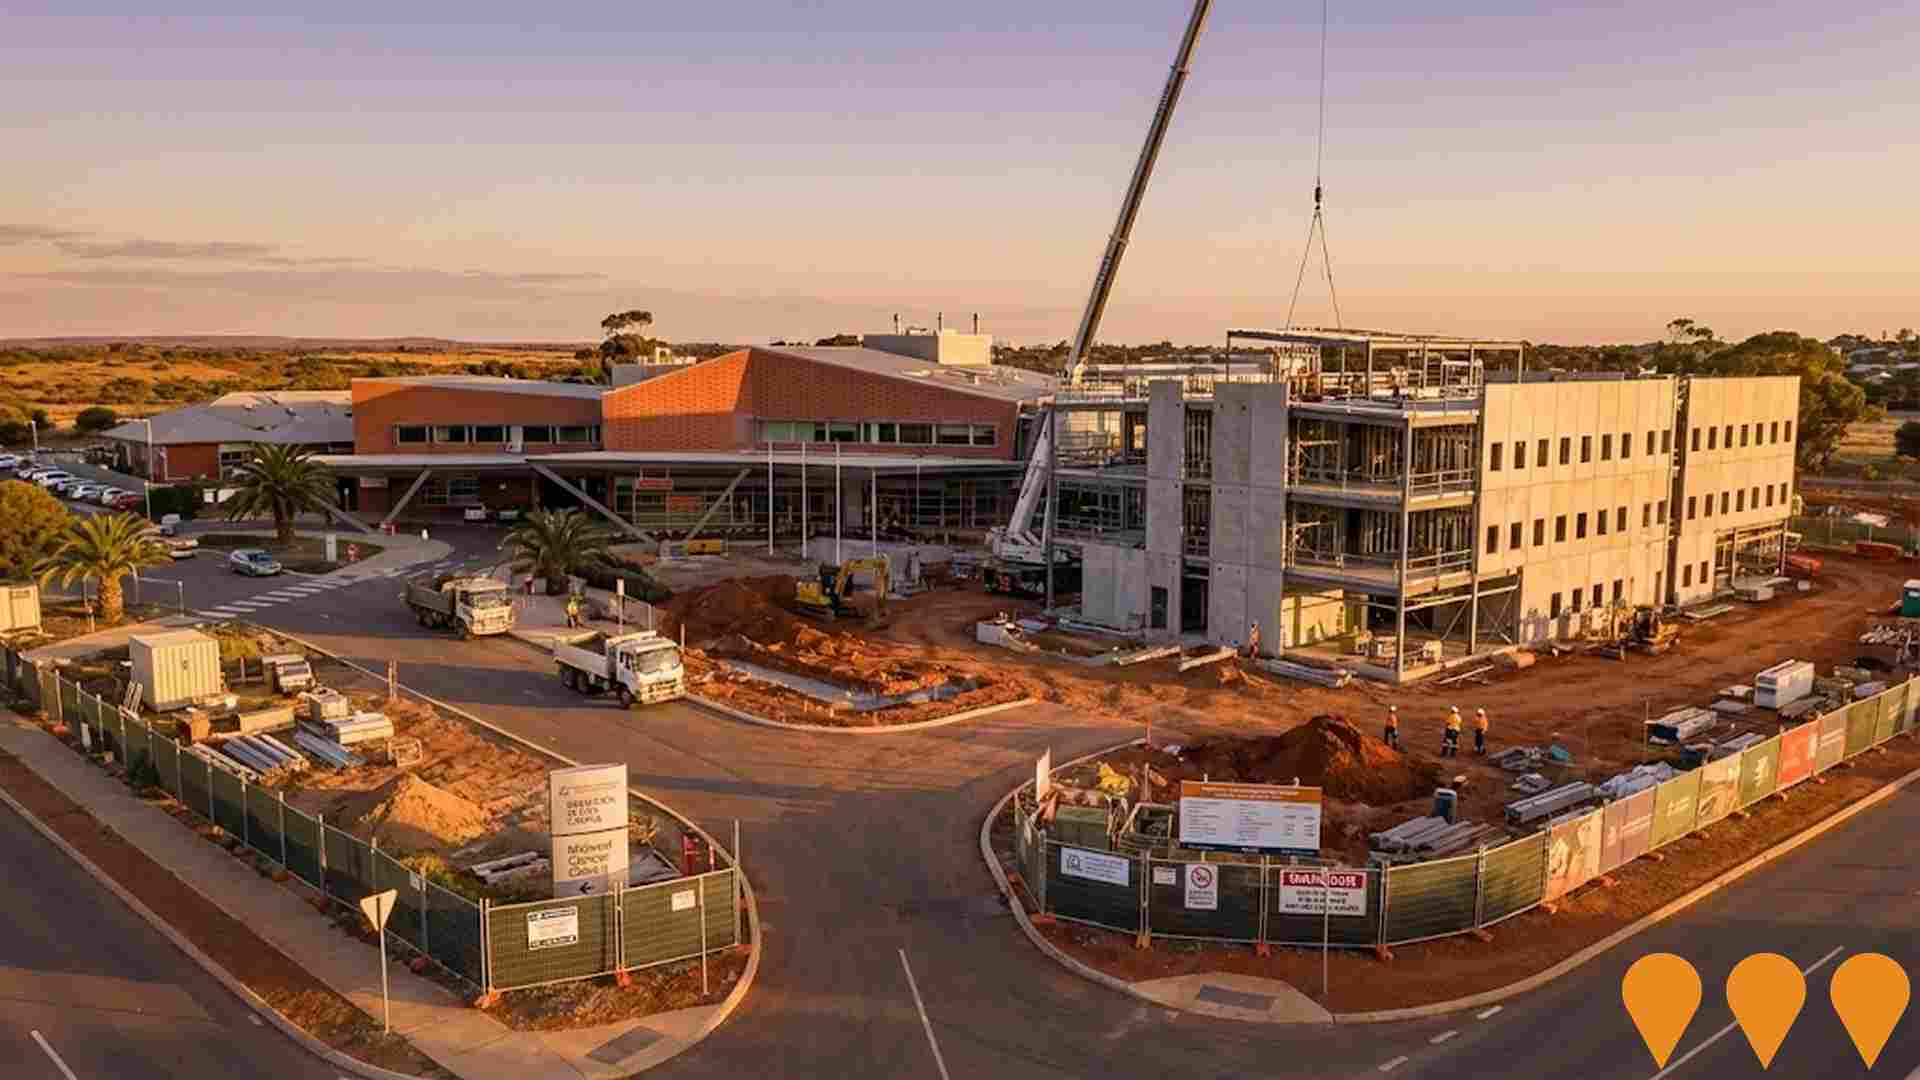
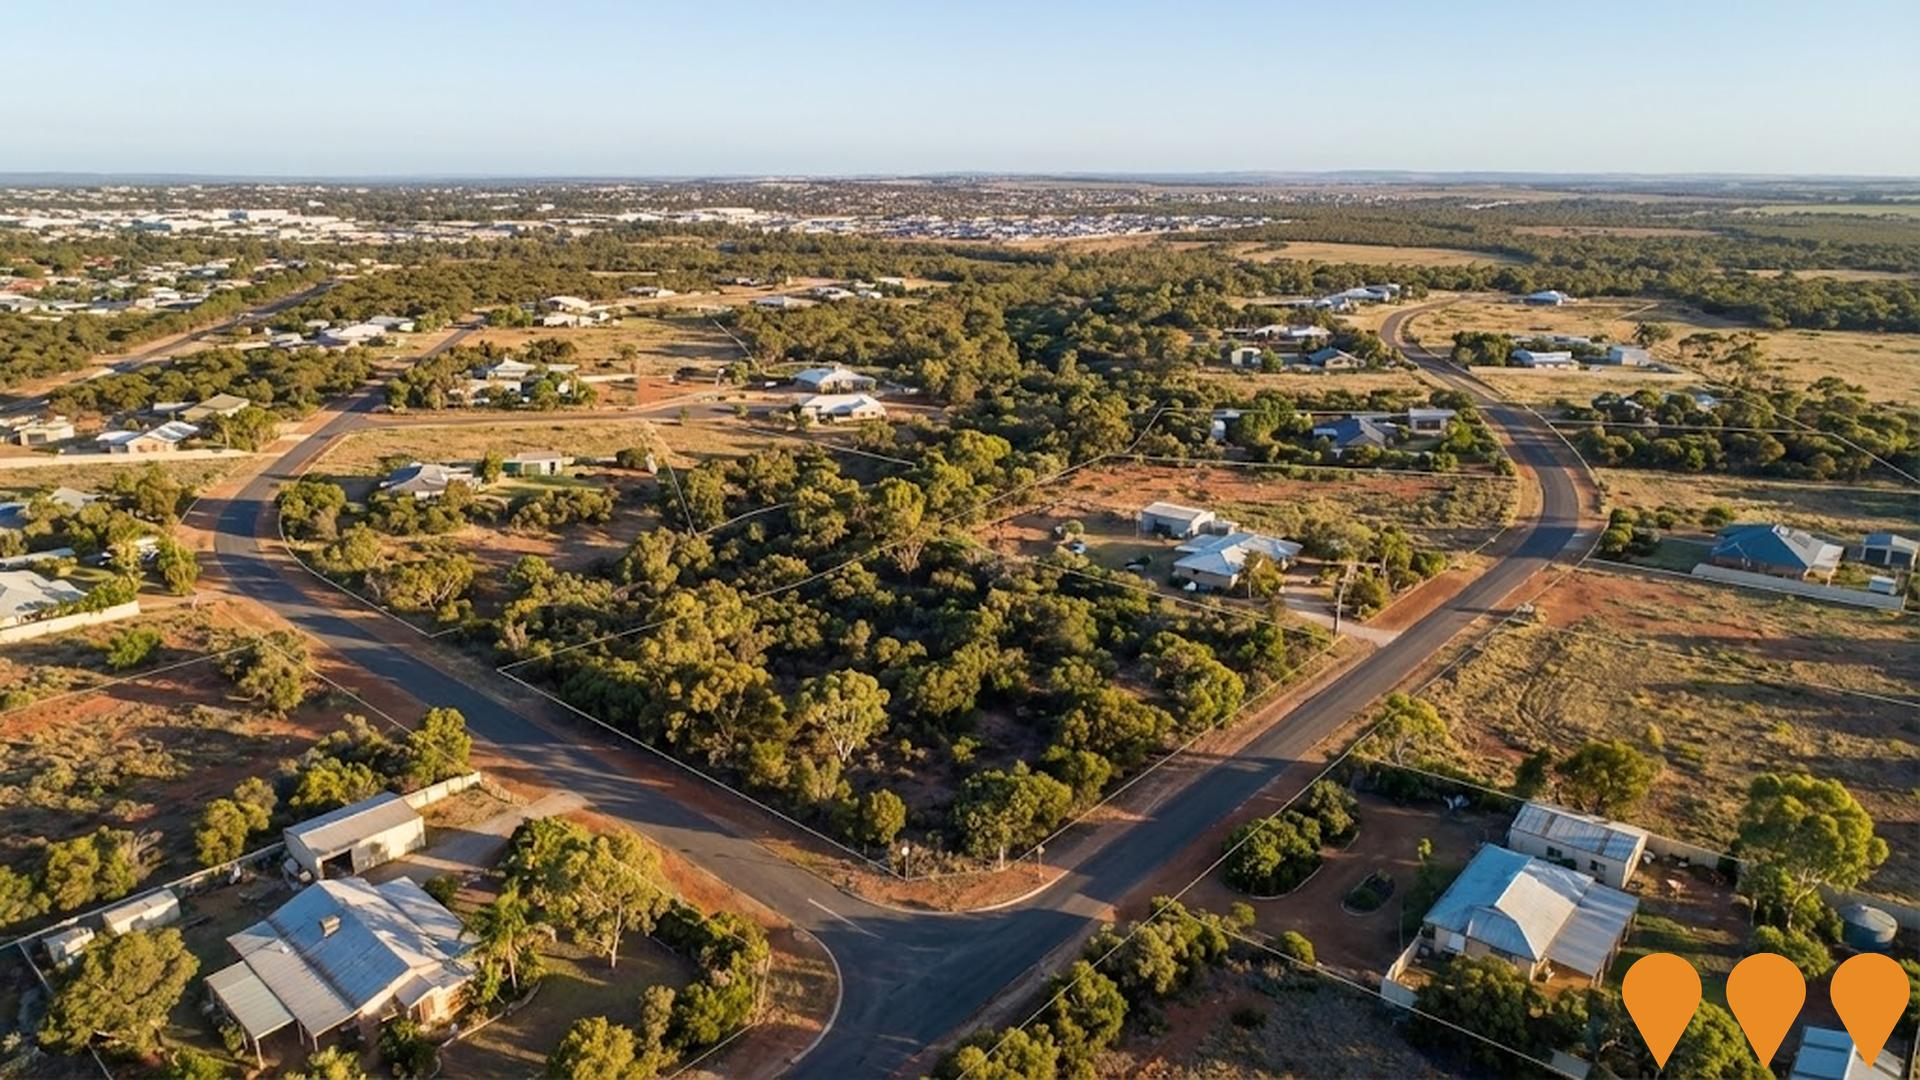
 Denotes AI-based impression for illustrative purposes only, not to be taken as definitive under any circumstances. Please follow links and conduct other investigations from the project's source for actual imagery. Developers and project owners wishing us to use original imagery please Contact Us and we will do so.
Frequently Asked Questions - Infrastructure
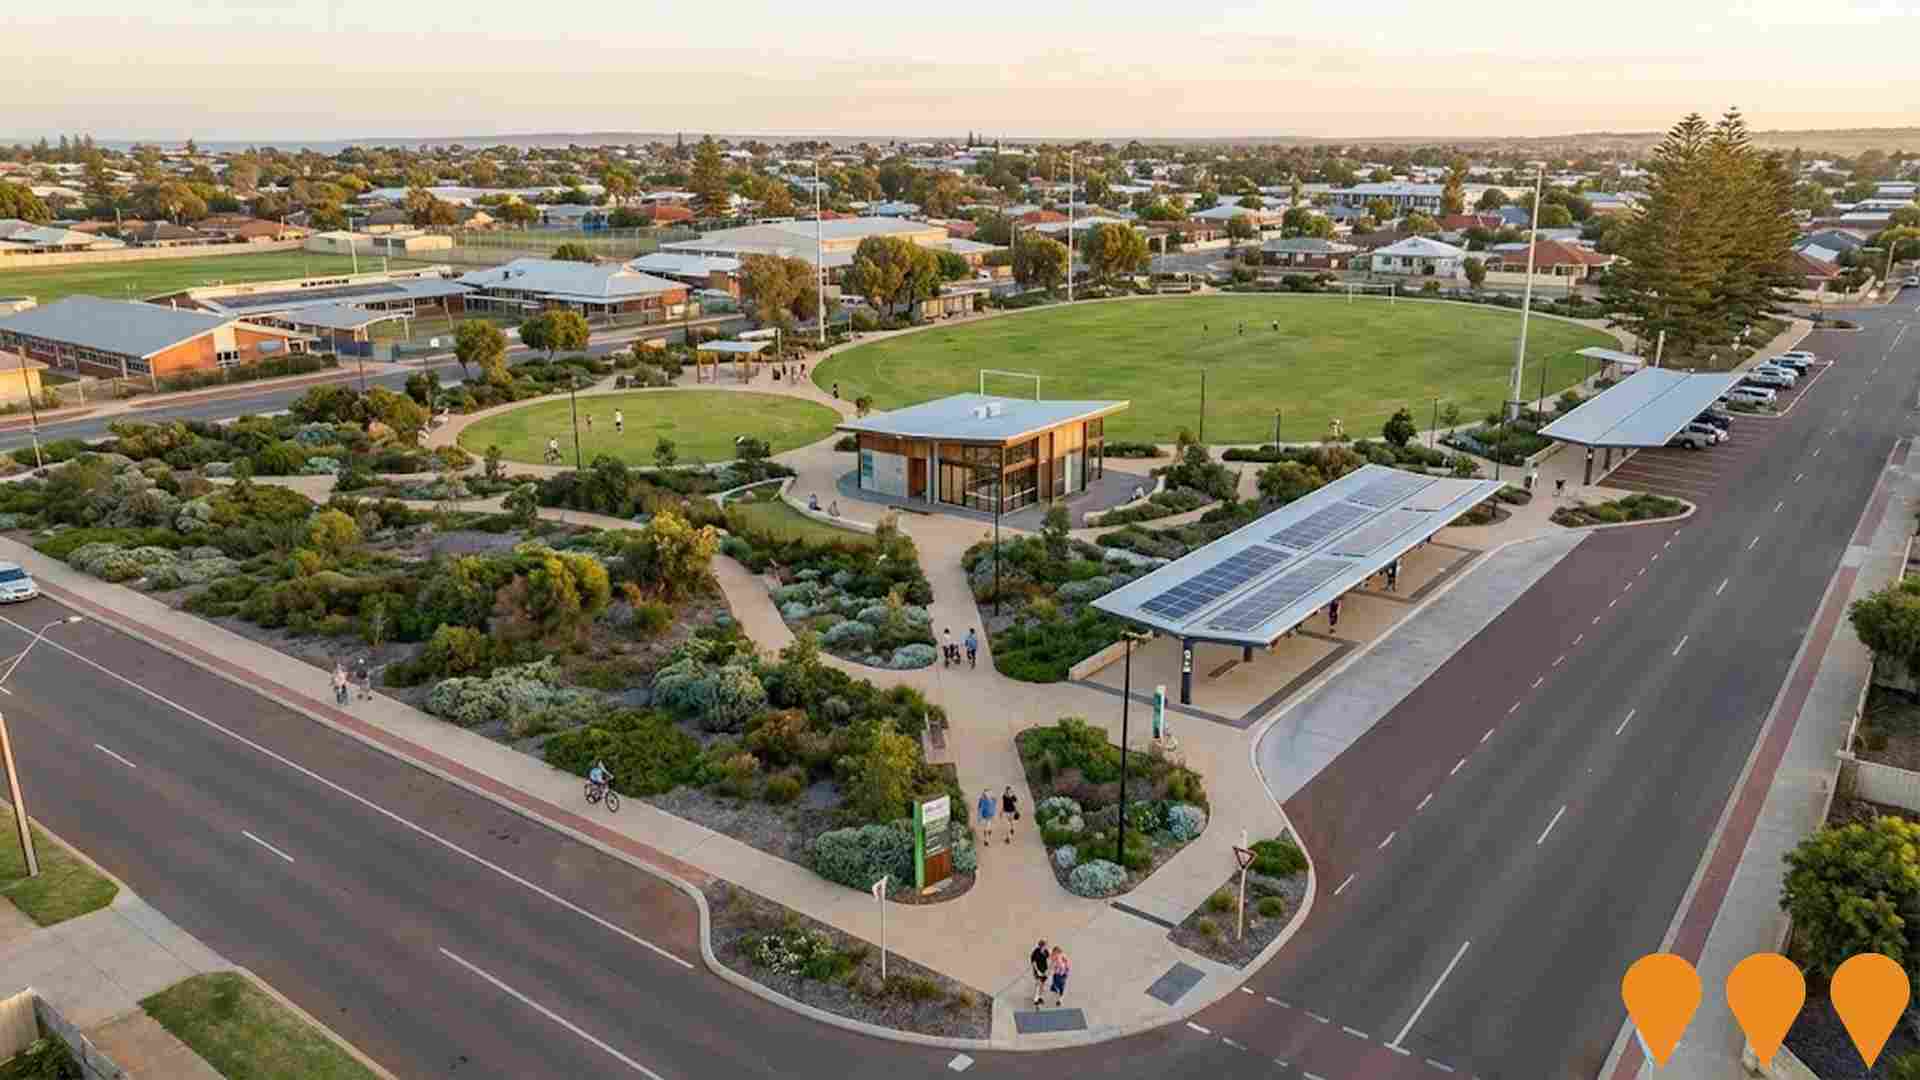
Geraldton Green Connect Project
Transformation of Maitland Park into a sustainable, multi-use space powered by renewable energy, featuring an educational and culturally immersive landscape. The planning stage aims to deliver a comprehensive business case and detailed designs for a multi-use parkland, small-scale pavilion, and sustainable transport hub, which includes a covered carpark and busport with solar panels to improve pedestrian safety and resolve traffic congestion in the school precinct. The project stems from the Maitland Park Schools Precinct Transport Hub Concept Masterplan.
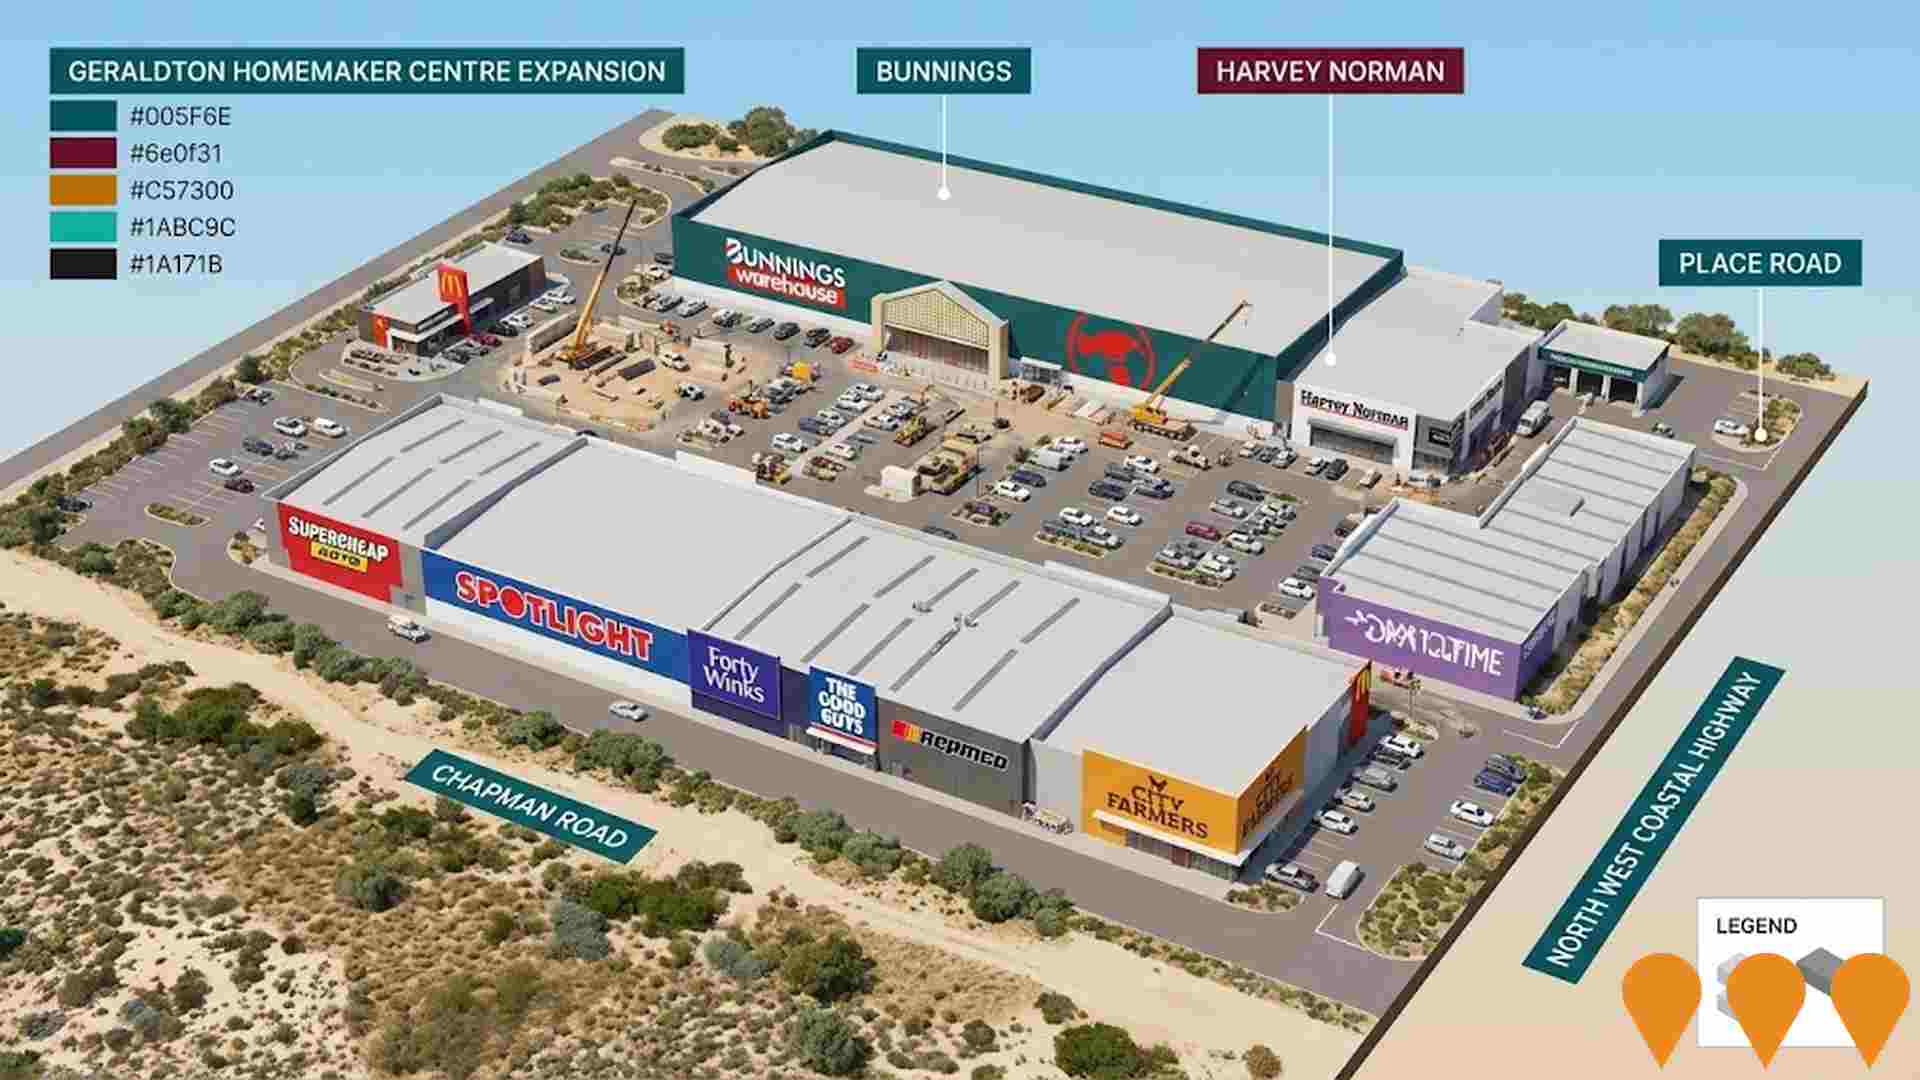
Geraldton Homemaker Centre Expansion
Multi-stage expansion of the Geraldton Homemaker Centre to approximately double its size into two parallel buildings totaling 38,471 sq m of floor space. The project includes multiple phases: a $9.9 million component approved in October 2024 featuring additional bulky goods showrooms, a vehicle service centre, fast food outlet, and new entrance on Place Road; plus a larger $30 million expansion featuring Bunnings (16,743 sq m) relocating from Wonthella and Harvey Norman (5,072 sq m), along with four additional bulky goods showrooms. The development involves demolition of 3,705 sq m of existing space while retaining 12,681 sq m, extending behind current premises towards Place Road. Construction anticipated to commence in coming months following Regional Development Assessment Panel approval in September 2024.
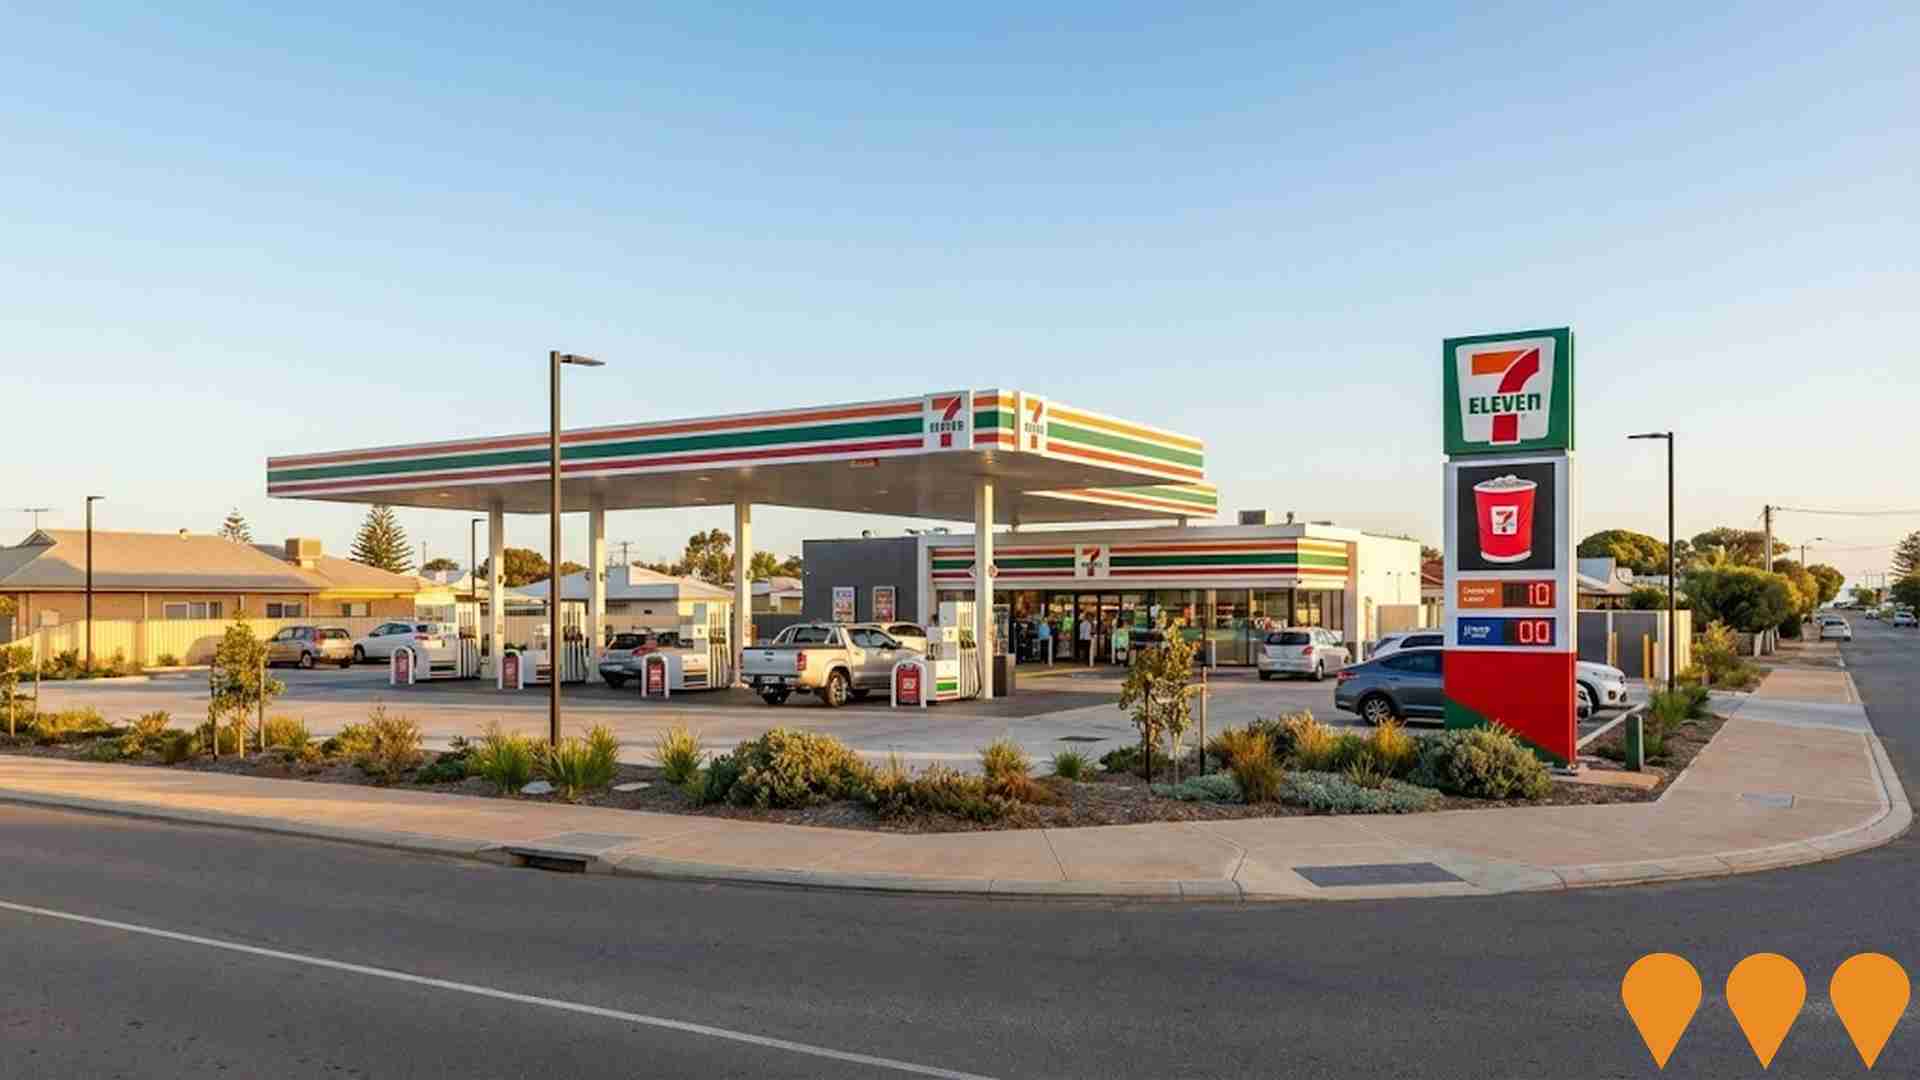
7-Eleven Service Station, Durlacher Street, Geraldton
Development of a 7-Eleven service station and convenience store, with associated pylon signage, access, car parking, and landscaping, approved by the Regional Development Assessment Panel (DAP/24/02803). The original proposal included six refuelling bays and 24/7 convenience services. The project is awaiting construction, as another 7-Eleven location in Geraldton (on Flores Road) was reportedly set to open first.
Glenfield Commercial Retail Hub
Proposed commercial retail development of approximately 12.24 hectares (Lot 55 Chapman Road) within the Glenfield Activity Centre Precinct, guided by an approved Activity Centre Plan (SPN 2110). The plan facilitates development for a limited range of service commercial purposes, including potential for up to 33,660 sqm of floor space for uses like showroom/bulky goods, service station, and liquor store. Future development is subject to Local Development Plans (LDPs). The land is currently advertised for sale/lease.

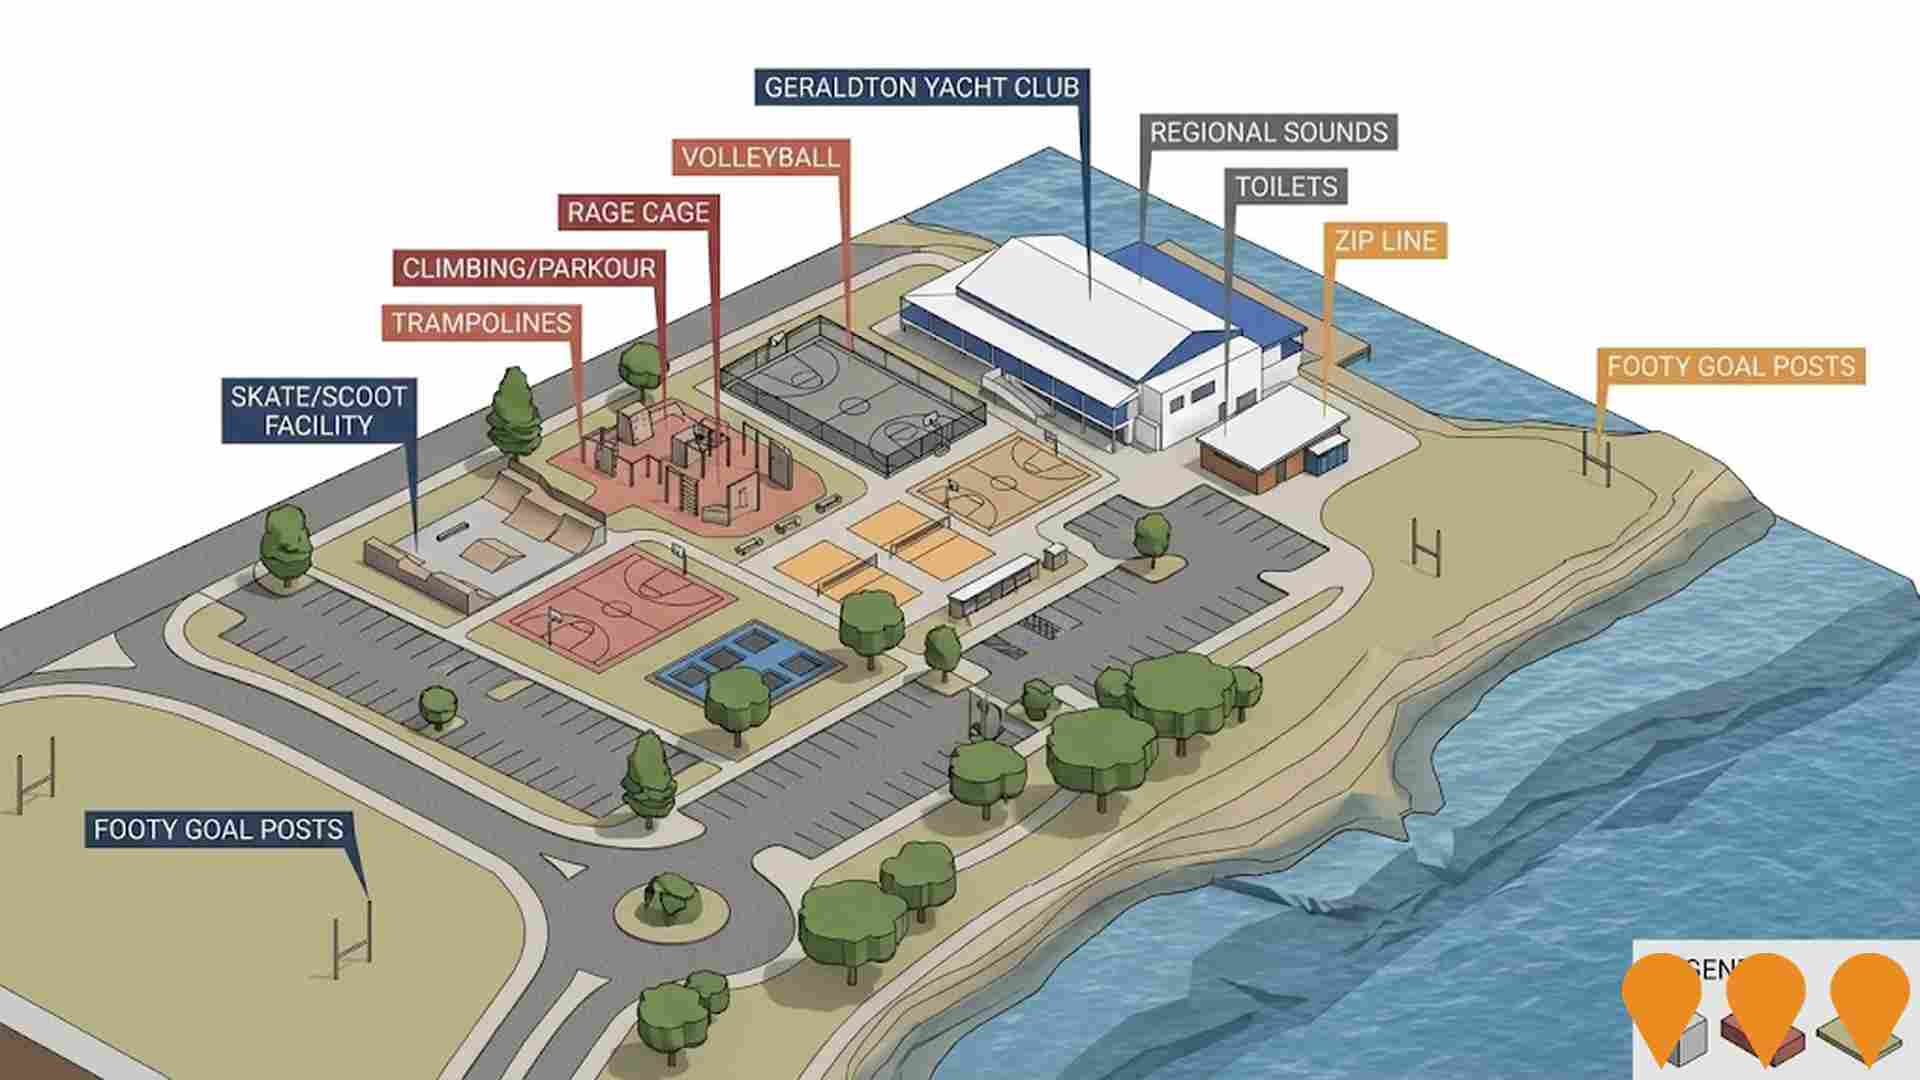
Geraldton Youth Precinct Masterplan Development
Upgrade of the Youth Precinct on the Geraldton foreshore to provide inclusive facilities and amenities for young people aged 12-25, including a new skatepark. The Updated Masterplan was endorsed by the City of Greater Geraldton Council in July 2025. Detailed design will now begin, followed by construction estimated to commence in early 2026.
Fortyn Court Commercial Retail Development
Quick service retail and fuel center on Brand Highway in Mahomets Flats, delivered by M/Group in 2020 and now operating as a local convenience hub with national tenants including Hungry Jacks, Chicken Treat, Dominos, Metro Petroleum and Ultra Tune, plus around 580 sqm of additional retail space serving the surrounding residential community.

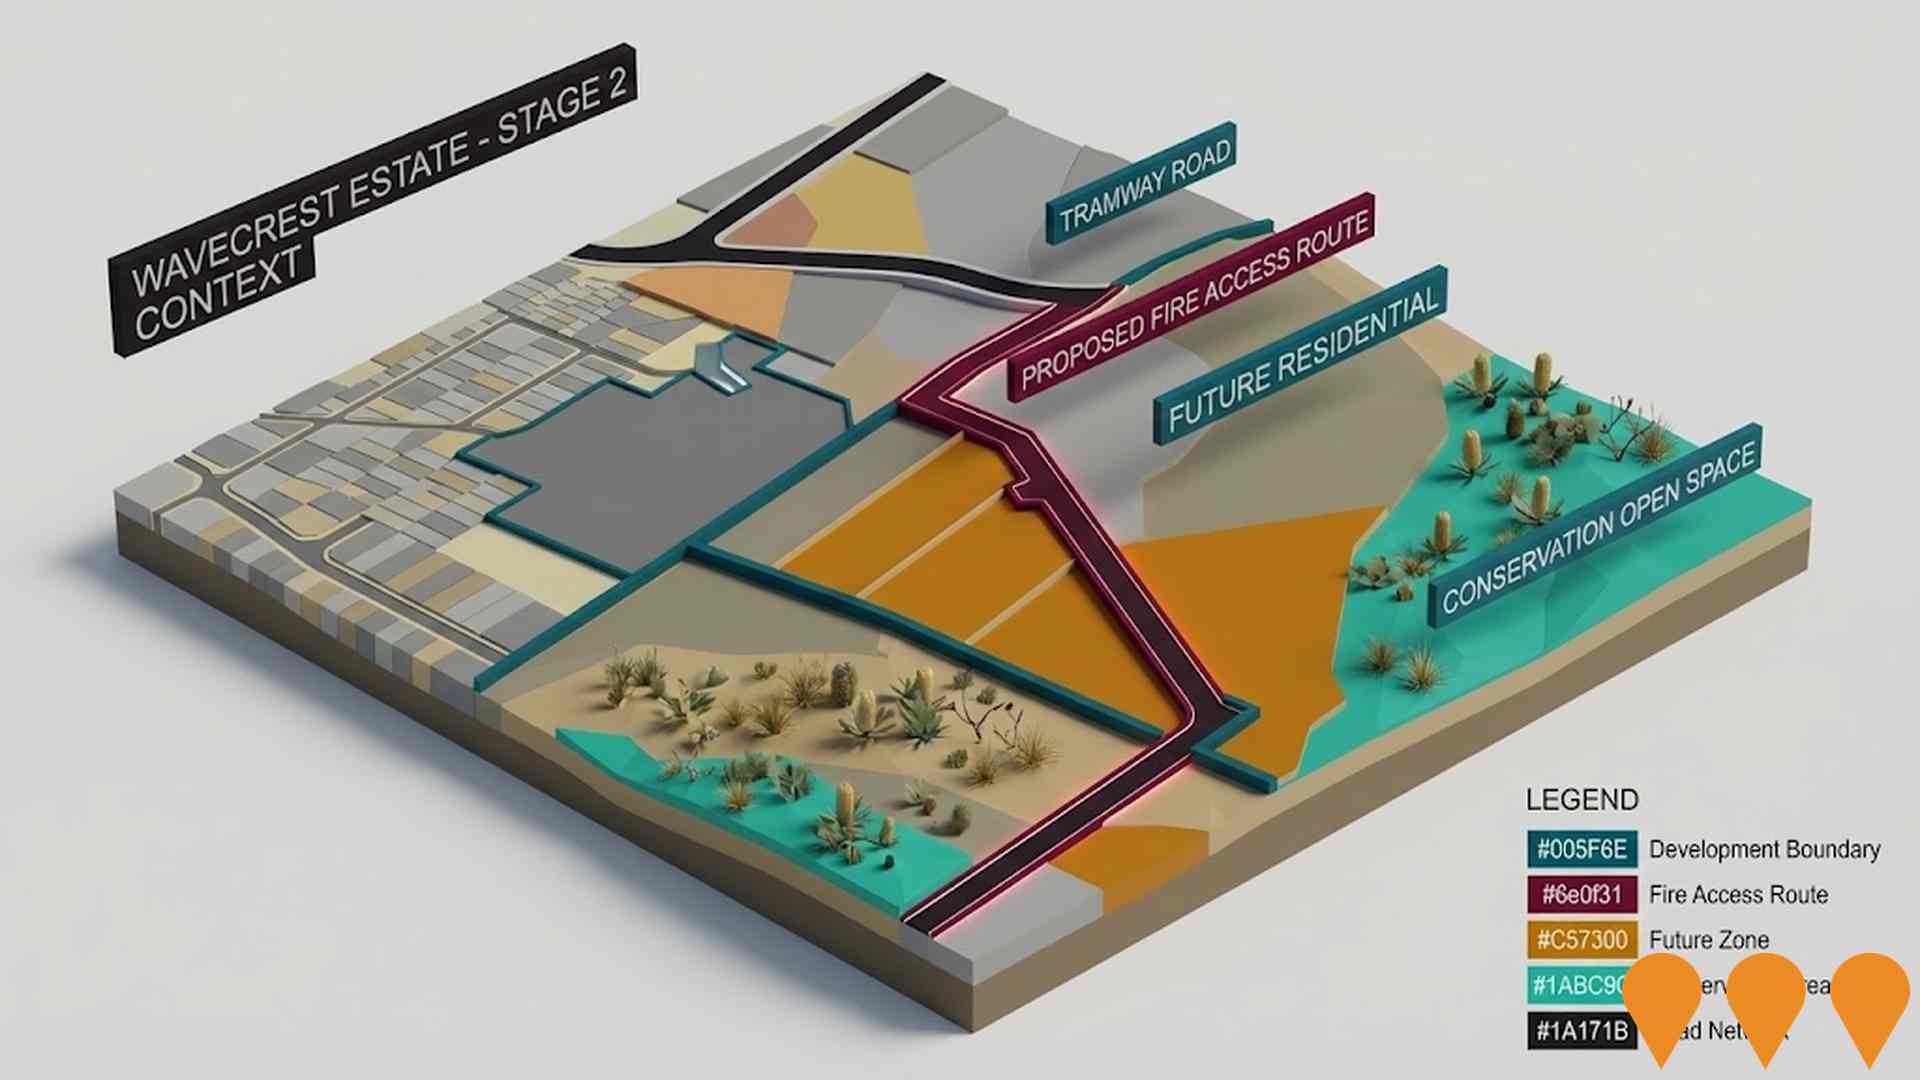
Moresby Heights - Wavecrest Structure Plan and Wavecrest Estate
Wavecrest Estate (formerly known as the Moresby Heights structure plan area) is a 395 ha master planned residential community on the lower slopes of the Moresby Range in Waggrakine, about 10 km north east of Geraldton. The endorsed structure plan allows for around 1,860 to 2,000 dwellings plus a neighbourhood and town centre, primary school, tourism and resort sites, district recreation areas and conservation open space. The structure plan was adopted by the City of Greater Geraldton in 2014 and endorsed by the WA Planning Commission in February 2015, with later amendments and a local development plan. Stage 2 (about 68 lots off Sutcliffe and Tramway Roads) has approval for construction and later stages are progressing through planning approvals, with subdivision and development occurring across the estate.
Waggrakine Rural-Residential Structure Plan
Structure plan for the Waggrakine rural residential area on the northern fringe of Geraldton. The plan was adopted by the City of Geraldton-Greenough in December 2010 and approved by the Western Australian Planning Commission on 7 July 2011, with an expiry date of 19 October 2030. It guides subdivision of existing rural residential land with minimum lot sizes generally between 1 and 2 hectares, focusing on protecting regionally significant vegetation, coordinating subdivision through subdivision guide plans, and providing a long term framework for potential future urban expansion of Geraldton's northern growth corridor.
Employment
Employment conditions in Northampton - Mullewa - Greenough remain below the national average according to AreaSearch analysis
Northampton-Mullewa-Greenough has a balanced workforce with white and blue collar jobs, diverse sector representation, and an unemployment rate of 3.2% as of September 2025. The area's employment rate aligns with Rest of WA's at 3.3%, but workforce participation is lower at 53.7%.
Key industries include agriculture, forestry & fishing, accommodation & food, and health care & social assistance. Agriculture, forestry & fishing is notably concentrated, with employment levels at 2.9 times the regional average. However, mining is under-represented at 6.3% compared to Rest of WA's 11.7%. The area may have limited local employment opportunities.
Over a year ending September 2025, employment increased by 0.5% while labour force grew by 0.4%, keeping unemployment stable. In contrast, Rest of WA saw employment growth of 1.4% and labour force growth of 1.2%. National employment forecasts from Jobs and Skills Australia project a 6.6% increase over five years and 13.7% over ten years. Applying these projections to Northampton-Mullewa-Greenough's industry mix suggests local employment should grow by 5.0% in five years and 11.2% in ten years, though this is a simplified extrapolation for illustrative purposes only.
Frequently Asked Questions - Employment
Income
Income levels sit below national averages according to AreaSearch assessment
AreaSearch's latest postcode level ATO data for financial year 2022 shows that in Northampton - Mullewa - Greenough SA2, the median income is $50,231 and the average income is $66,246. This contrasts with Rest of WA's figures where the median income is $57,323 and the average income is $71,163. Based on Wage Price Index growth of 14.2% since financial year 2022, current estimates for Northampton - Mullewa - Greenough SA2 would be approximately $57,364 (median) and $75,653 (average) as of September 2025. According to Census 2021 income data, household, family and personal incomes in Northampton - Mullewa - Greenough all fall between the 18th and 21st percentiles nationally. The predominant income cohort spans 28.3% of locals (1,671 people) with incomes ranging from $1,500 to $2,999. This pattern is also seen in the broader area where 31.1% fall within this range. Housing costs are modest, with 89.6% of income retained, but total disposable income ranks at just the 25th percentile nationally.
Frequently Asked Questions - Income
Housing
Northampton - Mullewa - Greenough is characterized by a predominantly suburban housing profile, with above-average rates of outright home ownership
Dwelling structure in Northampton - Mullewa - Greenough, as per the latest Census, consisted of 90.9% houses and 9.2% other dwellings (semi-detached, apartments, 'other' dwellings), compared to Non-Metro WA's 87.5% houses and 12.5% other dwellings. Home ownership in the area stood at 52.7%, with mortgaged dwellings at 27.3% and rented ones at 20.0%. The median monthly mortgage repayment was $1,400, below Non-Metro WA's average of $1,517. The median weekly rent figure was $225, lower than Non-Metro WA's $250. Nationally, mortgage repayments in the area were significantly lower at $1,400 compared to Australia's average of $1,863, while rents were substantially below the national figure of $375.
Frequently Asked Questions - Housing
Household Composition
Northampton - Mullewa - Greenough has a typical household mix, with a lower-than-average median household size
Family households account for 69.6% of all households, including 23.2% couples with children, 38.7% couples without children, and 7.2% single parent families. Non-family households make up the remaining 30.4%, with lone person households at 28.2% and group households comprising 2.0%. The median household size is 2.3 people, which is smaller than the Rest of WA average of 2.4.
Frequently Asked Questions - Households
Local Schools & Education
Northampton - Mullewa - Greenough faces educational challenges, with performance metrics placing it in the bottom quartile of areas assessed nationally
The area's university qualification rate is 14.4%, significantly lower than Australia's average of 30.4%. This presents both a challenge and an opportunity for targeted educational initiatives. Bachelor degrees are the most common at 11.4%, followed by graduate diplomas (1.6%) and postgraduate qualifications (1.4%). Trade and technical skills are prominent, with 40.9% of residents aged 15+ holding vocational credentials – advanced diplomas (9.2%) and certificates (31.7%).
Educational participation is high, with 29.5% of residents currently enrolled in formal education, including 13.6% in primary, 8.8% in secondary, and 1.7% in tertiary education.
Frequently Asked Questions - Education
Schools Detail
Nearby Services & Amenities
Transport
Transport servicing is very low compared to other areas nationally based on assessment of service frequency, route connectivity and accessibility
Northampton-Mullewa-Greenough has 13 active public transport stops. These are served by buses along five different routes. Together, these routes offer 17 weekly passenger trips.
Transport access is limited in the area, with residents on average located 5246 meters from their nearest stop. Service frequency averages two trips per day across all routes, resulting in approximately one weekly trip per individual stop.
Frequently Asked Questions - Transport
Transport Stops Detail
Health
Health performance in Northampton - Mullewa - Greenough is lower than average with common health conditions somewhat prevalent across both younger and older age cohorts
Northampton-Mullewa-Greenough faces significant health challenges with common health conditions prevalent across both younger and older age cohorts.
The rate of private health cover is approximately 52% of the total population (~3,094 people), leading that of the average SA2 area. The most common medical conditions in the area are arthritis (10.2%) and asthma (7.0%). A total of 66.2% of residents declared themselves completely clear of medical ailments, compared to 66.8% across Rest of WA. The area has 24.4% of residents aged 65 and over (1,440 people), which is higher than the 18.3% in Rest of WA. Health outcomes among seniors are particularly strong, performing better than the general population in health metrics.
Frequently Asked Questions - Health
Cultural Diversity
Northampton - Mullewa - Greenough is considerably less culturally diverse than average when assessed alongside AreaSearch's national rankings for language and cultural background related metrics
Northampton-Mullewa-Greenough had low cultural diversity, with 82.1% citizens, 85.3% born in Australia, and 96.7% speaking English only at home. Christianity was the dominant religion, at 53.2%, compared to 49.9% regionally. The top ancestry groups were English (33.9%), Australian (32.3%), and Scottish (8.0%).
Notably, Australian Aboriginal representation was higher at 4.7% versus 6.9% regionally, Dutch at 1.5% versus 1.3%, and New Zealand at 0.8% versus 0.6%.
Frequently Asked Questions - Diversity
Age
Northampton - Mullewa - Greenough ranks among the oldest 10% of areas nationwide
Northampton-Mullewa-Greenough has a median age of 49, which is higher than Rest of WA's figure of 40 and significantly greater than Australia's national norm of 38. The age group of 65-74 shows strong representation at 15.7%, compared to Rest of WA's figure, while the 25-34 cohort is less prevalent at 8.7%. This 65-74 concentration is well above the national average of 9.4%. Post-2021 Census data indicates that the 15-24 age group has grown from 7.6% to 8.9%, and the 35-44 cohort has increased from 11.0% to 12.2%. Conversely, the 55-64 cohort has declined from 18.1% to 16.8%, and the 45-54 group has dropped from 14.1% to 12.9%. By 2041, Northampton-Mullewa-Greenough is expected to see notable shifts in its age composition, with the 25-34 group projected to grow by 66%, reaching 857 people from 514. Meanwhile, the 85+ and 65-74 cohorts are expected to experience population declines.
