Chart Color Schemes
This analysis uses ABS Statistical Areas Level 2 (SA2) boundaries, which can materially differ from Suburbs and Localities (SAL) even when sharing similar names.
SA2 boundaries are defined by the Australian Bureau of Statistics and are designed to represent communities for statistical reporting (e.g., census and ERP).
Suburbs and Localities (SAL) represent commonly-used suburb/locality names (postal-style areas) and may use different geographic boundaries. For comprehensive analysis, consider reviewing both boundary types if available.
est. as @ -- *
ABS ERP | -- people | --
2021 Census | -- people
Sales Activity
Curious about local property values? Filter the chart to assess the volume and appreciation (including resales) trends and regional comparisons, or scroll to the map below view this information at an individual property level.
Find a Recent Sale
Sales Detail
Population
Moora has shown very soft population growth performance across periods assessed by AreaSearch
Moora's population is around 5,543 as of November 2025. This reflects an increase of 1,072 people (24.0%) since the 2021 Census, which reported a population of 4,471 people. The change is inferred from the estimated resident population of 4,732 from the ABS as of June 2024 and an additional 415 validated new addresses since the Census date. This level of population equates to a density ratio of 0.40 persons per square kilometer. Moora's 24.0% growth since the 2021 census exceeded the national average (8.9%), along with the SA4 region, marking it as a growth leader in the region. Population growth for the area was primarily driven by natural growth that contributed approximately 53.0% of overall population gains during recent periods.
AreaSearch is adopting ABS/Geoscience Australia projections for each SA2 area, as released in 2024 with 2022 as the base year. For any SA2 areas not covered by this data, and to estimate growth across all areas in the years post-2032, AreaSearch is utilising the growth rates by age cohort provided by the ABS in its latest Greater Capital Region projections (released in 2023, based on 2022 data). Looking at population projections moving forward, lower quartile growth of Australia's regional areas is anticipated. The area is expected to increase by 104 persons to 2041 based on the latest annual ERP population numbers, reflecting a decrease of 12.8% in total over the 17 years.
Frequently Asked Questions - Population
Development
AreaSearch assessment of residential development drivers sees a low level of activity in Moora, placing the area among the bottom 25% of areas assessed nationally
Moora has received approximately 7 dwelling approvals annually over the past five financial years, totalling 36 homes. As of FY26, 8 approvals have been recorded. On average, 1.8 new residents per year per dwelling were added between FY21 and FY25, indicating balanced supply and demand. However, this figure has increased to 8.4 people per dwelling over the past two financial years, suggesting growing popularity and potential undersupply. The average construction cost of new homes is $358,000.
This year, there have been $14.2 million in commercial approvals, signifying balanced commercial development activity. Compared to the Rest of WA, Moora shows significantly reduced construction levels, 74.0% below the regional average per person. This constrained new construction typically reinforces demand and pricing for existing properties. Nationally, Moora's construction level is also lower, reflecting market maturity and possible development constraints. Recent building activity consists solely of detached houses, maintaining the area's traditional low density character with a focus on family homes.
The estimated population per dwelling approval is 804 people, reflecting its quiet, low activity development environment. Given stable or declining population forecasts, Moora may experience less housing pressure, creating favourable conditions for buyers.
Frequently Asked Questions - Development
Infrastructure
Moora has emerging levels of nearby infrastructure activity, ranking in the 35thth percentile nationally
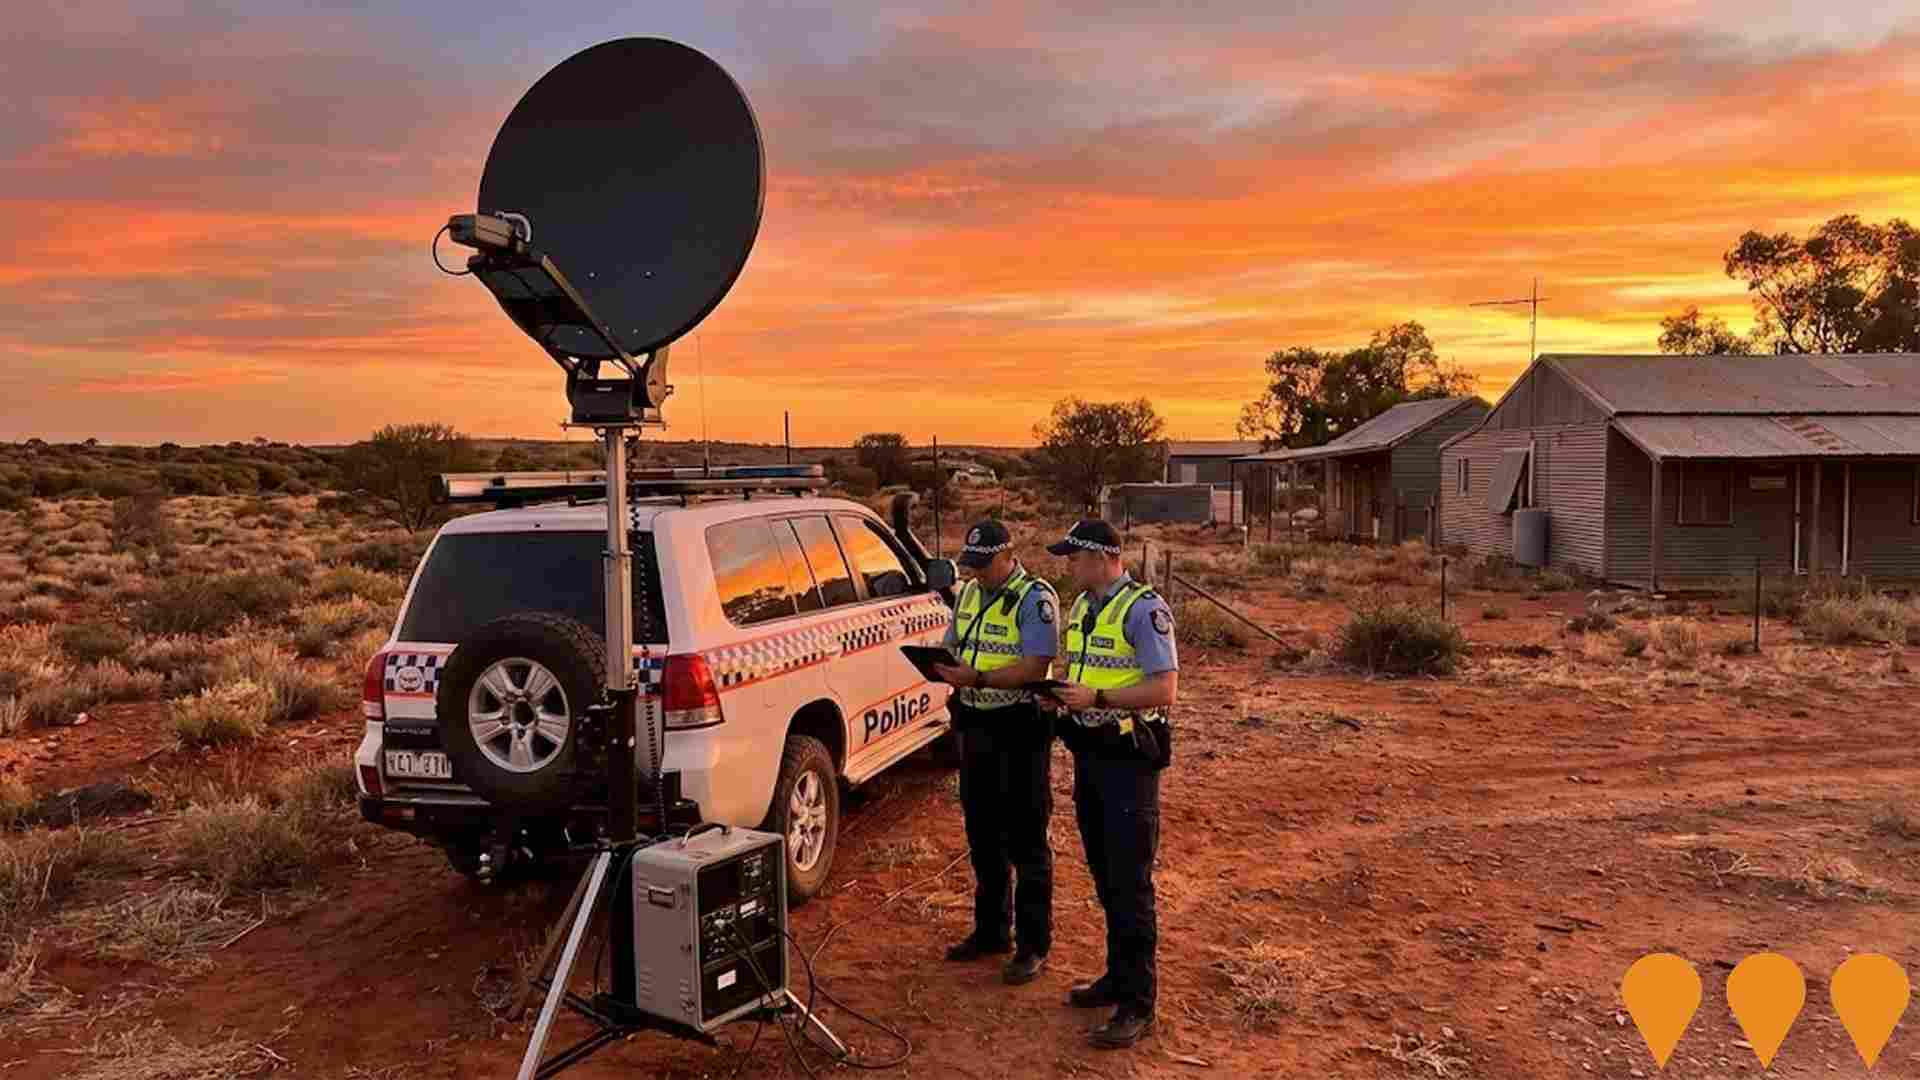
Changes to local infrastructure significantly influence an area's performance. AreaSearch has identified one major project expected to impact the region: Bindoon Bypass. Other notable projects include WA Police Satellite Technology Upgrade, Sam Kerr Football Centre and Queens Park Regional Open Space, along with Western Australia Agricultural Supply Chain Improvements. The following details those most relevant.
Professional plan users can use the search below to filter and access additional projects.
INFRASTRUCTURE SEARCH
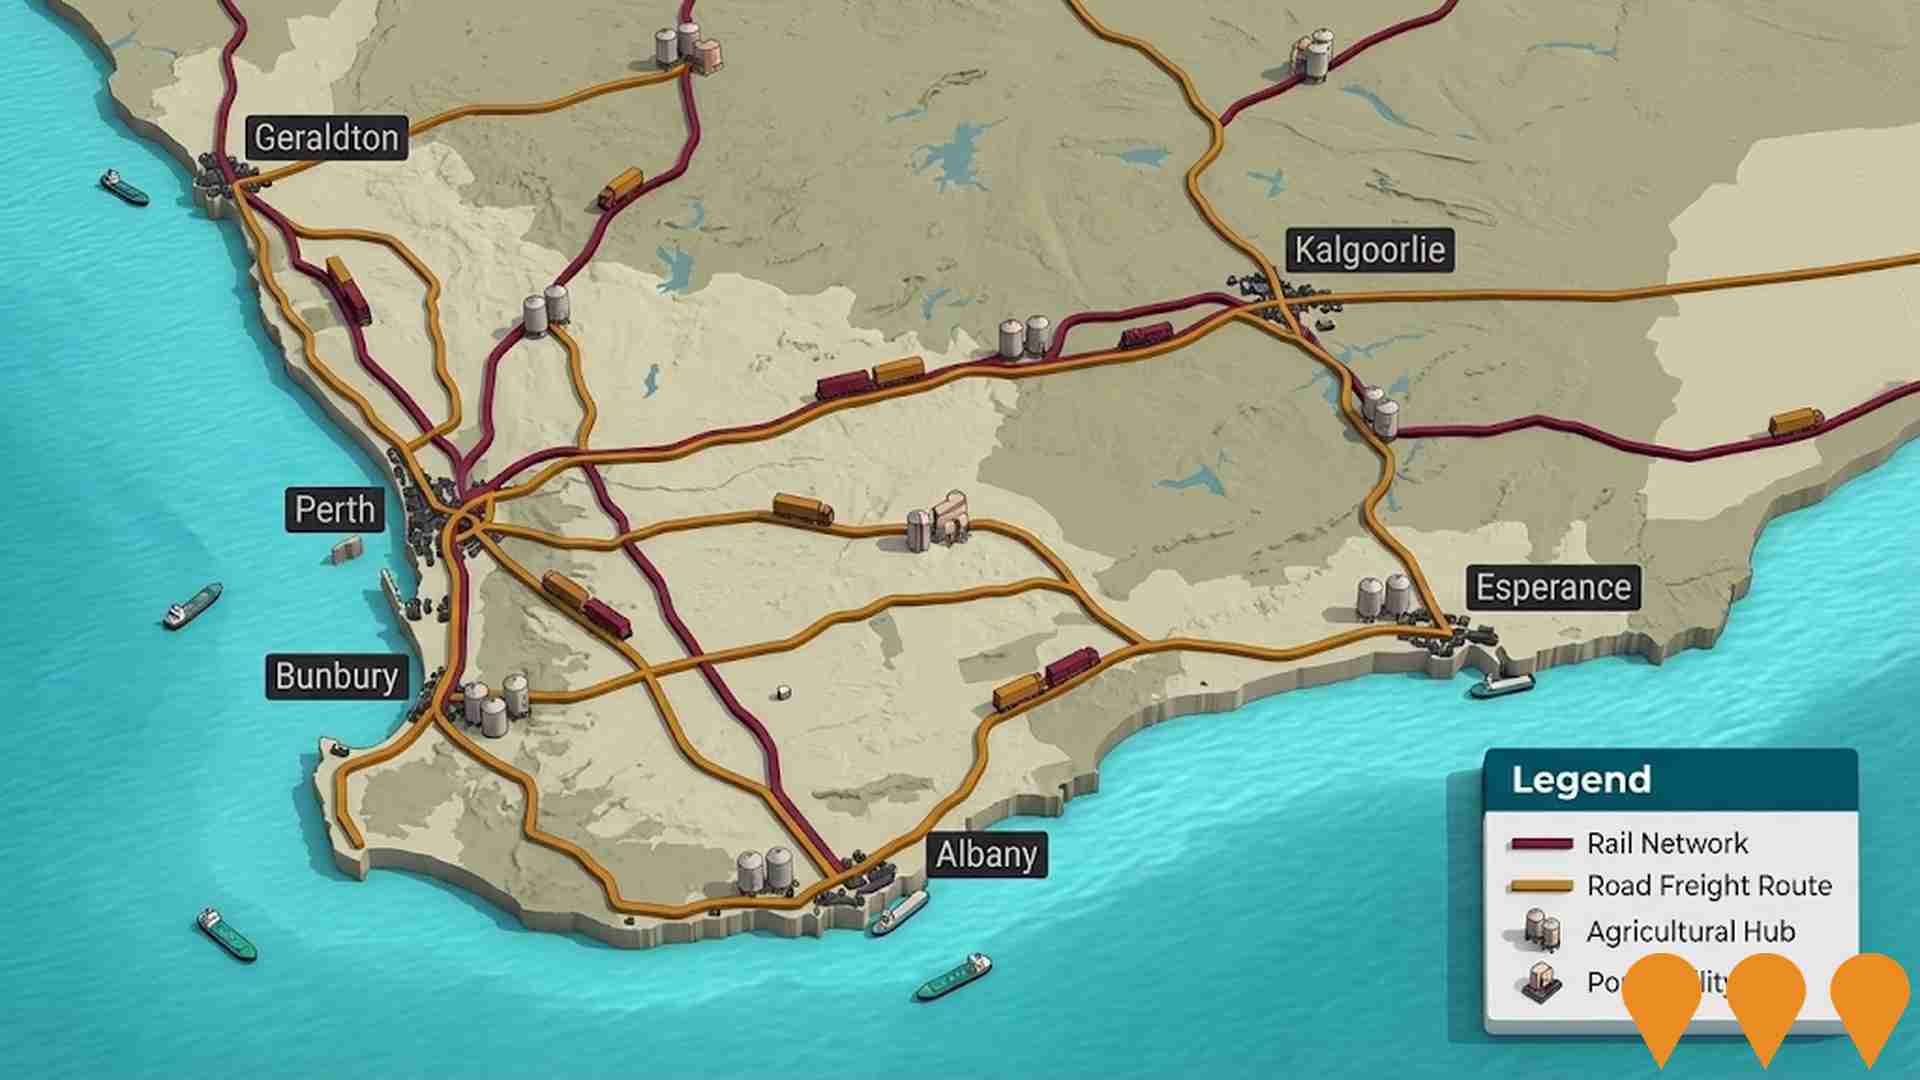
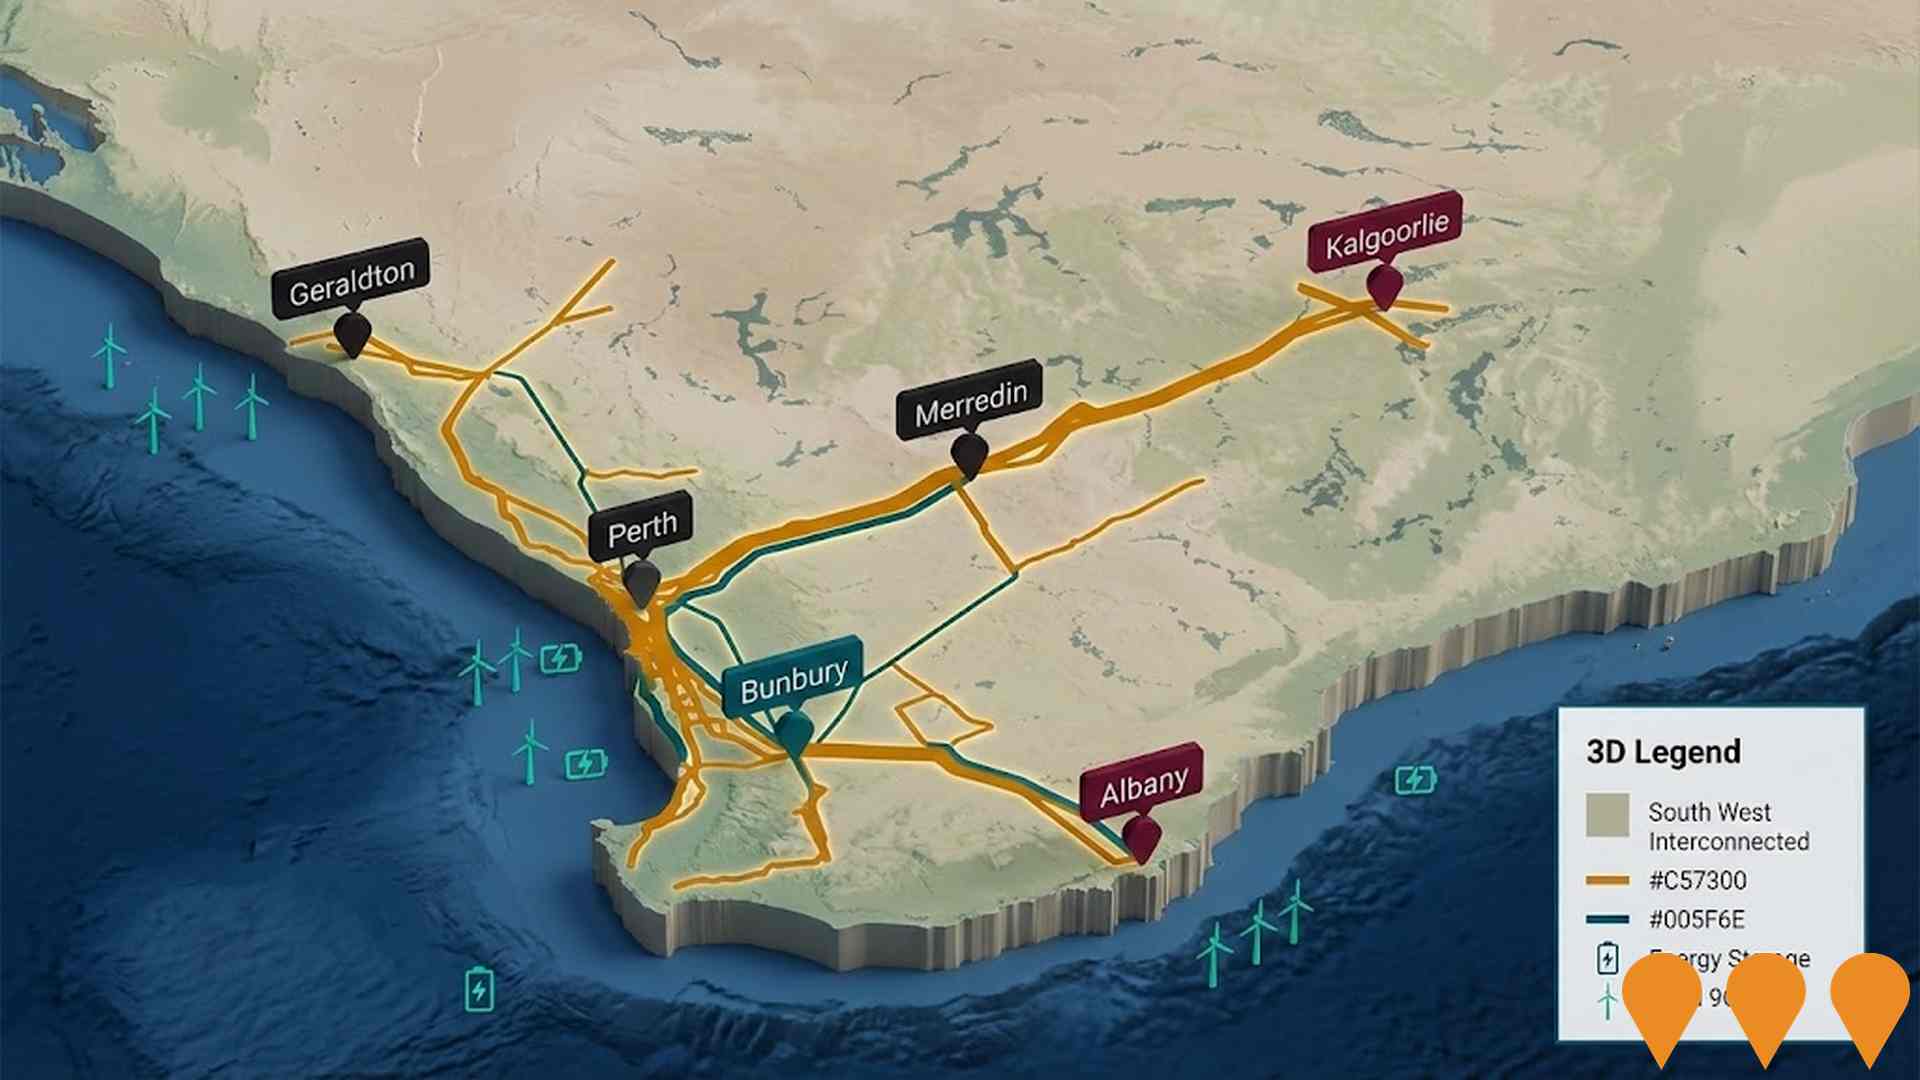
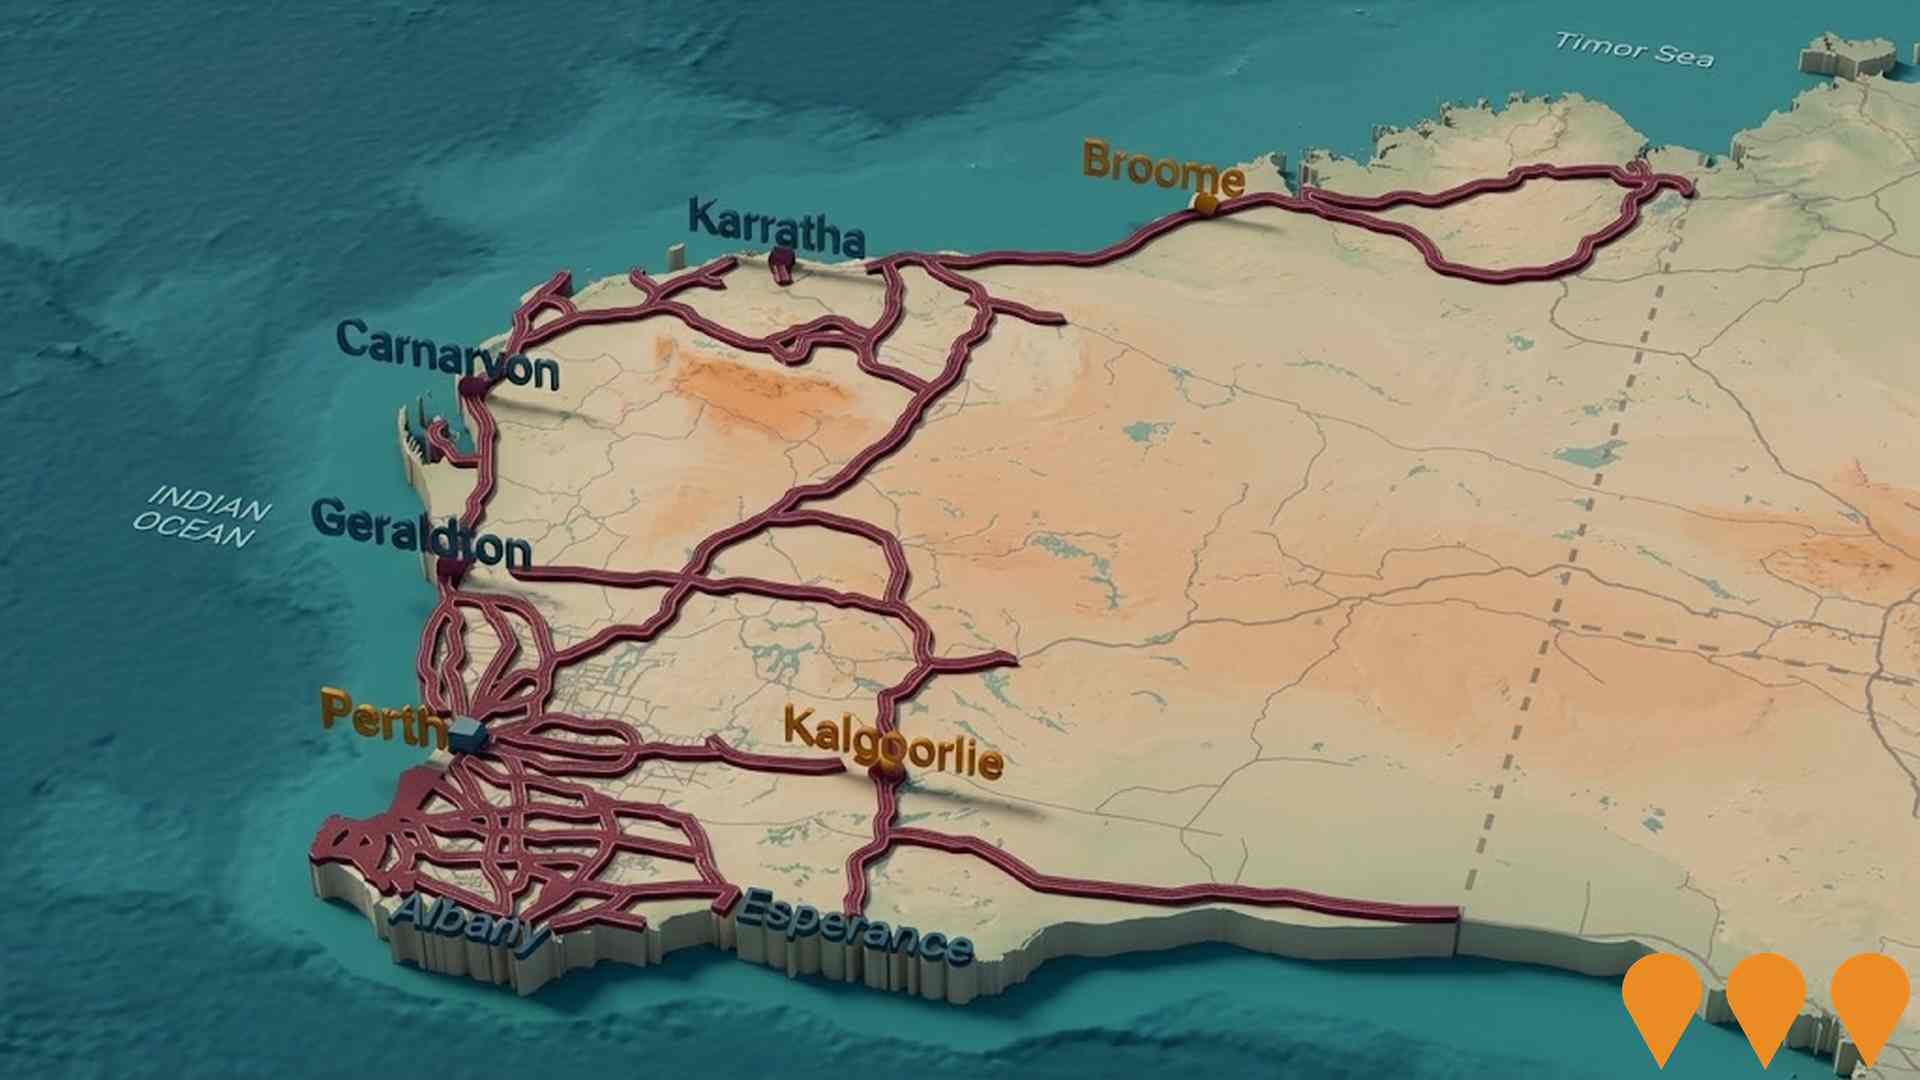
 Denotes AI-based impression for illustrative purposes only, not to be taken as definitive under any circumstances. Please follow links and conduct other investigations from the project's source for actual imagery. Developers and project owners wishing us to use original imagery please Contact Us and we will do so.
Frequently Asked Questions - Infrastructure
Resources Community Investment Initiative
A $750 million partnership between the Western Australian Government and seven major resource companies (Rio Tinto, BHP, Woodside Energy, Chevron Australia, Mineral Resources, Fortescue, Roy Hill) to co-fund community, social and regional infrastructure projects across regional Western Australia, with strong focus on the Pilbara, Goldfields, Kimberley, Mid West and Gascoyne.
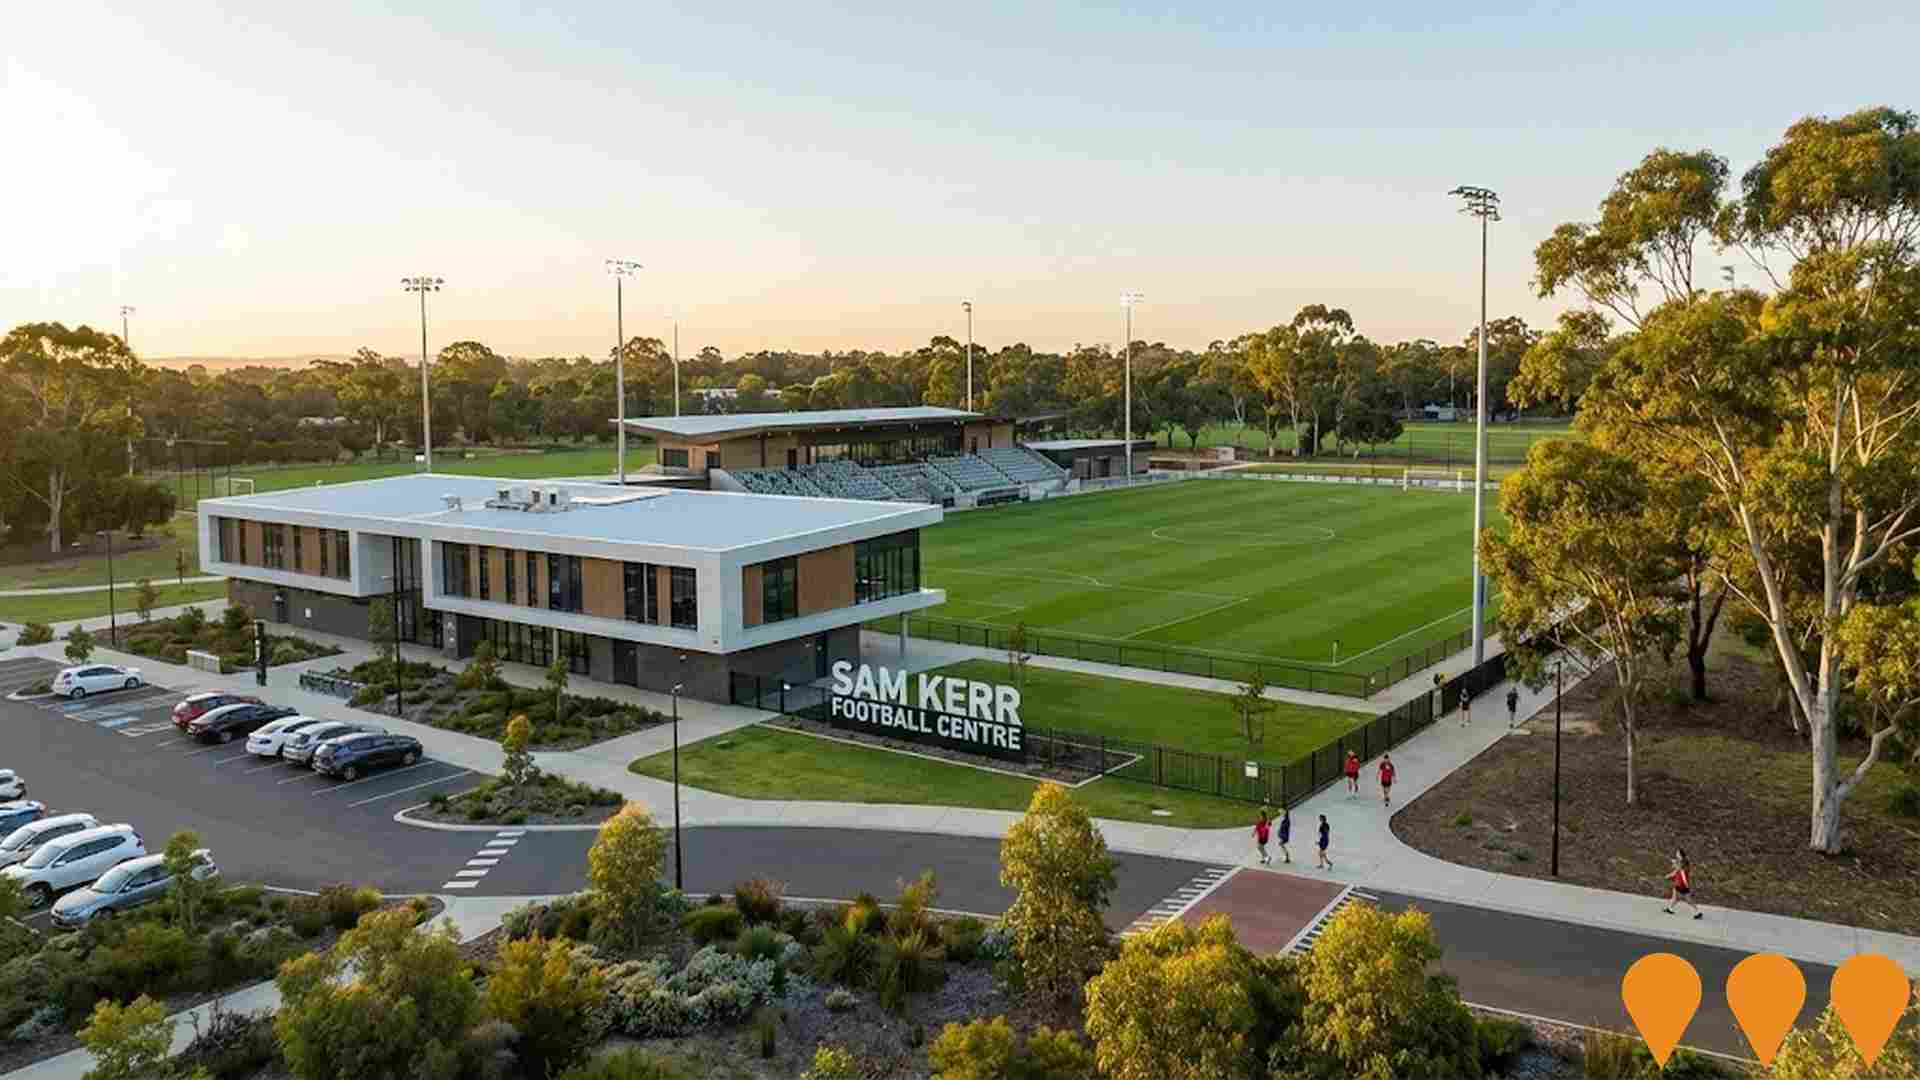
Sam Kerr Football Centre and Queens Park Regional Open Space
A major sporting precinct incorporating the completed $50.8 million State Football Centre (Sam Kerr Football Centre) and the Queens Park Regional Open Space. The facility features two competition pitches, a grandstand for 700 spectators, and high-performance training amenities. While the main centre opened in late 2023, a $4 million Stage 2 expansion is currently under construction to deliver two additional pitches and lighting, scheduled for completion in January 2026. The wider precinct includes community cricket facilities, a pump track, and biodiversity enhancements.
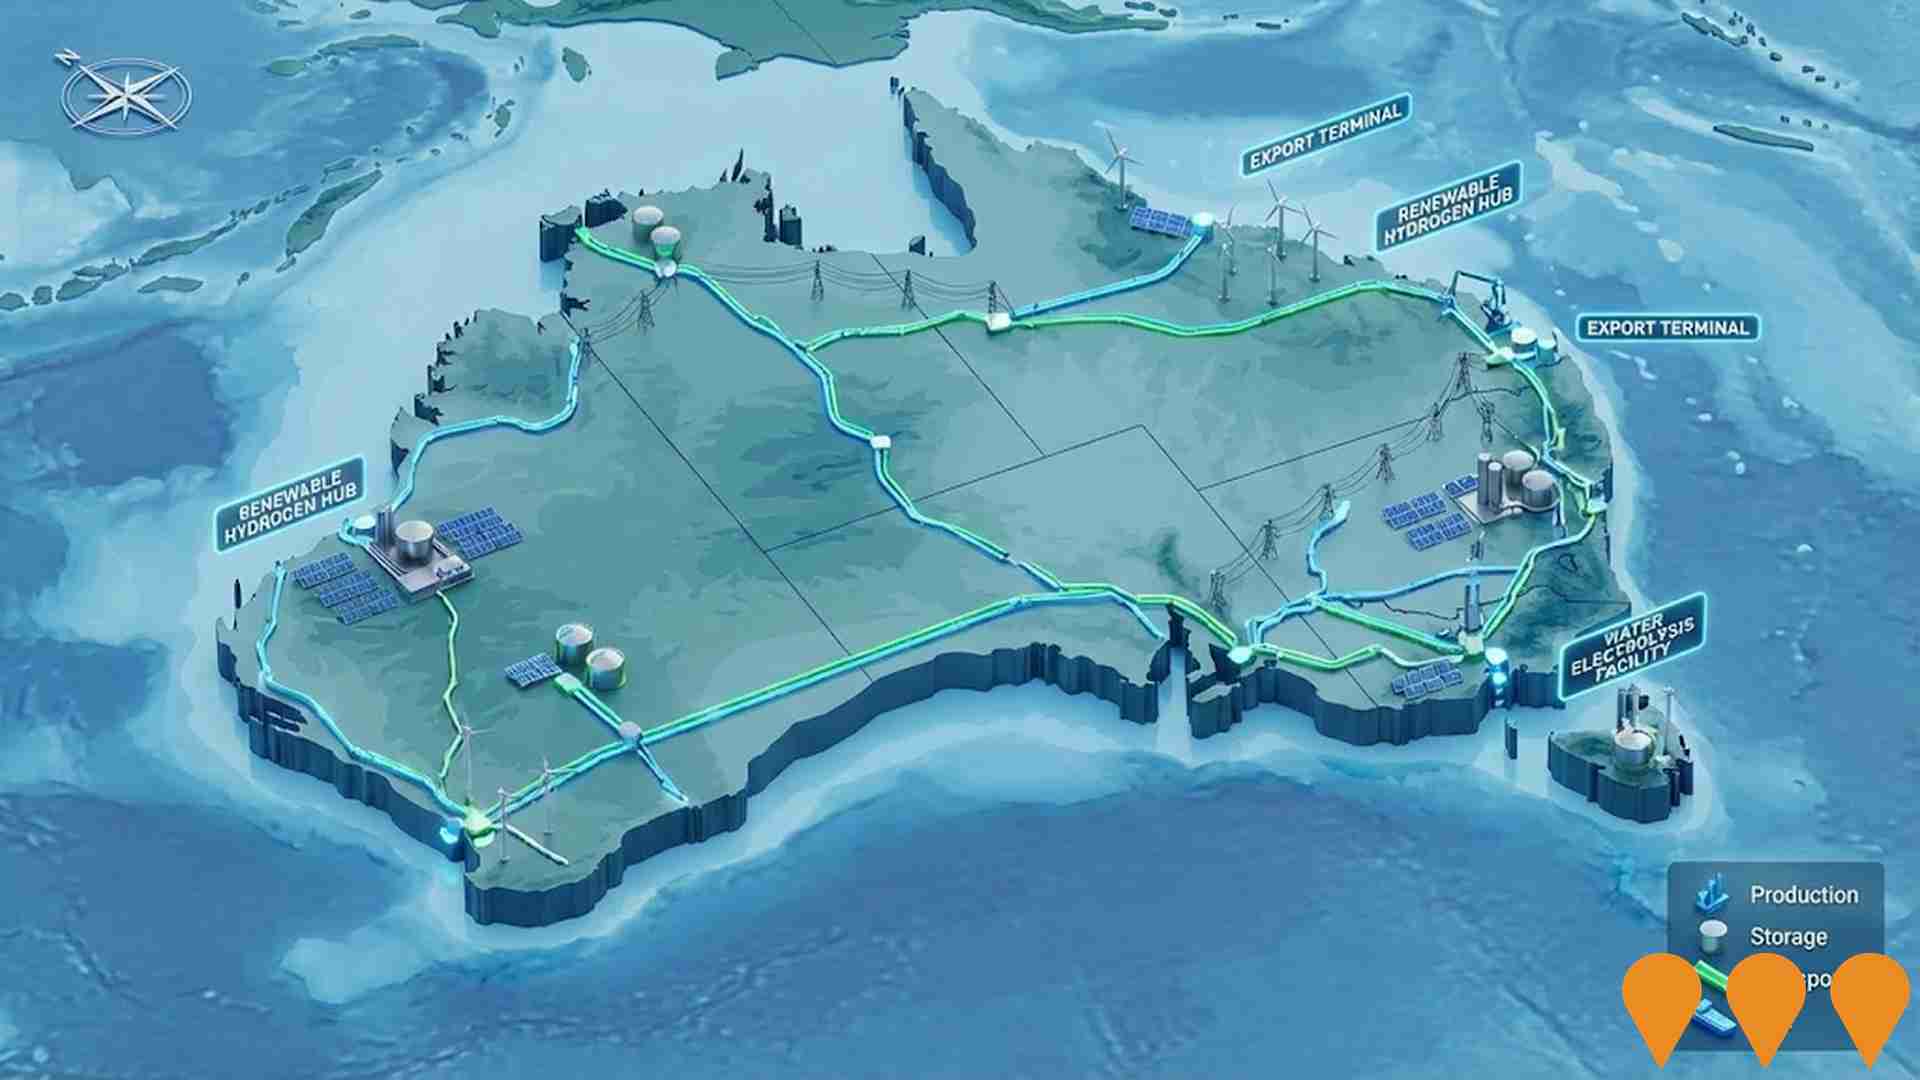
Enabling Infrastructure for Hydrogen Production
Australia has completed the National Hydrogen Infrastructure Assessment (NHIA) to 2050 and refreshed its National Hydrogen Strategy (2024). The programmatic focus has shifted to planning and enabling infrastructure through measures such as ARENA's Hydrogen Headstart and the Hydrogen Production Tax Incentive (from April 2025). Round 2 of Hydrogen Headstart consultation occurred in 2025. Collectively these actions aim to coordinate investment in transport, storage, water and electricity inputs linked to Renewable Energy Zones and priority hubs, supporting large-scale renewable hydrogen production and future export supply chains.
National EV Charging Network (Highway Fast Charging)
Partnership between the Australian Government and NRMA to deliver a backbone EV fast charging network on national highways. Program funds and co-funds 117 DC fast charging sites at roughly 150 km intervals to connect all capital cities and regional routes, reducing range anxiety and supporting EV uptake.

Bulk Water Supply Security
Nationwide program led by the National Water Grid Authority to improve bulk water security and reliability for non-potable and productive uses. Activities include strategic planning, science and business cases, and funding of state and territory projects such as storages, pipelines, dam upgrades, recycled water and efficiency upgrades to build drought resilience and support regional communities, industry and the environment.

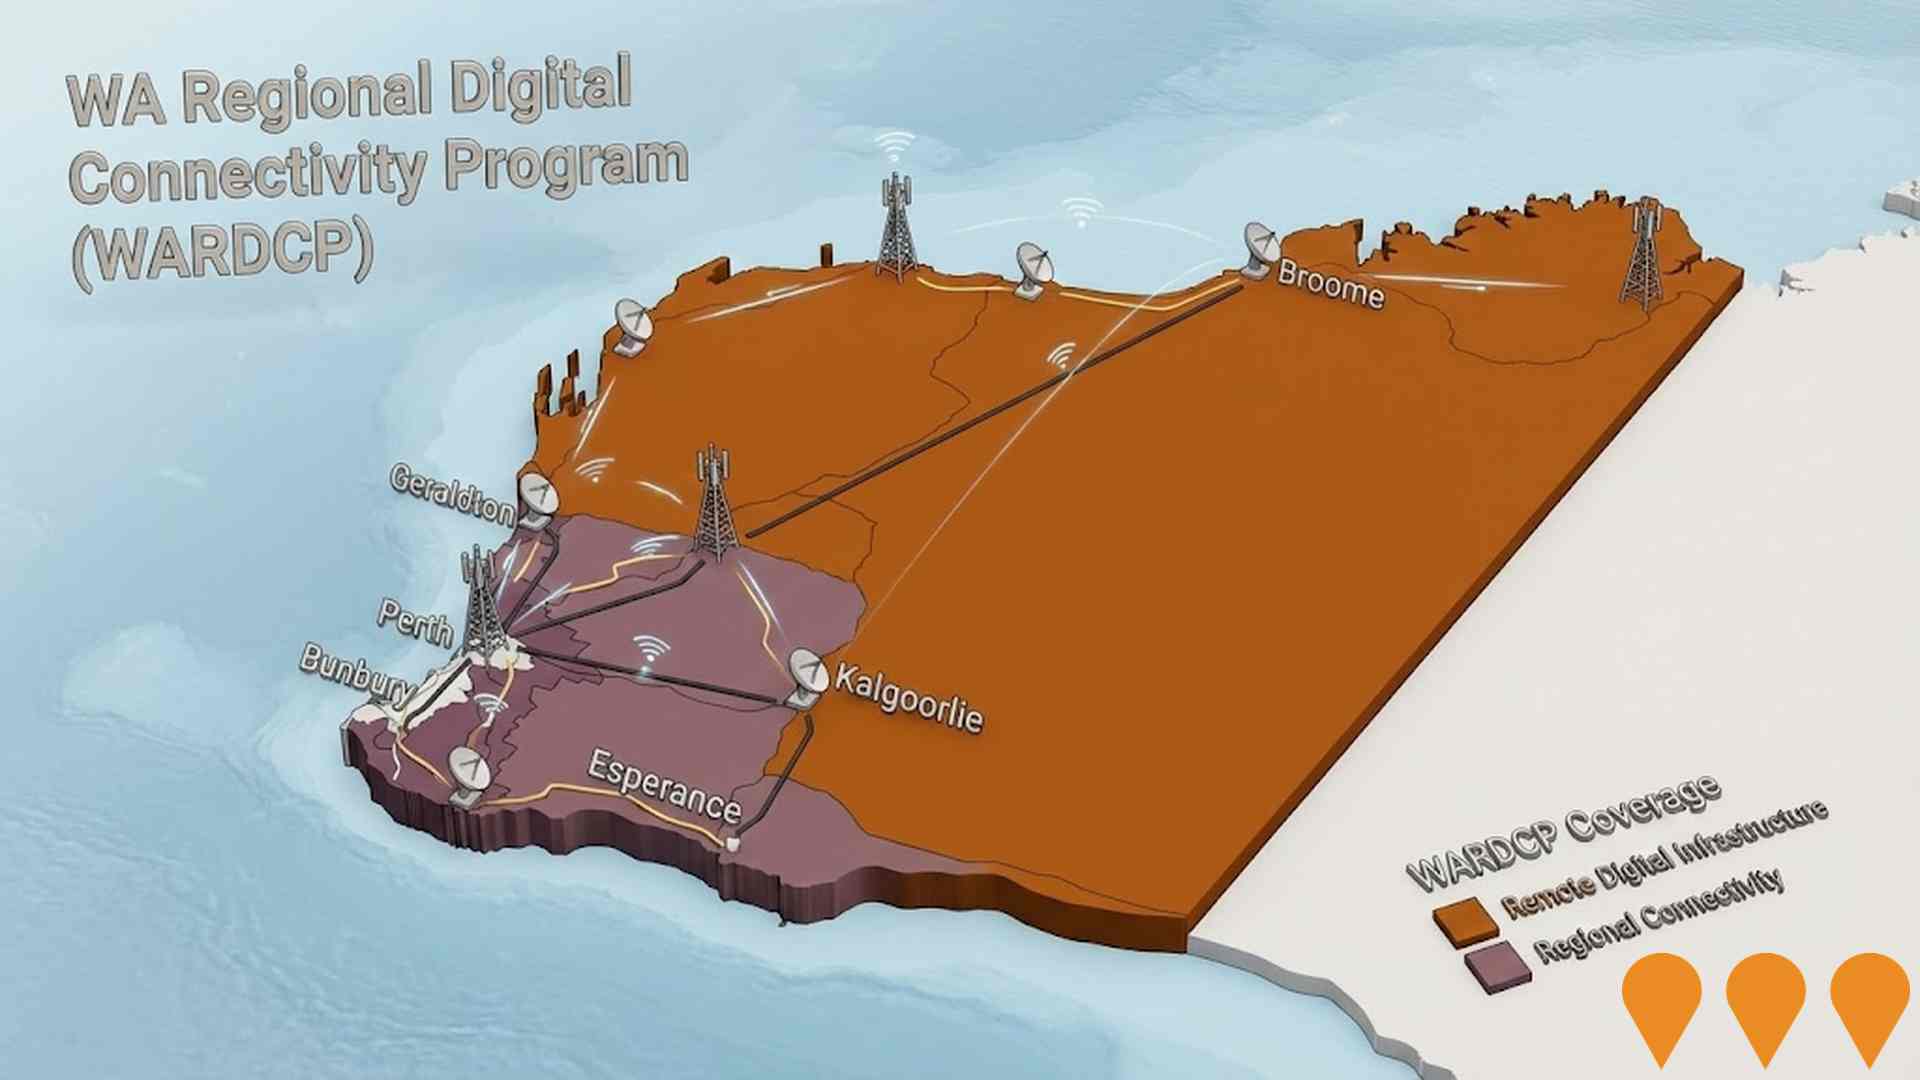
WA Regional Digital Connectivity Program (WARDCP)
Statewide co-investment program delivering new and upgraded mobile, fixed wireless and broadband infrastructure to improve reliability, coverage and performance for regional and remote Western Australia. Current workstreams include the Regional Telecommunications Project, State Agriculture Telecommunications Infrastructure Fund, and the WA Regional Digital Connectivity Program (WARDCP).
Network Optimisation Program - Roads
A national program concept focused on improving congestion and reliability on urban road networks by using low-cost operational measures and technology (e.g., signal timing, intersection treatments, incident management) to optimise existing capacity across major city corridors.

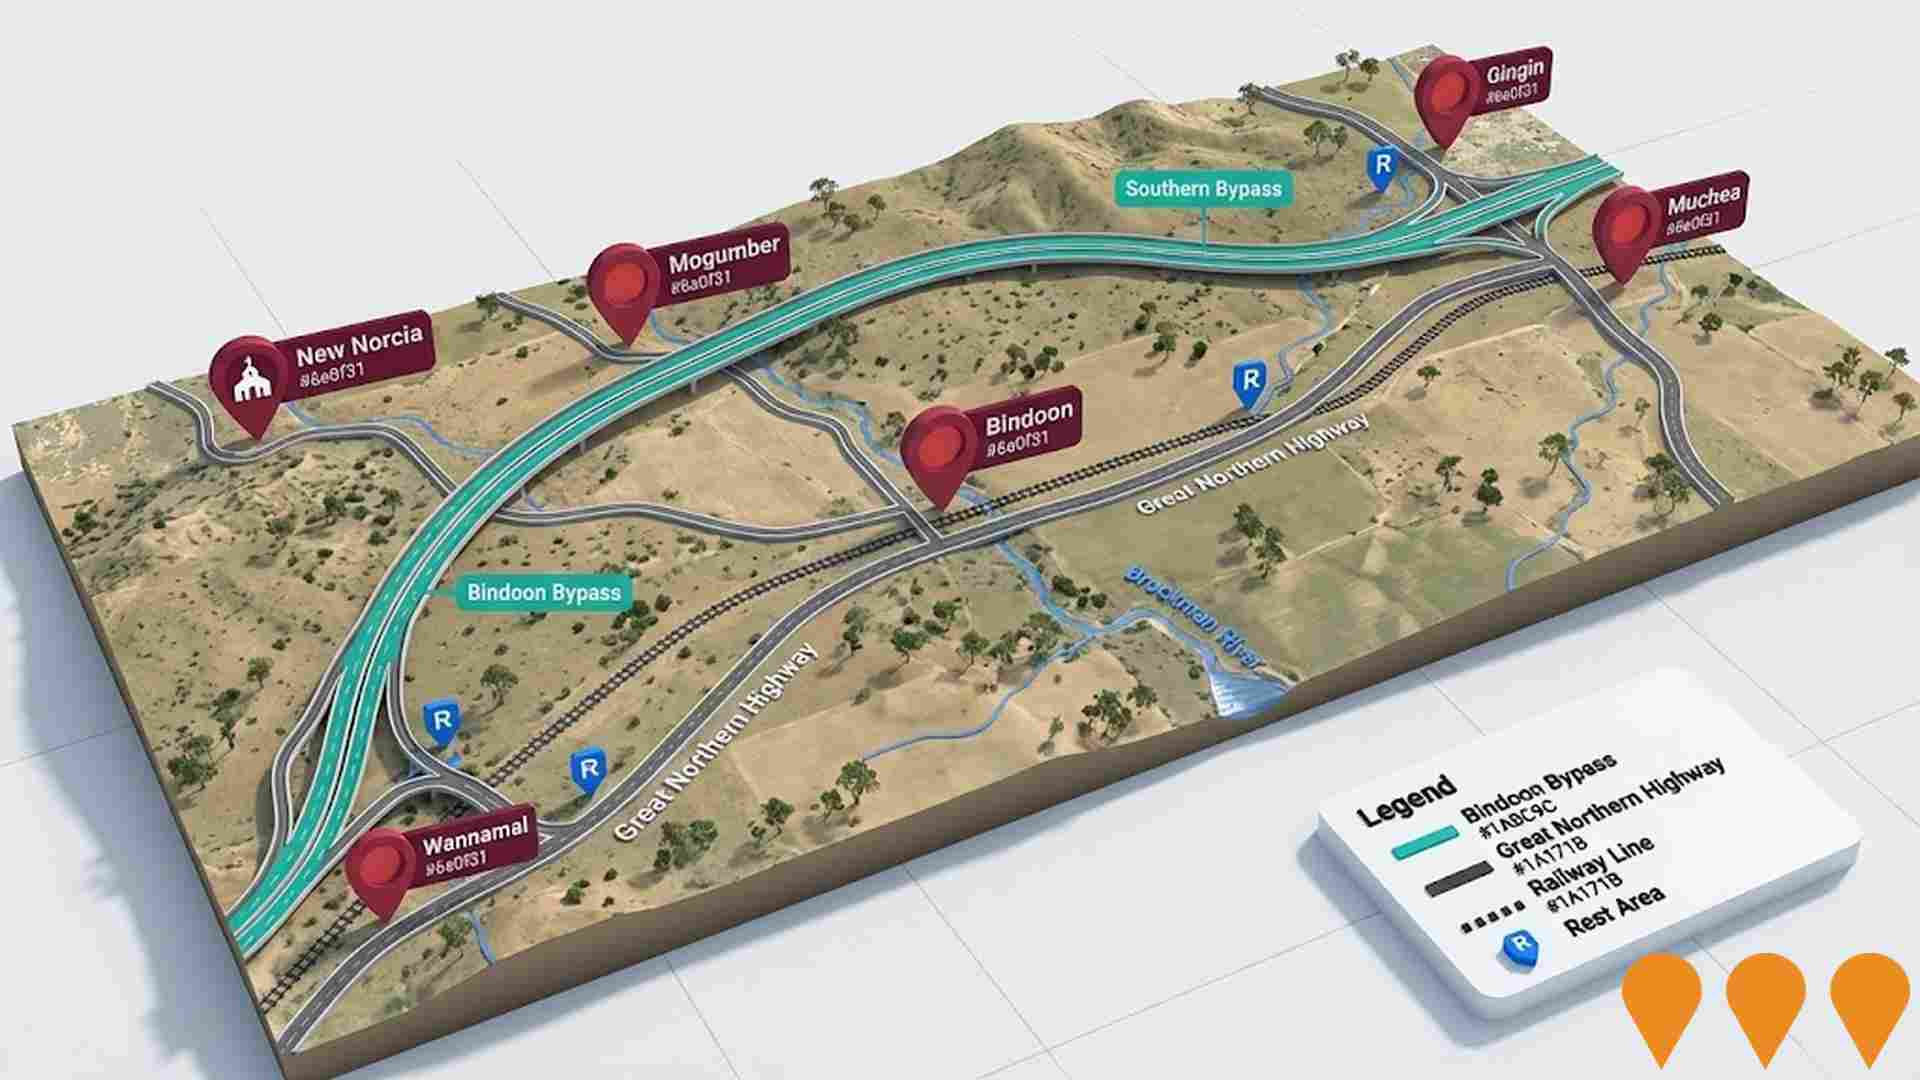
Bindoon Bypass
A new 64-kilometre section of the Great Northern Highway, bypassing the town of Bindoon. This project aims to improve travel times, road safety, and freight efficiency, enabling access for triple road trains to travel the entire length of the corridor down to Muchea. The project is jointly funded by the Australian Federal and State Governments.
Employment
Employment conditions in Moora demonstrate strong performance, ranking among the top 35% of areas assessed nationally
Moora has a balanced workforce with white and blue collar jobs, diverse sector representation, and an unemployment rate of 1.8%. As of September 2025, 2,708 residents are employed, with an unemployment rate of 1.4% lower than Rest of WA's rate of 3.3%.
Workforce participation is 62.2%, slightly higher than the regional average of 59.4%. The dominant employment sectors in Moora include agriculture, forestry & fishing, education & training, and health care & social assistance. Agriculture, forestry & fishing has a particularly strong presence with an employment share 3.9 times the regional level, while mining's presence is limited at 2.6% compared to the regional average of 11.7%. Many residents commute outside Moora for work based on Census data.
Between September 2024 and September 2025, Moora's labour force decreased by 4.5%, employment declined by 3.6%, causing unemployment to fall by 0.9 percentage points. In comparison, Rest of WA recorded employment growth of 1.4% and labour force growth of 1.2%. National employment forecasts from Jobs and Skills Australia for May-25 project a 6.6% increase over five years and 13.7% over ten years. Applying these projections to Moora's employment mix suggests local employment should increase by 4.5% over five years and 10.4% over ten years, though this is a simplified extrapolation for illustrative purposes and does not account for localized population projections.
Frequently Asked Questions - Employment
Income
The economic profile demonstrates above-average performance, with income metrics exceeding national benchmarks based on AreaSearch comparative assessment
The median income among taxpayers in Moora SA2 was $56,372 in financial year 2022. The average income stood at $70,409 during the same period. These figures compare to national averages of $57,323 and $71,163 respectively for Rest of WA. By September 2025, estimates based on a 14.2% growth in wages since financial year 2022 suggest median incomes will reach approximately $64,377 and average incomes will be around $80,407. According to census data, personal income ranks at the 65th percentile ($892 weekly) and household income sits at the 40th percentile. Income brackets indicate that 33.2% of individuals in Moora SA2 earn between $1,500 - 2,999 annually, consistent with metropolitan trends showing 31.1% in the same category. Housing costs allow for retention of 92.6% of income, but disposable income is below average at the 50th percentile. The area's SEIFA income ranking places it in the 5th decile.
Frequently Asked Questions - Income
Housing
Moora is characterized by a predominantly suburban housing profile, with above-average rates of outright home ownership
The dwelling structure in Moora, as per the latest Census, consisted of 93.8% houses and 6.2% other dwellings such as semi-detached homes, apartments, and 'other' dwellings. This compares to Non-Metro WA's figures of 95.6% houses and 4.4% other dwellings. Home ownership in Moora was at 47.4%, similar to Non-Metro WA's rate. The remaining dwellings were either mortgaged (27.0%) or rented (25.6%). The median monthly mortgage repayment in the area was $1,000, lower than Non-Metro WA's average of $1,425. The median weekly rent figure in Moora was recorded at $214, compared to Non-Metro WA's $231. Nationally, Moora's mortgage repayments were significantly lower than the Australian average of $1,863, while rents were substantially below the national figure of $375.
Frequently Asked Questions - Housing
Household Composition
Moora has a typical household mix, with a higher-than-average median household size
Family households constitute 68.5% of all households, including 28.0% couples with children, 32.0% couples without children, and 7.7% single parent families. Non-family households account for the remaining 31.5%, with lone person households at 29.5% and group households comprising 1.8%. The median household size is 2.4 people, larger than the Rest of WA average of 2.3.
Frequently Asked Questions - Households
Local Schools & Education
Moora faces educational challenges, with performance metrics placing it in the bottom quartile of areas assessed nationally
The area's university qualification rate is 16.4%, significantly lower than Australia's average of 30.4%. This disparity presents both a challenge and an opportunity for targeted educational initiatives. Bachelor degrees are the most prevalent at 13.3%, followed by postgraduate qualifications (1.7%) and graduate diplomas (1.4%). Vocational credentials are also common, with 35.7% of residents aged 15+ holding such qualifications - advanced diplomas at 7.8% and certificates at 27.9%.
Educational participation is high, with 30.4% of residents currently enrolled in formal education. This includes 13.5% in primary education, 10.2% in secondary education, and 1.6% pursuing tertiary education.
Frequently Asked Questions - Education
Schools Detail
Nearby Services & Amenities
Transport
Transport servicing is very low compared to other areas nationally based on assessment of service frequency, route connectivity and accessibility
Moora has 13 active public transport stops operating within its boundaries. These stops are served by a mix of buses running along two different routes. Together, these routes offer 12 weekly passenger trips.
The accessibility of public transport in Moora is rated as limited, with residents typically located 7330 meters away from the nearest transport stop. On average, each route provides one trip per day, resulting in approximately zero weekly trips per individual stop.
Frequently Asked Questions - Transport
Transport Stops Detail
Health
Moora's residents are relatively healthy in comparison to broader Australia with a fairly standard level of common health conditions seen across both young and old age cohorts
Moora's health metrics closely match national benchmarks, with common health conditions seen across both young and old age cohorts. Approximately 55% (~3,048 people) have private health cover, higher than the Rest of WA's 52.8%.
The most prevalent medical conditions are arthritis (8.2%) and asthma (8.1%). A total of 68.1% report no medical ailments, compared to 64.7% in Rest of WA. Moora has 19.1% (1,060 people) aged 65 and over, lower than the Rest of WA's 21.7%. Health outcomes among seniors are notably strong, outperforming general population health metrics.
Frequently Asked Questions - Health
Cultural Diversity
Moora ranks below the Australian average when compared to other local markets across a number of language and cultural background related metrics
Moora's population showed low cultural diversity, with 80.5% citizens, 84.0% born in Australia, and 93.8% speaking English only at home. Christianity was the dominant religion, comprising 53.4%. Judaism, however, had an overrepresentation of 0.2%, compared to 0.0% regionally.
The top three ancestry groups were English (32.2%), Australian (31.0%), and Scottish (7.8%). Notable divergences included New Zealand (1.2% vs regional 0.8%), Australian Aboriginal (6.8% vs 3.4%), and Filipino (2.4% vs 1.0%).
Frequently Asked Questions - Diversity
Age
Moora's median age exceeds the national pattern
The median age in Moora is 43 years, which is slightly higher than the Rest of WA's average of 40 years and well above the Australian median of 38 years. Compared to the Rest of WA average, the 55-64 age cohort is notably over-represented in Moora at 14.5%, while the 35-44 age group is under-represented at 11.7%. Between the 2021 Census and the present, the 25 to 34 age group has grown from 11.2% to 12.9% of Moora's population. Conversely, the 5 to 14 age cohort has declined from 13.7% to 12.2%. Population forecasts for 2041 indicate substantial demographic changes in Moora. The 25 to 34 age group is projected to expand by 105 people (a 15% increase) from 712 to 818. Meanwhile, the 75 to 84 and 85+ age cohorts are expected to experience population declines.
