Chart Color Schemes
This analysis uses ABS Statistical Areas Level 2 (SA2) boundaries, which can materially differ from Suburbs and Localities (SAL) even when sharing similar names.
SA2 boundaries are defined by the Australian Bureau of Statistics and are designed to represent communities for statistical reporting (e.g., census and ERP).
Suburbs and Localities (SAL) represent commonly-used suburb/locality names (postal-style areas) and may use different geographic boundaries. For comprehensive analysis, consider reviewing both boundary types if available.
est. as @ -- *
ABS ERP | -- people | --
2021 Census | -- people
Sales Activity
Curious about local property values? Filter the chart to assess the volume and appreciation (including resales) trends and regional comparisons, or scroll to the map below view this information at an individual property level.
Find a Recent Sale
Sales Detail
Population
Morawa has shown very soft population growth performance across periods assessed by AreaSearch
Morawa's population is approximately 4,103 as of November 2025. This figure represents an increase of 227 people, a rise of 5.9% since the 2021 Census which recorded a population of 3,876. The growth is inferred from ABS data showing an estimated resident population of 4,077 in June 2024 and an additional 10 validated new addresses since the Census date. This results in a population density of 0.20 persons per square kilometer. Morawa's growth rate of 5.9% since the census is within 1.6 percentage points of the SA3 area's growth rate of 7.5%, indicating competitive growth fundamentals. Natural growth contributed approximately 52.8% of overall population gains during recent periods.
AreaSearch uses ABS/Geoscience Australia projections for each SA2 area, released in 2024 with a base year of 2022. For areas not covered by this data and post-2032 growth estimates, AreaSearch employs the growth rates by age cohort provided by the ABS in its latest Greater Capital Region projections (released in 2023, based on 2022 data). Considering projected demographic shifts, Morawa is expected to increase by just below the median of Australian non-metropolitan areas. By 2041, the population is projected to rise by 358 persons from the latest annual ERP population numbers, reflecting an overall increase of 8.1% over the 17-year period.
Frequently Asked Questions - Population
Development
Residential development activity is lower than average in Morawa according to AreaSearch's national comparison of local real estate markets
Morawa has recorded approximately 15 residential properties granted approval per year over the past five financial years, totalling 78 homes. As of FY-26, seven approvals have been recorded. On average, 1.6 people moved to the area annually for each dwelling built between FY-21 and FY-25. This indicates a balanced supply and demand, creating stable market conditions with an average construction value of $319,000 per dwelling.
In FY-26, $4.1 million in commercial approvals have been registered, reflecting the area's primarily residential nature. Morawa maintains similar construction rates per person compared to the Rest of WA, preserving market equilibrium consistent with surrounding areas. Recent development has consisted entirely of detached dwellings, maintaining the area's low density character and attracting space-seeking buyers, with around 313 people per dwelling approval.
According to AreaSearch's latest quarterly estimate, Morawa is expected to grow by 332 residents through to 2041. At current development rates, new housing supply should comfortably meet demand, providing good conditions for buyers and potentially supporting growth beyond current population projections.
Frequently Asked Questions - Development
Infrastructure
Morawa has limited levels of nearby infrastructure activity, ranking in the 15thth percentile nationally
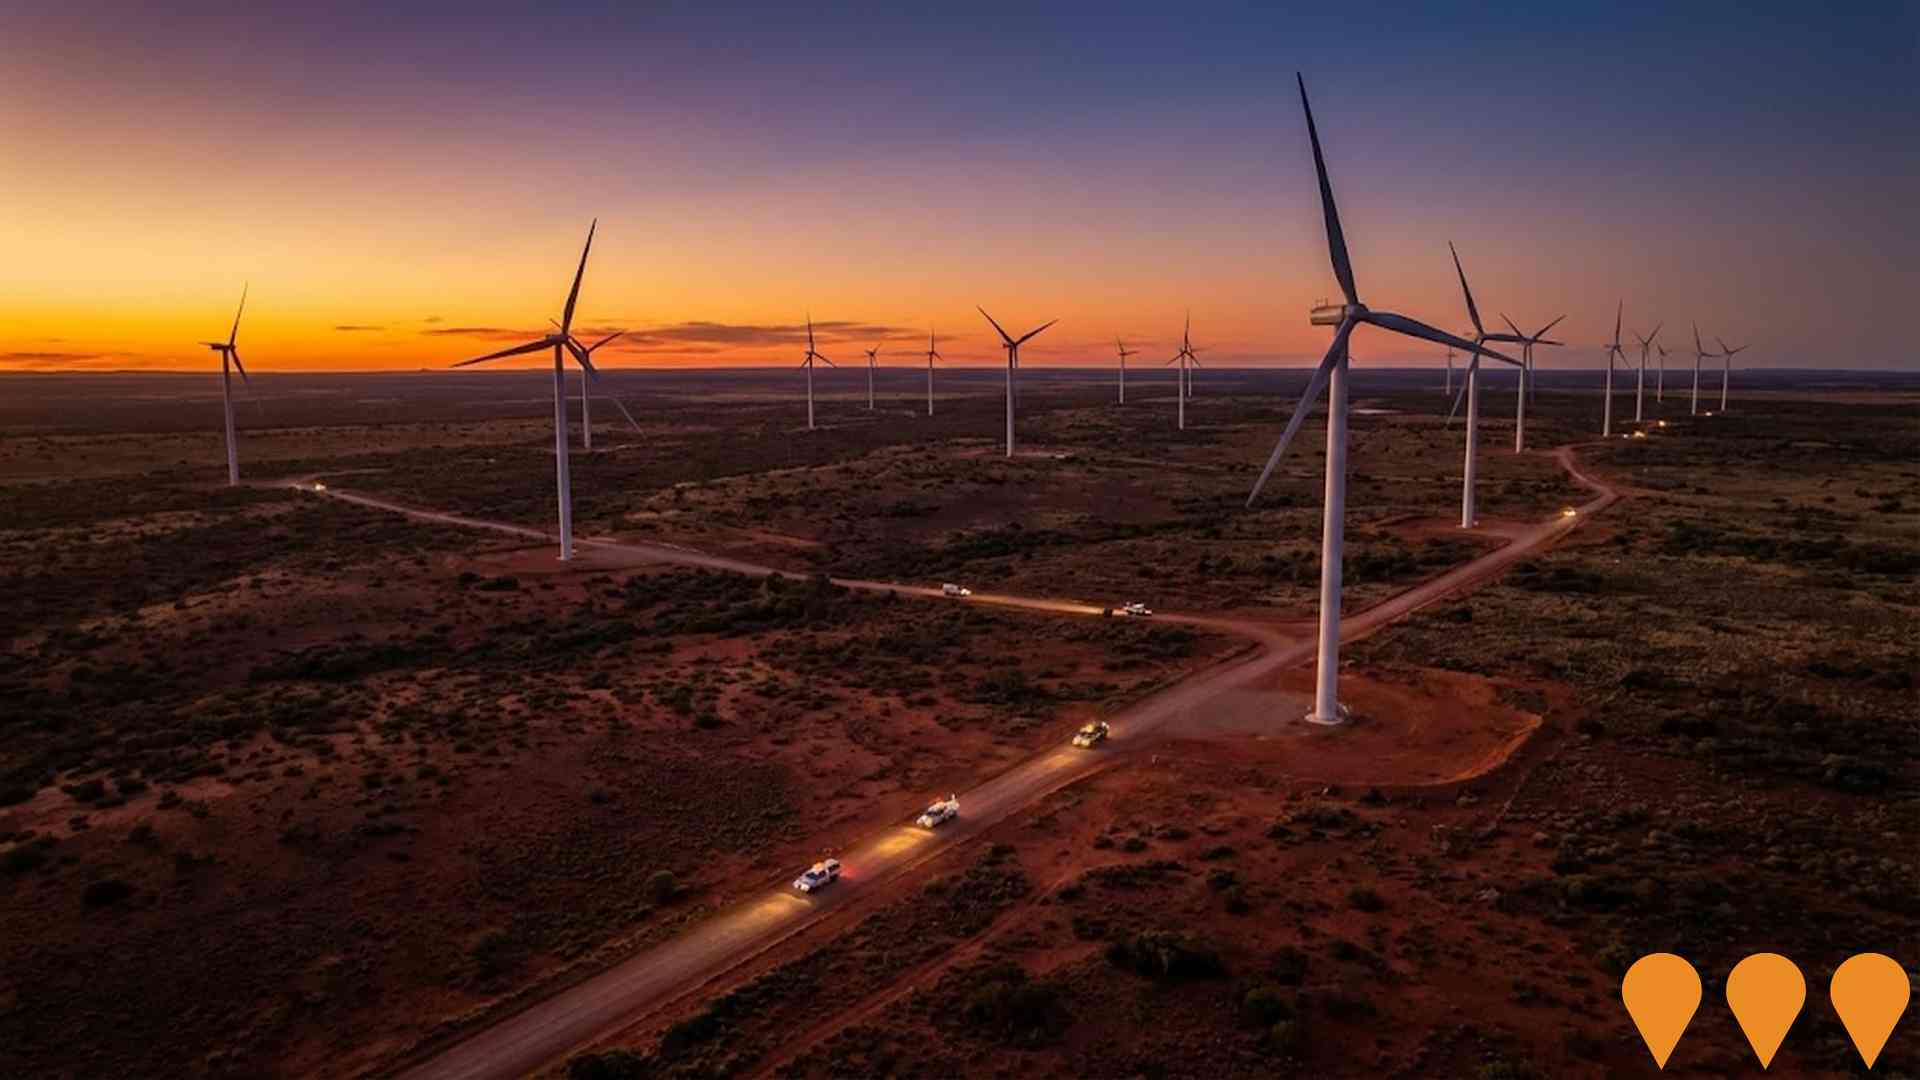
Changes to local infrastructure significantly influence an area's performance. AreaSearch has identified 14 projects likely impacting the area. Notable ones include Warradarge Wind Farm, Iluka Eneabba Rare Earths Refinery, Twin Hills Wind Farm, and Eneabba Mineral Sands Mine. The following list details those most relevant.
Professional plan users can use the search below to filter and access additional projects.
INFRASTRUCTURE SEARCH
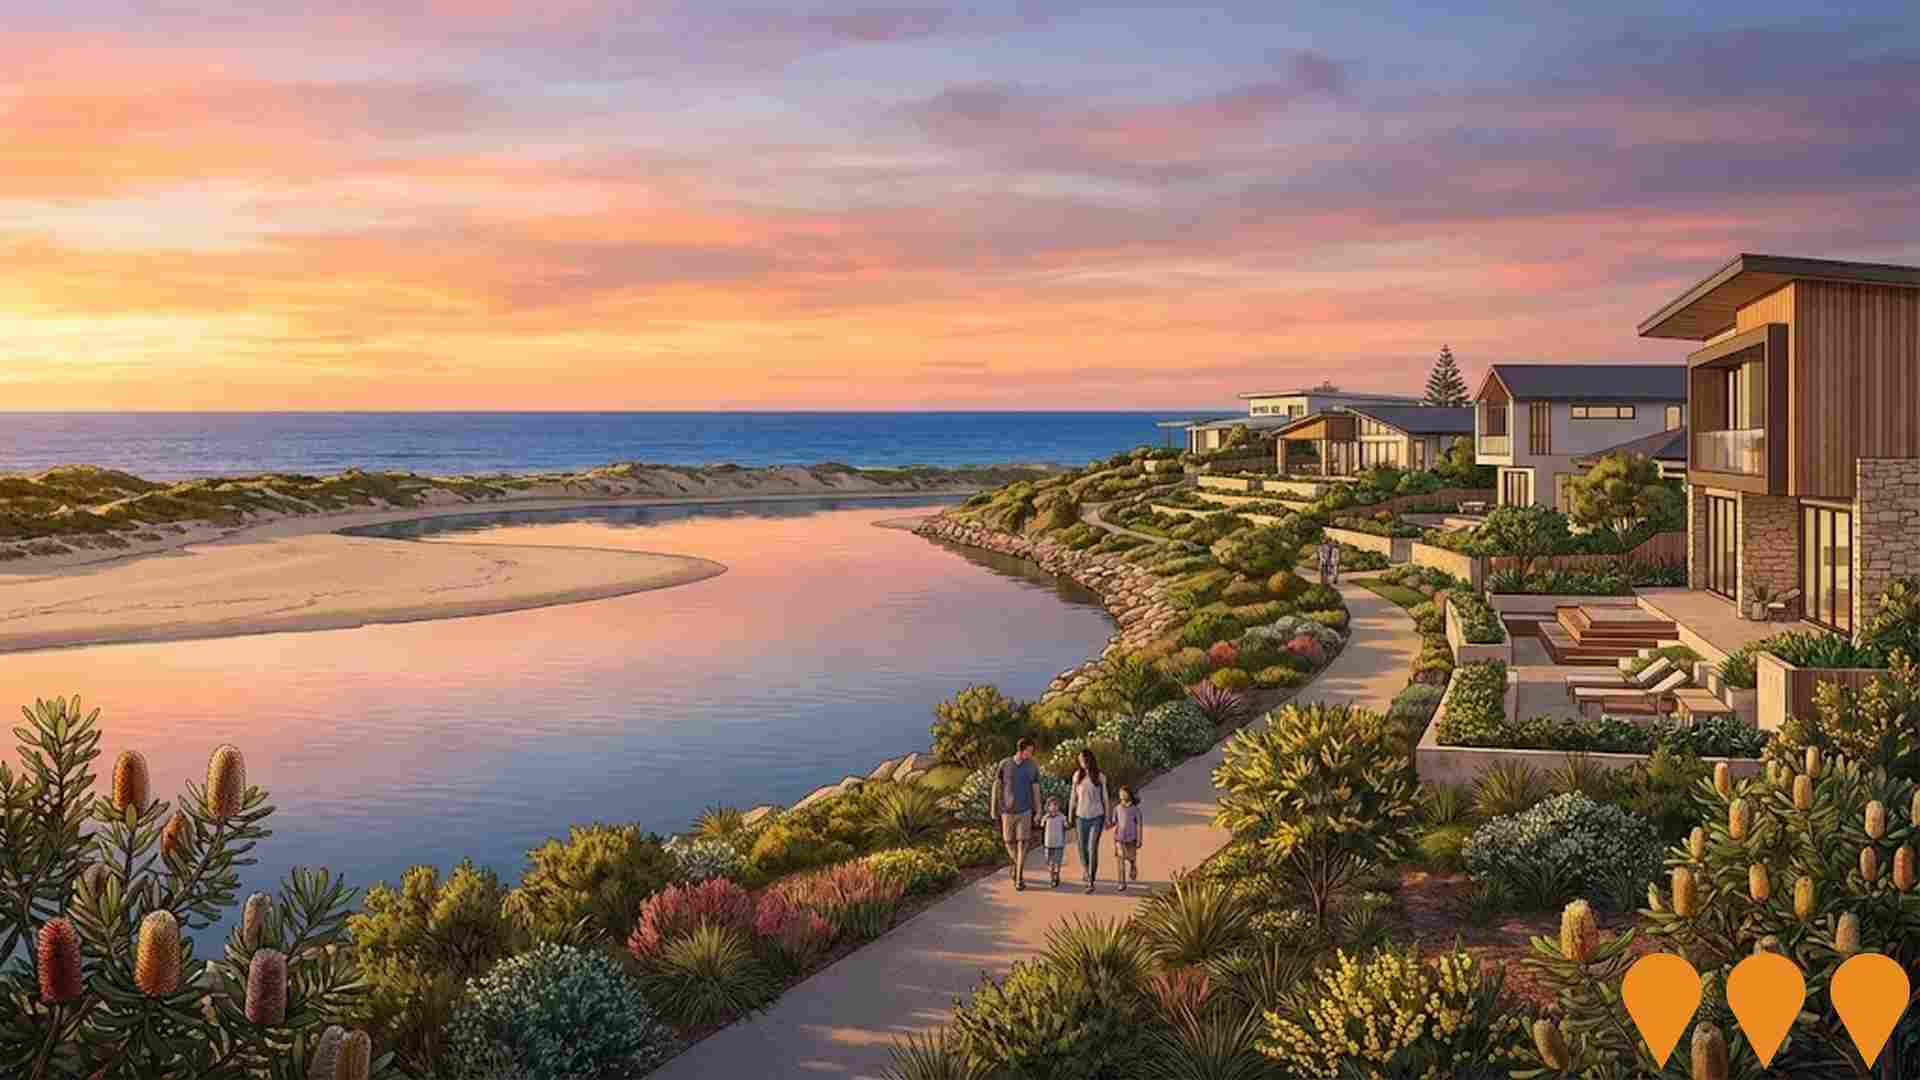
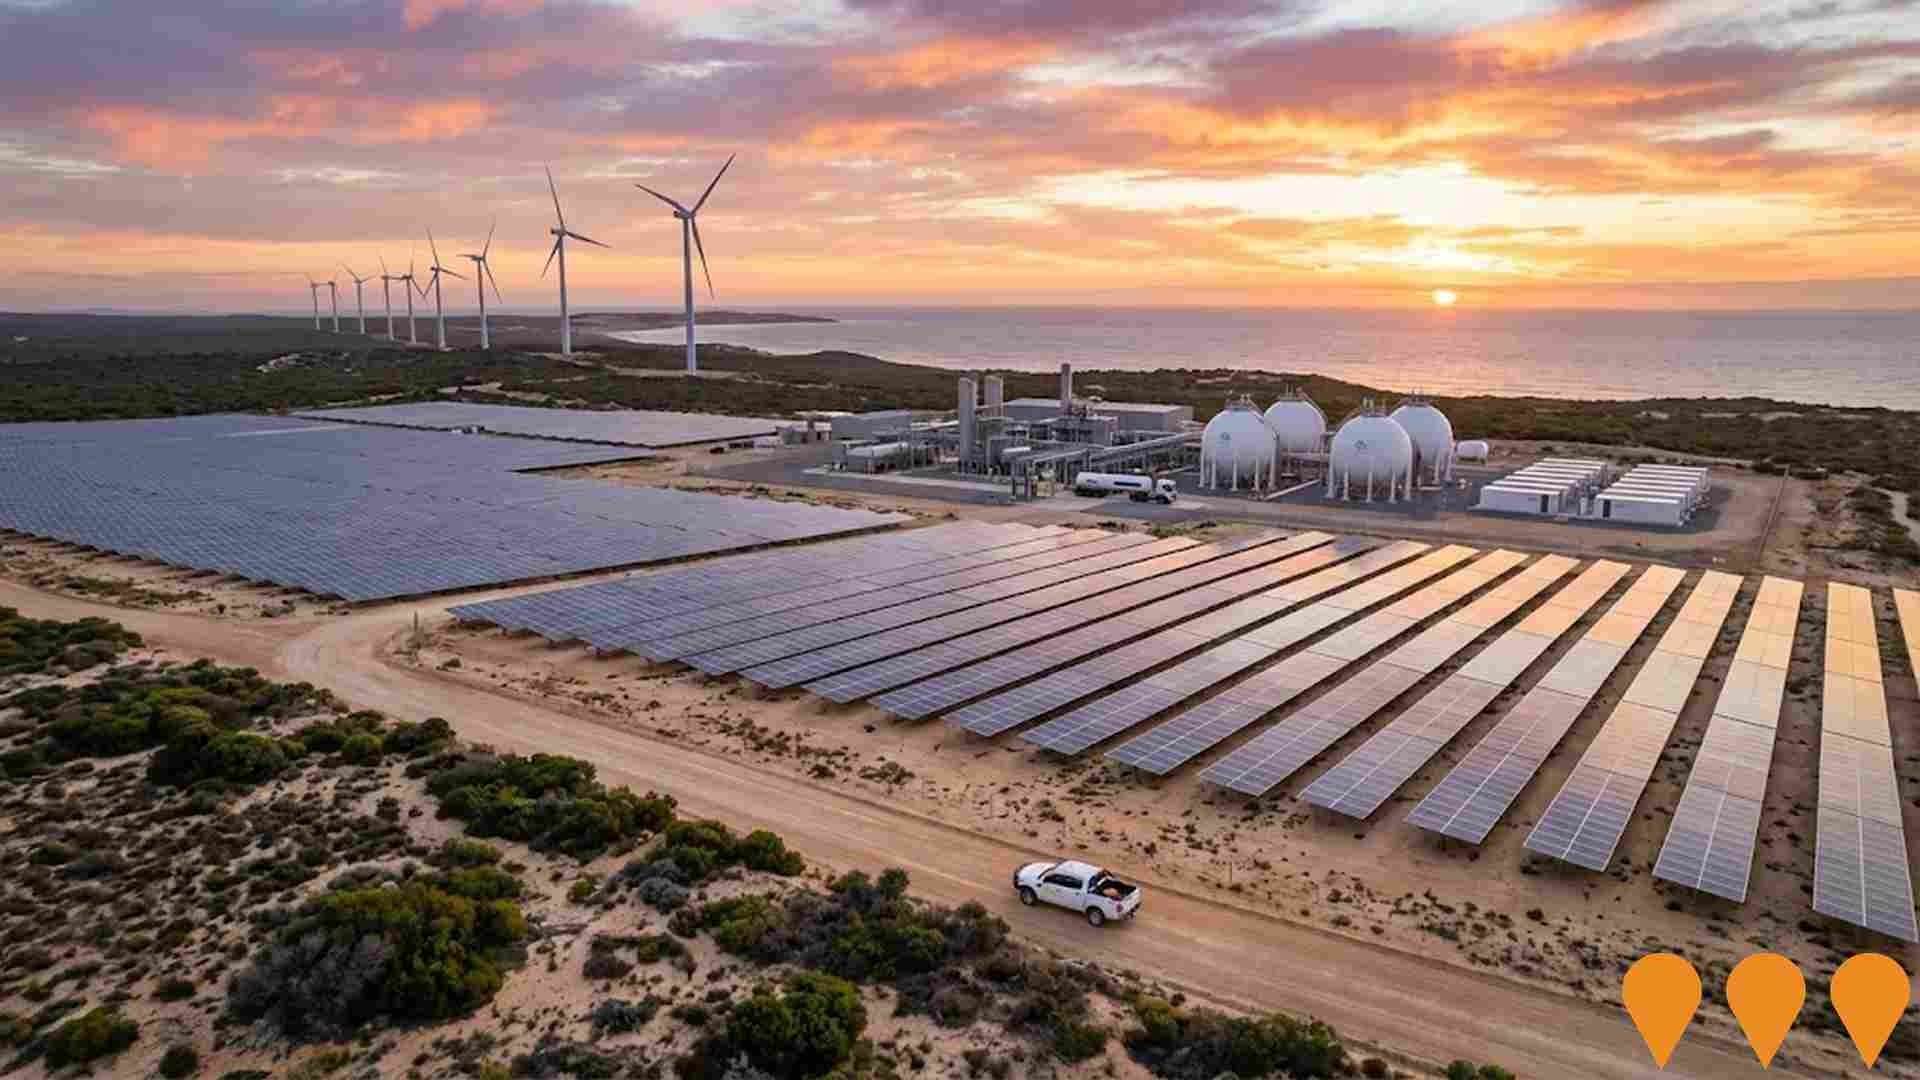
 Denotes AI-based impression for illustrative purposes only, not to be taken as definitive under any circumstances. Please follow links and conduct other investigations from the project's source for actual imagery. Developers and project owners wishing us to use original imagery please Contact Us and we will do so.
Frequently Asked Questions - Infrastructure
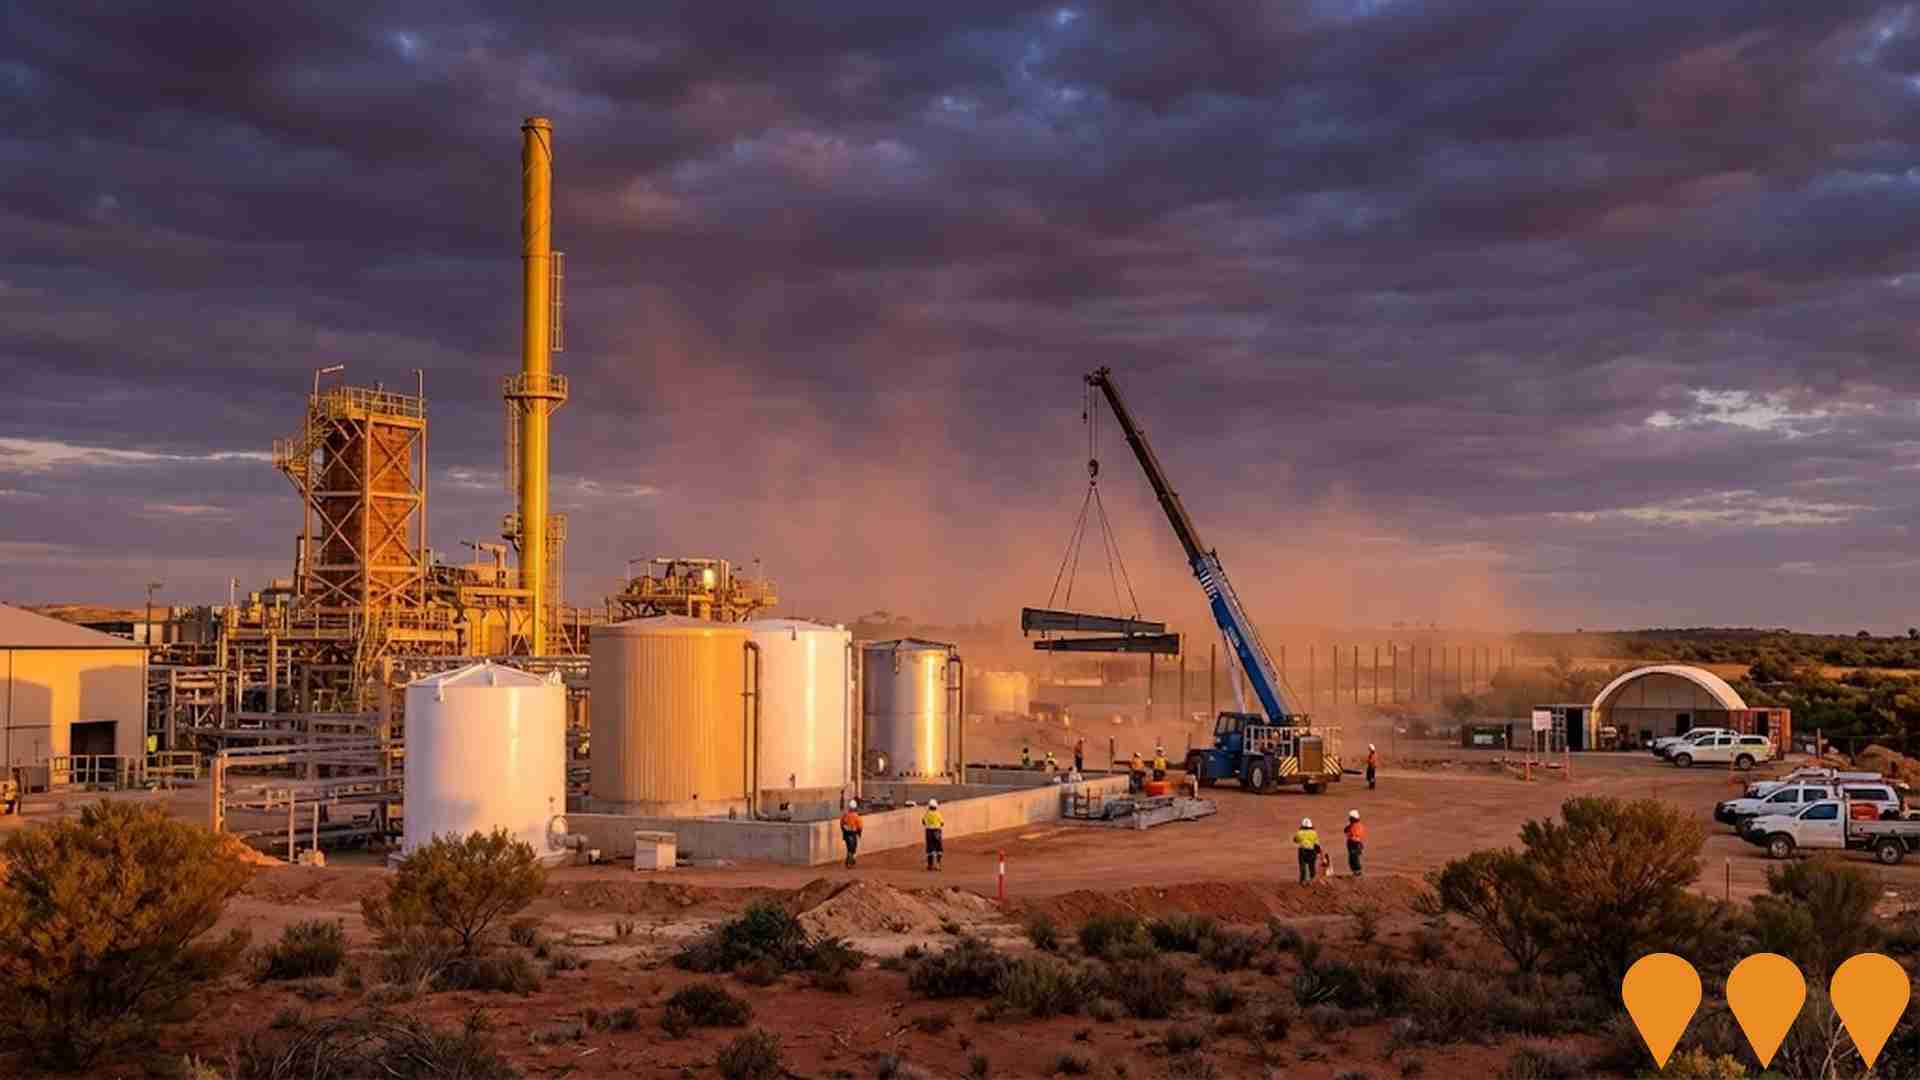
Iluka Eneabba Rare Earths Refinery
Australia's first fully integrated rare earths refinery producing separated rare earth oxides (including NdPr and Dy/Tb). Backed by an Australian Government non-recourse loan, the Eneabba facility is designed to process Iluka and third-party concentrates with a total capacity up to 23,000 tpa REO (including up to 5,500 tpa NdPr and ~725 tpa Dy/Tb). Commissioning is targeted for 2027.
Waitsia Gas Project Stage 2
Further development of the Waitsia onshore gas field near Dongara (Perth Basin). Stage 2 adds additional production wells and a new Waitsia Gas Plant designed for up to 250 TJ/day, with gas exported via the Dampier to Bunbury Natural Gas Pipeline to the North West Shelf for LNG processing, and later to the WA domestic market. As of mid-2025 the plant is in final commissioning with ongoing delays disclosed by the joint venture; first sustained sales gas is targeted following resolution of quality issues.

Lockyer Conventional Gas Project
Development of a central gas processing facility (CPF) by Mineral Resources with a nominal production capacity of 250 terajoules per day, associated pipelines, and up to six natural gas production wellheads. The project aims to supply the WA domestic gas market and potentially LNG export. Located in Petroleum Exploration Permits EP 368 and 426 in the onshore Perth Basin, the facility will collect natural gas from conventional wells and transport via gas gathering lines to a central processing facility. Processed gas will then be transported via an export pipeline to the Dampier to Bunbury Natural Gas Pipeline. The proposal is currently under assessment by the EPA and involves clearing up to 6.2 hectares of native vegetation within a 304.5 ha Development Envelope.
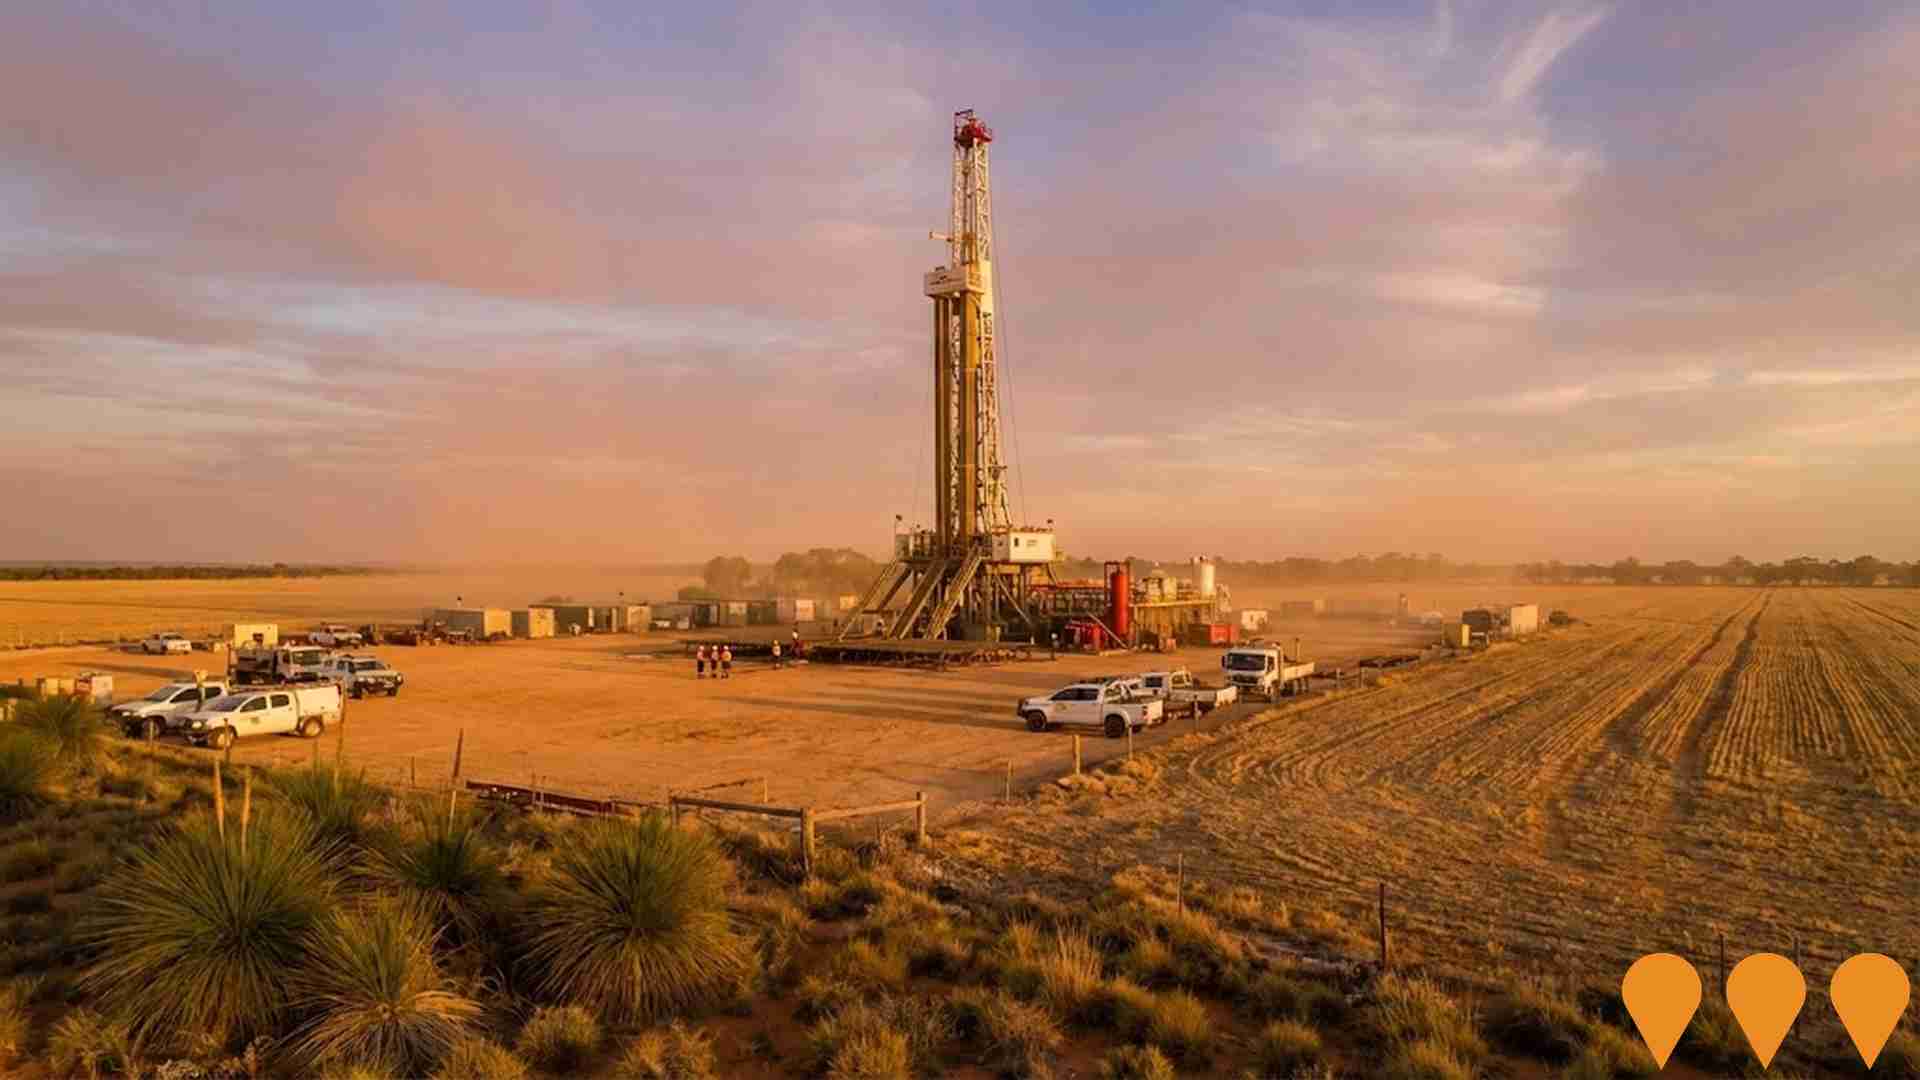
Eneabba Mineral Sands Mine
A major mineral sands mine producing zircon and high-grade titanium oxide products of rutile. The mine has been in operation for many years and is a significant contributor to the local economy.
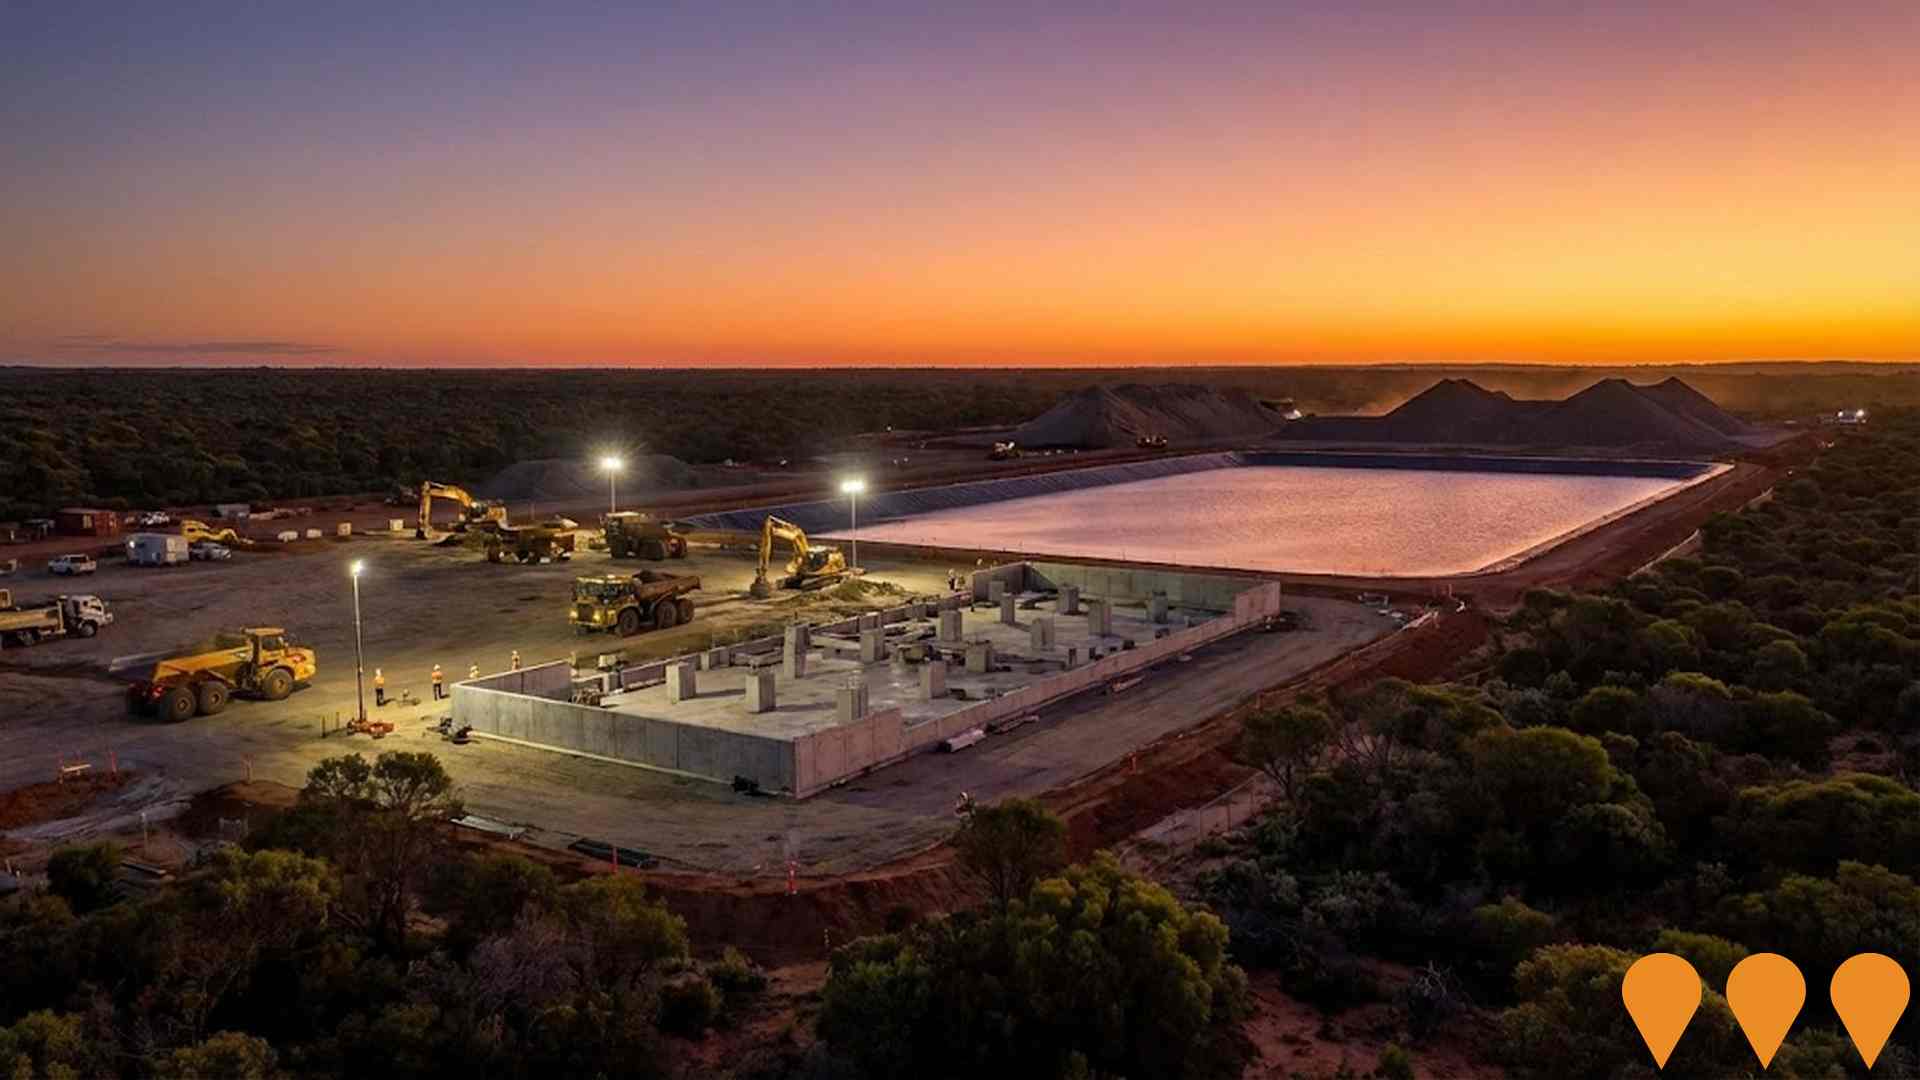
30799 Brand Highway (Bonniefield) Residential Development
Residential subdivision within Bonniefield, approximately 3 km north of Dongara and 1.5 km from the coast. Local Structure Plan (Lots 4, 5 and 10) endorsed to guide low-density residential development with POS, boulevard entry from Brand Highway and path network. Marketing materials indicate subdivision approved for about 81 rural-residential lots on roughly 48 ha.

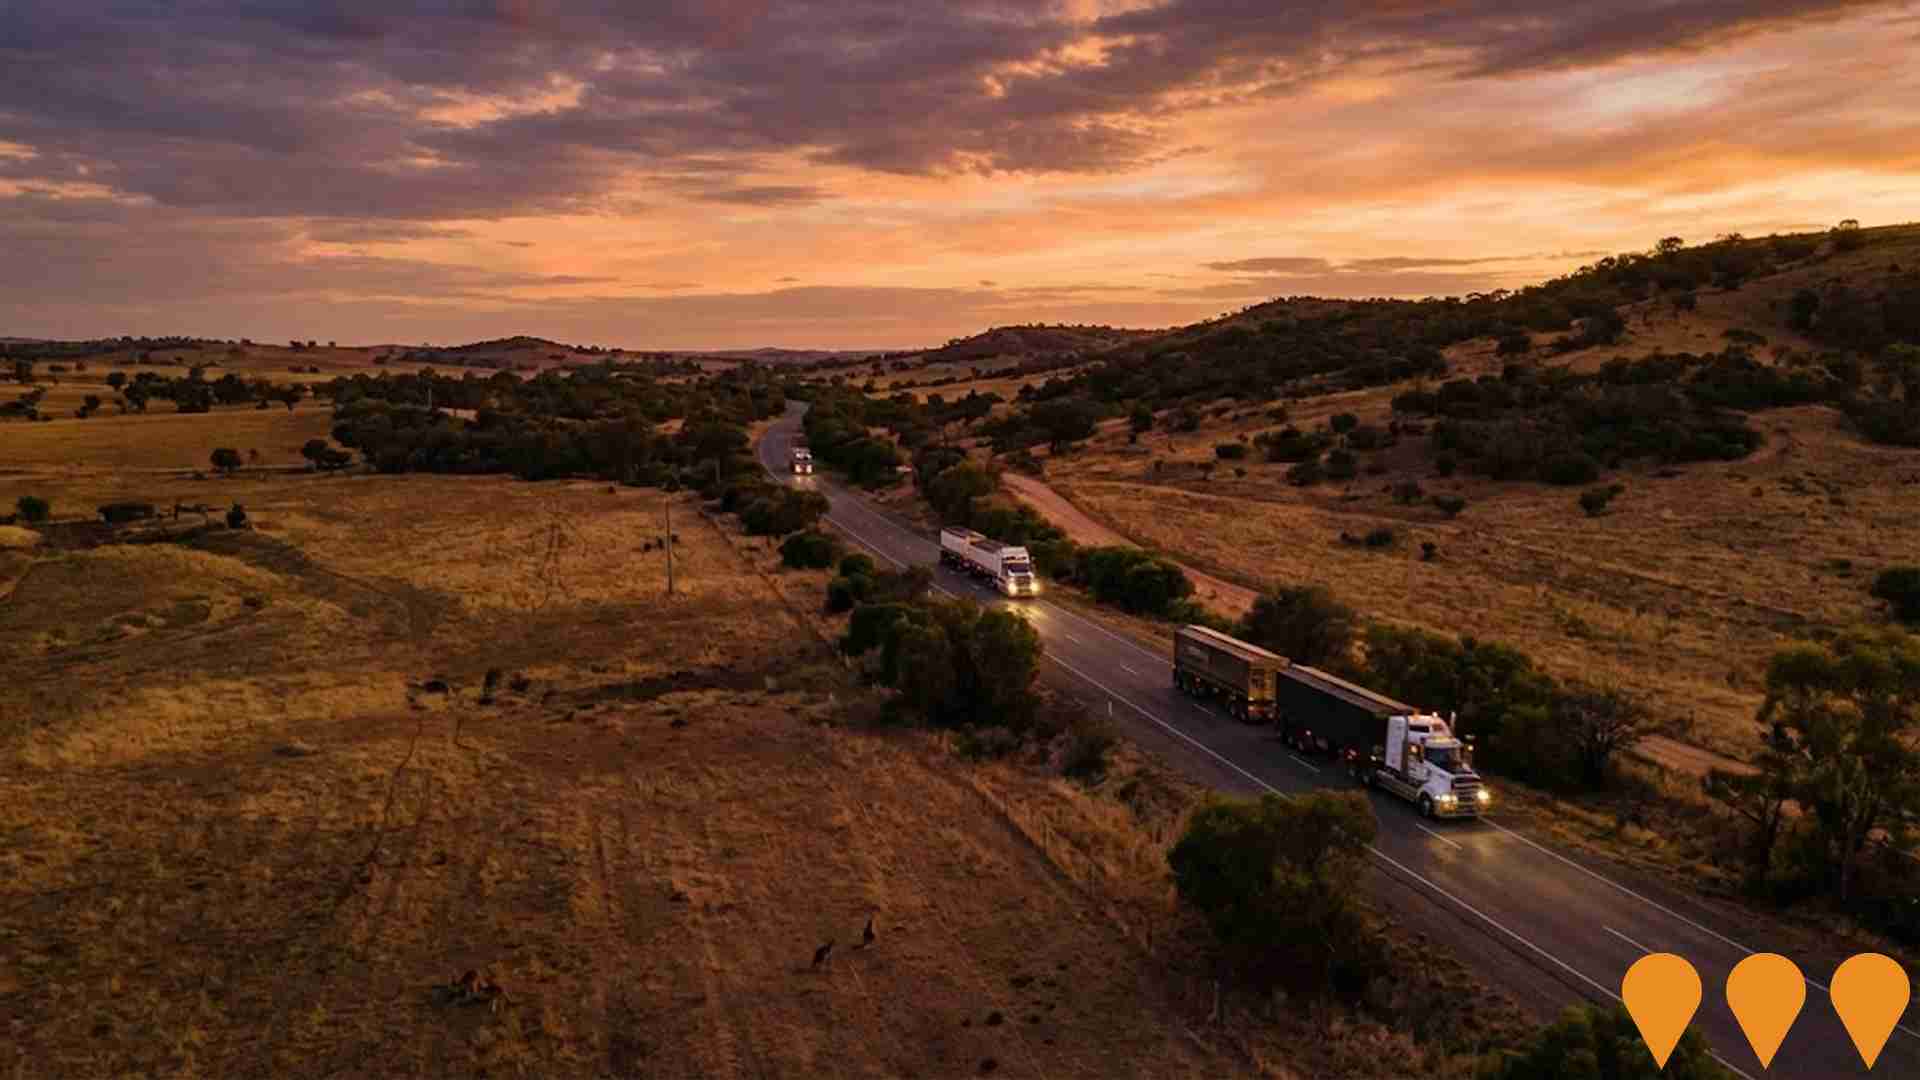
Dongara-Geraldton-Northampton Route (DGN Route)
Planning for a resilient future road freight corridor between Perth and the north-west of Western Australia to cater for long-term transport needs. This project aims to divert heavy vehicles away from regional townsites, minimise conflicts with local traffic, and enhance overall road user safety and efficiency. The Alignment Definition phase is expected to take around three years, with no construction in the Dongara to Geraldton section anticipated in the short to medium term.
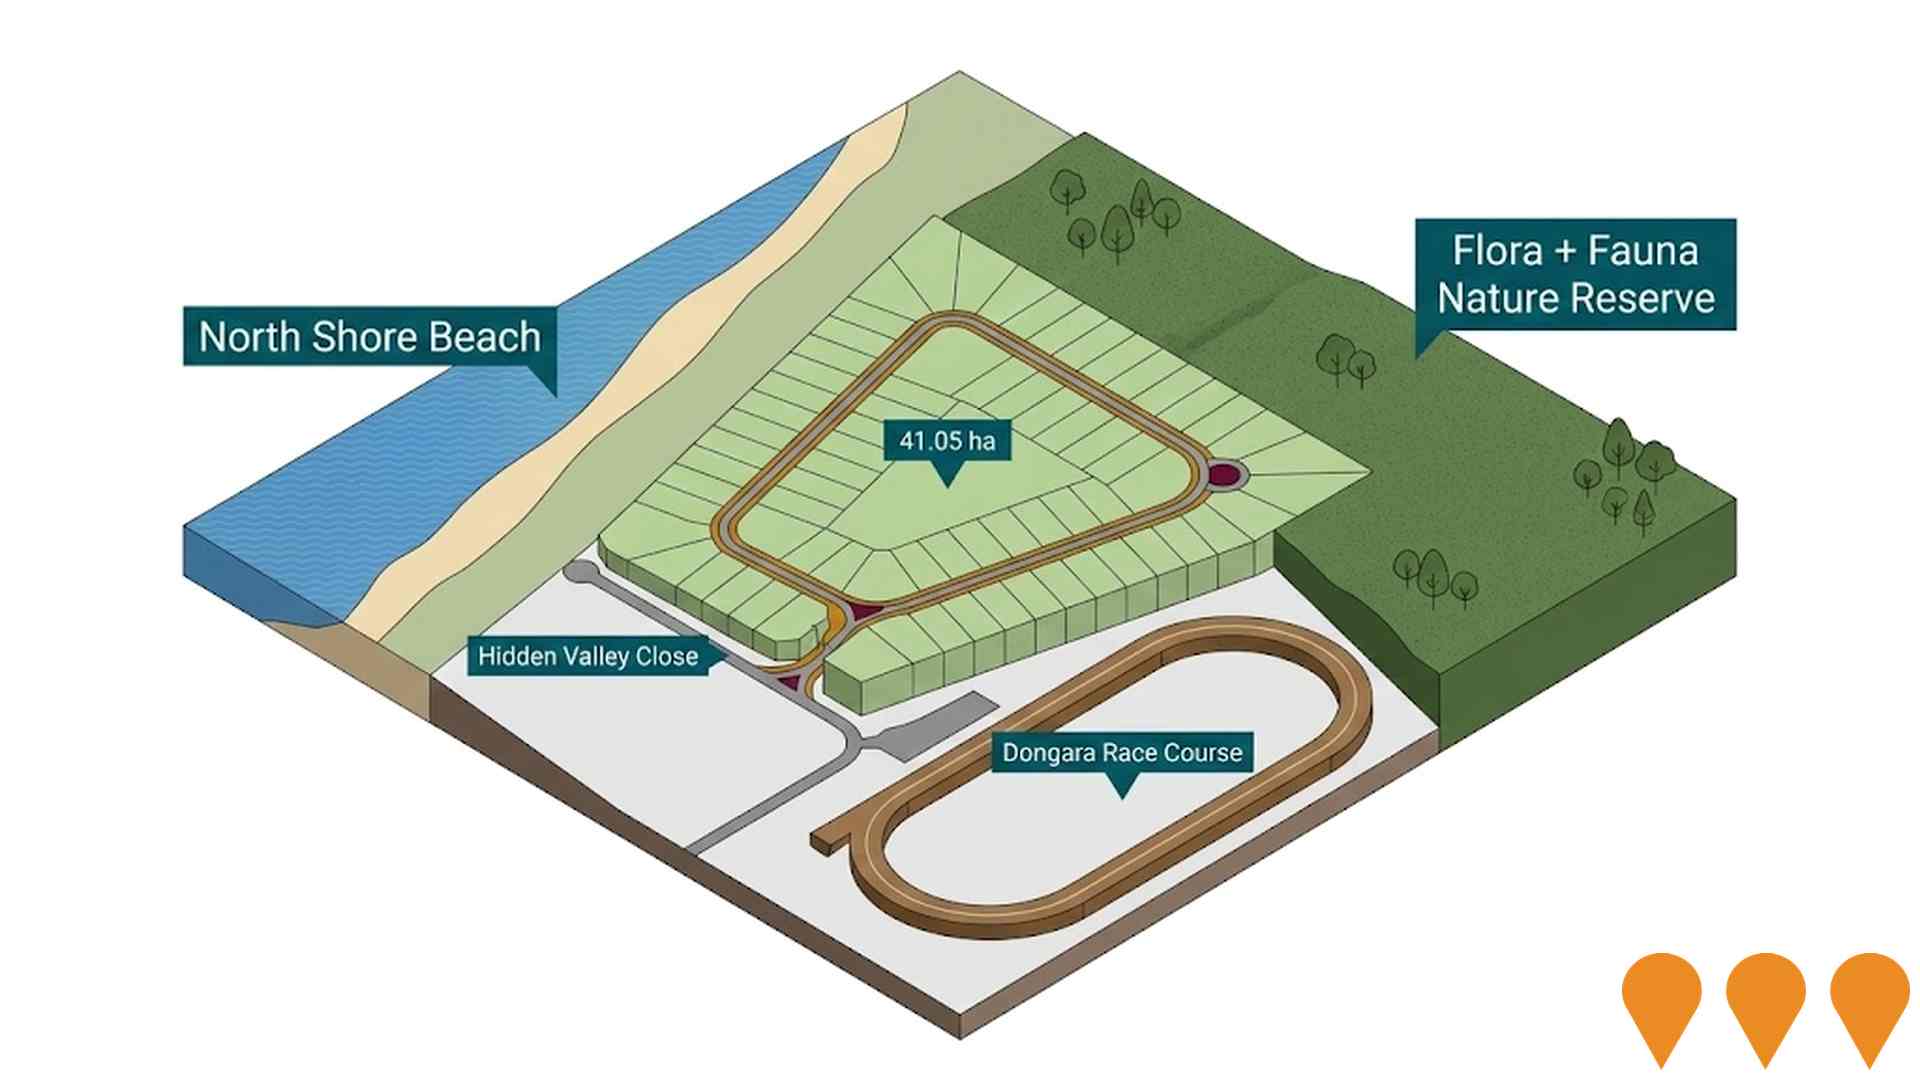
Hidden Valley Estate
A coastal residential land subdivision of approximately 41.05 hectares (103 acres) with Development Approval for 81 residential lots. The land is zoned 'Residential' R12:5 and offers a pleasant outlook due to an adjoining nature reserve.
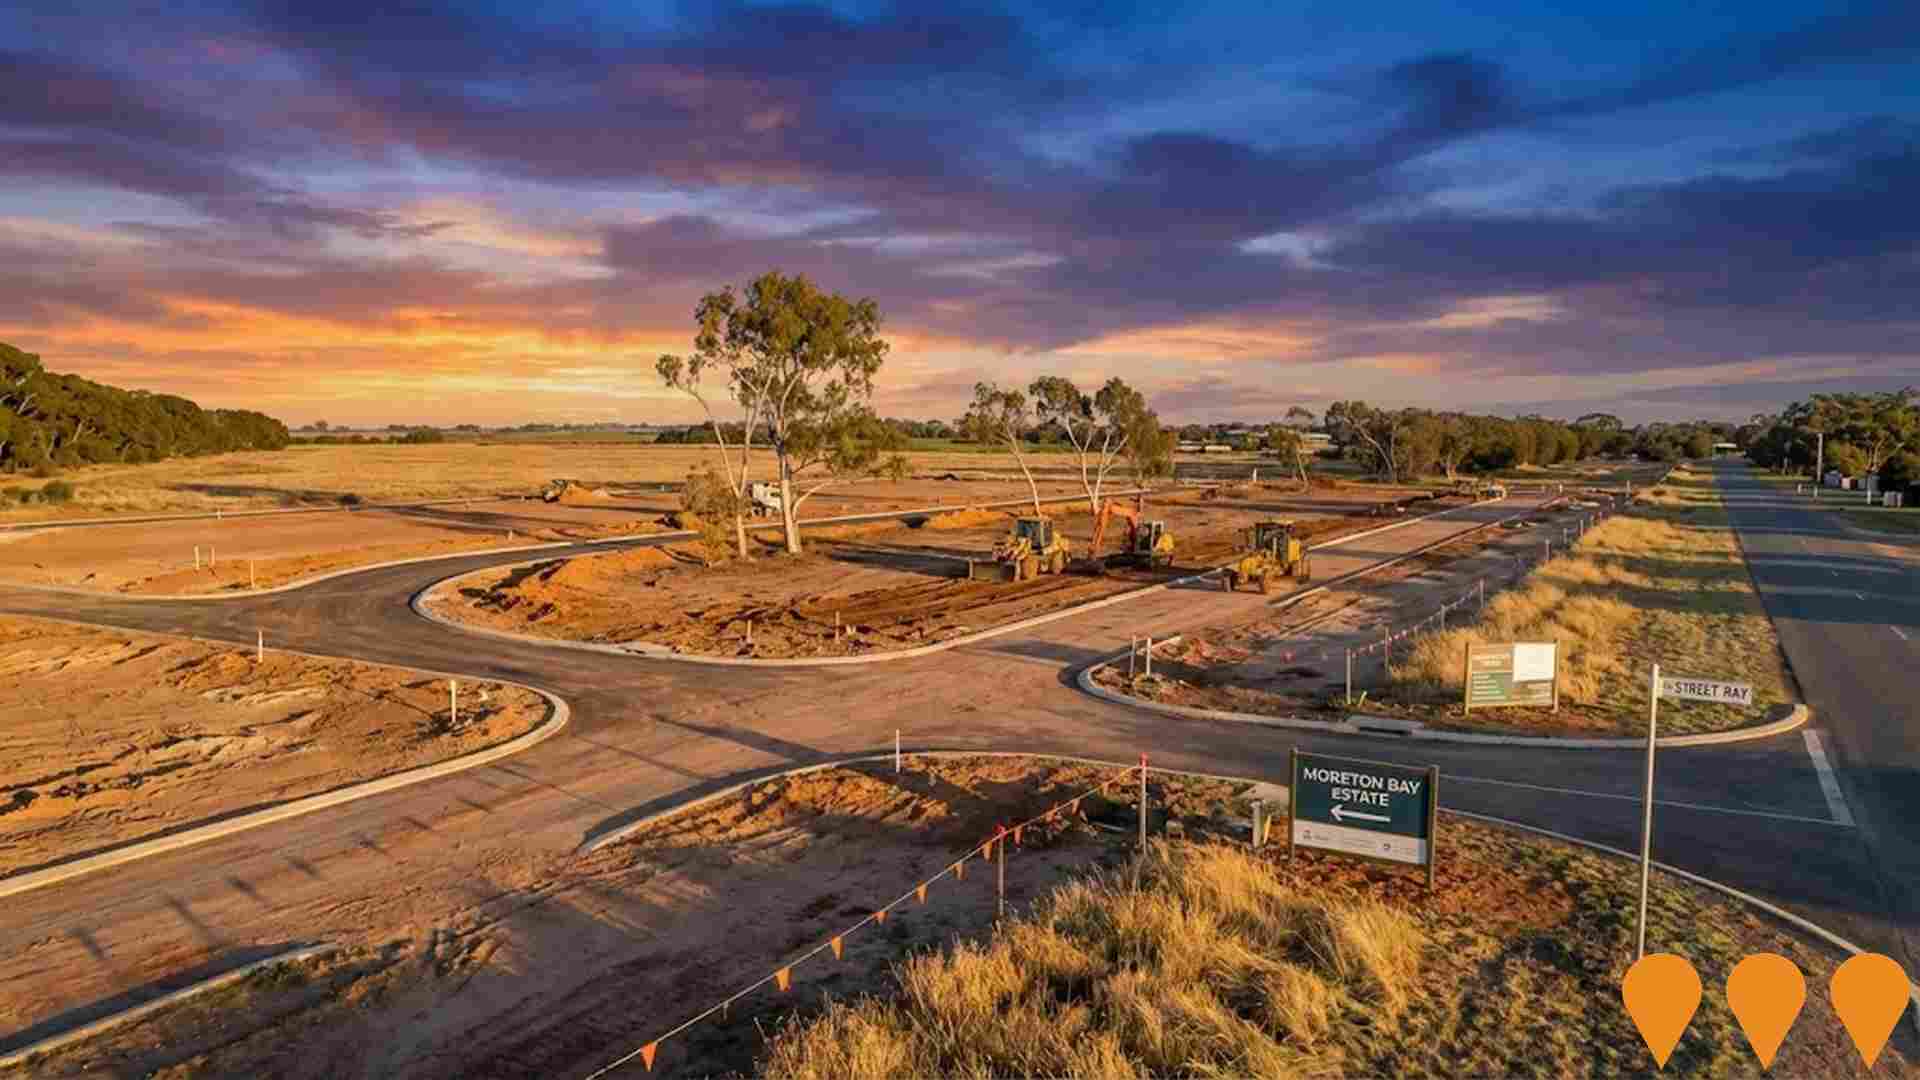
Moreton Bay Estate
A residential land estate proposed in Dongara, offering land for sale. Further specific details are limited, but it contributes to the residential development landscape of the area.
Employment
Morawa has seen below average employment performance when compared to national benchmarks
Morawa has a balanced workforce with diverse sector representation. As of September 2025, the unemployment rate is 3.5%.
The key industries are agriculture, forestry & fishing, public administration & safety, and education & training. Agriculture, forestry & fishing employment levels are at 4.0 times the regional average. Conversely, health care & social assistance shows lower representation at 5.1% versus the regional average of 11.9%. Many residents commute elsewhere for work based on Census data.
During September 2024 to September 2025, employment levels increased by 0.3%, and labour force increased by 0.5%, causing unemployment rate to rise by 0.2 percentage points. National employment forecasts from May-25 suggest Morawa's employment should increase by 4.3% over five years and 10.2% over ten years, based on industry-specific projections.
Frequently Asked Questions - Employment
Income
Income levels sit below national averages according to AreaSearch assessment
AreaSearch's aggregation of ATO data for financial year 2022 shows Morawa SA2 had a median taxpayer income of $51,245 and an average income of $65,676. These figures align with national averages and compare to Rest of WA's $57,323 (median) and $71,163 (average). Based on Wage Price Index growth of 14.2% since financial year 2022, current estimates for Morawa SA2 would be approximately $58,522 (median) and $75,002 (average) as of September 2025. According to the 2021 Census, household incomes rank at the 20th percentile while personal income ranks at the 42nd percentile. Income distribution data indicates that 29.3% of Morawa SA2's population falls within the $1,500 - $2,999 range, similar to regional levels where 31.1% occupy this range. Housing costs are manageable with 93.8% retained, but disposable income ranks below average at the 34th percentile.
Frequently Asked Questions - Income
Housing
Morawa is characterized by a predominantly suburban housing profile, with above-average rates of outright home ownership
In Morawa, as per the latest Census evaluation, 95.5% of dwellings were houses with the remaining 4.5% being semi-detached, apartments, or other types. This compares to Non-Metro WA's figures of 87.5% houses and 12.5% other dwellings. Home ownership in Morawa stood at 54.9%, with mortgaged dwellings accounting for 21.6% and rented ones making up 23.5%. The median monthly mortgage repayment was $800, lower than Non-Metro WA's average of $1,517. The median weekly rent in Morawa was recorded at $175, compared to Non-Metro WA's $250. Nationally, Morawa's mortgage repayments were significantly lower than the Australian average of $1,863, with rents substantially below the national figure of $375.
Frequently Asked Questions - Housing
Household Composition
Morawa features high concentrations of lone person households, with a lower-than-average median household size
Family households account for 65.3% of all households, including 22.3% couples with children, 36.6% couples without children, and 5.9% single parent families. Non-family households constitute the remaining 34.7%, with lone person households at 33.8% and group households comprising 1.2%. The median household size is 2.2 people, which is smaller than the Rest of WA average of 2.4.
Frequently Asked Questions - Households
Local Schools & Education
Morawa faces educational challenges, with performance metrics placing it in the bottom quartile of areas assessed nationally
The area's university qualification rate is 15.2%, significantly lower than the Australian average of 30.4%. Bachelor degrees are the most common at 11.0%, followed by graduate diplomas (2.3%) and postgraduate qualifications (1.9%). Vocational credentials are prevalent, with 41.9% of residents aged 15+ holding them, including advanced diplomas (8.7%) and certificates (33.2%). Educational participation is high at 31.4%, comprising 15.1% in primary education, 7.3% in secondary education, and 2.3% in tertiary education.
Educational participation is notably high, with 31.4% of residents currently enrolled in formal education. This includes 15.1% in primary education, 7.3% in secondary education, and 2.3% pursuing tertiary education.
Frequently Asked Questions - Education
Schools Detail
Nearby Services & Amenities
Transport
Transport servicing is very low compared to other areas nationally based on assessment of service frequency, route connectivity and accessibility
Morawa has 23 active public transport stops, all of which are bus stops. These stops are served by four different routes that combined offer 19 weekly passenger trips. The accessibility of these services is limited, with residents typically living 742 meters away from the nearest stop.
On average, each route provides two trips per day, resulting in approximately zero weekly trips per individual stop.
Frequently Asked Questions - Transport
Transport Stops Detail
Health
Health performance in Morawa is lower than average with common health conditions somewhat prevalent across both younger and older age cohorts
Morawa faces significant health challenges with common health conditions somewhat prevalent across both younger and older age cohorts.
The rate of private health cover in Morawa is approximately 52%, leading that of the average SA2 area. This covers around 2,149 people. The most common medical conditions are arthritis and asthma, affecting 9.8% and 7.4% of residents respectively. Meanwhile, 65.8% of residents declare themselves completely clear of medical ailments, compared to 66.8% across Rest of WA. Morawa has a higher proportion of seniors aged 65 and over at 22.7%, with around 931 people falling into this age bracket. This is higher than the 18.3% recorded in Rest of WA. Health outcomes among seniors in Morawa are particularly strong, performing even better than the general population in health metrics.
Frequently Asked Questions - Health
Cultural Diversity
Morawa is considerably less culturally diverse than average when assessed alongside AreaSearch's national rankings for language and cultural background related metrics
Morawa's cultural diversity is below average, with 76.9% citizens, 86.8% born in Australia, and 96.2% speaking English only at home. Christianity is the predominant religion, comprising 48.7%, compared to 49.9% regionally. The top three ancestral groups are English (34.3%), Australian (31.8%), and Scottish (7.7%).
Notably, Maori representation is higher than average at 0.9% versus 0.7%. Australian Aboriginal representation is lower at 4.3% compared to the regional figure of 6.9%, while South African representation is also slightly lower at 0.5% versus 0.6%.
Frequently Asked Questions - Diversity
Age
Morawa hosts an older demographic, ranking in the top quartile nationwide
Morawa has a median age of 46, which is higher than the Rest of WA figure of 40 and also above the national average of 38. The age profile shows that those aged 65-74 are particularly prominent at 15.0%, while those aged 15-24 make up a smaller proportion at 7.5% compared to the Rest of WA. This concentration of people aged 65-74 is higher than the national figure of 9.4%. Between the 2021 Census and now, the age group of 35 to 44 has grown from 12.0% to 14.3%, while those aged 0 to 4 have increased from 5.9% to 6.9%. Conversely, the age groups of 75 to 84 and 55 to 64 have declined to 5.8% and 15.8% respectively from their previous figures of 7.2% and 17.0%. Looking ahead to 2041, demographic projections indicate significant shifts in Morawa's age structure. Notably, the age group of 25 to 34 is projected to grow by 36%, reaching 580 people from its current figure of 427. Conversely, population declines are projected for those aged 65 to 74 and 85+.
