Chart Color Schemes
This analysis uses ABS Statistical Areas Level 2 (SA2) boundaries, which can materially differ from Suburbs and Localities (SAL) even when sharing similar names.
SA2 boundaries are defined by the Australian Bureau of Statistics and are designed to represent communities for statistical reporting (e.g., census and ERP).
Suburbs and Localities (SAL) represent commonly-used suburb/locality names (postal-style areas) and may use different geographic boundaries. For comprehensive analysis, consider reviewing both boundary types if available.
est. as @ -- *
ABS ERP | -- people | --
2021 Census | -- people
Sales Activity
Curious about local property values? Filter the chart to assess the volume and appreciation (including resales) trends and regional comparisons, or scroll to the map below view this information at an individual property level.
Find a Recent Sale
Sales Detail
Population
Geraldton - East is positioned among the lower quartile of areas assessed nationally for population growth based on AreaSearch's assessment of recent, and medium term trends
Geraldton - East's population was approximately 8,523 as of November 2025, according to AreaSearch's analysis. This figure represents an increase of 699 people, marking an 8.9% rise from the 2021 Census count of 7,824 inhabitants. The change is inferred from the estimated resident population of 8,483 in June 2024 and an additional 16 validated new addresses since the Census date. This results in a population density ratio of 105 persons per square kilometer, indicating ample space per person and potential for further development. Geraldton - East's growth rate of 8.9% since the 2021 census surpassed both the SA3 area (7.5%) and the SA4 region, positioning it as a growth leader in the region. Natural growth was the primary driver behind this population increase, contributing approximately 75.2% of overall population gains during recent periods.
AreaSearch employs ABS/Geoscience Australia projections for each SA2 area, released in 2024 with a base year of 2022. For areas not covered by this data and to estimate growth post-2032, AreaSearch utilizes growth rates by age cohort provided by the ABS in its latest Greater Capital Region projections (released in 2023, based on 2022 data). Future population dynamics anticipate a median increase for Australia's regional areas, with Geraldton - East expected to grow by 801 persons by 2041, reflecting an overall gain of 8.9% over the 17-year period.
Frequently Asked Questions - Population
Development
AreaSearch analysis of residential development drivers sees Geraldton - East recording a relatively average level of approval activity when compared to local markets analysed countrywide
Geraldton - East averaged approximately 27 new dwelling approvals annually. Over the past five financial years, from FY-21 to FY-25139 homes were approved, with an additional 11 approved so far in FY-26. On average, 1.8 people moved to the area per dwelling built over these five years. However, this figure increased to 4.4 people per dwelling over the past two financial years, indicating growing popularity and potential supply constraints.
New properties are constructed at an average expected cost of $291,000. This year has seen $24.4 million in commercial development approvals, suggesting balanced commercial development activity. Compared to the rest of WA, Geraldton - East has around three-quarters the rate of new dwelling approvals per person and ranks among the 53rd percentile nationally. New development consists predominantly of standalone homes (95.0%) with a smaller proportion of medium and high-density housing (5.0%), maintaining the area's low density nature.
With approximately 331 people per dwelling approval, Geraldton - East shows a developing market. Population forecasts indicate an increase of 761 residents by 2041. Current development patterns suggest new housing supply should readily meet demand, offering good conditions for buyers and potentially facilitating population growth beyond current projections.
Frequently Asked Questions - Development
Infrastructure
Geraldton - East has limited levels of nearby infrastructure activity, ranking in the 2ndth percentile nationally
Changes to local infrastructure significantly impact an area's performance. AreaSearch has identified 12 projects likely to influence the area. Notable projects include Mount Tarcoola Brand Highway Residential Development Plan, Geraldton Cycling Network Expansion Project, Geraldton Cycle Network Expansion Project, and Geraldton Green Connect Project. The following list details those most relevant.
Professional plan users can use the search below to filter and access additional projects.
INFRASTRUCTURE SEARCH
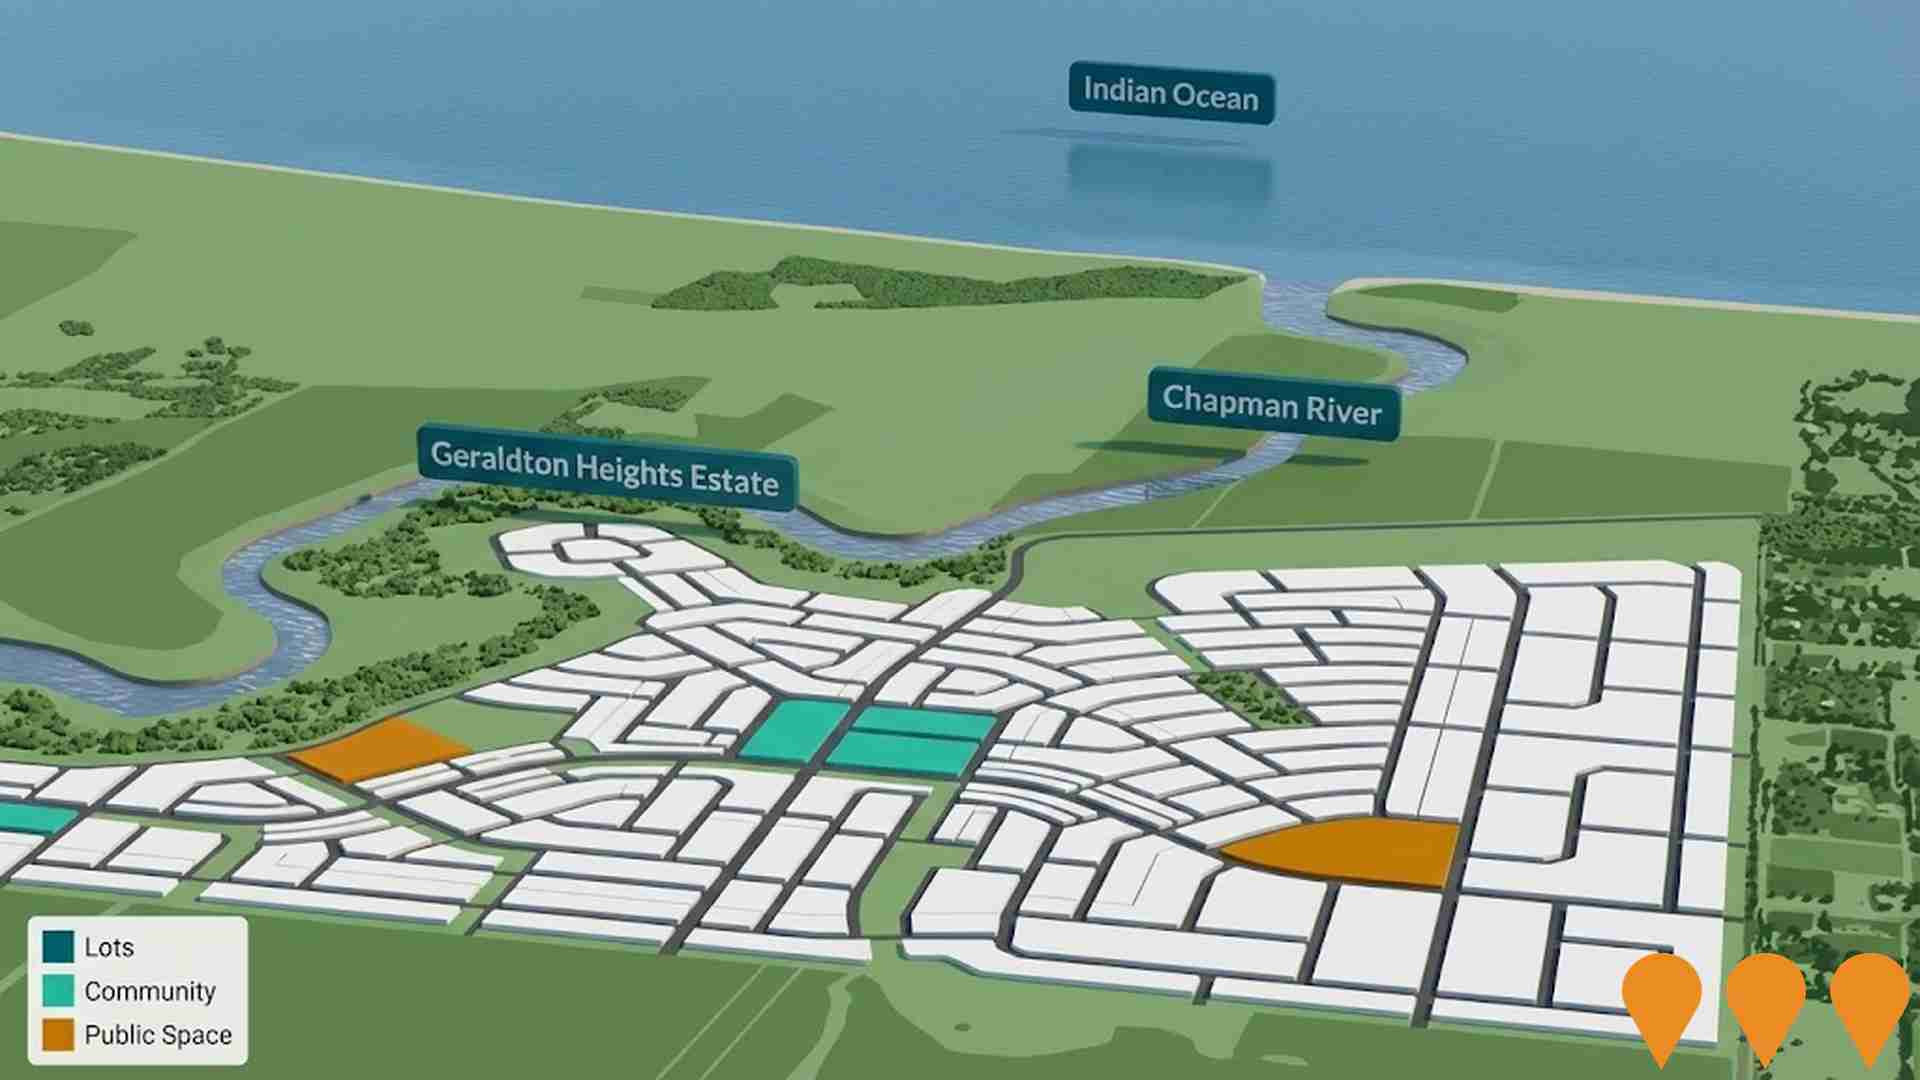
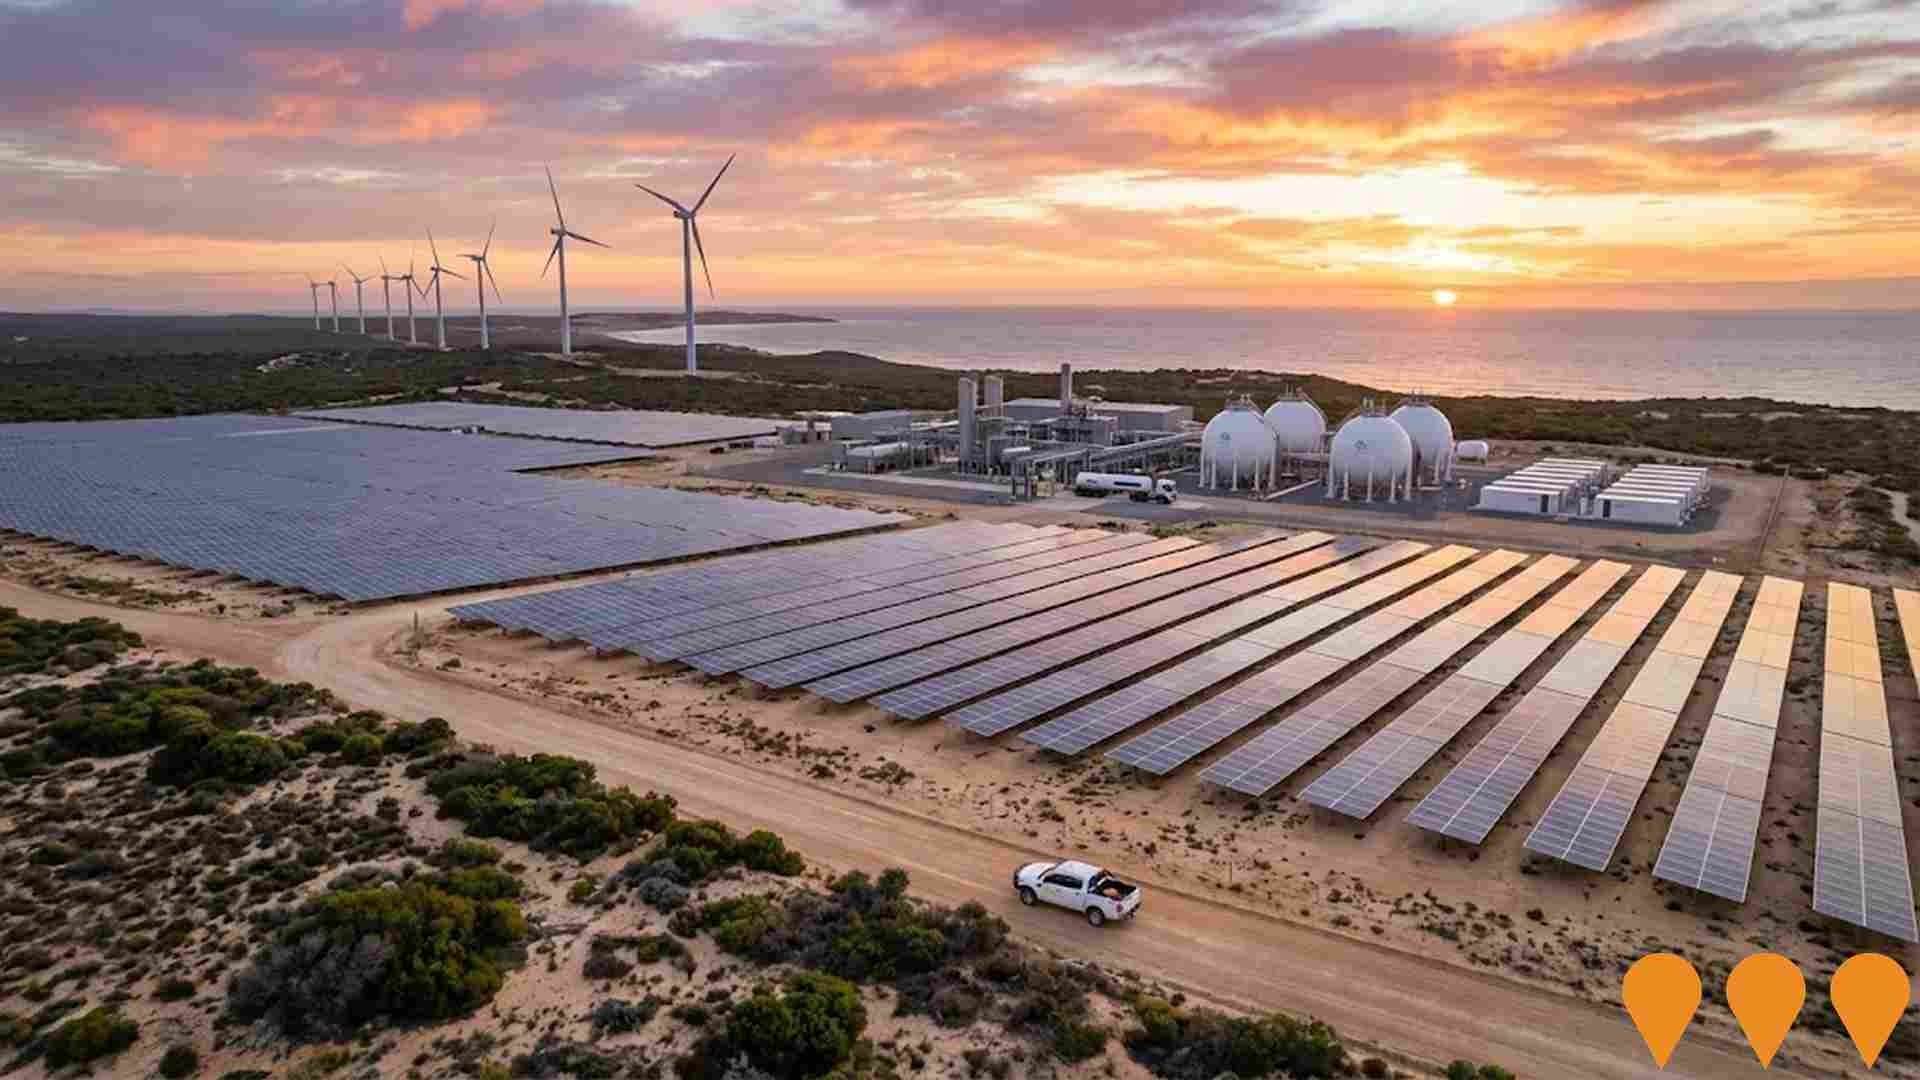
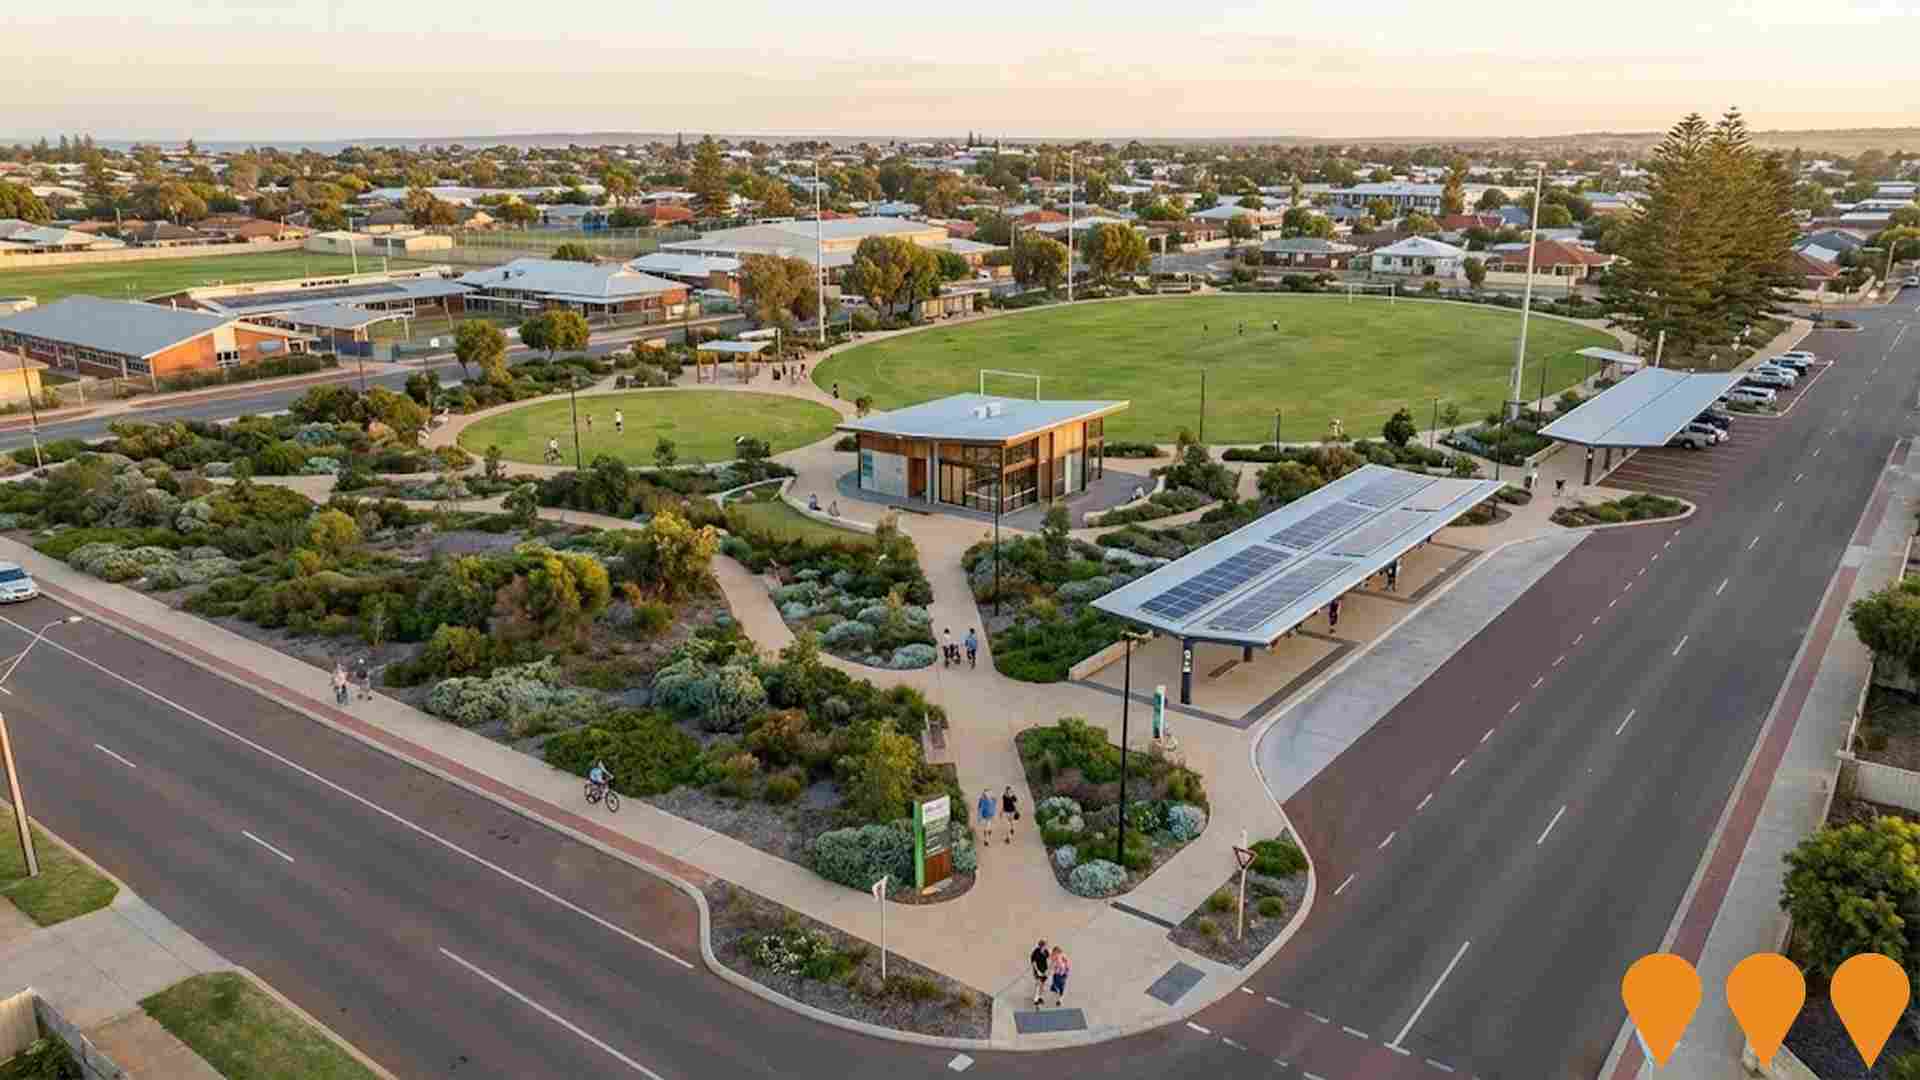
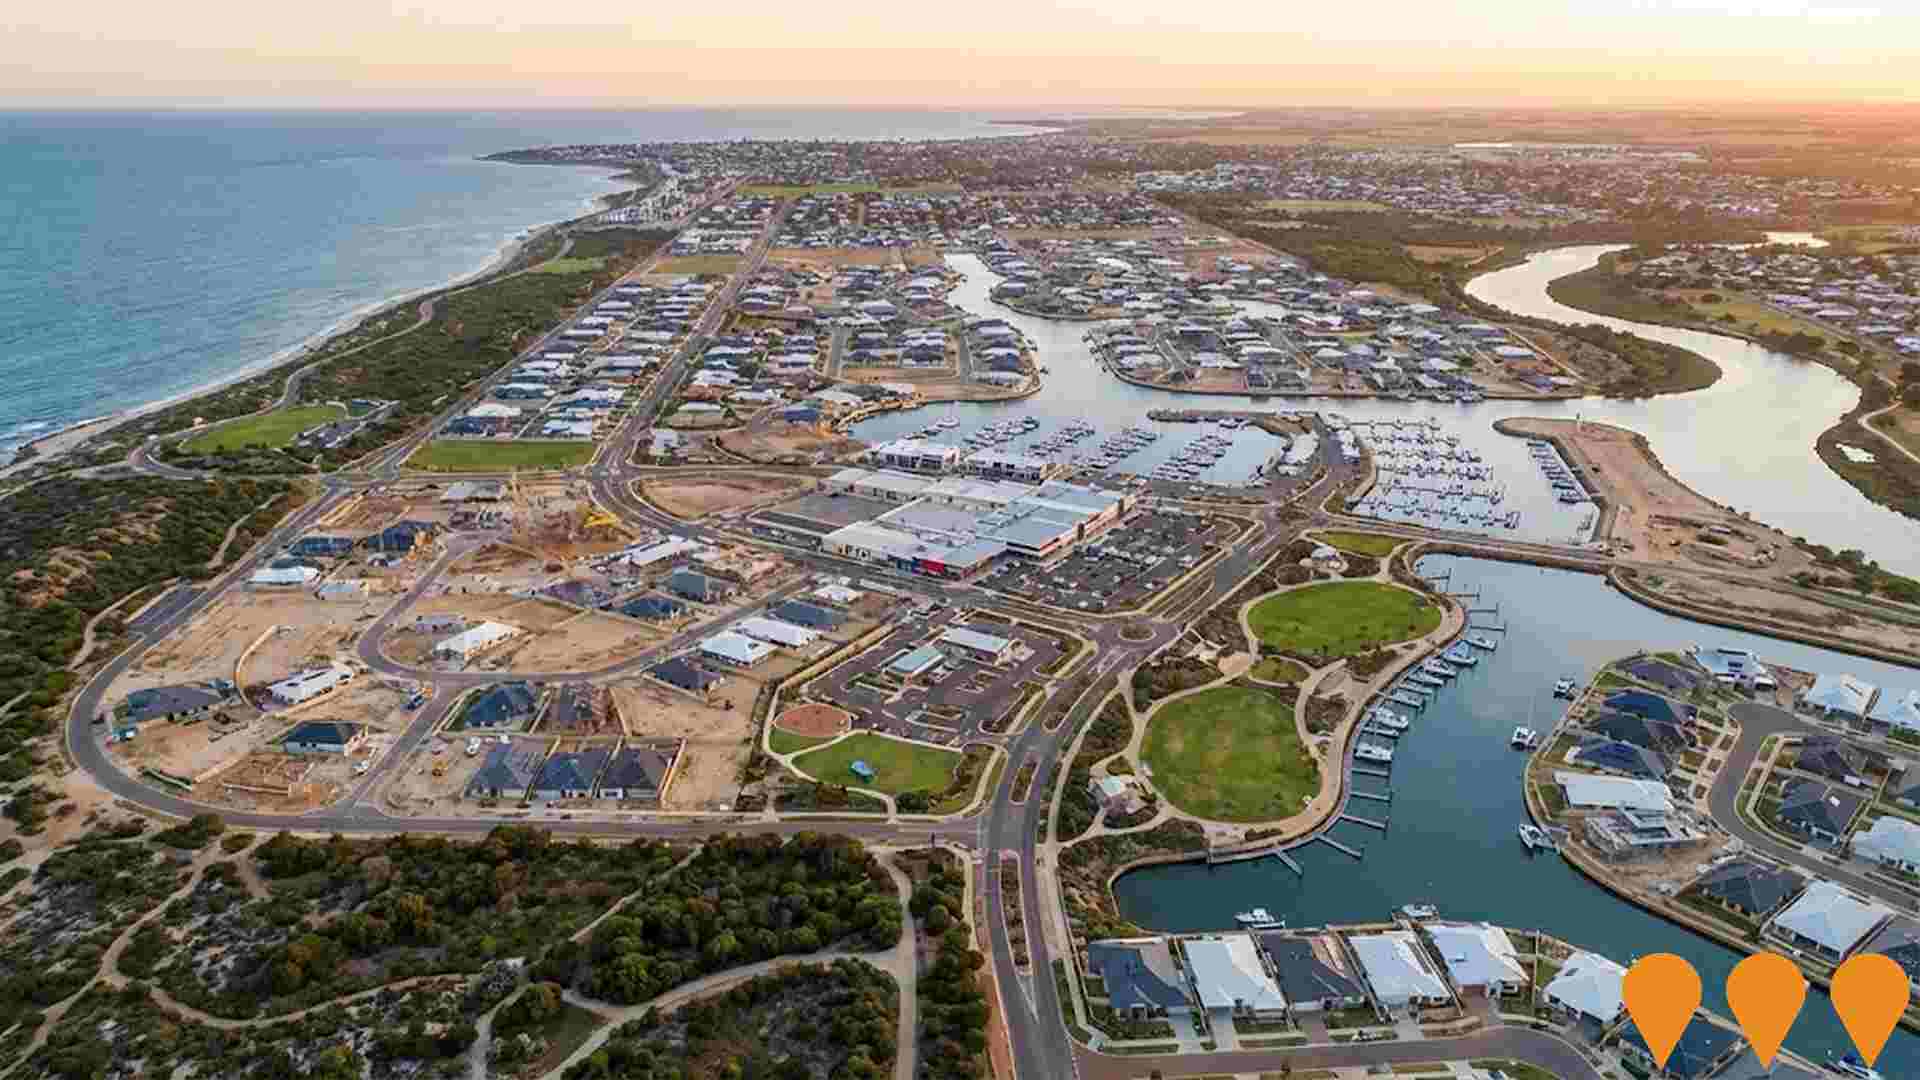
 Denotes AI-based impression for illustrative purposes only, not to be taken as definitive under any circumstances. Please follow links and conduct other investigations from the project's source for actual imagery. Developers and project owners wishing us to use original imagery please Contact Us and we will do so.
Frequently Asked Questions - Infrastructure
Geraldton Green Connect Project
Transformation of Maitland Park into a sustainable, multi-use space powered by renewable energy, featuring an educational and culturally immersive landscape. The planning stage aims to deliver a comprehensive business case and detailed designs for a multi-use parkland, small-scale pavilion, and sustainable transport hub, which includes a covered carpark and busport with solar panels to improve pedestrian safety and resolve traffic congestion in the school precinct. The project stems from the Maitland Park Schools Precinct Transport Hub Concept Masterplan.
Double Beach Estate
The 975-hectare coastal land holding is being offered for sale as a world-class new townsite development opportunity. It includes WAPC subdivision approval for 900 lots (with 100 'shovel-ready') and conceptual plans for up to 14,000 residential lots, a marina, canals, a major regional shopping centre, and tourism facilities. It has 3.5km of Indian Ocean frontage and 3.5km of Greenough River frontage. The current seller is Bayform Holdings Pty Ltd.
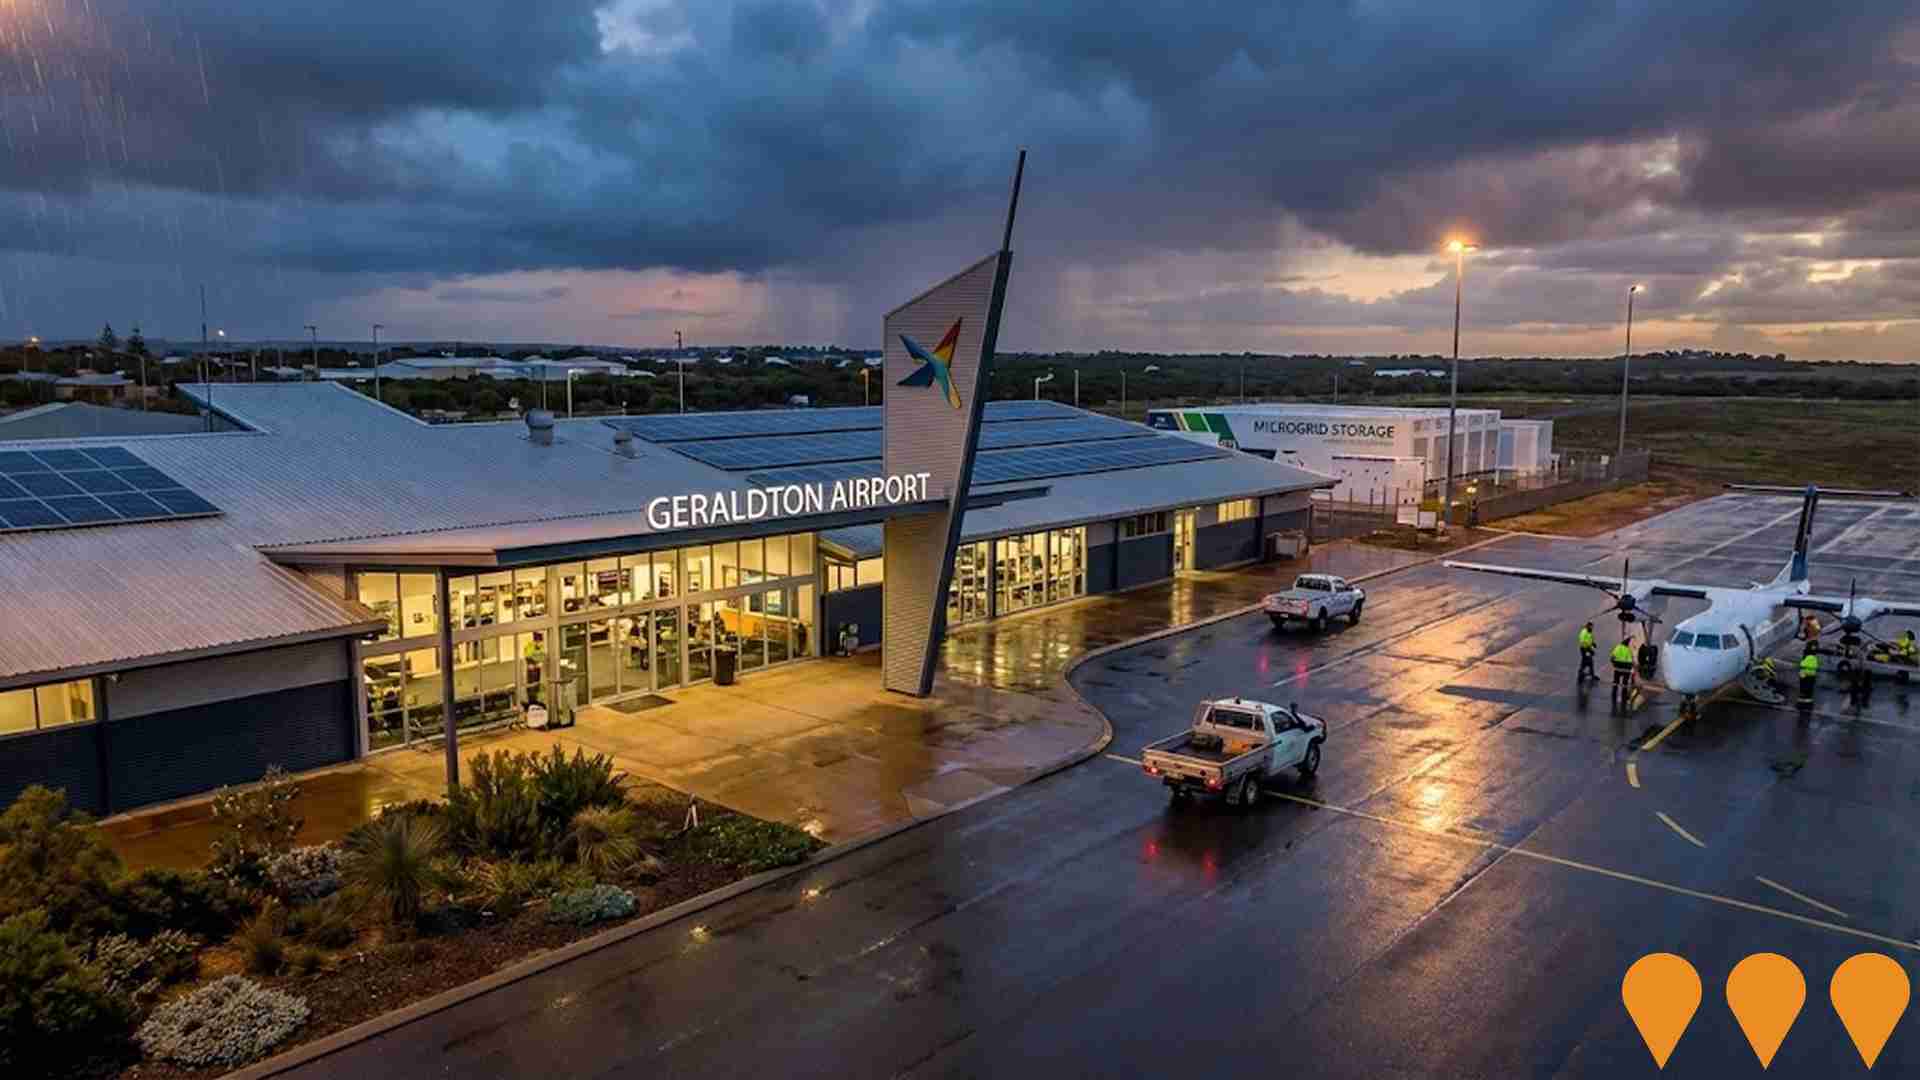
Geraldton Airport Microgrid Project
Construction of a microgrid at Geraldton Airport to integrate renewable energy and battery storage, enhancing disaster resilience for emergency services and helping the City of Greater Geraldton achieve its net-zero target. The $5 million project will make the airport the first in the southern hemisphere to be powered purely by renewable energy.
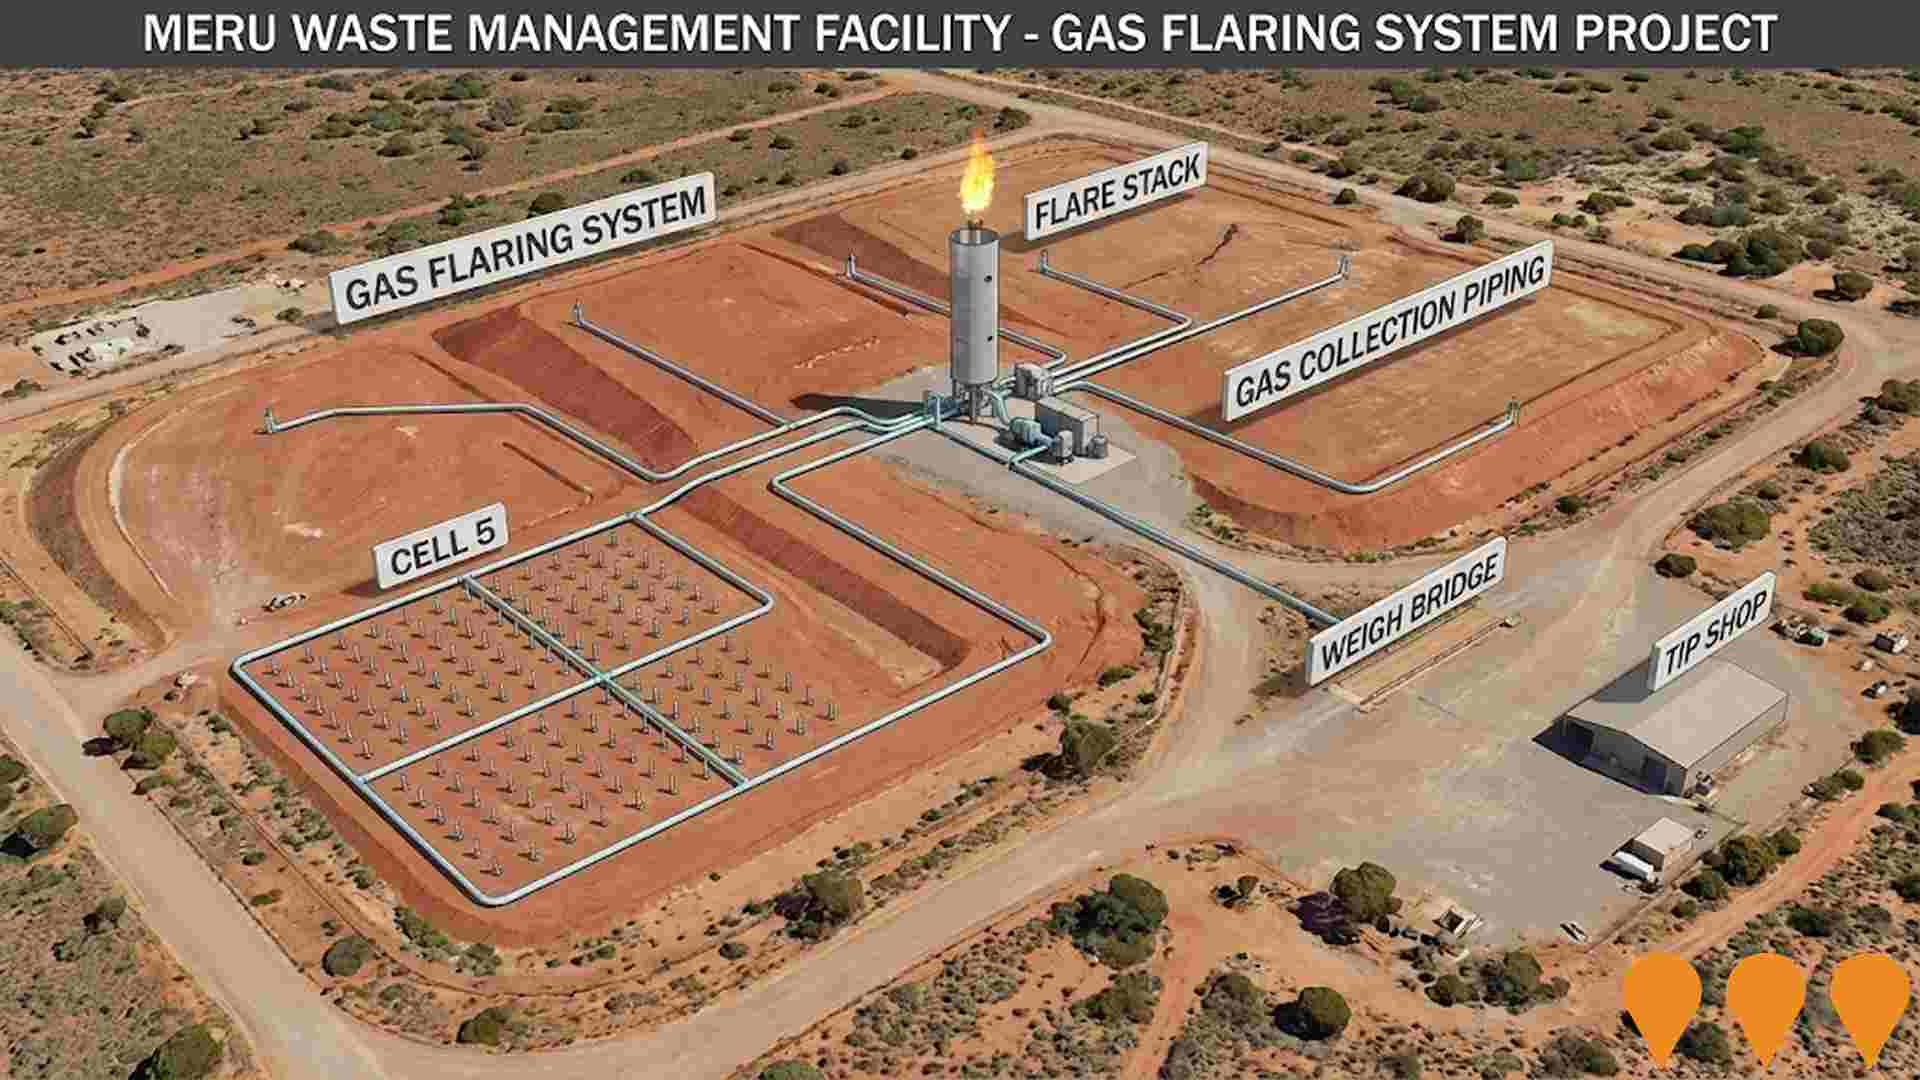
Meru Waste Management Facility Gas Flaring System Project
Installation of a gas flaring system at the Meru Waste Management Facility to capture and combust harmful methane gas, converting it to carbon dioxide and water vapour, to reduce greenhouse gas emissions by up to 50% and support the City of Greater Geraldton's net zero by 2030 goal. The City allocated $100,000 to the project in its 2023-24 capital works budget, and gas pumping trials were scheduled for late 2023. The project is a key component of the City's Corporate Climate Change Mitigation Plan.
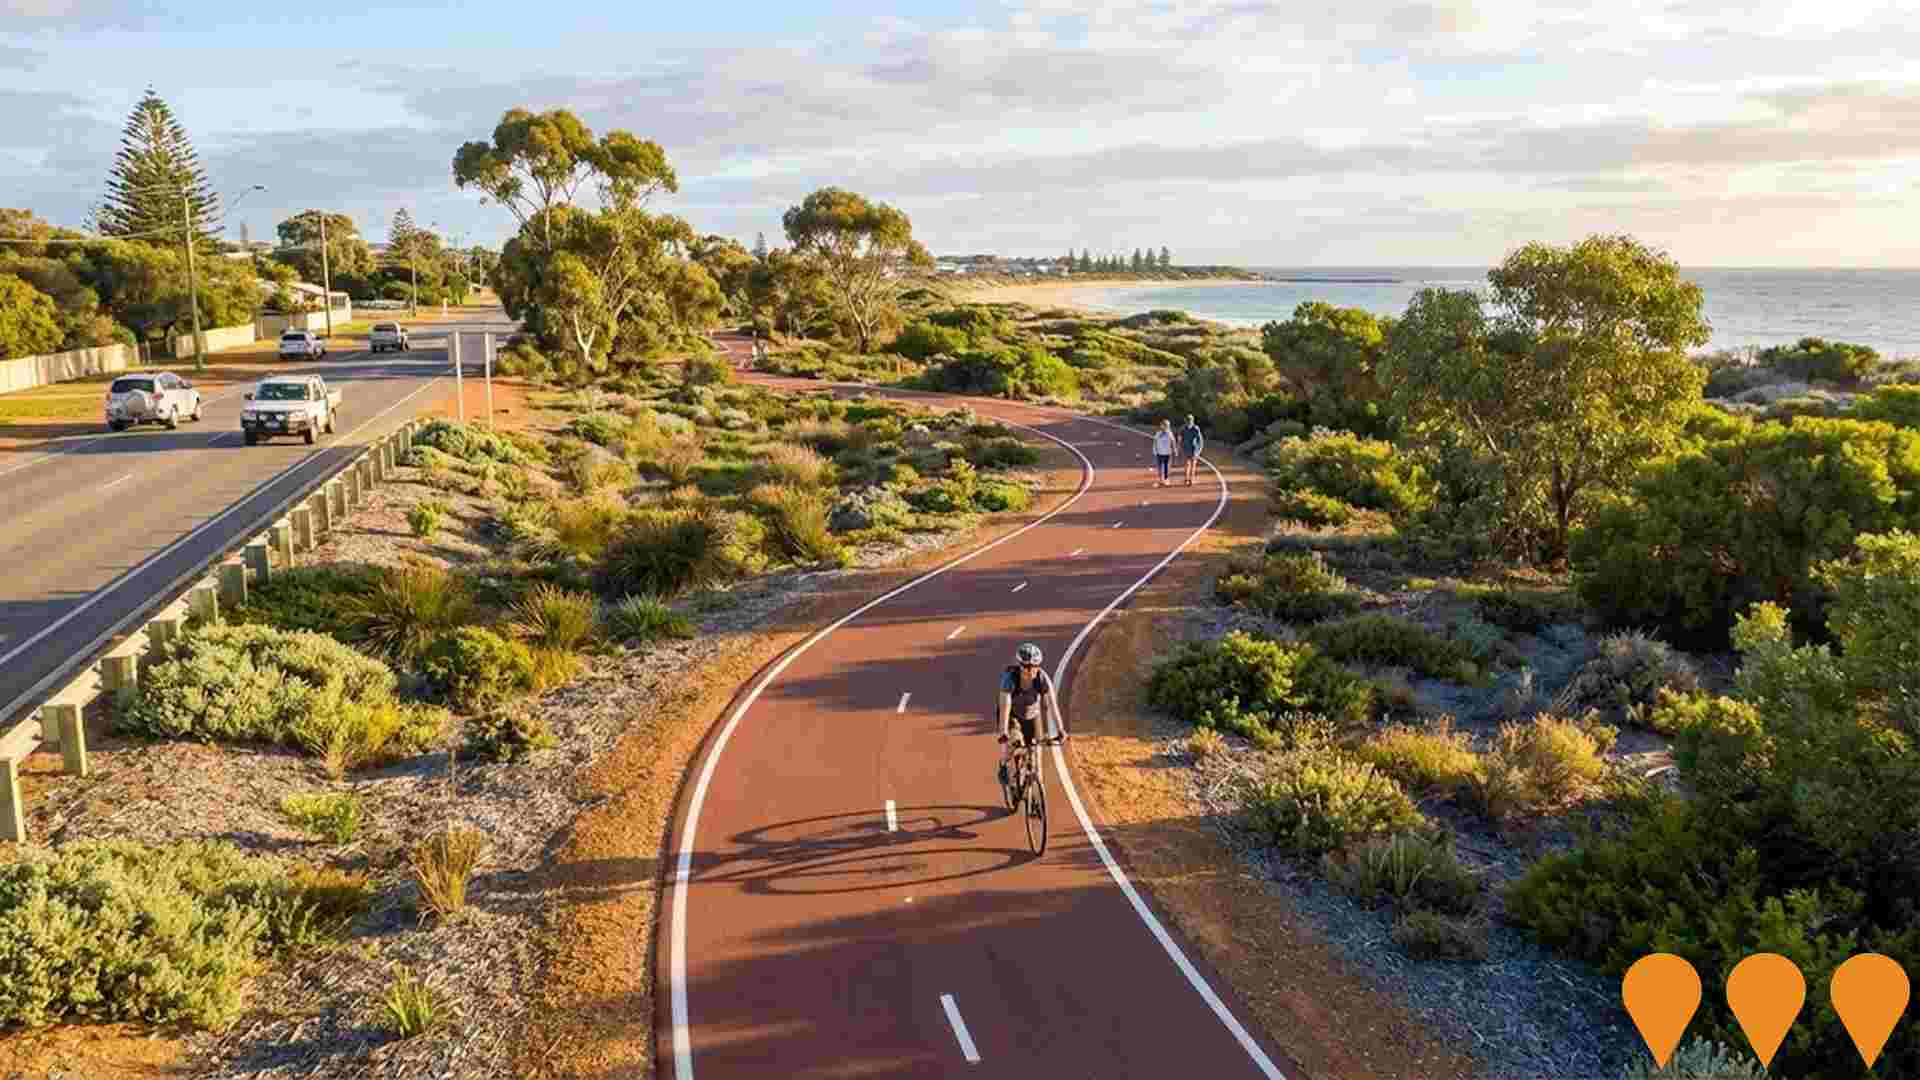
Geraldton Cycling Network Expansion Project
A three stage State Government funded project adding about 8.3 km of high quality shared paths to connect the northern and southern suburbs of Geraldton. Stage one on Glenfield Beach Drive and stage two on Chapman Road are complete. Stage three will deliver a 4.8 km shared path along Brand Highway between Tarcoola Beach and Cape Burney to improve safe walking and riding options and links to local beaches, services and workplaces.
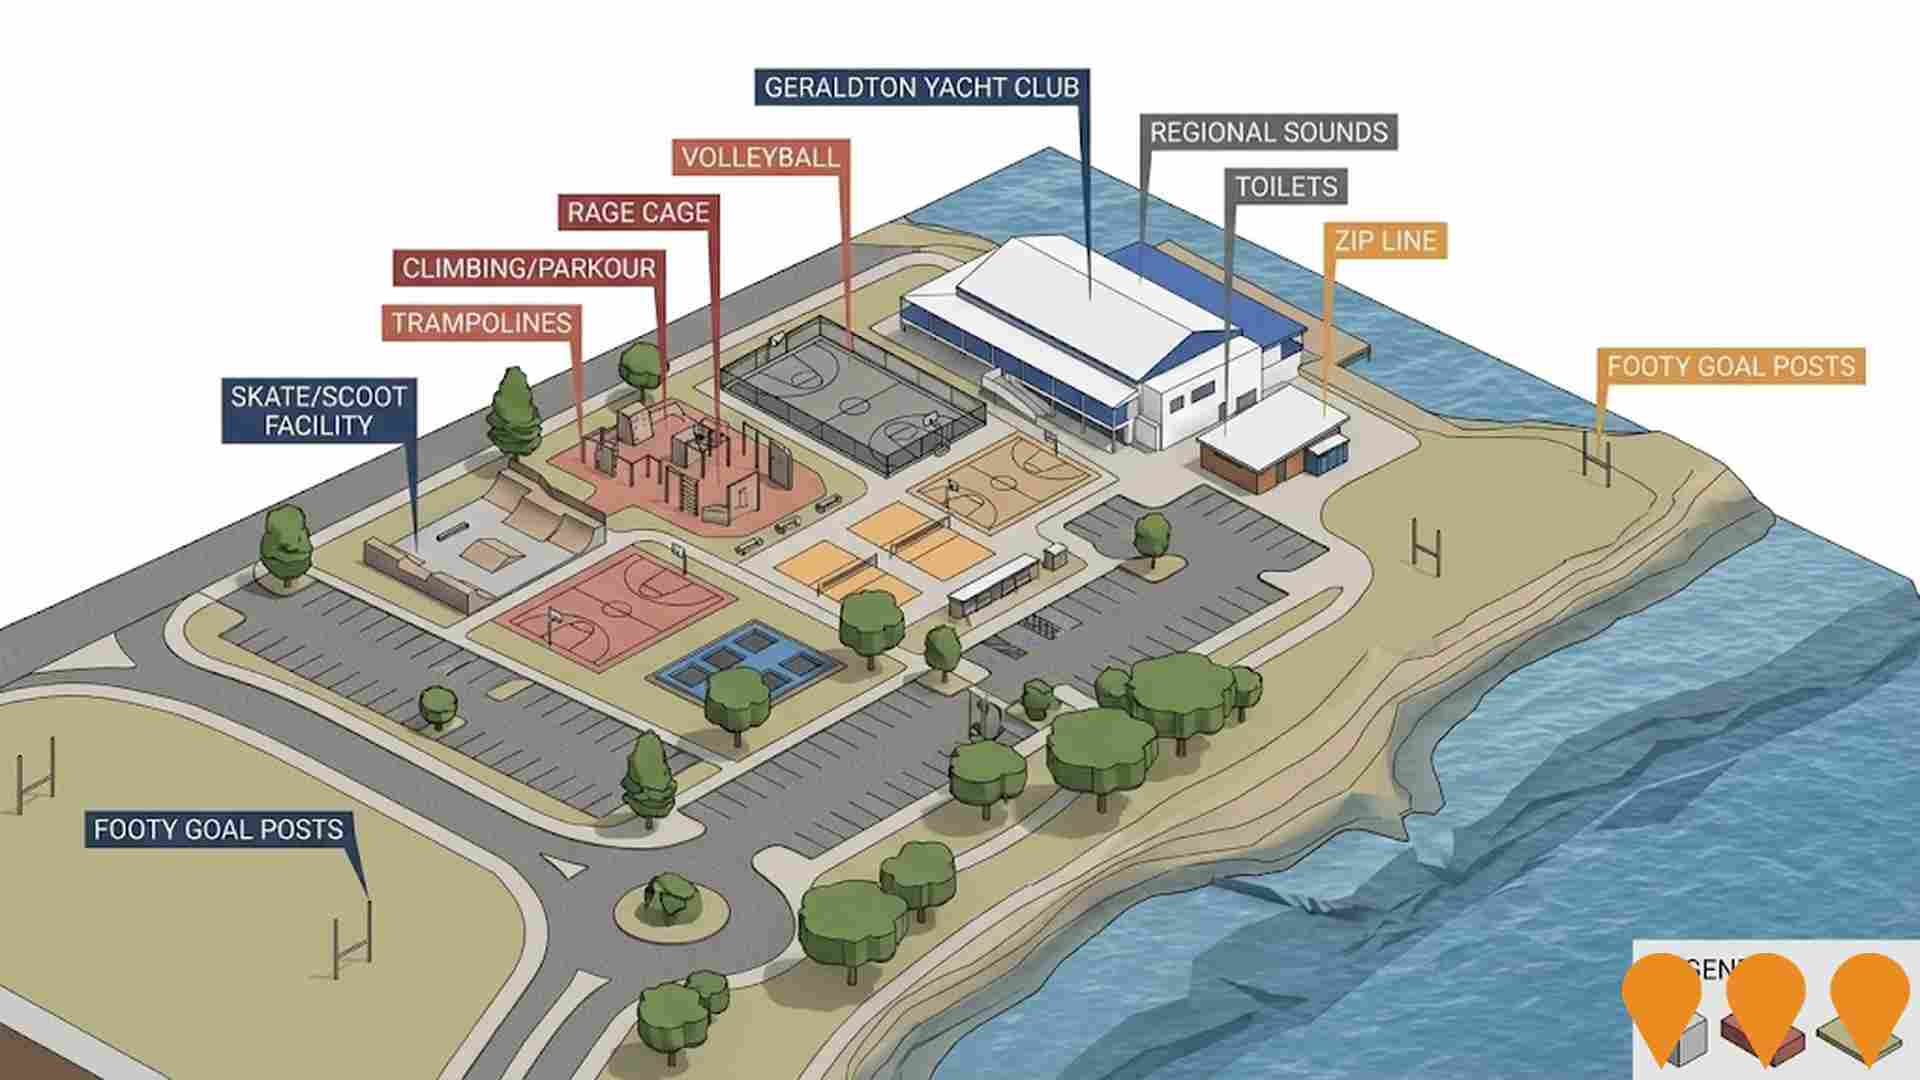
Geraldton Youth Precinct Masterplan Development
Upgrade of the Youth Precinct on the Geraldton foreshore to provide inclusive facilities and amenities for young people aged 12-25, including a new skatepark. The Updated Masterplan was endorsed by the City of Greater Geraldton Council in July 2025. Detailed design will now begin, followed by construction estimated to commence in early 2026.
Revised Wandina Structure Plan
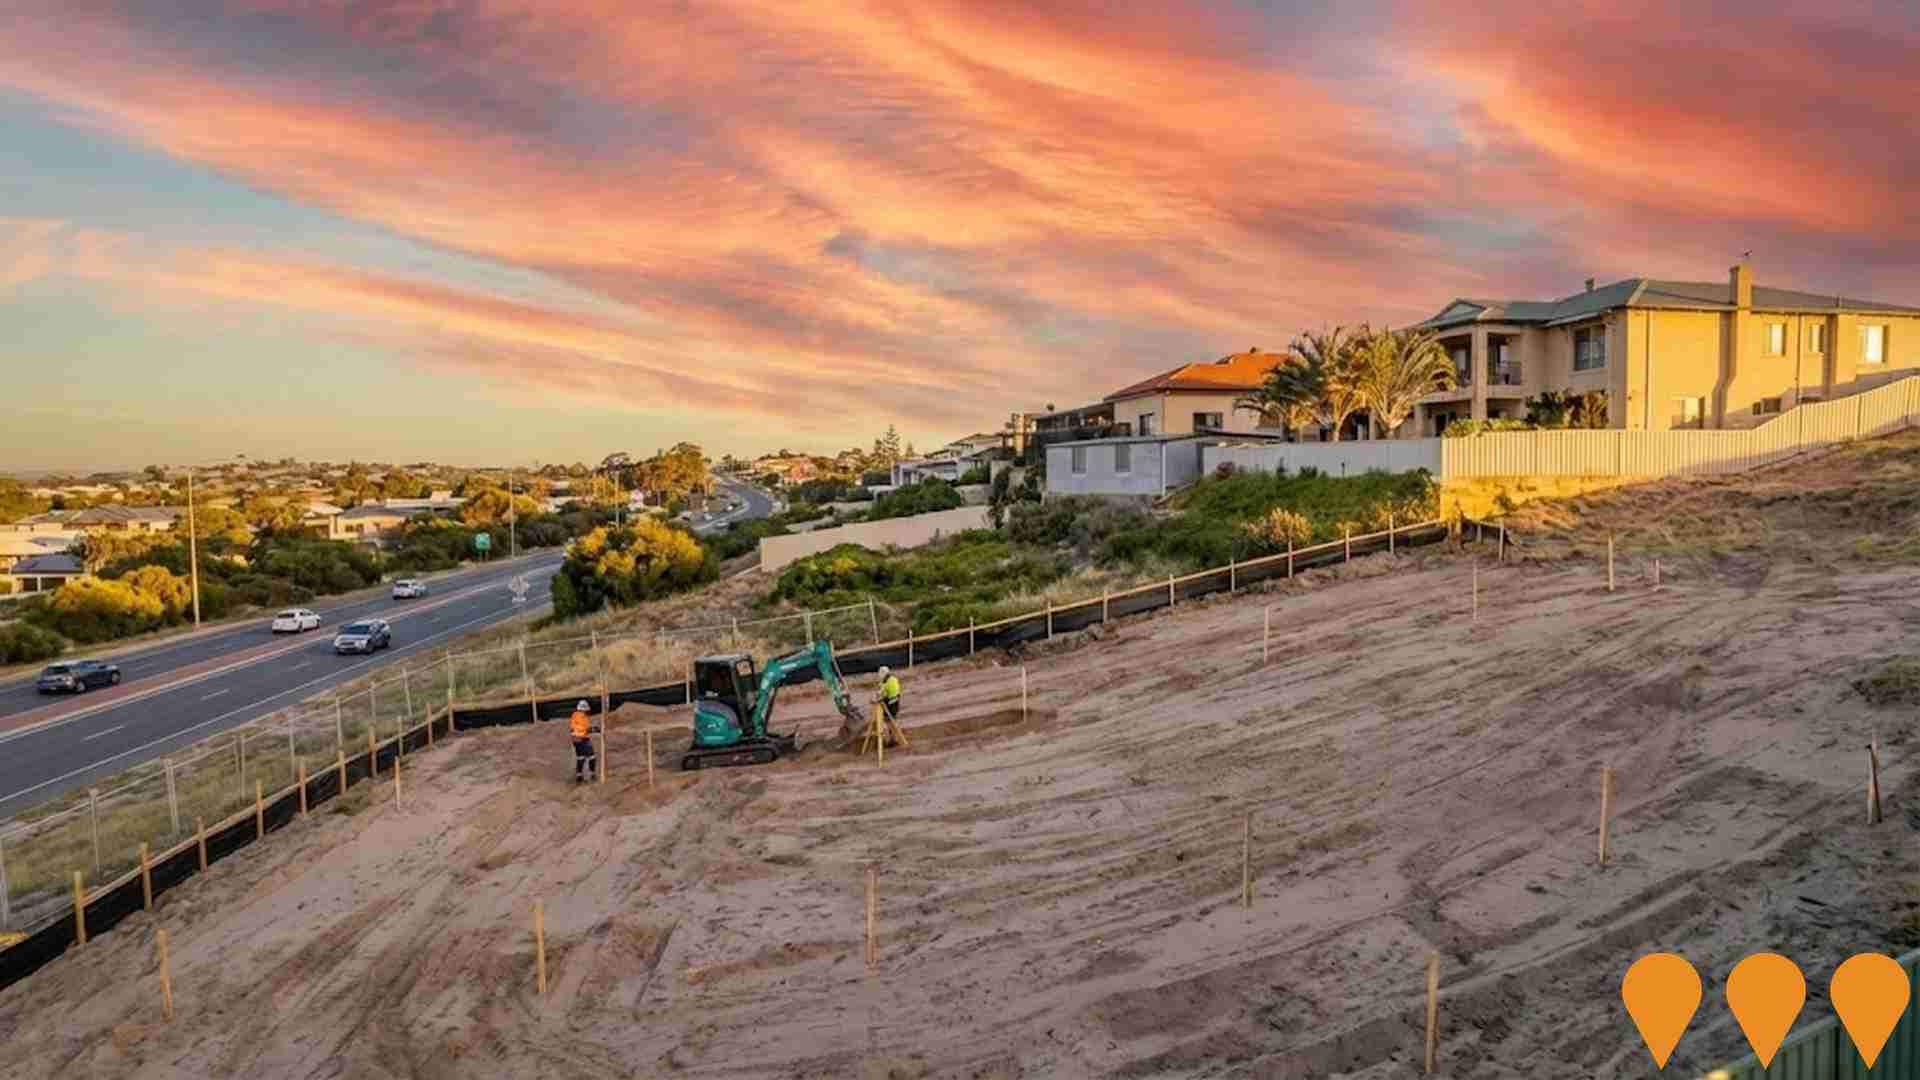
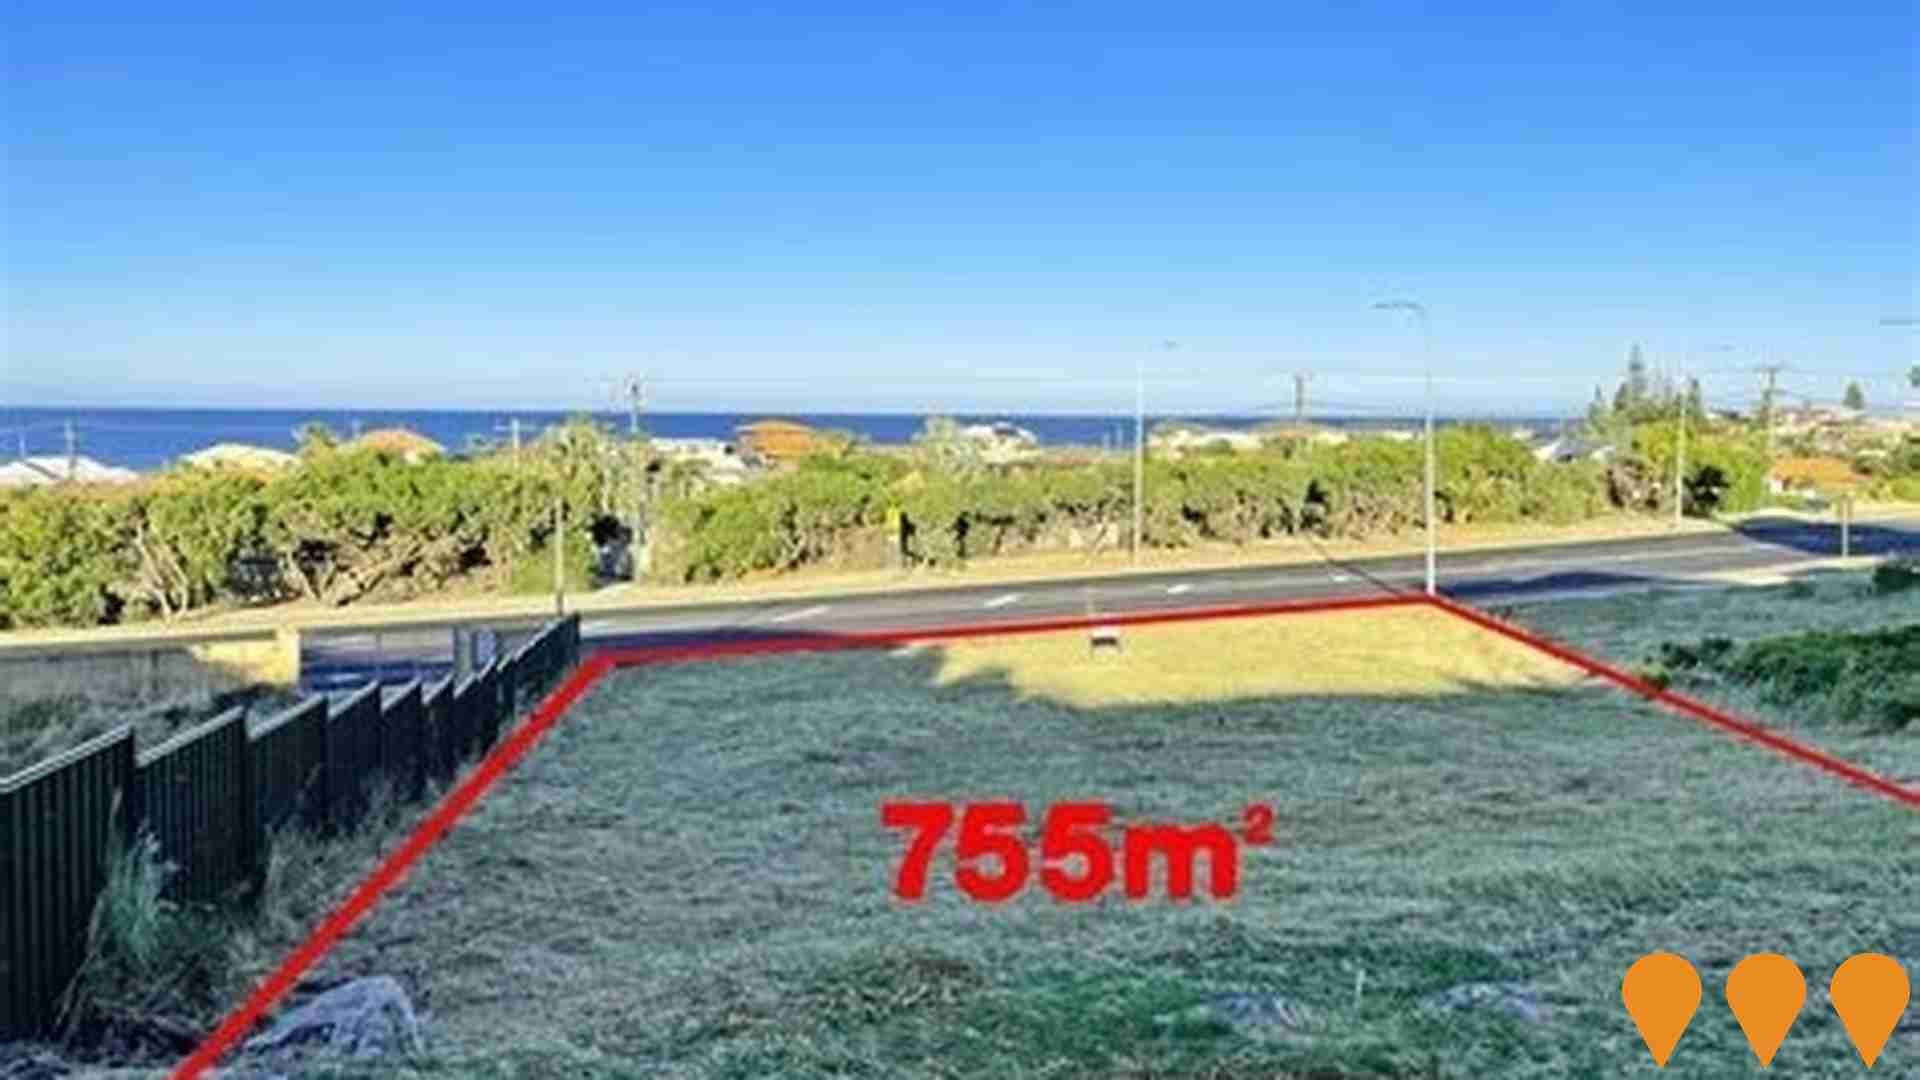
Approved residential structure plan guiding the development of 24 hectares in Wandina, Geraldton. The project includes 186 single residential lots ranging from 700-2527 square meters, one duplex site, public open spaces, and drainage infrastructure. The development features ocean views, integration with natural landform, limestone retaining walls, and connections to adjoining residential areas and schools. Individual lots are now being sold with development actively progressing.

Wandina Tiny Social Homes
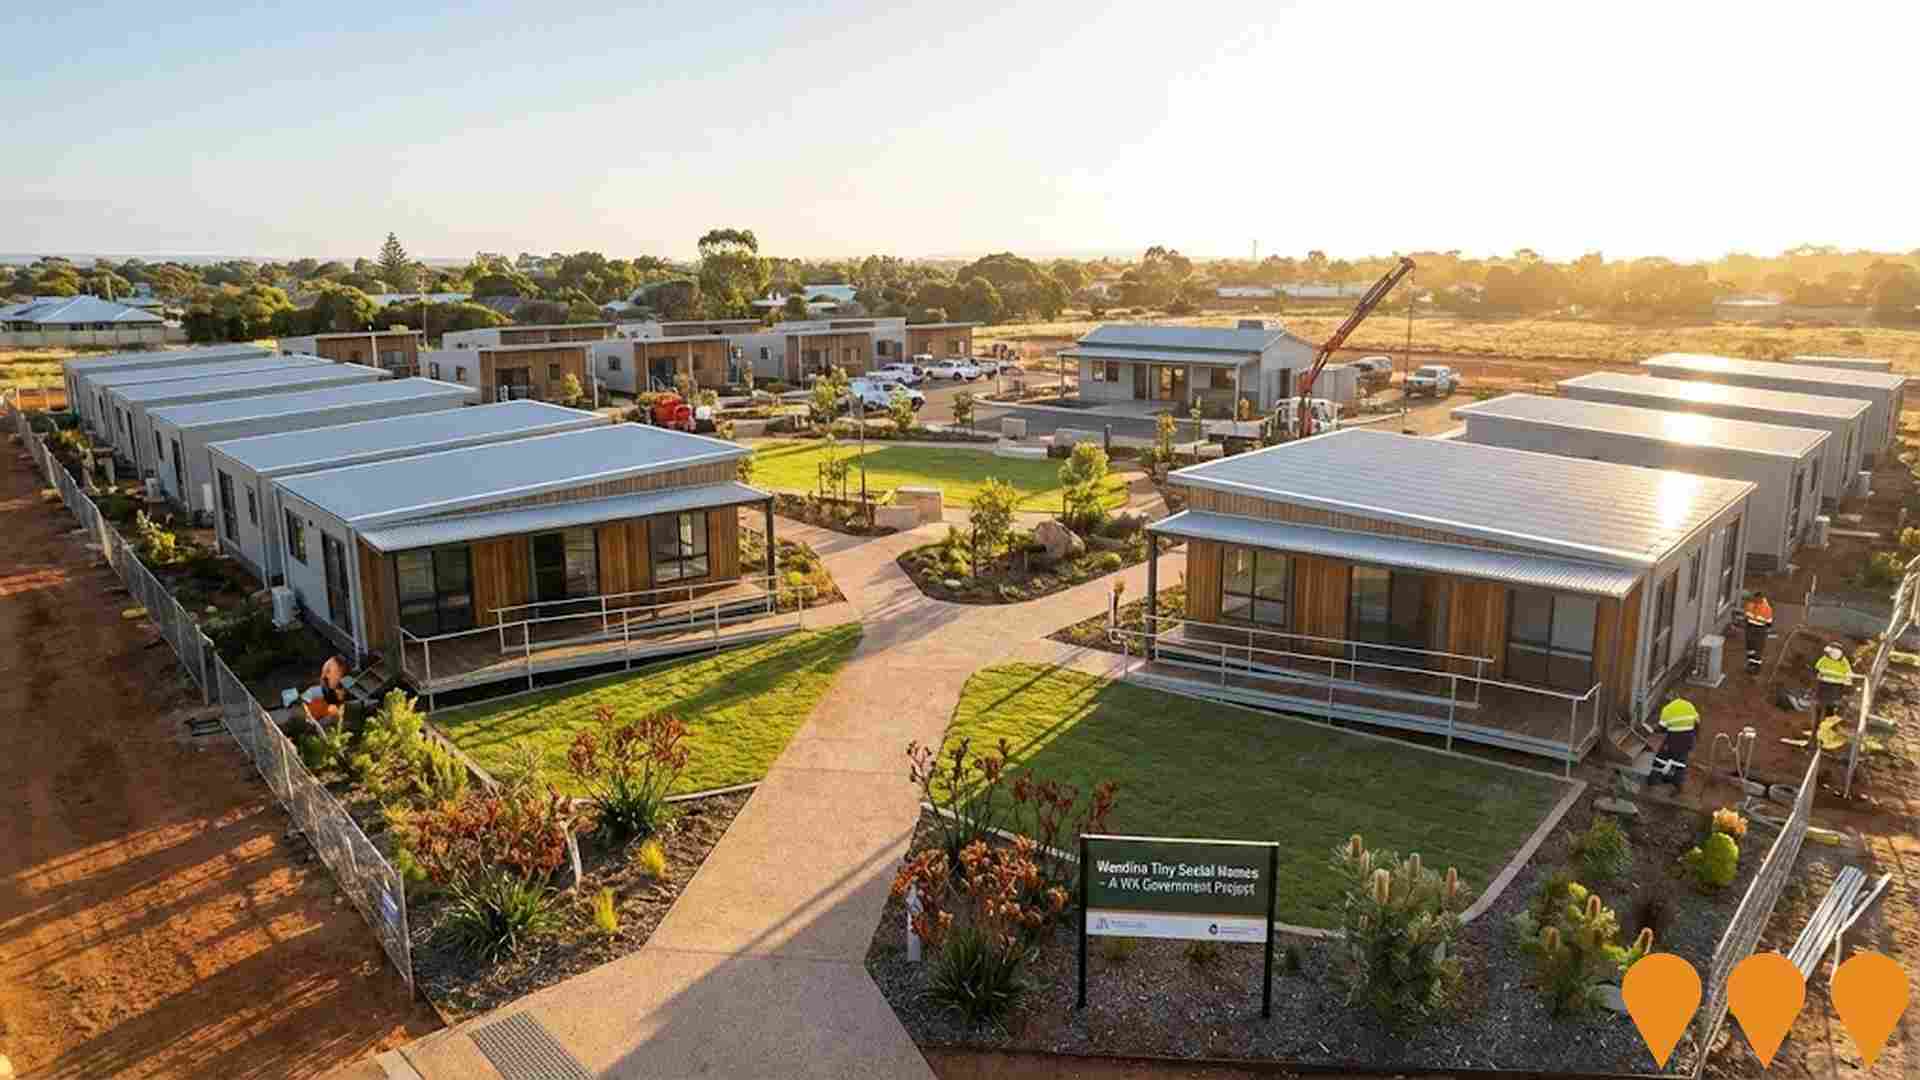
Construction of 16 modular tiny homes for social housing in Wandina, primarily for seniors. The homes are built to gold Livable Homes standard, featuring one and two-bedroom layouts designed to provide affordable, accessible, and secure living options. The homes are prefabricated offsite at Summit Modular's Canning Vale facility over approximately 12 weeks before being transported to Geraldton for final assembly and connection to utilities. This project is part of the WA Government's $4.5 billion investment in social housing and homelessness measures.
Employment
The labour market performance in Geraldton - East lags significantly behind most other regions nationally
Geraldton - East has a balanced workforce with both white and blue collar jobs. Manufacturing and industrial sectors are prominent.
Unemployment rate is 6.1%, with an employment growth of 0.7% in the past year. As of September 2025, there are 3,841 residents employed, with an unemployment rate of 9.0% (2.9% higher than Rest of WA's rate). Workforce participation is lower at 57.3%. Top employment industries include health care & social assistance, retail trade, and construction.
Retail trade has a high representation at 1.5 times the regional level, while agriculture, forestry & fishing is low at 3.4% compared to the regional average of 9.3%. Employment opportunities locally may be limited as Census working population differs from resident population. In the year to September 2025, employment levels increased by 0.7%, labour force grew by 0.9%, causing unemployment rate to rise by 0.2 percentage points. This contrasts with Rest of WA where employment rose by 1.4% and unemployment fell by 0.2 percentage points. National employment forecasts from May-25 suggest national employment will expand by 6.6% over five years and 13.7% over ten years. Applying these projections to Geraldton - East's employment mix, local employment is estimated to increase by 5.9% over five years and 12.5% over ten years.
Frequently Asked Questions - Employment
Income
The economic profile demonstrates above-average performance, with income metrics exceeding national benchmarks based on AreaSearch comparative assessment
Geraldton - East SA2's median income among taxpayers in financial year 2022 was $55,737. The average income stood at $69,332 during the same period. These figures compare to Rest of WA's median and average incomes of $57,323 and $71,163 respectively. By September 2025, estimates suggest the median income will be approximately $63,652 and the average income $79,177, based on a Wage Price Index growth of 14.2%. According to the 2021 Census, household, family, and personal incomes in Geraldton - East rank modestly, between the 32nd and 38th percentiles. In this area, 31.2% of individuals (2,659 people) fall within the $1,500 - $2,999 income range, similar to the metropolitan region where this cohort also represents 31.1%. After housing expenses, 86.6% of income remains for other expenses.
Frequently Asked Questions - Income
Housing
Geraldton - East is characterized by a predominantly suburban housing profile, with ownership patterns similar to the broader region
Dwelling structure in Geraldton - East, as evaluated at the Census conducted on 28 August 2016, comprised 95.2% houses and 4.8% other dwellings. In comparison, Non-Metro WA had 87.5% houses and 12.5% other dwellings. Home ownership in Geraldton - East was at 32.8%, with mortgaged dwellings at 45.2% and rented dwellings at 22.0%. The median monthly mortgage repayment was $1,517, aligning with Non-Metro WA's average. The median weekly rent figure was $225, compared to Non-Metro WA's $250. Nationally, Geraldton - East's mortgage repayments were lower at $1,517 versus the Australian average of $1,863, and rents were substantially below the national figure of $375.
Frequently Asked Questions - Housing
Household Composition
Geraldton - East has a typical household mix, with a higher-than-average median household size
Family households comprise 75.6% of all households, including 30.3% couples with children, 28.4% couples without children, and 15.5% single parent families. Non-family households account for the remaining 24.4%, with lone person households at 22.0% and group households comprising 2.2% of the total. The median household size is 2.7 people, larger than the Rest of WA average of 2.4.
Frequently Asked Questions - Households
Local Schools & Education
Geraldton - East faces educational challenges, with performance metrics placing it in the bottom quartile of areas assessed nationally
The area's university qualification rate is 9.2%, significantly lower than Australia's average of 30.4%. This disparity presents both a challenge and an opportunity for targeted educational initiatives. Bachelor degrees are the most common (6.9%), followed by graduate diplomas (1.3%) and postgraduate qualifications (1.0%). Vocational credentials are prevalent, with 44.6% of residents aged 15+ holding them, including advanced diplomas (8.2%) and certificates (36.4%).
Educational participation is high, with 35.7% of residents currently enrolled in formal education, including primary (13.9%), secondary (12.1%), and tertiary (2.0%) levels.
Frequently Asked Questions - Education
Schools Detail
Nearby Services & Amenities
Transport
Transport servicing is very low compared to other areas nationally based on assessment of service frequency, route connectivity and accessibility
Transport analysis shows 34 active stops operating in Geraldton - East, served by buses via five routes offering 80 weekly trips. Residents' access to transport is limited, with an average distance of 936 meters to the nearest stop. Service frequency averages 11 trips daily across all routes, equating to about two weekly trips per stop.
Service frequency averages 11 trips per day across all routes, equating to approximately 2 weekly trips per individual stop.
Frequently Asked Questions - Transport
Transport Stops Detail
Health
Health performance in Geraldton - East is lower than average with common health conditions somewhat prevalent across both younger and older age cohorts
Geraldton East faces significant health challenges with common health conditions prevalent across both younger and older age cohorts.
The rate of private health cover is high at approximately 54%, covering about 4,636 people. Mental health issues impact 9.1% of residents, while asthma affects 8.4%. Around 67.4% of residents declare themselves completely clear of medical ailments compared to 66.8% across the rest of WA. The area has 13.6% of residents aged 65 and over (1,155 people), which is lower than the 18.3% in the rest of WA.
Frequently Asked Questions - Health
Cultural Diversity
Geraldton - East is considerably less culturally diverse than average when assessed alongside AreaSearch's national rankings for language and cultural background related metrics
Geraldton - East had cultural diversity levels below average, with 82.8% of its population being citizens, 88.6% born in Australia, and 93.7% speaking English only at home. Christianity was the predominant religion, making up 49.6%. Islam's representation was notably higher than the regional average, comprising 1.3% compared to 1.3% across Rest of WA.
The top three ancestry groups were Australian (31.2%), English (30.2%), and Australian Aboriginal (10.2%). Dutch, Maori, and Filipino ethnicities showed notable divergences in representation: Dutch at 1.4%, Maori at 0.5%, and Filipino at 1.1%.
Frequently Asked Questions - Diversity
Age
Geraldton - East's population is slightly younger than the national pattern
The median age in Geraldton - East is 36 years, which is lower than the Rest of WA average of 40 years and also below the national average of 38 years. The 15-24 cohort makes up 13.9% of the population in Geraldton - East, a notably higher proportion compared to the Rest of WA average. Conversely, the 65-74 age group constitutes only 8.4%, which is under-represented compared to the Rest of WA average. According to data from the 2021 Census, the 25 to 34 age group has increased from 11.7% to 13.3%. Meanwhile, the 45 to 54 cohort has decreased from 14.3% to 12.6%, and the 55 to 64 group has dropped from 13.6% to 12.2%. Population forecasts for 2041 indicate significant demographic changes in Geraldton - East. The 25 to 34 age group is projected to grow by 46%, adding 522 people, reaching a total of 1,659 from the current figure of 1,136. On the other hand, both the 55 to 64 and the 75 to 84 age groups are expected to see reduced numbers.
