Chart Color Schemes
This analysis uses ABS Statistical Areas Level 2 (SA2) boundaries, which can materially differ from Suburbs and Localities (SAL) even when sharing similar names.
SA2 boundaries are defined by the Australian Bureau of Statistics and are designed to represent communities for statistical reporting (e.g., census and ERP).
Suburbs and Localities (SAL) represent commonly-used suburb/locality names (postal-style areas) and may use different geographic boundaries. For comprehensive analysis, consider reviewing both boundary types if available.
est. as @ -- *
ABS ERP | -- people | --
2021 Census | -- people
Sales Activity
Curious about local property values? Filter the chart to assess the volume and appreciation (including resales) trends and regional comparisons, or scroll to the map below view this information at an individual property level.
Find a Recent Sale
Sales Detail
Population
Population growth drivers in Chittering are strong compared to national averages based on AreaSearch's ranking of recent, and medium to long-term trends
Chittering's population was approximately 7,381 as of November 2025. This figure shows an increase of 1,451 people from the 2021 Census, which recorded a population of 5,930. The growth is inferred from ABS data: an estimated resident population of 6,754 in June 2024 and 284 new addresses since the Census date. This results in a density ratio of 6.1 persons per square kilometer. Chittering's growth rate of 24.5% since the 2021 census surpassed the national average of 8.9%. Interstate migration contributed approximately 75.1% to this growth, though all factors were positive.
AreaSearch uses ABS/Geoscience Australia projections for each SA2 area, released in 2024 with a base year of 2022. For areas not covered by this data and post-2032 estimates, AreaSearch employs ABS Greater Capital Region projections released in 2023 based on 2022 data. Future demographic trends project above median growth for regional areas, with Chittering expected to grow by 1,161 persons to 2041, reflecting a 7.2% increase over the 17-year period.
Frequently Asked Questions - Population
Development
AreaSearch assessment of residential development activity positions Chittering among the top 25% of areas assessed nationwide
Chittering has recorded approximately 67 residential properties granted approval each year. Over the past five financial years, from FY-21 to FY-25, a total of 338 homes have been approved, with an additional 46 approved so far in FY-26. Each dwelling built over these years has attracted an average of 2.7 new residents annually, indicating solid demand that supports property values.
The average construction cost value for new homes is $322,000. This year, $21.8 million worth of commercial approvals have been registered, demonstrating moderate levels of commercial development in the area. Compared to the rest of WA, Chittering records 85.0% more construction activity per person, offering greater choice for buyers and reflecting strong developer confidence in the area. Recent building activity consists entirely of standalone homes, maintaining the area's traditional low density character with a focus on family homes appealing to those seeking space. The location has approximately 108 people per dwelling approval, indicating an expanding market.
Future projections estimate Chittering will add 533 residents by 2041, based on the latest AreaSearch quarterly estimate. Given current development patterns, new housing supply should readily meet demand, offering good conditions for buyers and potentially facilitating population growth beyond current projections.
Frequently Asked Questions - Development
Infrastructure
Chittering has moderate levels of nearby infrastructure activity, ranking in the 49thth percentile nationally
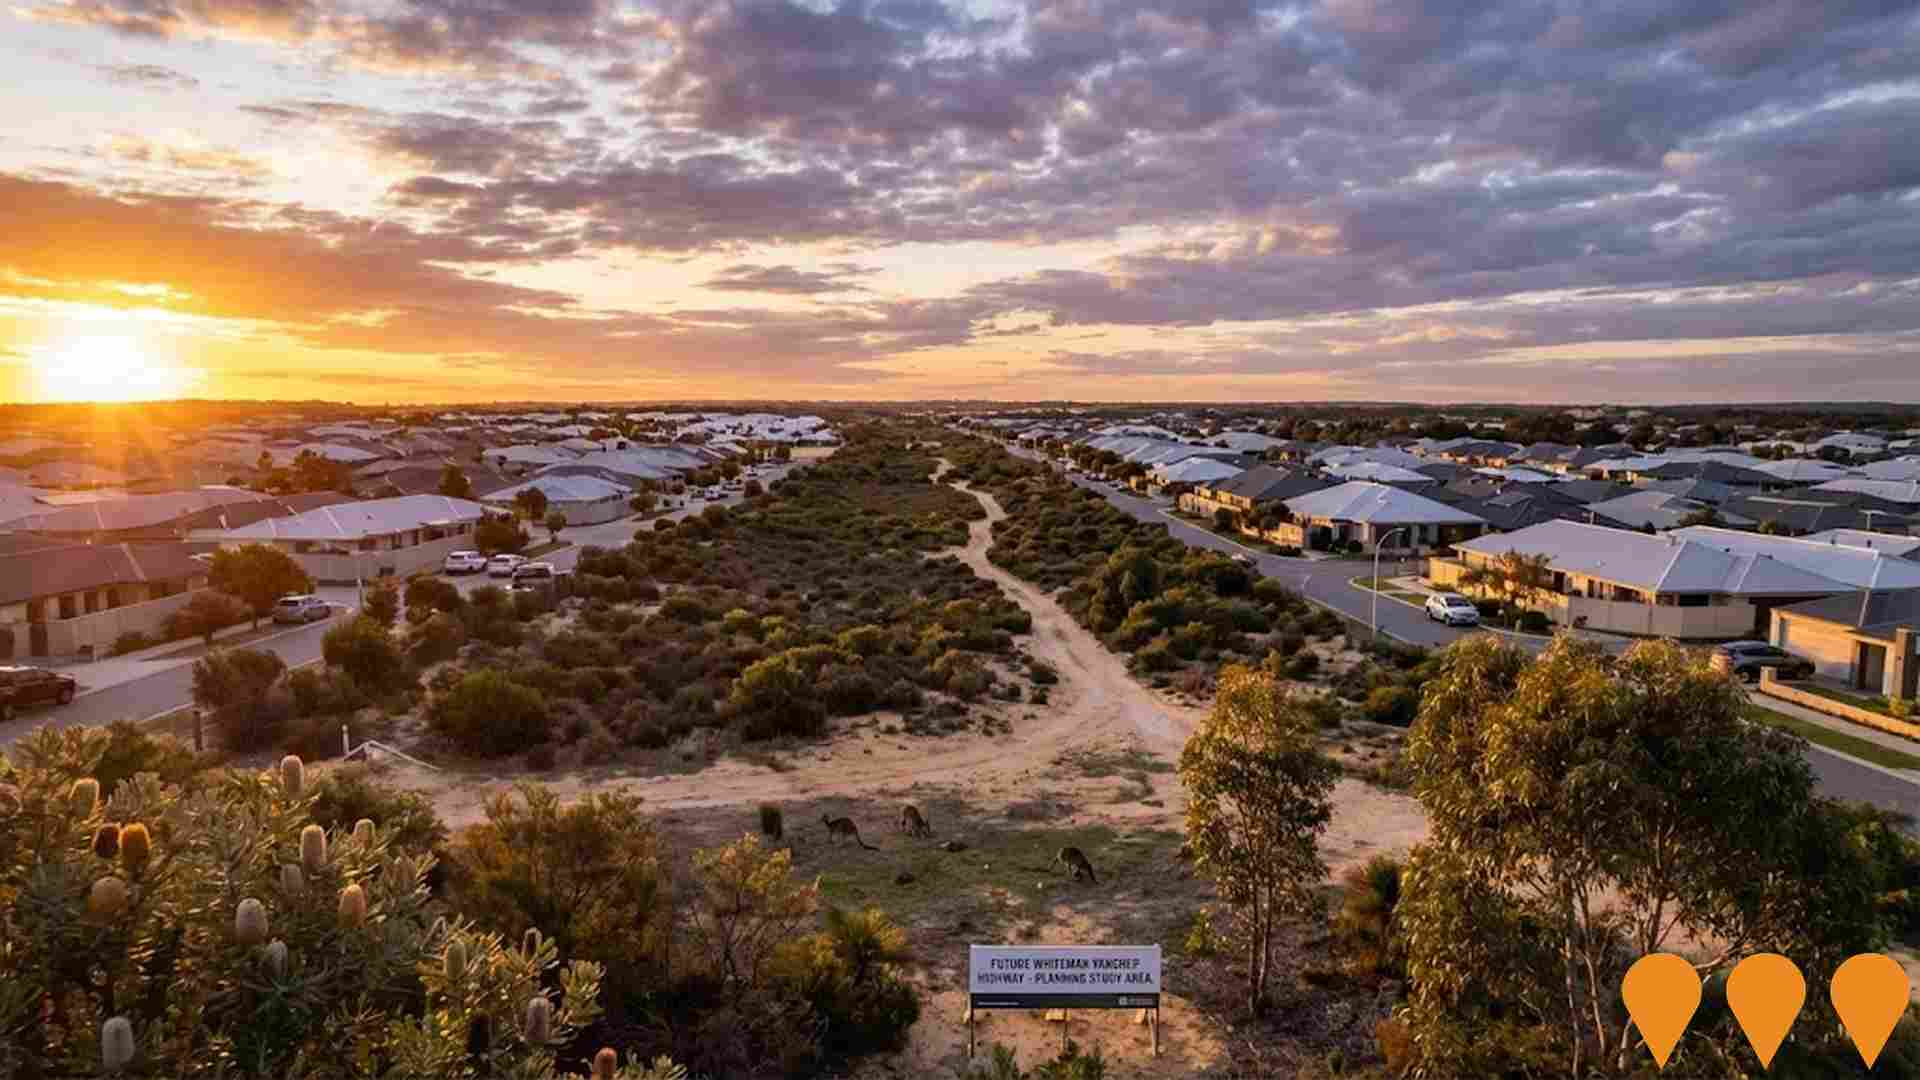
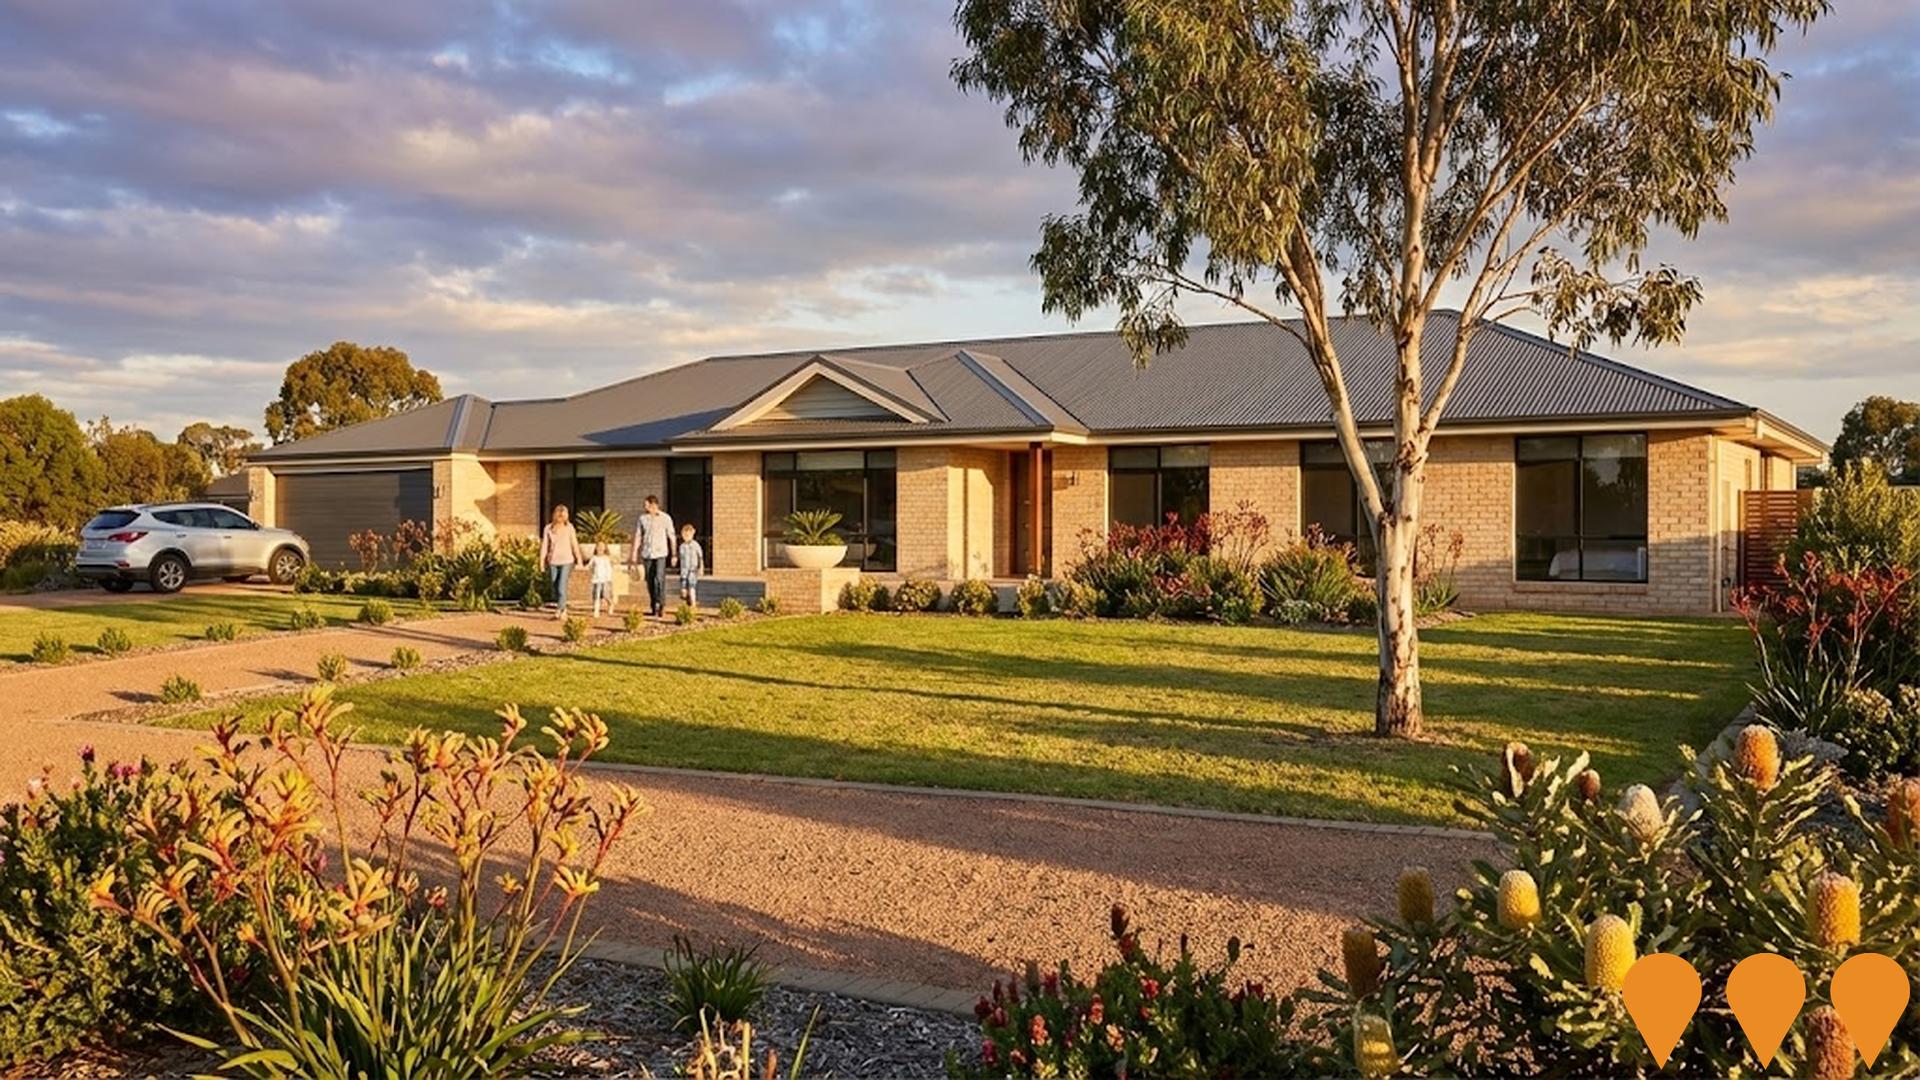
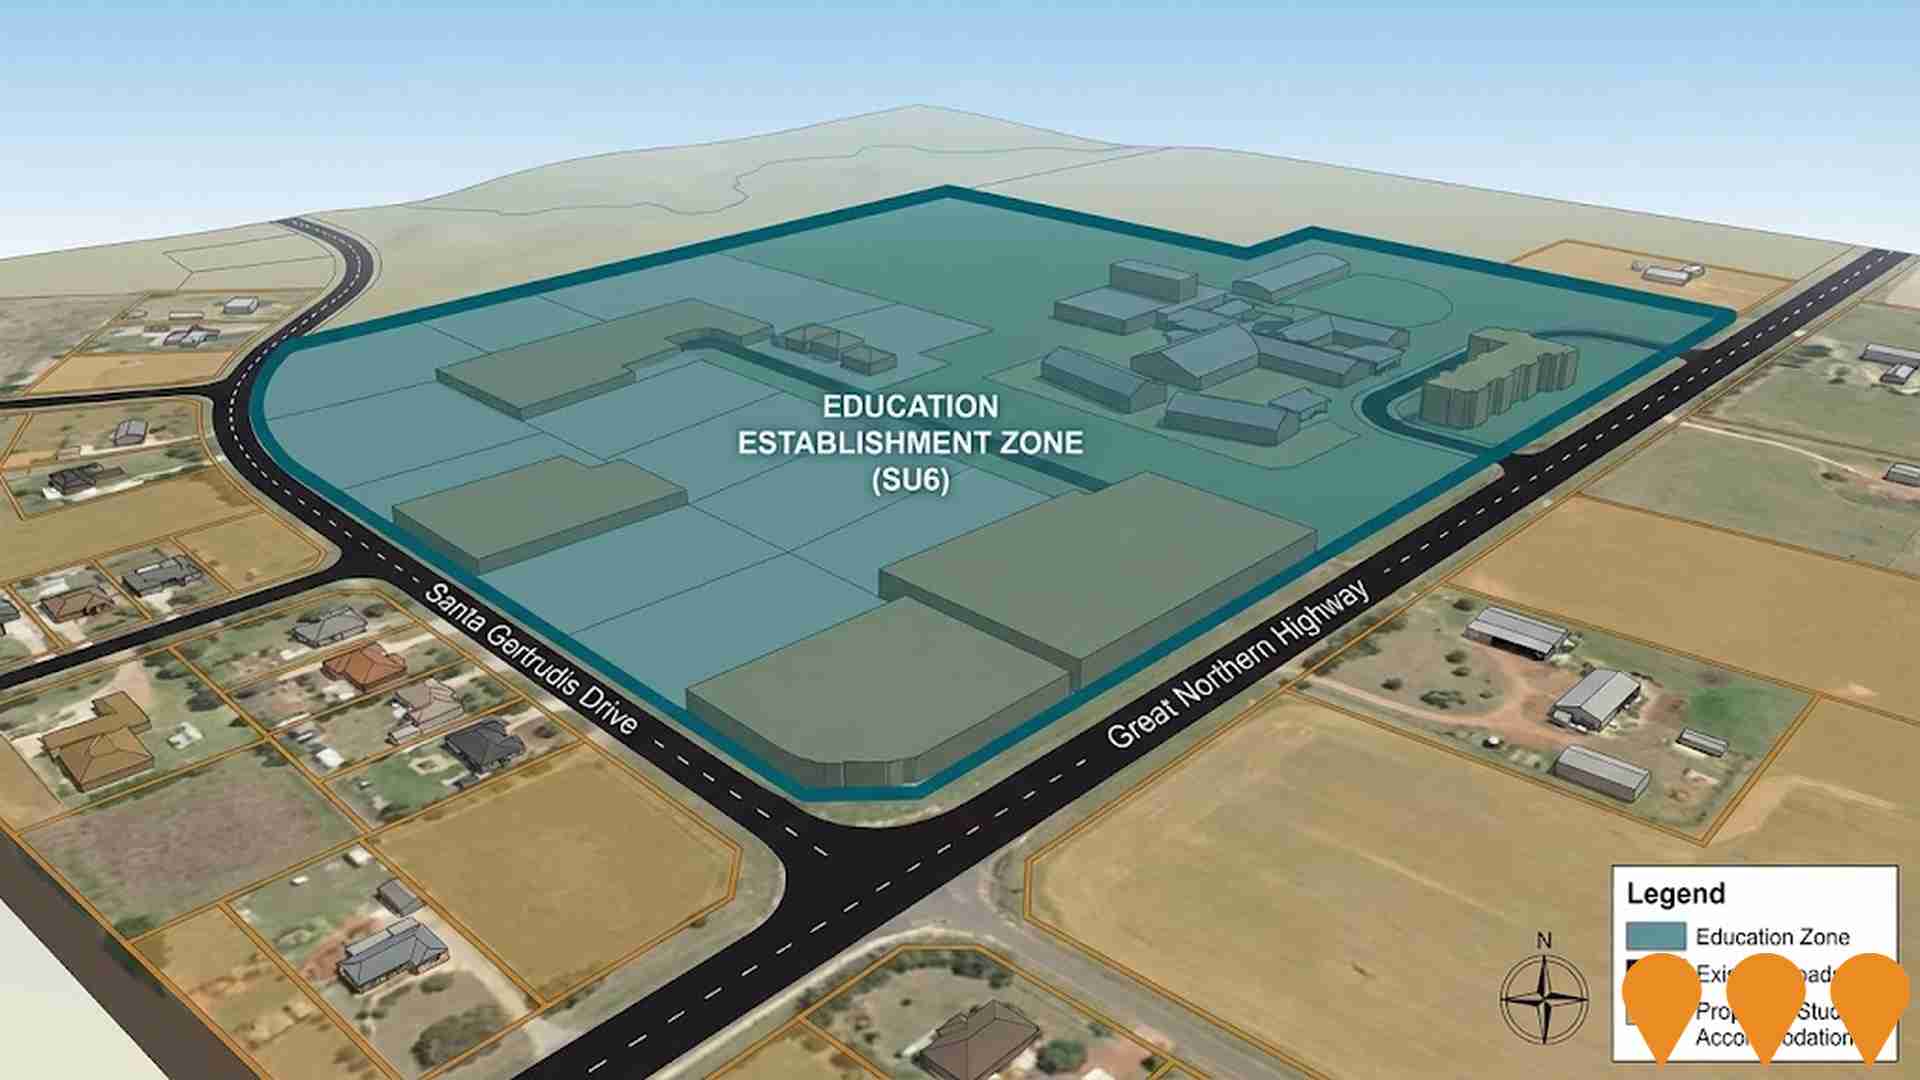
Ten projects have been identified by AreaSearch as potentially impacting the area, with key ones including the Chittering Eco-Golf Resort and Luxury Estates, Maryville Downs Estate, Shire of Chittering Local Planning Scheme 6 Amendment 75 (Education Establishment Zone), and Ridgeview Estate. The following list details those likely to be most relevant.
Professional plan users can use the search below to filter and access additional projects.
INFRASTRUCTURE SEARCH
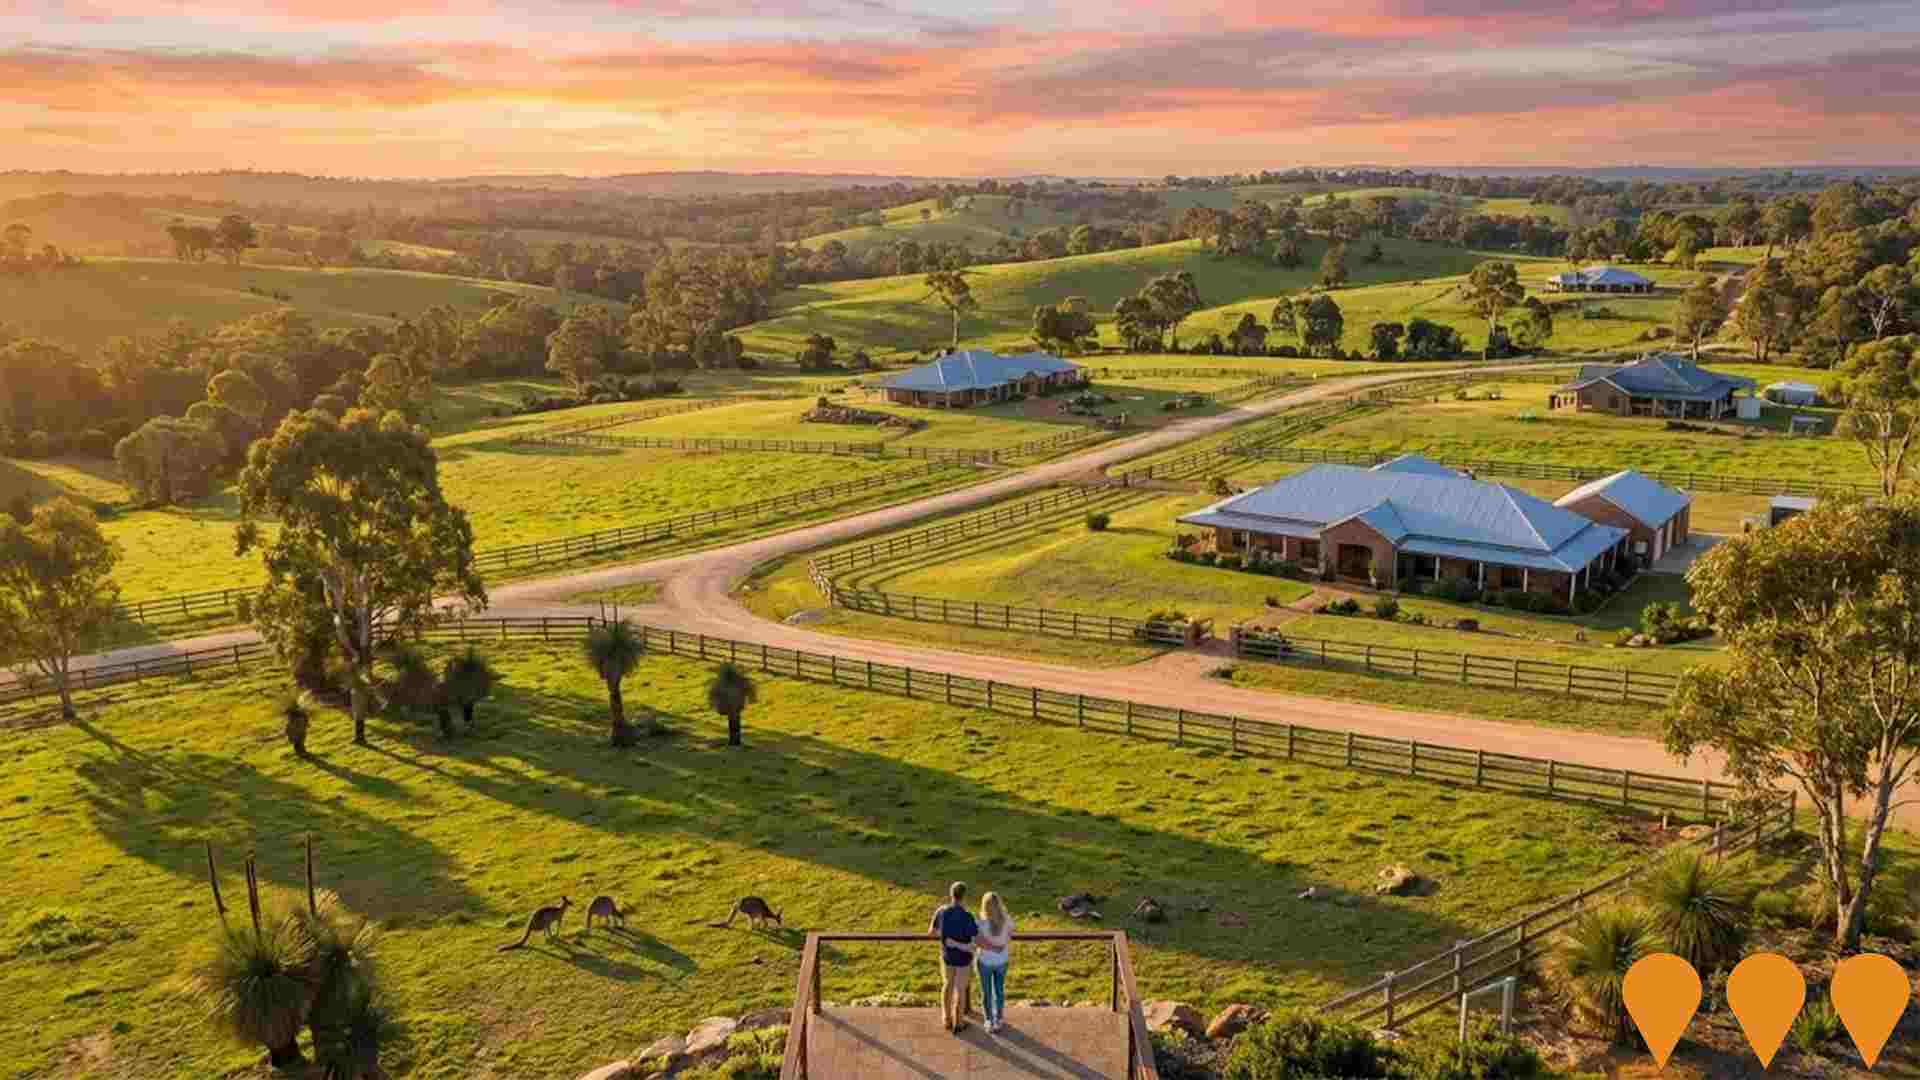
 Denotes AI-based impression for illustrative purposes only, not to be taken as definitive under any circumstances. Please follow links and conduct other investigations from the project's source for actual imagery. Developers and project owners wishing us to use original imagery please Contact Us and we will do so.
Frequently Asked Questions - Infrastructure
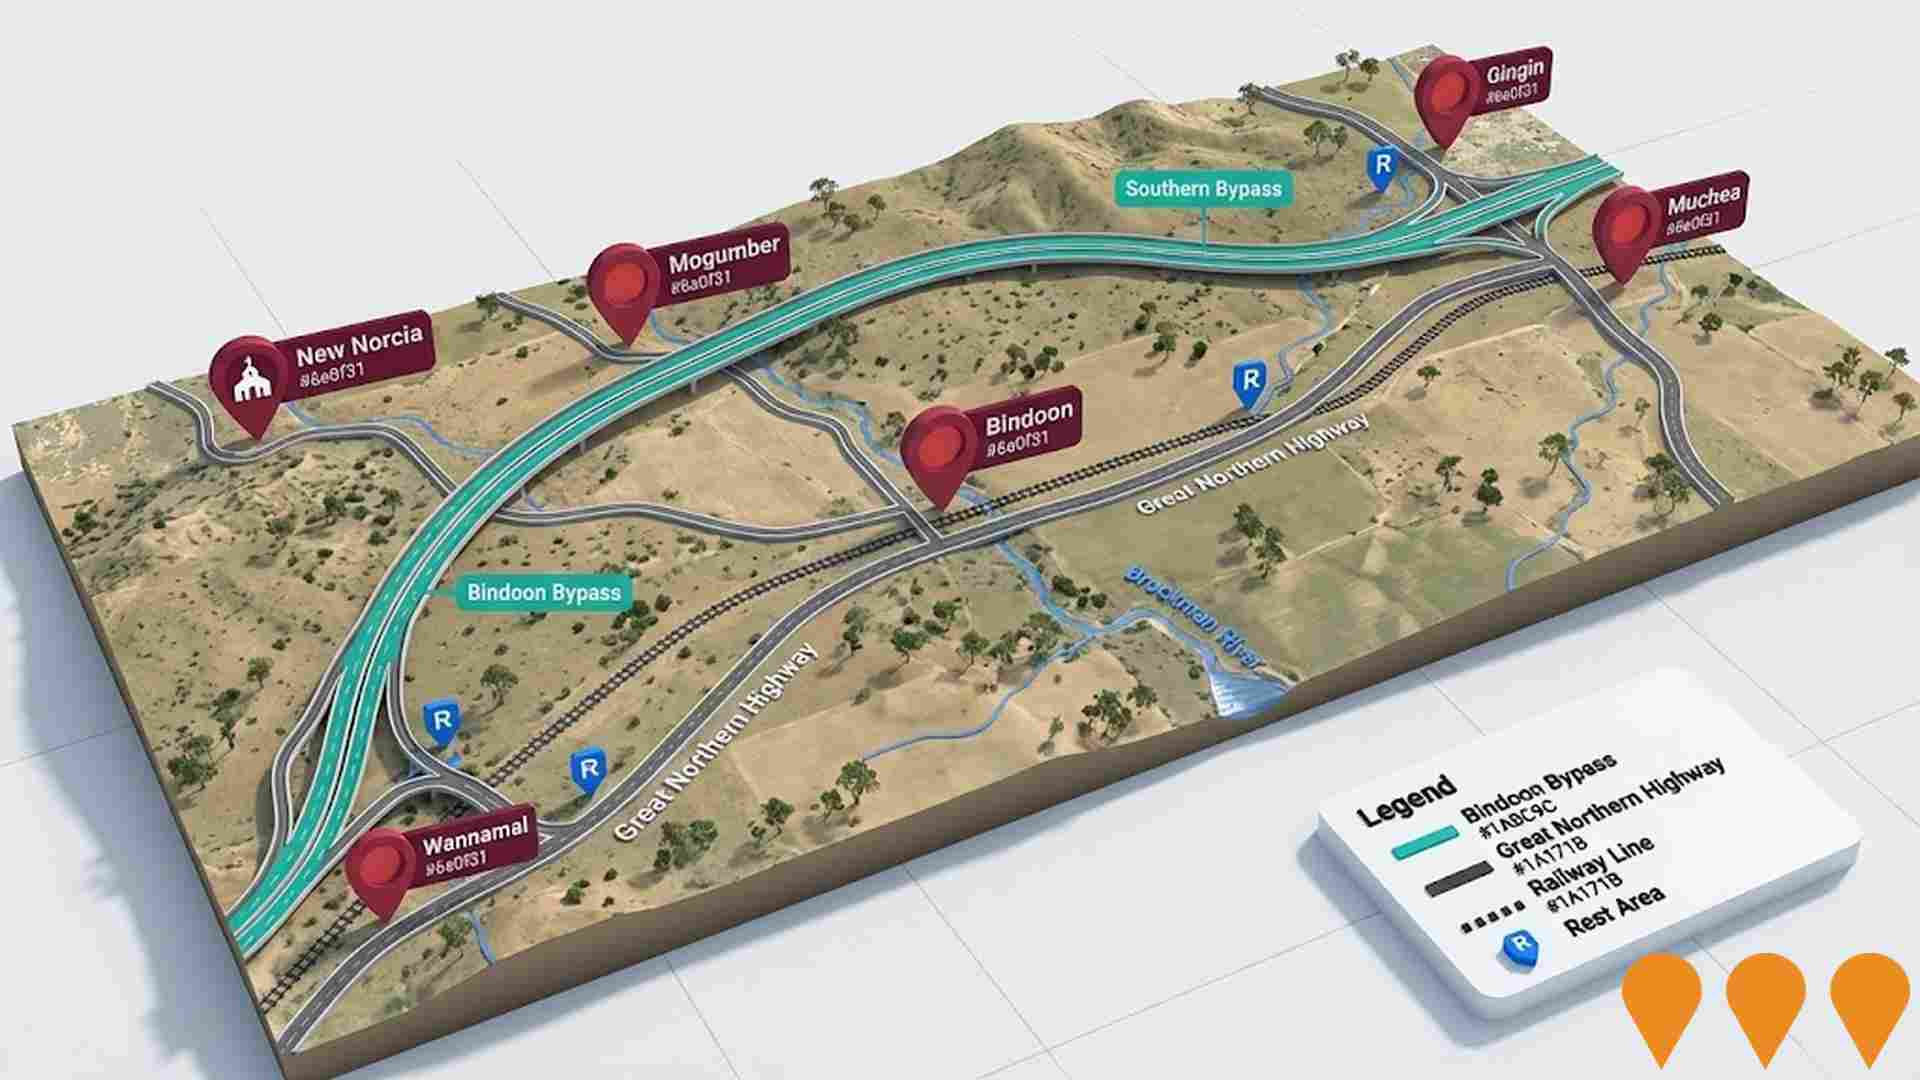
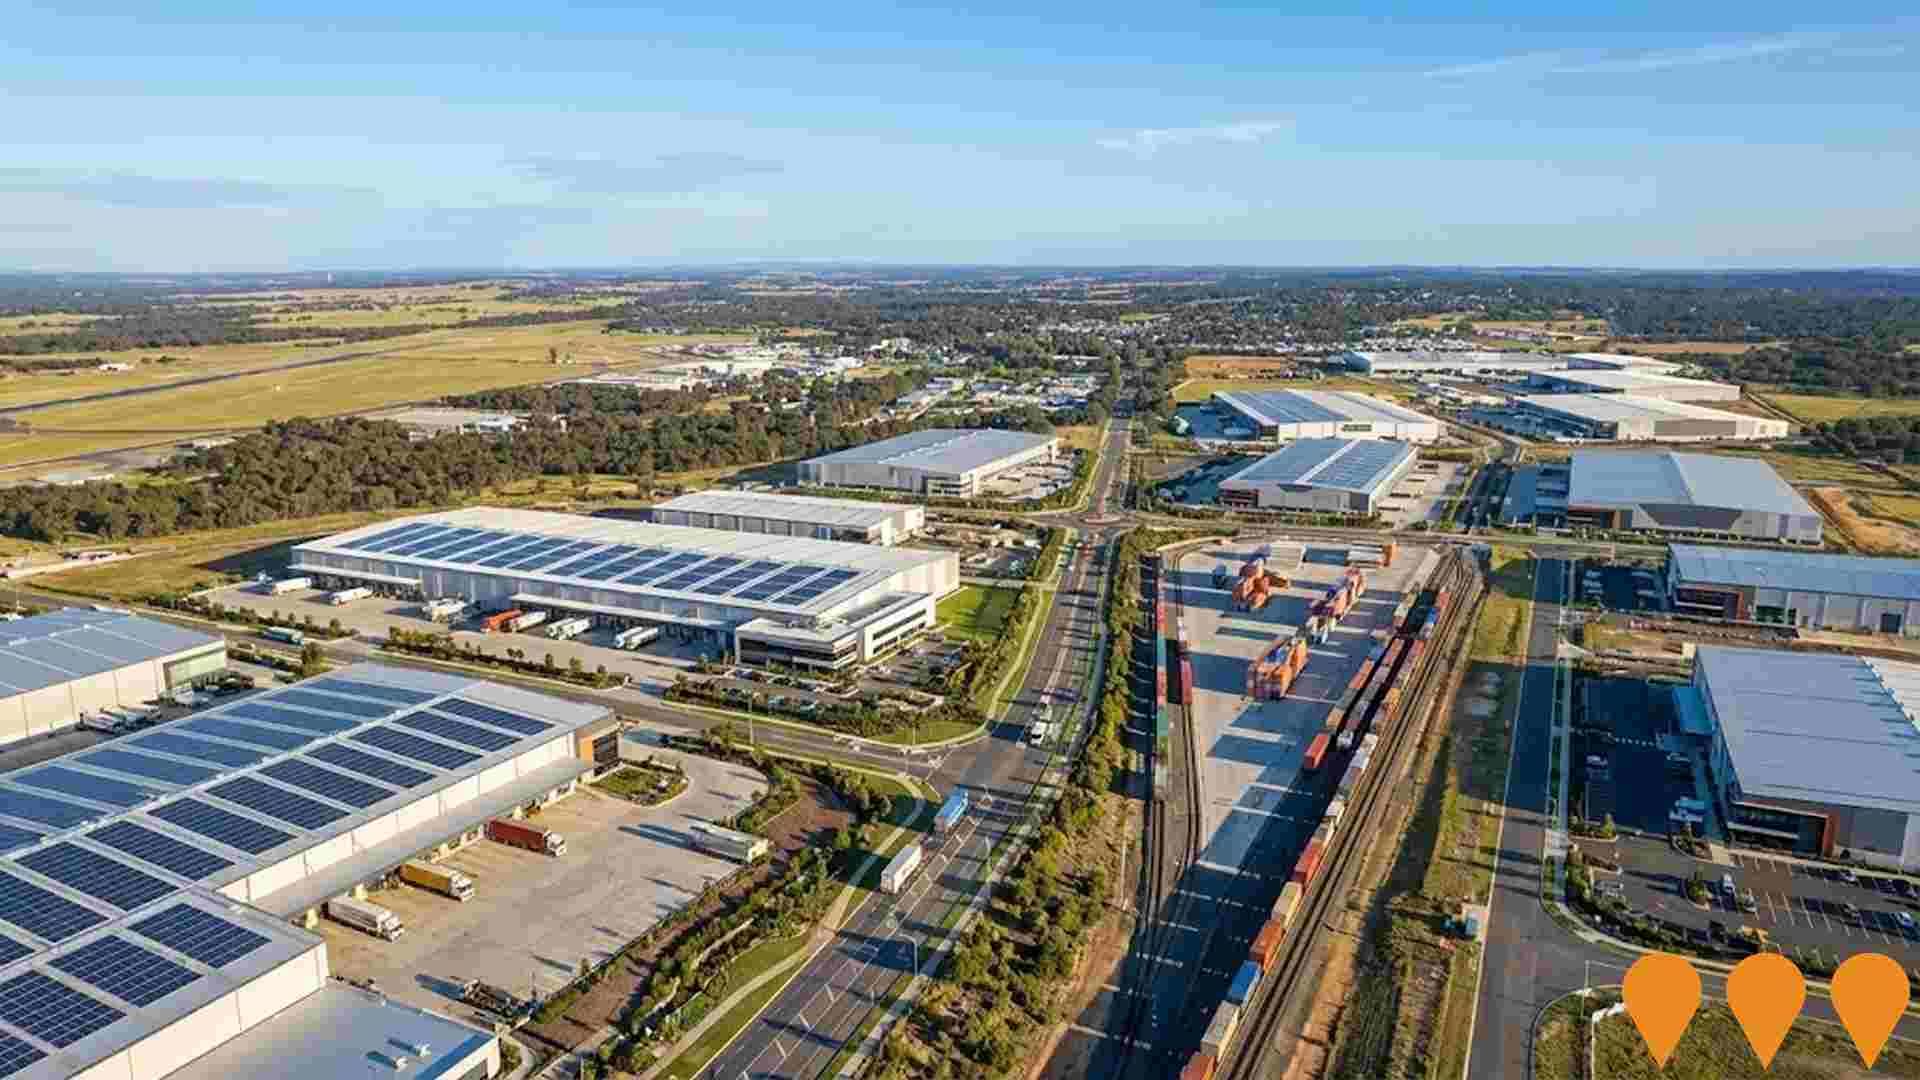
Bullsbrook Freight and Industrial Land Use Strategy
Long-term strategic framework to guide the development of over 2,500 hectares of industrial and employment land in Bullsbrook, supporting a future intermodal freight terminal and associated logistics and advanced manufacturing uses. Expected to generate up to 40,000 jobs over a 50+ year horizon.
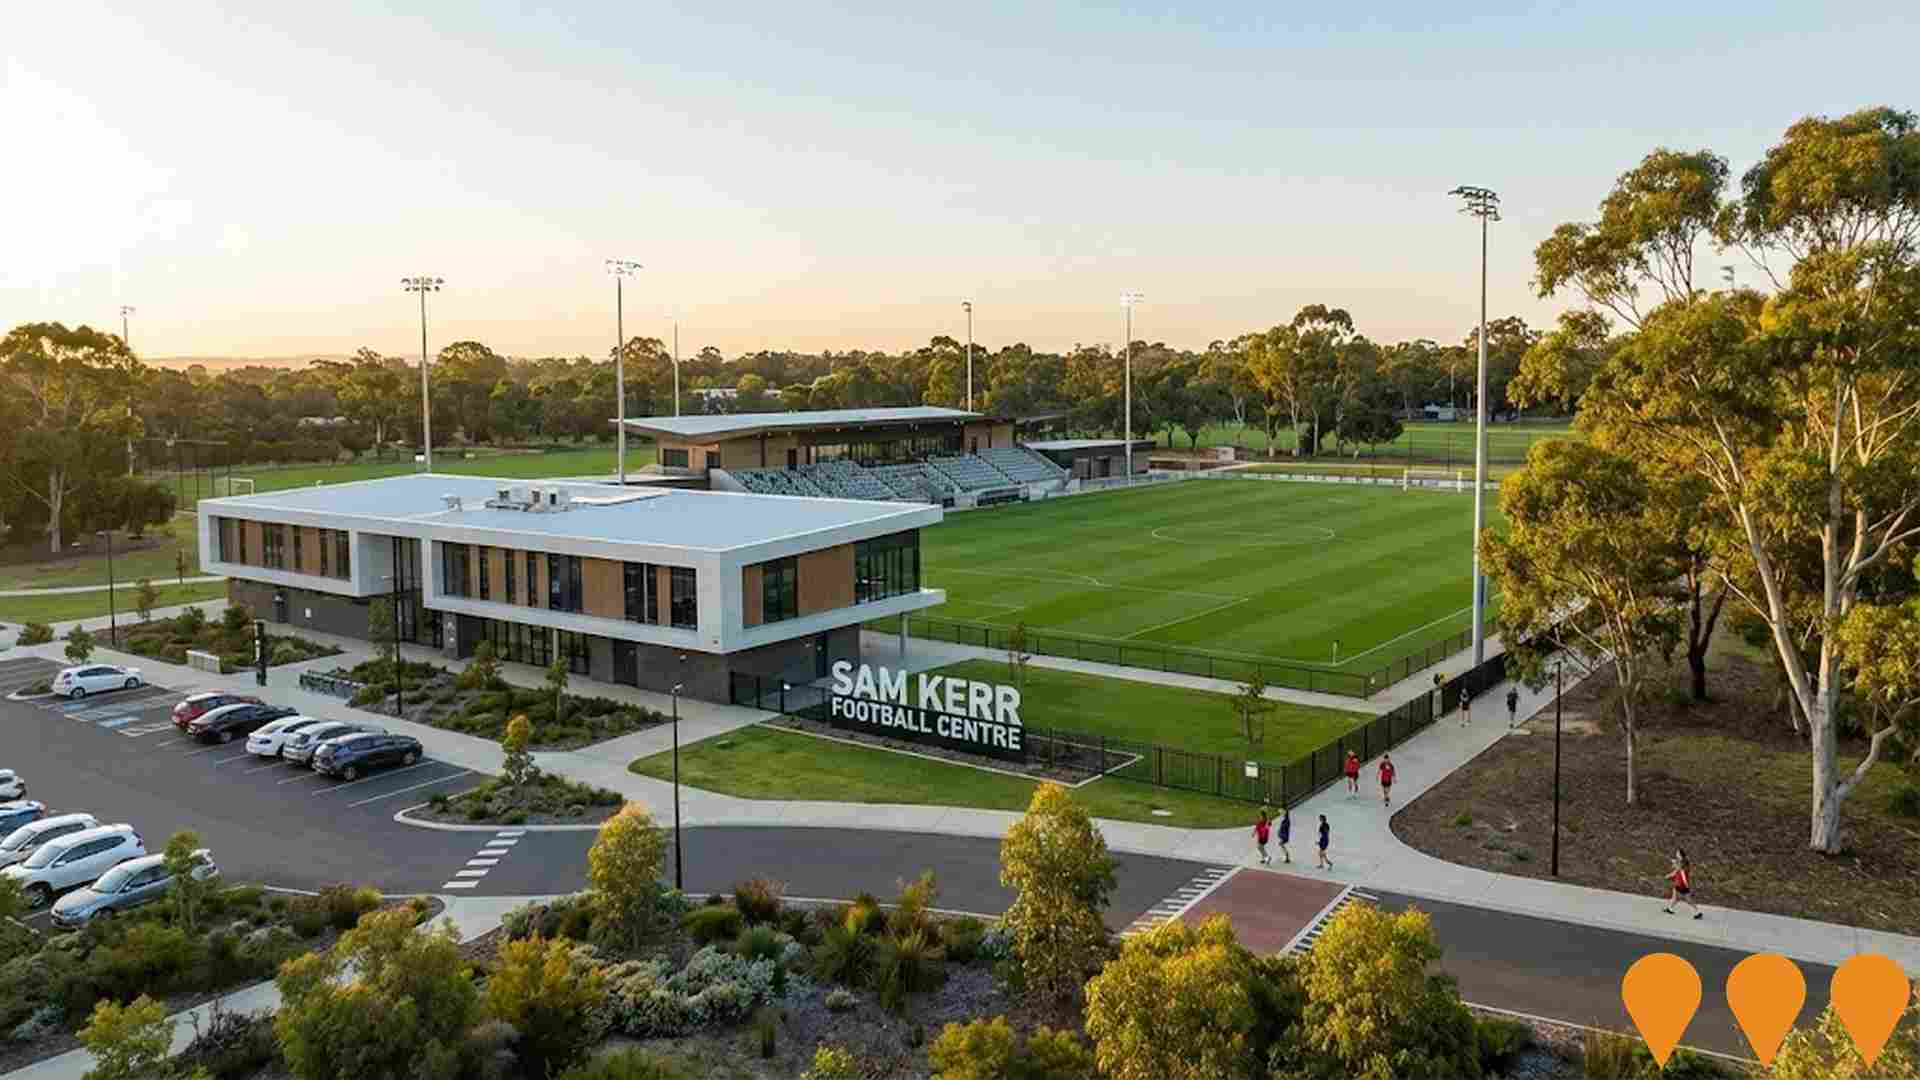
Sam Kerr Football Centre and Queens Park Regional Open Space
A major sporting precinct incorporating the completed $50.8 million State Football Centre (Sam Kerr Football Centre) and the Queens Park Regional Open Space. The facility features two competition pitches, a grandstand for 700 spectators, and high-performance training amenities. While the main centre opened in late 2023, a $4 million Stage 2 expansion is currently under construction to deliver two additional pitches and lighting, scheduled for completion in January 2026. The wider precinct includes community cricket facilities, a pump track, and biodiversity enhancements.
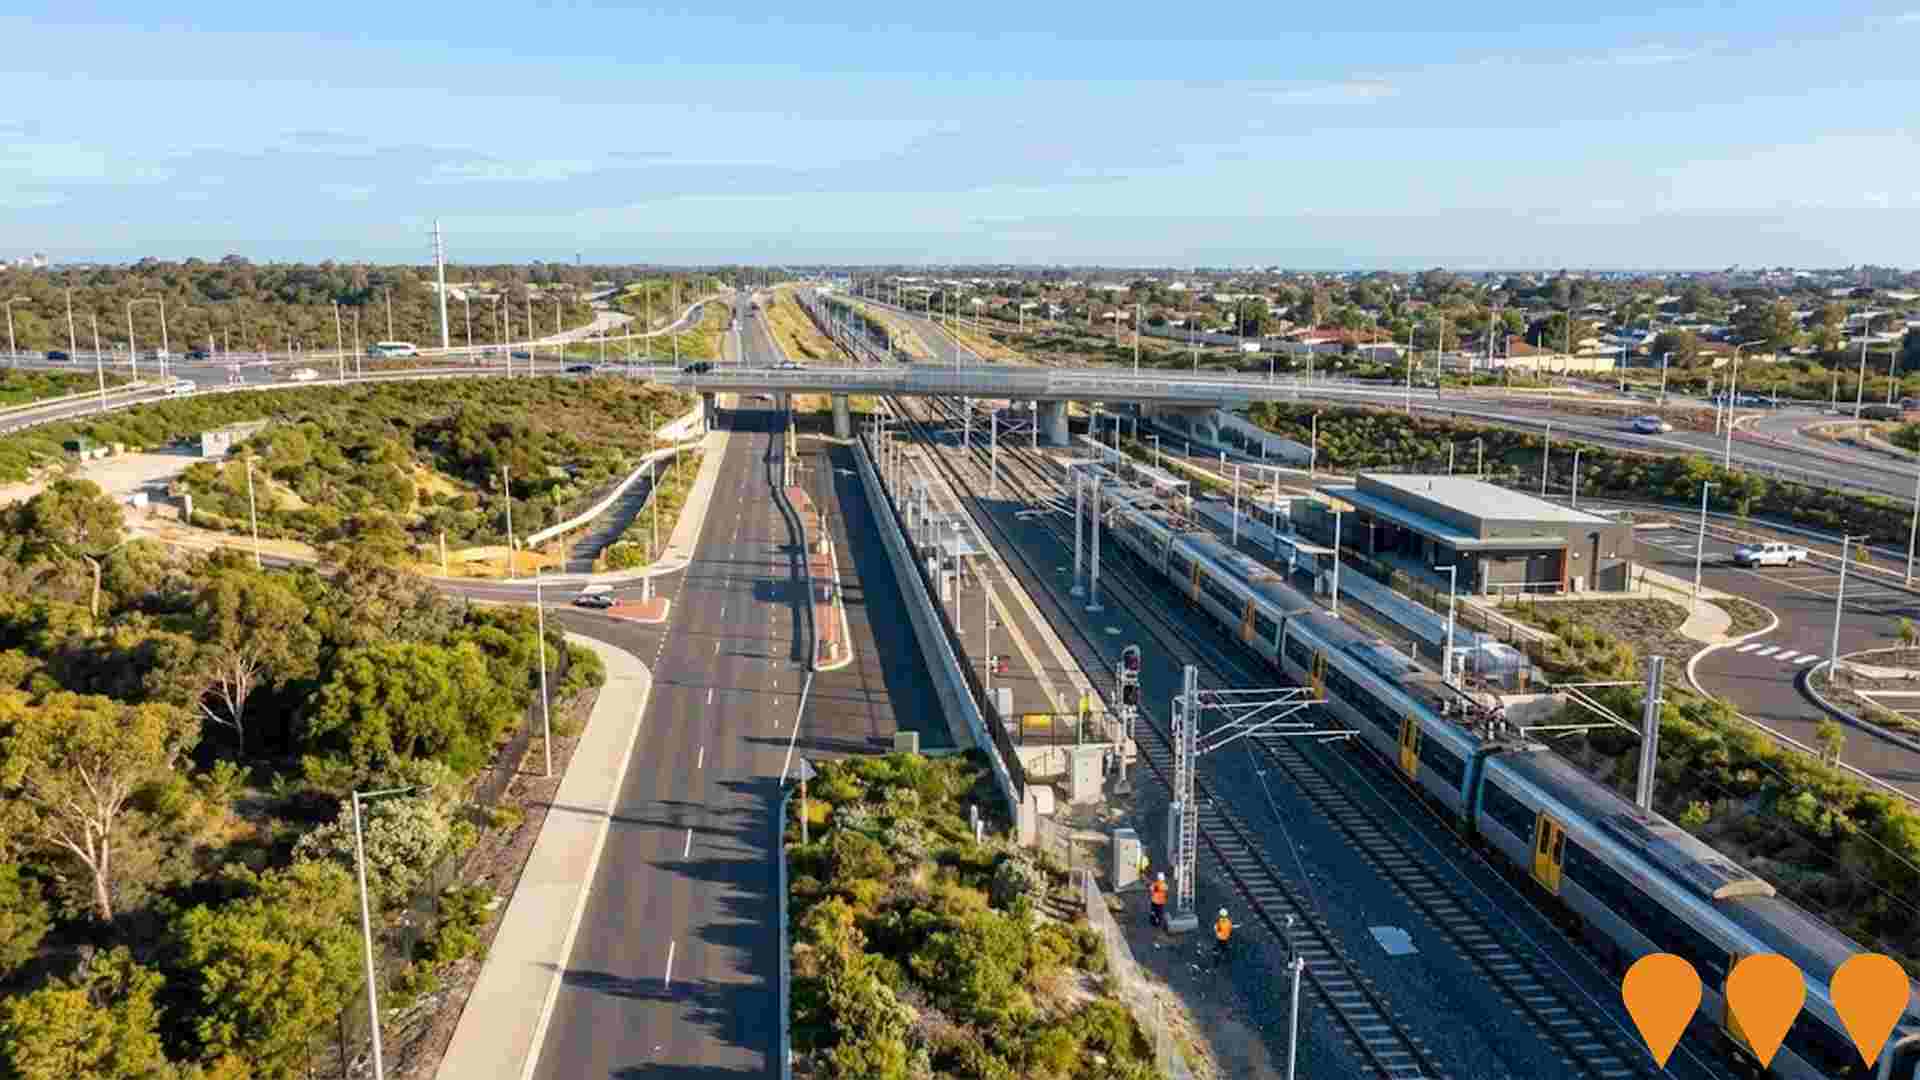
METRONET High Capacity Signalling Project
City wide upgrade of Perth's urban rail signalling and train control systems to a communications based train control automatic train control system across about 500 km of the Transperth network, increasing capacity by up to 40 percent and supporting more frequent, reliable METRONET passenger services. Works include new in cab signalling, trackside equipment, integration with the Public Transport Operations Control Centre and digital radio, delivered progressively over about a decade.
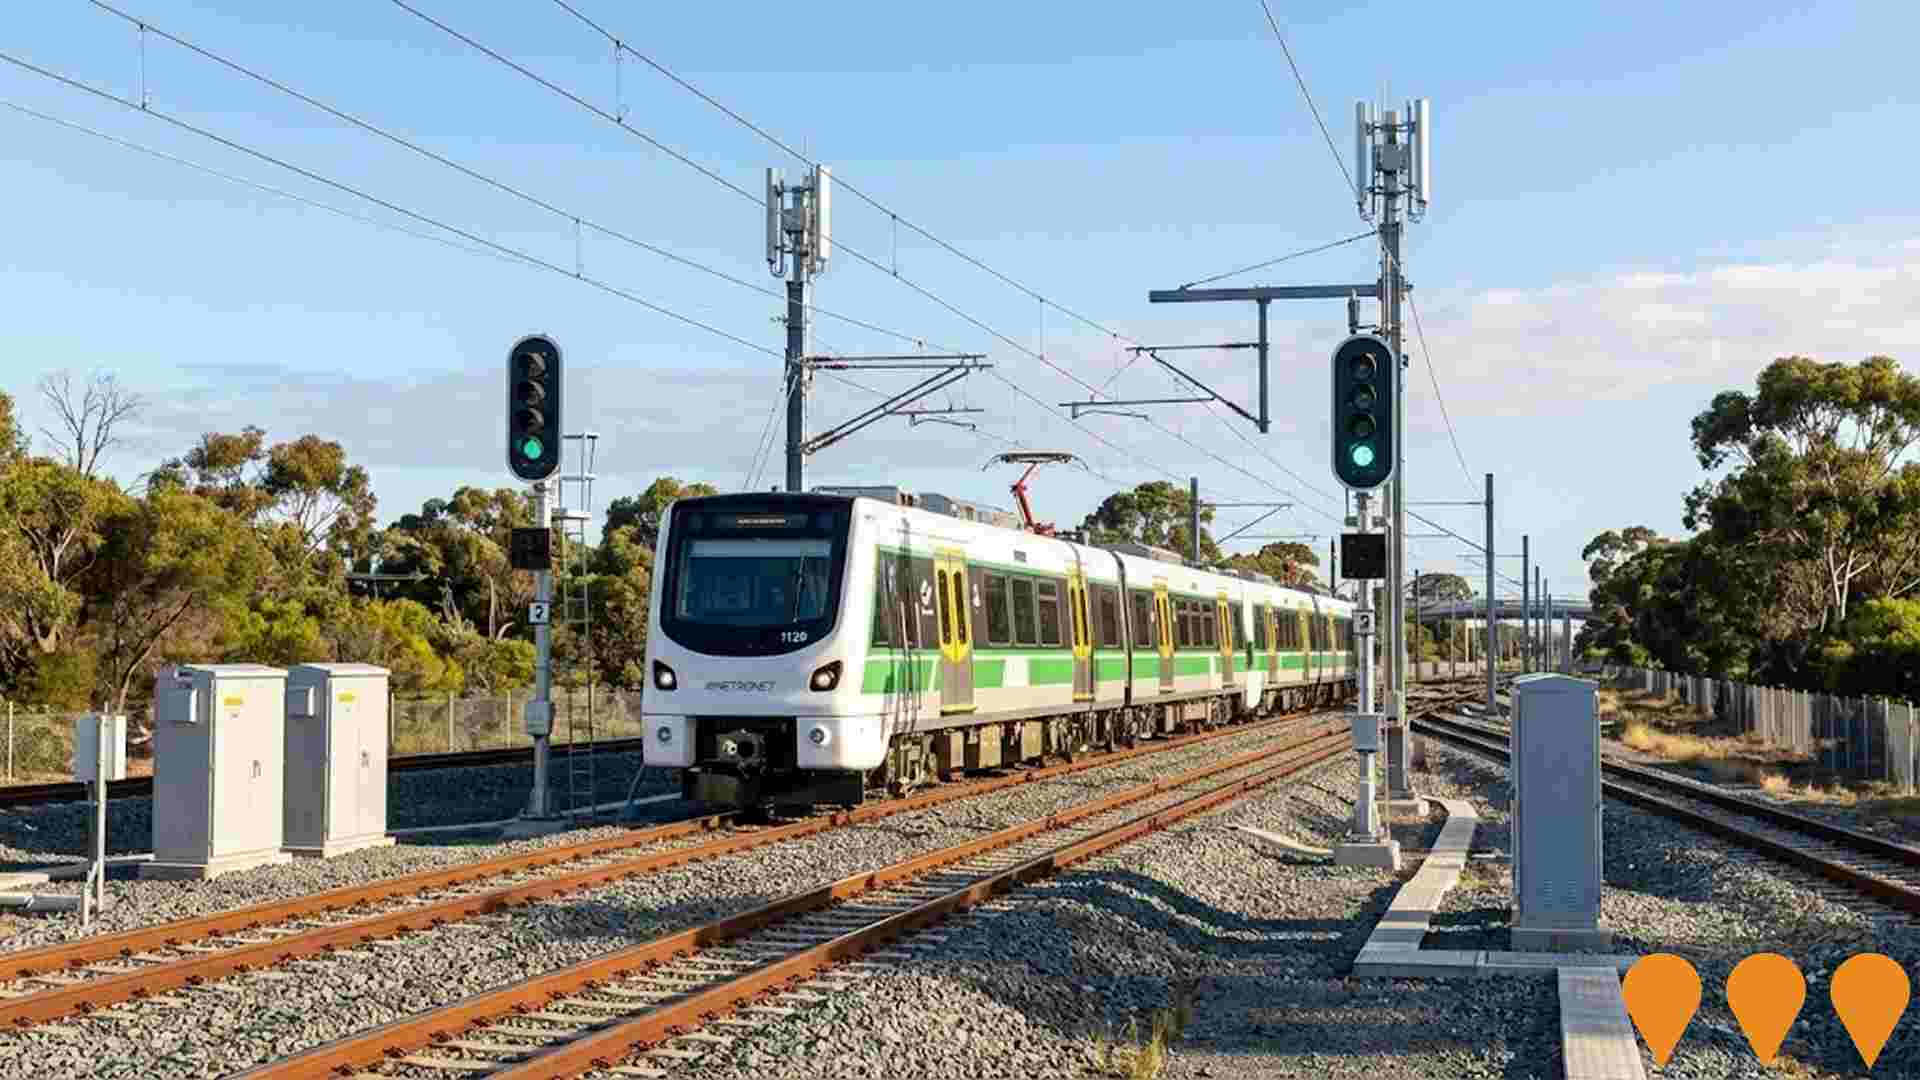
METRONET High Capacity Signalling Program
The High Capacity Signalling Project will upgrade the existing signalling and control systems to an integrated communications-based train control system, making better use of the existing rail network by allowing more trains to run more often. The project aims to increase network capacity by 40 percent, provide energy-saving benefits, enhance cybersecurity, and future-proof the network for growth.
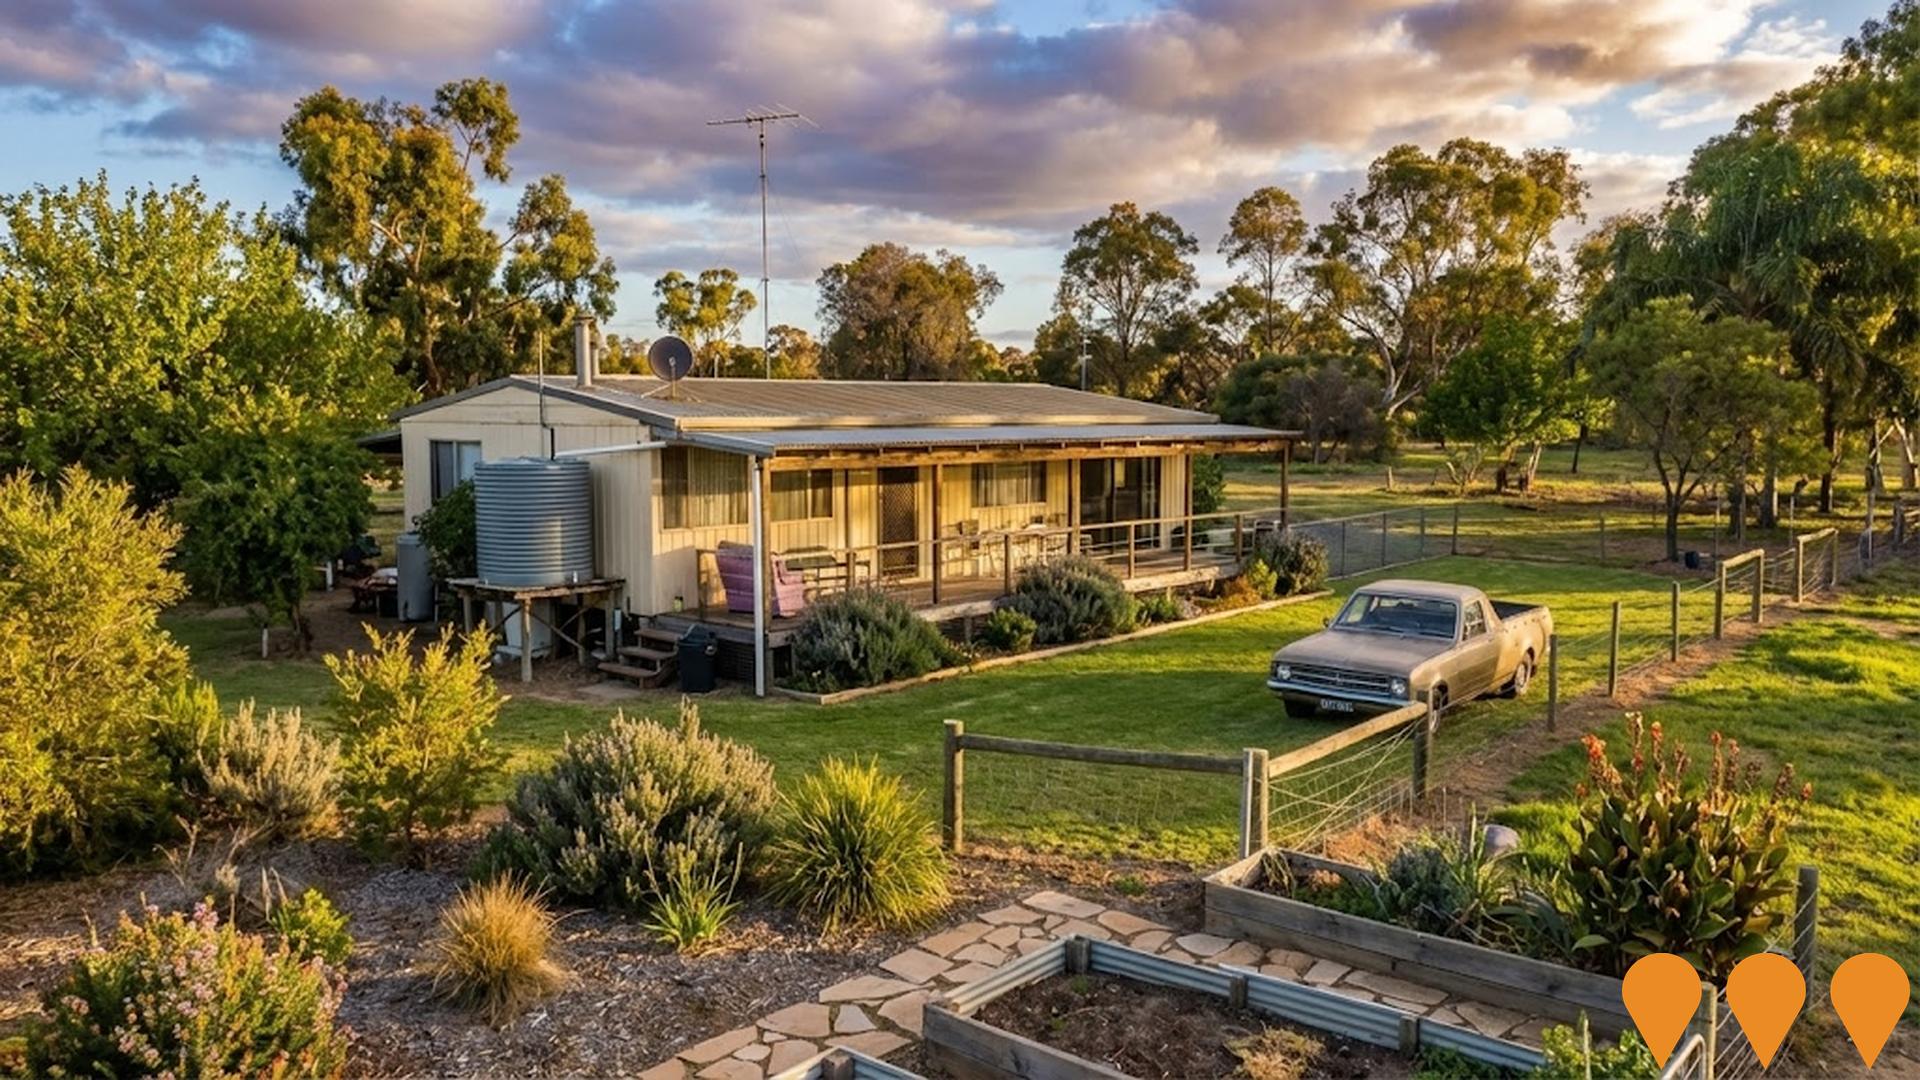
Chittering Eco-Golf Resort and Luxury Estates
Integrated eco-tourism resort and estates in the Chittering Valley using the NXT Building System. The approved structure plan covers a 50 ha portion of Lot 101 for an integrated tourist resort with residential resort lots, short-stay villas and guest facilities. The broader property is ~475 ha. Adjacent showcase residence Madalyn Manor has its own separate approval. No verified public notice of resort construction commencement found; structure plan approval remains current.
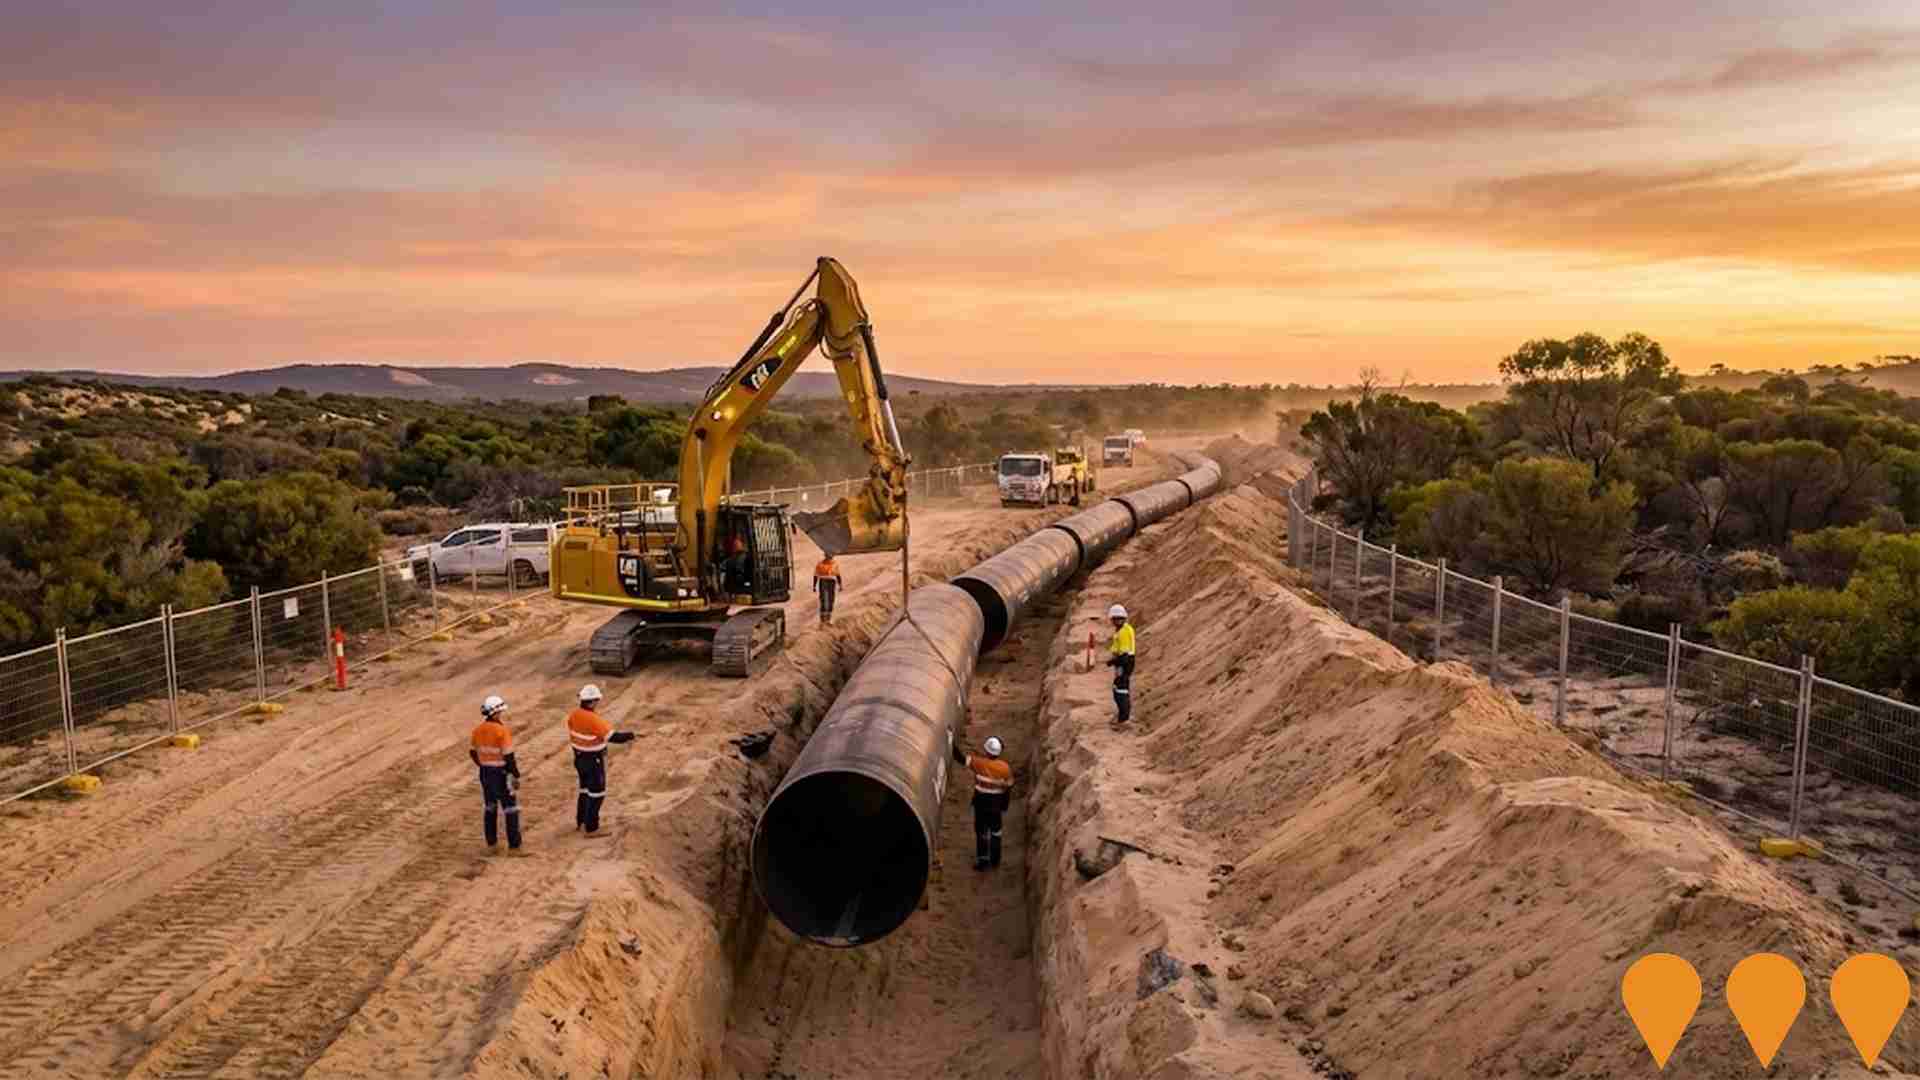
Alkimos to Wanneroo Desalination Pipeline
Below-ground trunk main of about 33.5km connecting the future Alkimos Seawater Desalination Plant to Wanneroo Reservoir, with offtakes to Carabooda Tank and the future Nowergup Tank. Largest drinking water pipeline built by Water Corporation at up to 1600mm diameter. Status: in construction with staged works commencing late July 2025 and delivery by 2027.
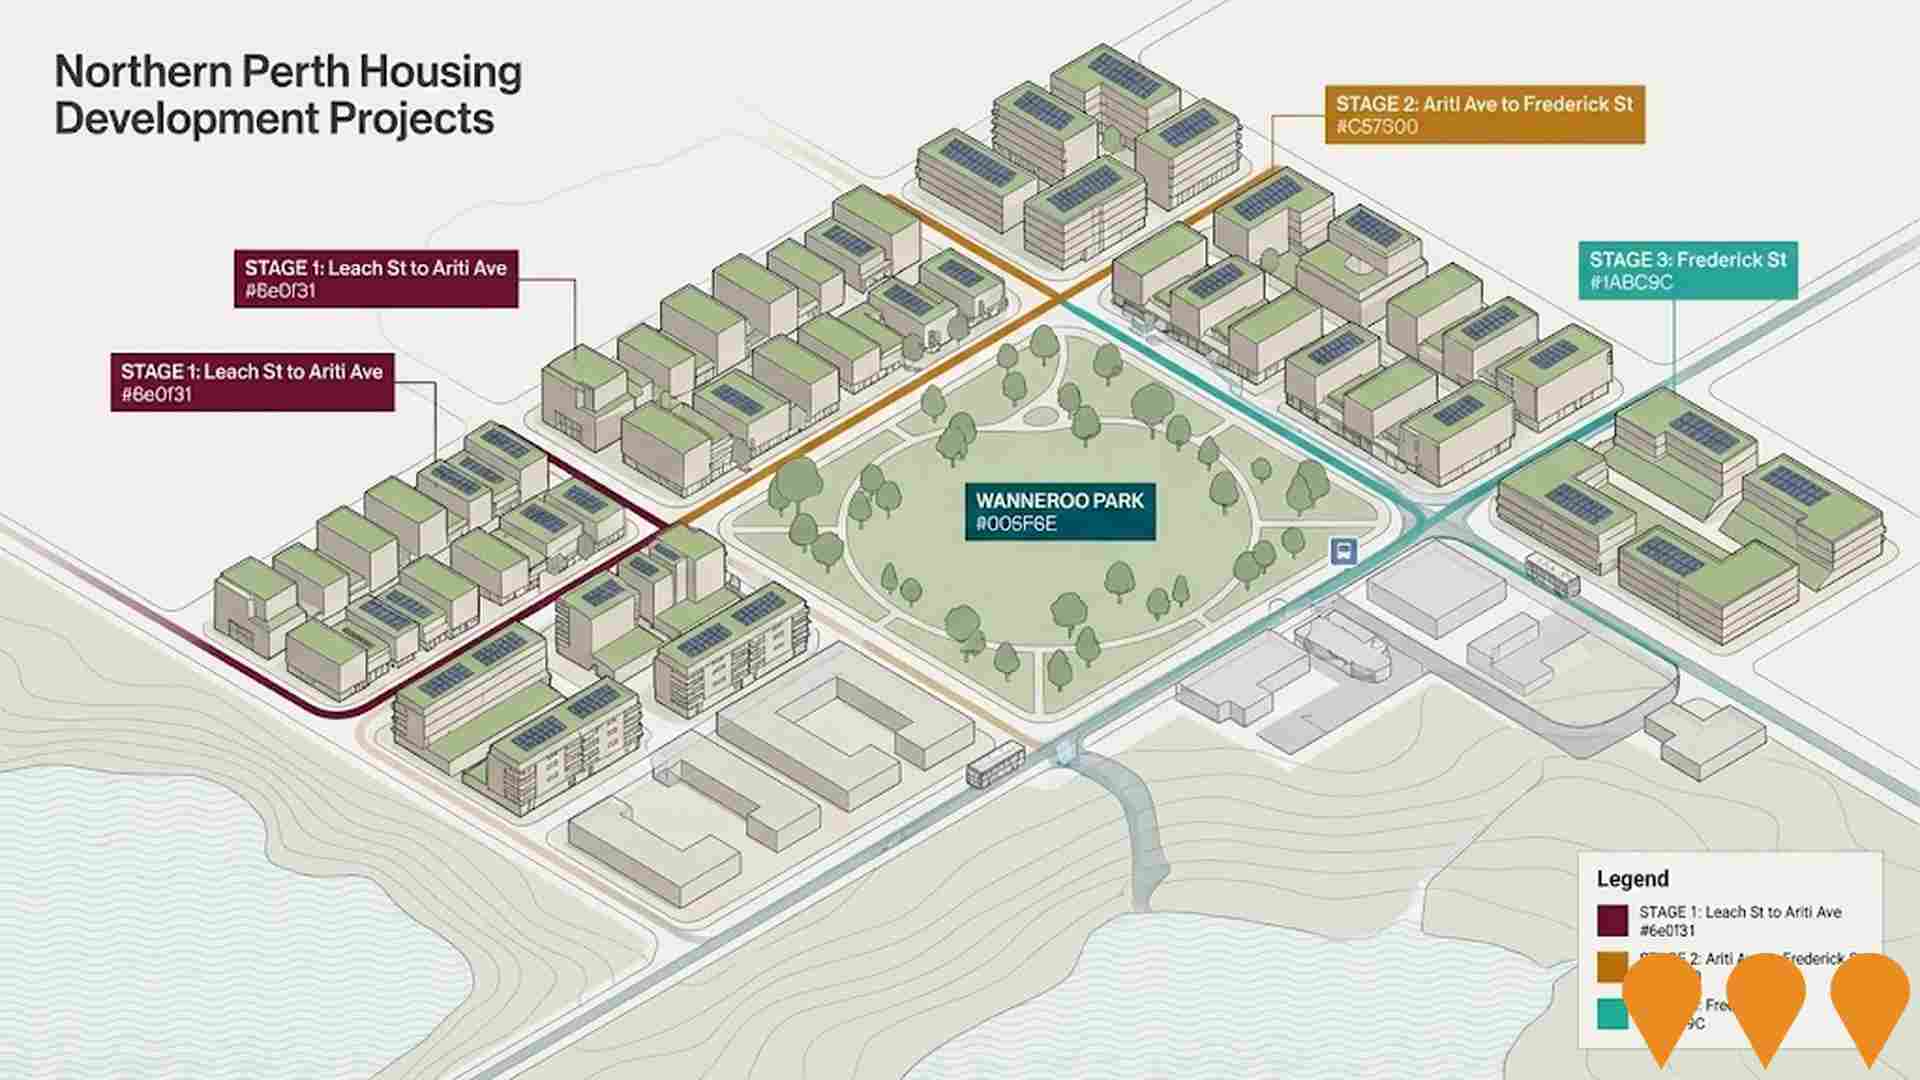
Northern Perth Housing Development Projects
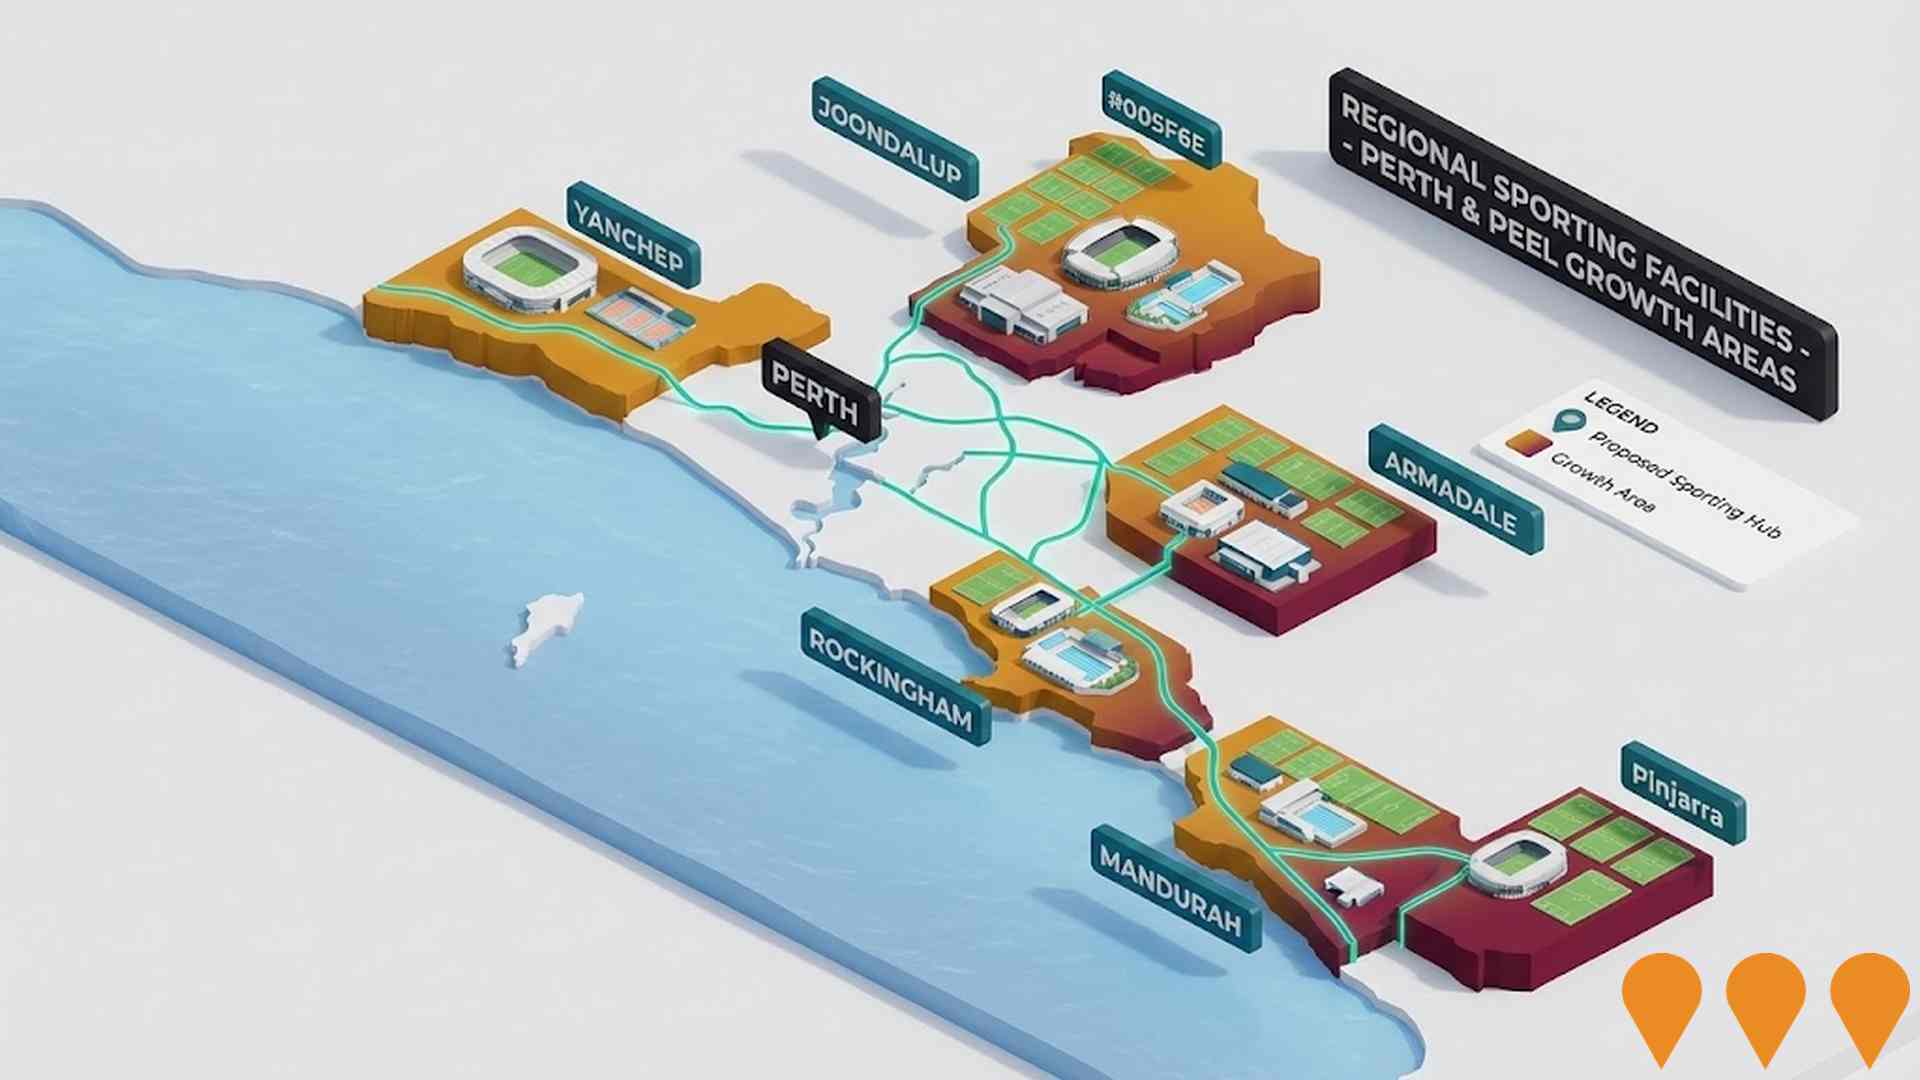
Coordinated housing development initiatives across northern Perth suburbs to address growing demand. Features sustainable residential communities, integrated transport links, community facilities, and environmental conservation measures designed to support population growth while maintaining livability. Supports Perth's northern corridor growth strategy.
Maryville Downs
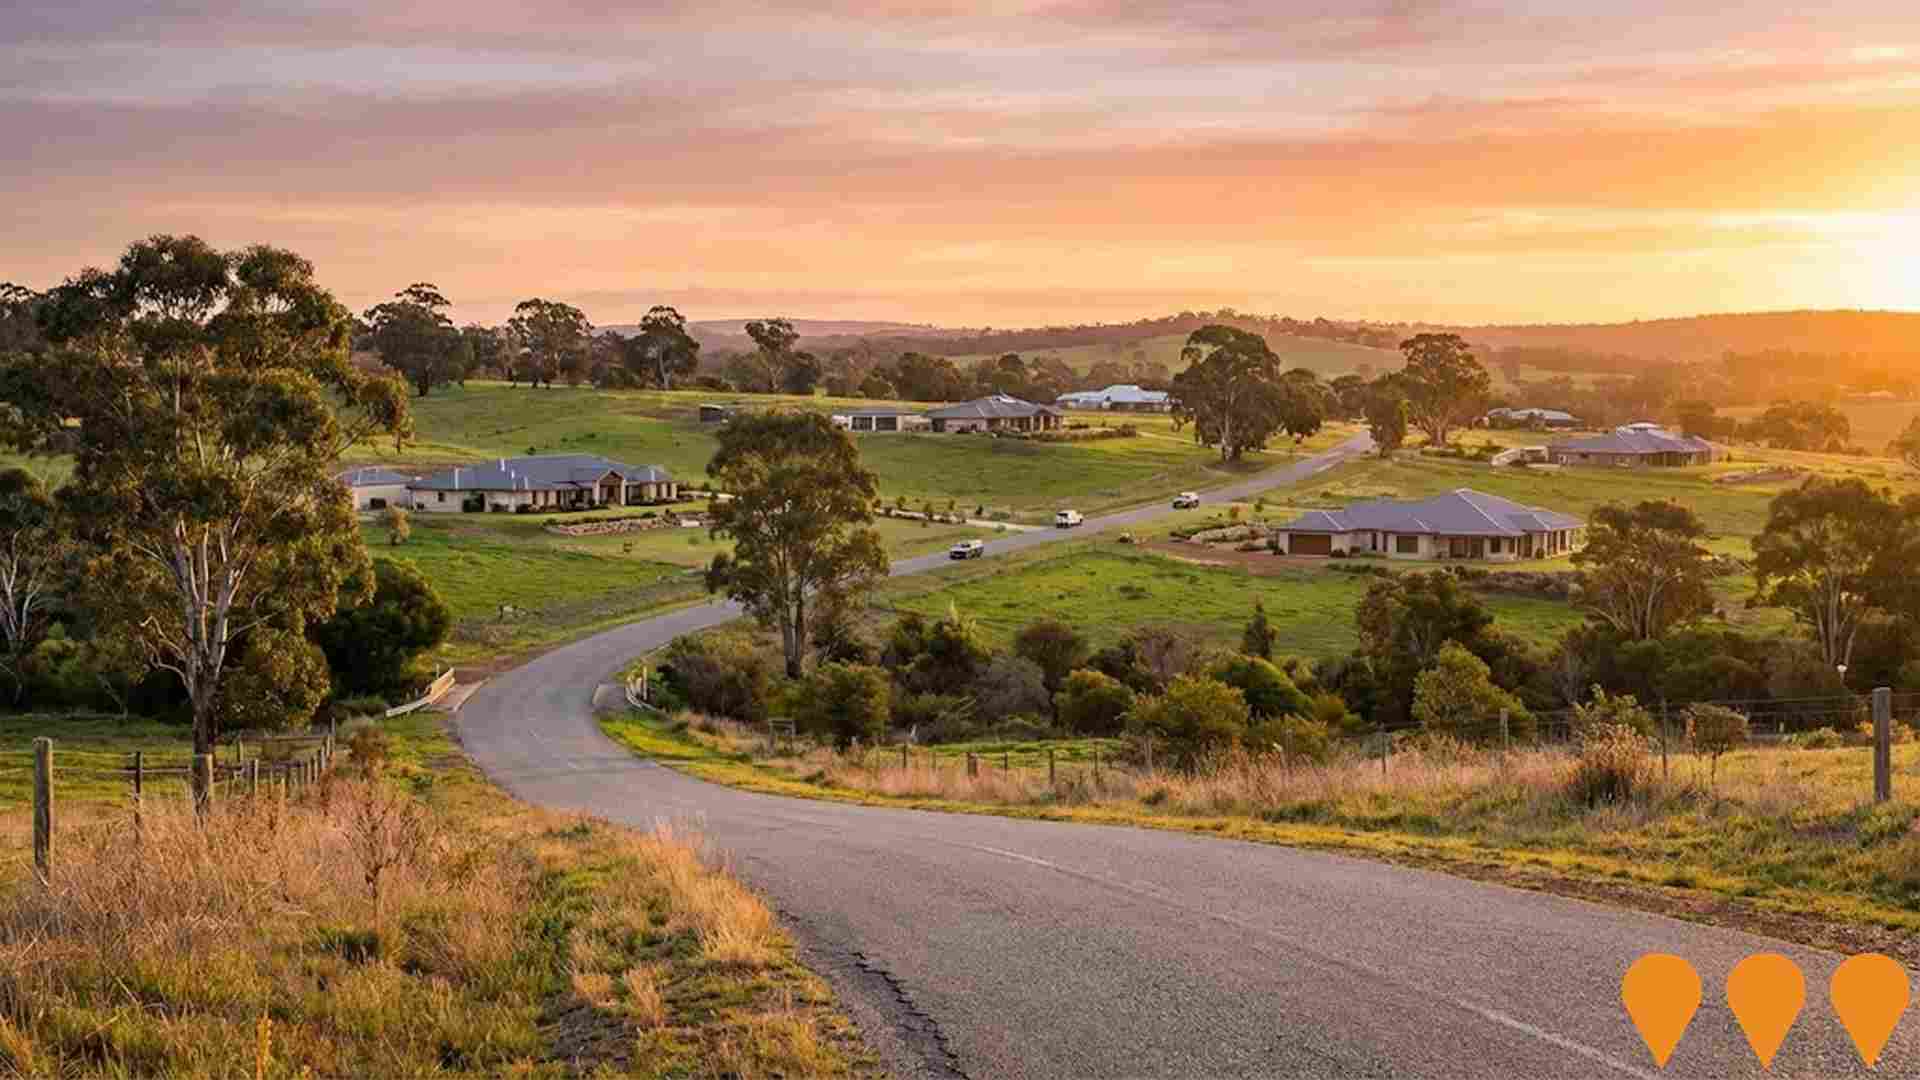
Maryville Downs is a rural lifestyle estate in Lower Chittering developed by QUBE Property Group. The project delivers 2 to 10 hectare lots in a semi rural setting about an hour north of Perth, with green rolling hills, large building envelopes and easy access to Bullsbrook and the wider Swan region. Land releases have sold out and the estate now functions as an established rural residential community.
Employment
Employment conditions in Chittering demonstrate exceptional strength compared to most Australian markets
Chittering has a diverse workforce with both white and blue-collar jobs, notable in construction. As of September 2025, it has an unemployment rate of 0.8%.
Compared to Rest of WA's 3.3%, Chittering's rate is 2.4% lower, while its workforce participation is 62.2%, slightly higher than the regional average of 59.4%. Key industries include construction, mining, and agriculture, forestry & fishing. Construction stands out with an employment share 1.5 times the regional level. Conversely, accommodation & food services are under-represented at 3.3% compared to Rest of WA's 7.1%.
Local employment opportunities appear limited as Census data shows fewer working residents than expected based on population. Between September 2024 and September 2025, labour force levels decreased by 4.0%, with employment also declining by the same percentage, while unemployment remained stable. In contrast, Rest of WA saw employment grow by 1.4% and labour force expand by 1.2%. Jobs and Skills Australia's national employment forecasts from May-25 project overall growth of 6.6% over five years and 13.7% over ten years. Applying these projections to Chittering's industry mix suggests local employment could increase by 5.4% over five years and 11.8% over ten years, though this is a simplified extrapolation for illustrative purposes only.
Frequently Asked Questions - Employment
Income
The area exhibits notably strong income performance, ranking higher than 70% of areas assessed nationally through AreaSearch analysis
The median taxpayer income in Chittering SA2 was $56,801 while the average was $72,037 according to postcode level ATO data aggregated by AreaSearch for financial year 2022. This is higher than the national averages of $57,323 median and $71,163 average income in Rest of WA. By September 2025, estimates based on a 14.2% Wage Price Index growth suggest the median income will be approximately $64,867 and the average will be around $82,266. According to Census 2021 data, household income ranks at the 68th percentile with weekly earnings of $2,044. Personal income is at the 49th percentile. The largest segment of residents earn between $1,500 and $2,999 weekly, which is 31.3% or 2,310 individuals, similar to the metropolitan region's 31.1%. Notably, 30.2% of Chittering residents earn over $3,000 per week. Housing costs consume 15.2% of income but strong earnings place disposable income at the 69th percentile. The area's SEIFA income ranking places it in the 5th decile.
Frequently Asked Questions - Income
Housing
Chittering is characterized by a predominantly suburban housing profile, with ownership patterns similar to the broader region
In Chittering, as per the latest Census evaluation, 99.1% of dwellings were houses, with the remaining 1.0% consisting of semi-detached homes, apartments, and other dwelling types. This is in contrast to Non-Metro WA's housing figures of 95.6% and 4.4% respectively. Home ownership in Chittering stood at 33.0%, with mortgaged dwellings accounting for 58.8% and rented dwellings making up 8.2%. The median monthly mortgage repayment in the area was $2,100, higher than Non-Metro WA's average of $1,425. The median weekly rent figure in Chittering was recorded at $320, compared to Non-Metro WA's $231. Nationally, Chittering's mortgage repayments were significantly higher than the Australian average of $1,863, while rents were substantially lower than the national figure of $375.
Frequently Asked Questions - Housing
Household Composition
Chittering features high concentrations of family households, with a higher-than-average median household size
Family households constitute 83.3% of all households, including 38.0% couples with children, 36.7% couples without children, and 8.1% single parent families. Non-family households account for the remaining 16.7%, with lone person households at 15.9% and group households comprising 1.0%. The median household size is 2.8 people, larger than the Rest of WA average of 2.3.
Frequently Asked Questions - Households
Local Schools & Education
Chittering faces educational challenges, with performance metrics placing it in the bottom quartile of areas assessed nationally
The area's university qualification rate is 13.4%, significantly lower than Australia's average of 30.4%. This discrepancy presents both a challenge and an opportunity for targeted educational initiatives in the region. Bachelor degrees are most prevalent at 10.2%, followed by postgraduate qualifications (1.7%) and graduate diplomas (1.5%). Vocational credentials are prominent, with 46.5% of residents aged 15 and above holding them - advanced diplomas account for 11.8% and certificates for 34.7%.
Educational participation is high, with 29.9% of residents currently enrolled in formal education. This includes 11.8% in primary education, 10.7% in secondary education, and 2.6% pursuing tertiary education.
Frequently Asked Questions - Education
Schools Detail
Nearby Services & Amenities
Transport
Transport servicing is very low compared to other areas nationally based on assessment of service frequency, route connectivity and accessibility
Public transport analysis indicates four active transport stops operating within Chittering. These stops offer a mix of bus services, collectively providing four weekly passenger trips via one individual route. Transport accessibility is rated as limited, with residents typically located 9203 meters from the nearest transport stop.
Service frequency averages zero trips per day across all routes, equating to approximately one weekly trip per individual stop.
Frequently Asked Questions - Transport
Transport Stops Detail
Health
Chittering's residents are healthier than average in comparison to broader Australia with a fairly standard level of common health conditions seen across both young and old age cohorts
Health data shows positive outcomes for Chittering residents with common health conditions seen across both young and old age groups. Private health cover is high at approximately 55% of the total population (4,081 people), compared to 52.8% across Rest of WA.
The most common medical conditions are arthritis and mental health issues, affecting 8.1 and 7.4% of residents respectively. 69.5% of residents declare themselves completely clear of medical ailments, compared to 64.7% across Rest of WA. As of 2021, 15.2% of residents are aged 65 and over (1,121 people), lower than the 21.7% in Rest of WA. Health outcomes among seniors are strong, performing better than the general population in health metrics.
Frequently Asked Questions - Health
Cultural Diversity
Chittering ranks below the Australian average when compared to other local markets across a number of language and cultural background related metrics
Chittering's population shows lower cultural diversity, with 74.3% born in Australia and 86.7% being citizens. English is the home language for 95.2%. Christianity dominates at 45.9%, while Judaism is overrepresented at 0.1% compared to 0% regionally.
Top ancestry groups are English (36.5%), Australian (31.0%), and Scottish (7.6%). Notable divergences include Dutch (1.8% vs regional 1.5%), South African (0.8% vs 0.5%), and New Zealand (0.8% vs 0.8%).
Frequently Asked Questions - Diversity
Age
Chittering hosts a notably older demographic compared to the national average
The median age in Chittering is 43 years, which is slightly higher than Rest of WA's average of 40 years and well above Australia's median of 38 years. The 55-64 age cohort is notably over-represented in Chittering at 16.4%, compared to the Rest of WA average of 12.9% and the national average of 11.2%. Meanwhile, the 25-34 age group is under-represented at 9.6%, compared to the Rest of WA average of 13.7%. Between the 2021 Census and the present, the 35 to 44 age group has grown from 11.5% to 13.1% of the population, while the 15 to 24 cohort increased from 11.3% to 12.7%. Conversely, the 45 to 54 cohort has declined from 15.9% to 14.2%, and the 65 to 74 age group dropped from 10.8% to 9.3%. Population forecasts for 2041 indicate significant demographic changes for Chittering. The 25-34 age cohort is projected to expand by 279 people, from 710 to 990. However, the 15 to 24 and 85+ age cohorts are expected to experience population declines.
