Chart Color Schemes
This analysis uses ABS Statistical Areas Level 2 (SA2) boundaries, which can materially differ from Suburbs and Localities (SAL) even when sharing similar names.
SA2 boundaries are defined by the Australian Bureau of Statistics and are designed to represent communities for statistical reporting (e.g., census and ERP).
Suburbs and Localities (SAL) represent commonly-used suburb/locality names (postal-style areas) and may use different geographic boundaries. For comprehensive analysis, consider reviewing both boundary types if available.
est. as @ -- *
ABS ERP | -- people | --
2021 Census | -- people
Sales Activity
Curious about local property values? Filter the chart to assess the volume and appreciation (including resales) trends and regional comparisons, or scroll to the map below view this information at an individual property level.
Find a Recent Sale
Sales Detail
Population
An assessment of population growth drivers in Leinster - Leonora reveals an overall ranking slightly below national averages considering recent, and medium term trends
Leinster-Leonora's population was around 5,270 as of November 2025, according to AreaSearch's analysis. This figure reflects a growth of 466 people since the 2021 Census, which recorded a population of 4,804. The increase is inferred from ABS's estimated resident population of 5,240 in June 2024 and six additional validated addresses post-Census. This results in a density ratio of approximately zero persons per square kilometer. Leinster-Leonora's growth rate of 9.7% since the 2021 Census exceeded both its SA4 region (7.6%) and SA3 area, indicating it as a growth leader in the region. Overseas migration contributed around 72.7% to this population gain.
AreaSearch uses ABS/Geoscience Australia projections for each SA2 area released in 2024 with a base year of 2022, and employs growth rates by age cohort from ABS's Greater Capital Region projections (released in 2023, based on 2022 data) for areas not covered. Future population projections indicate an above-median regional growth nationally, with Leinster-Leonora expected to expand by 989 persons to 2041, reflecting an 18.2% increase over the 17-year period.
Frequently Asked Questions - Population
Development
Residential development activity is lower than average in Leinster - Leonora according to AreaSearch's national comparison of local real estate markets
Leinster - Leonora has recorded approximately seven residential properties granted approval annually. Over the past five financial years, from FY21 to FY25, 37 homes were approved, with six more approved so far in FY26. On average, around six people have moved to the area for each dwelling built over these five years.
This significant demand outpaces supply, putting upward pressure on prices and increasing competition among buyers. The average value of new homes being constructed is $523,000, indicating a focus on the premium market segment with higher-end properties. In FY26, $19.7 million in commercial development approvals have been recorded, suggesting steady commercial investment activity. Compared to the rest of WA, Leinster - Leonora has 12.0% less new development per person and ranks among the 25th percentile nationally, resulting in relatively constrained buyer choice and supporting interest in existing dwellings. This lower activity reflects market maturity and possible development constraints.
New building activity shows 62.0% detached houses and 38.0% medium to high-density housing, indicating an expanding range of medium-density options that create a mix of opportunities across price brackets. This represents a notable shift from the area's existing housing, which is currently 87.0% houses, suggesting decreasing availability of developable sites and reflecting changing lifestyles and demand for more diverse, affordable housing options. The estimated population per dwelling approval in Leinster - Leonora is 636 people, reflecting its quiet, low activity development environment. Population forecasts indicate the area will gain 959 residents by 2041. At current development rates, housing supply may struggle to match population growth, potentially heightening buyer competition and supporting price increases.
Frequently Asked Questions - Development
Infrastructure
Leinster - Leonora has limited levels of nearby infrastructure activity, ranking in the 1stth percentile nationally
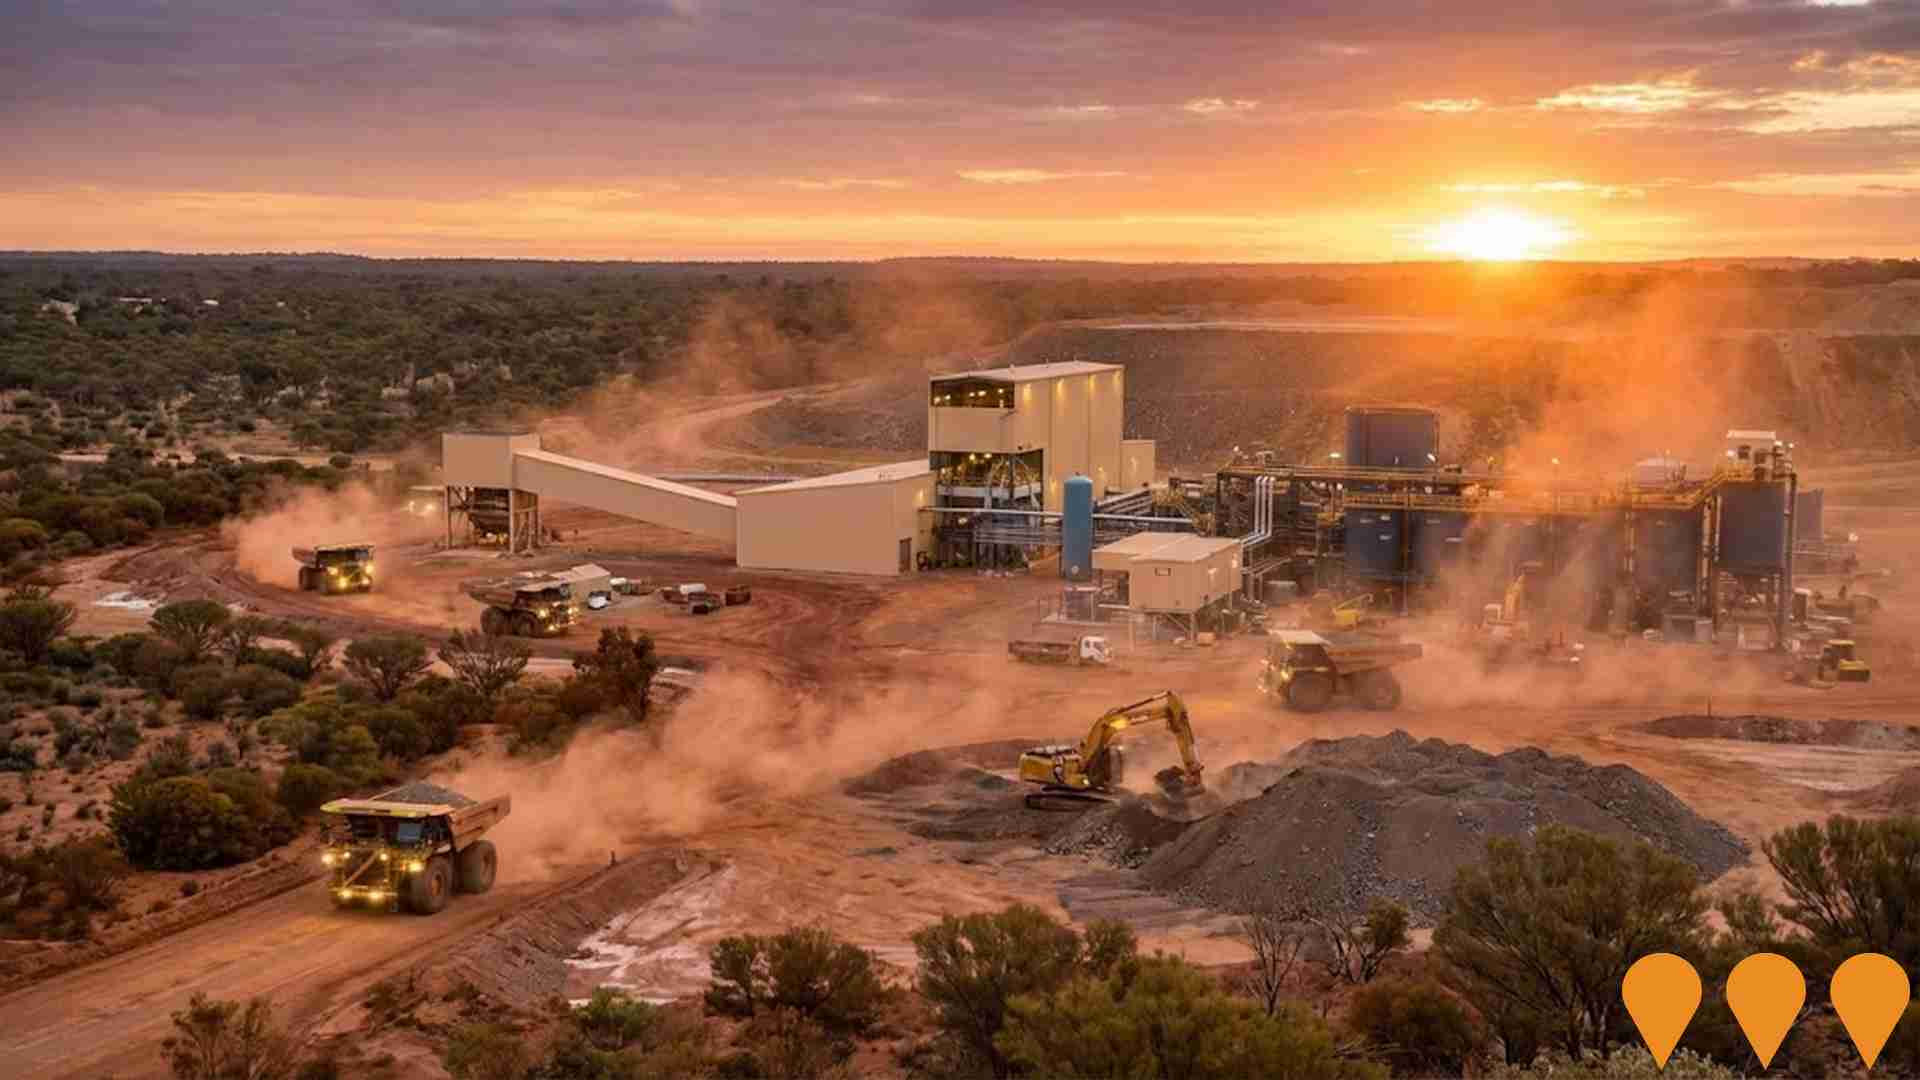
Twenty-one infrastructure projects have been identified by AreaSearch as potentially impacting the area's performance. Notable projects include Genesis Minerals' Laverton Gold Project, Catalina Resources' Laverton Project, Menzies and Laverton Gold Projects, and the Laverton Hospital Redevelopment. The following list details those likely to be most relevant.
Professional plan users can use the search below to filter and access additional projects.
INFRASTRUCTURE SEARCH
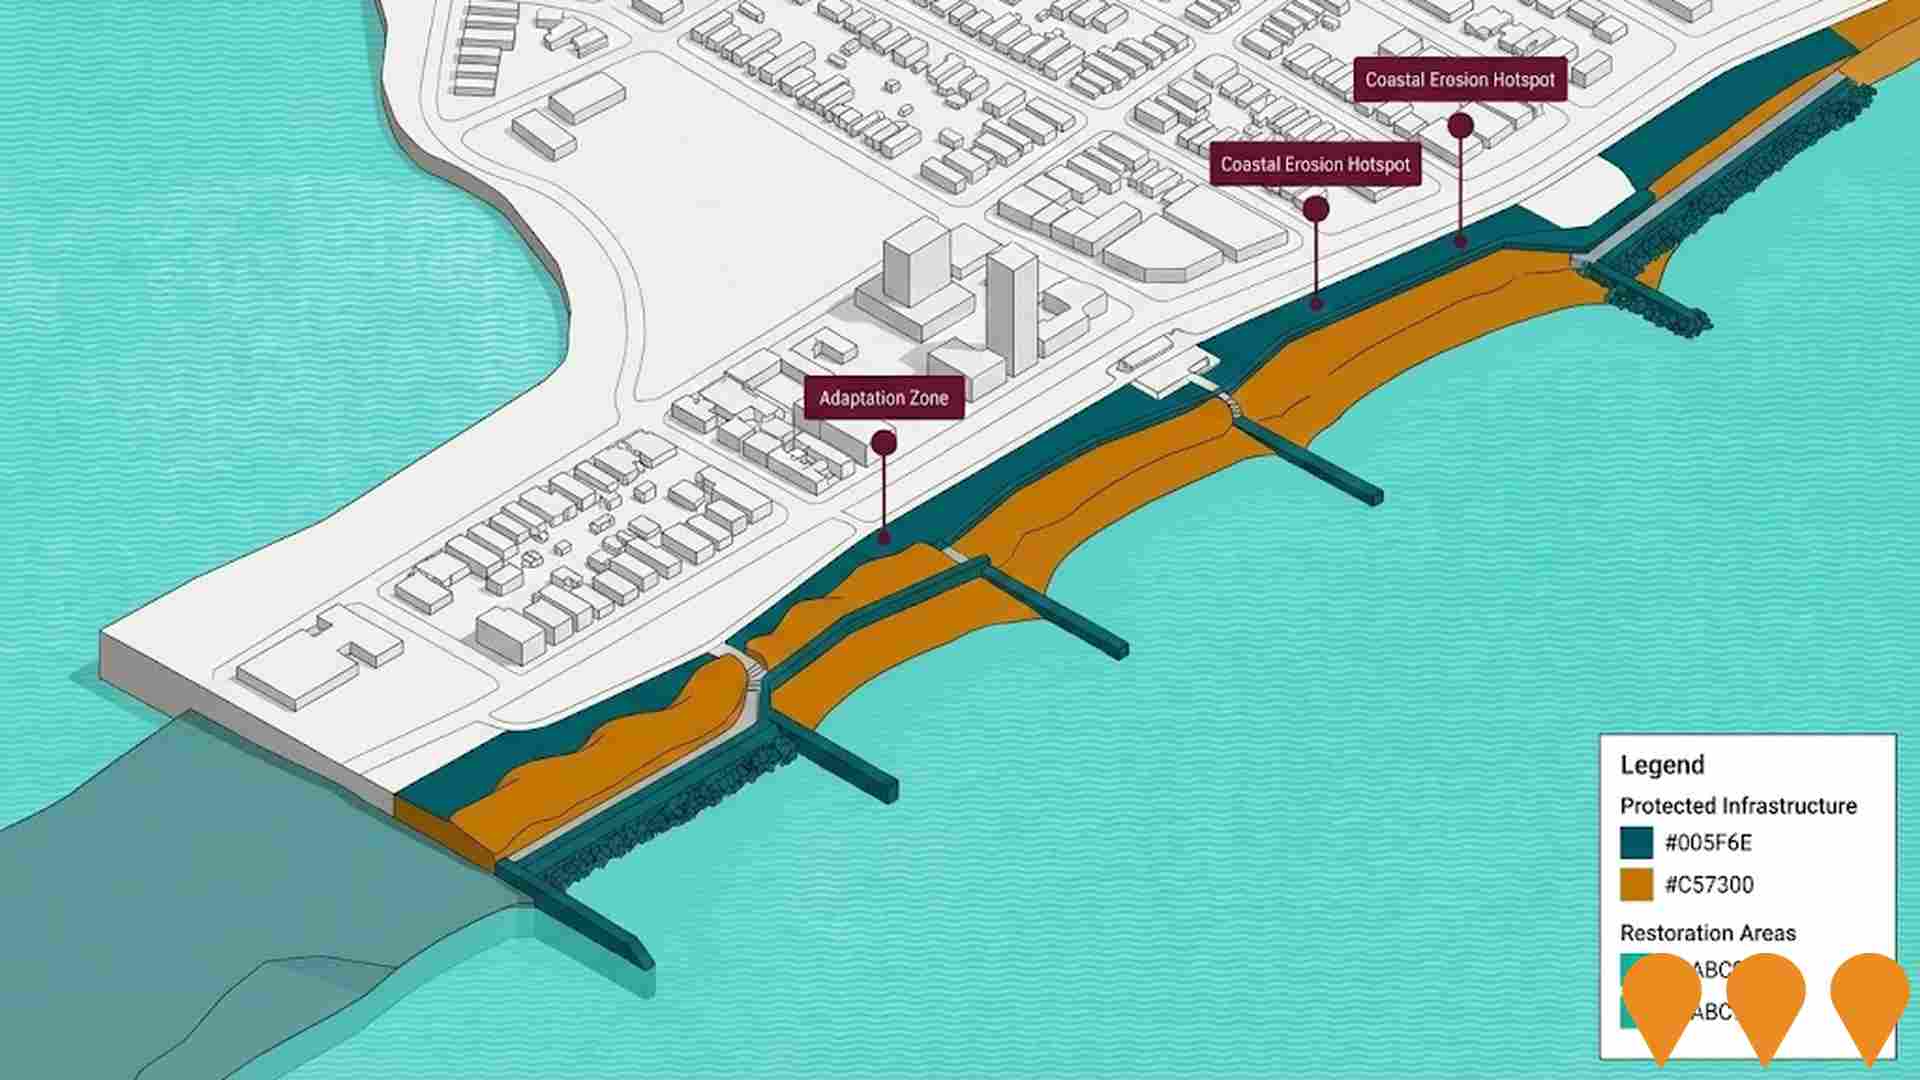
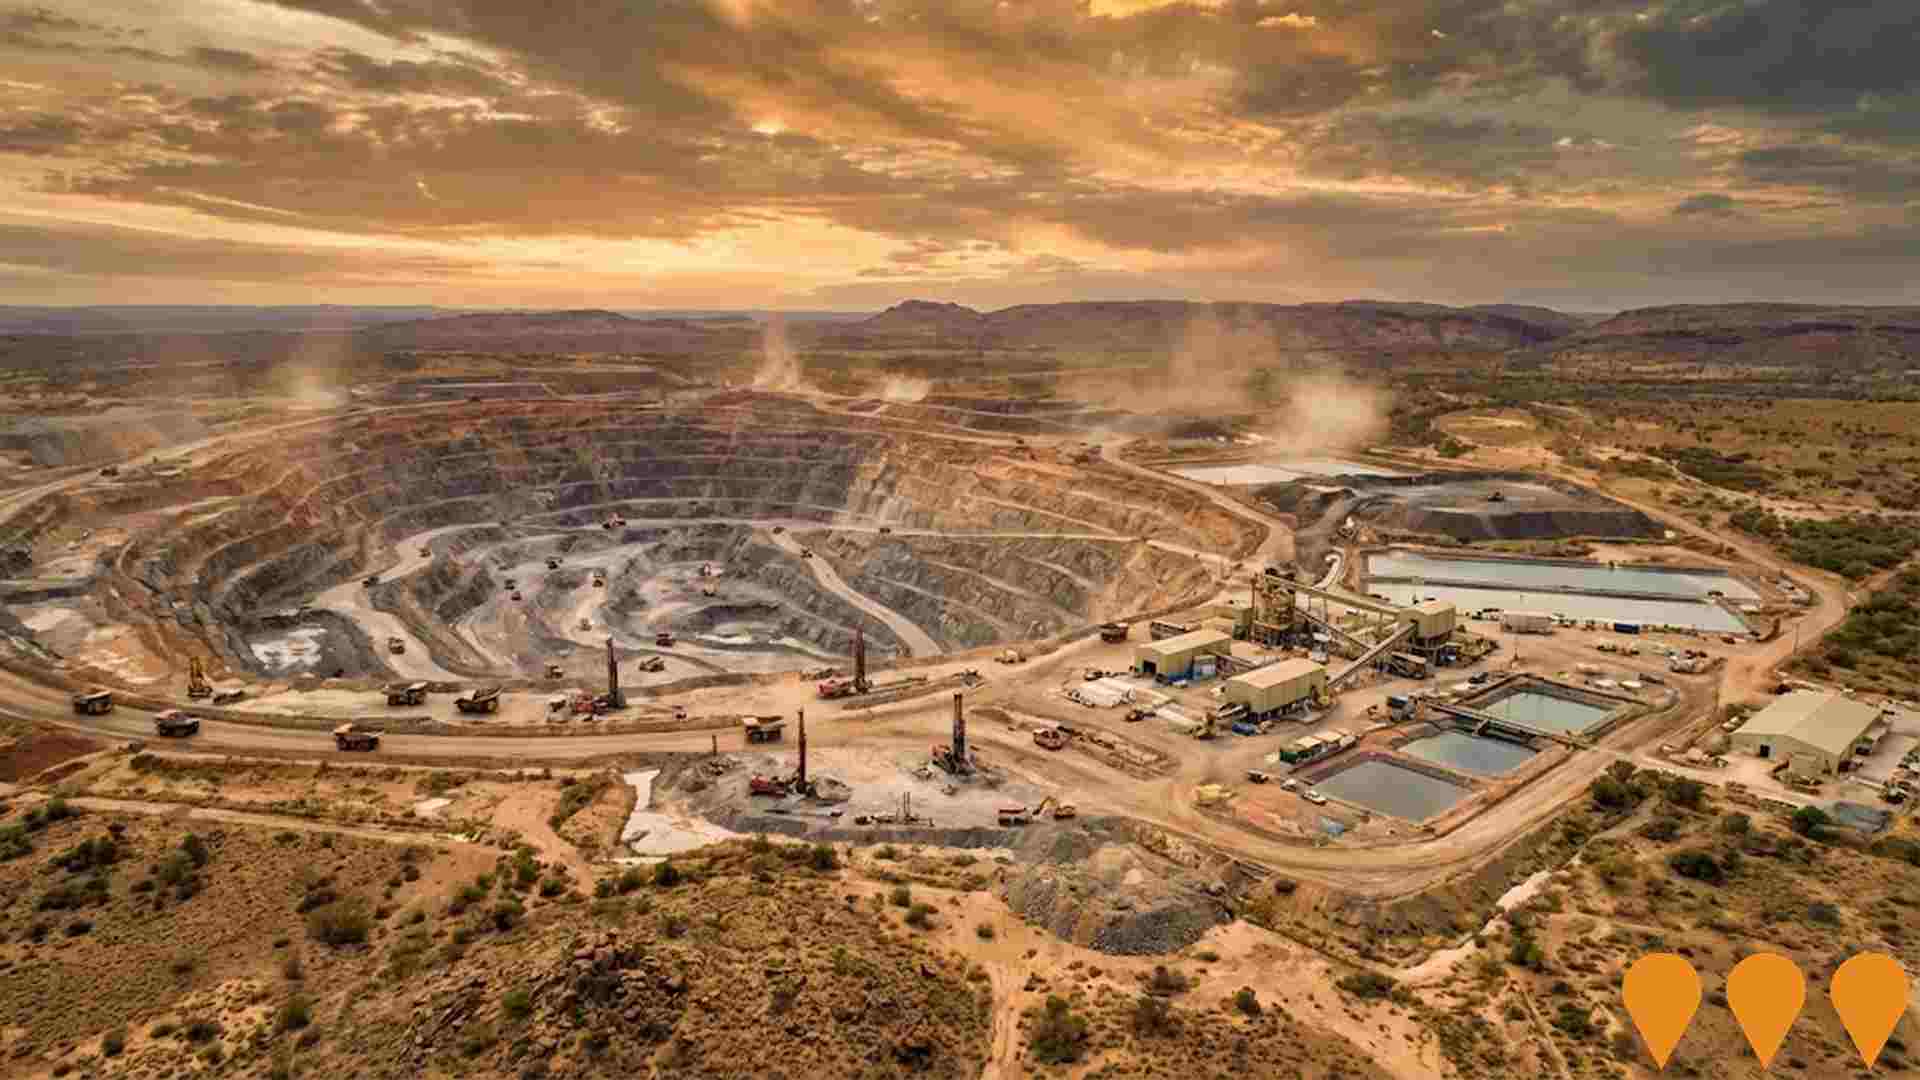
 Denotes AI-based impression for illustrative purposes only, not to be taken as definitive under any circumstances. Please follow links and conduct other investigations from the project's source for actual imagery. Developers and project owners wishing us to use original imagery please Contact Us and we will do so.
Frequently Asked Questions - Infrastructure
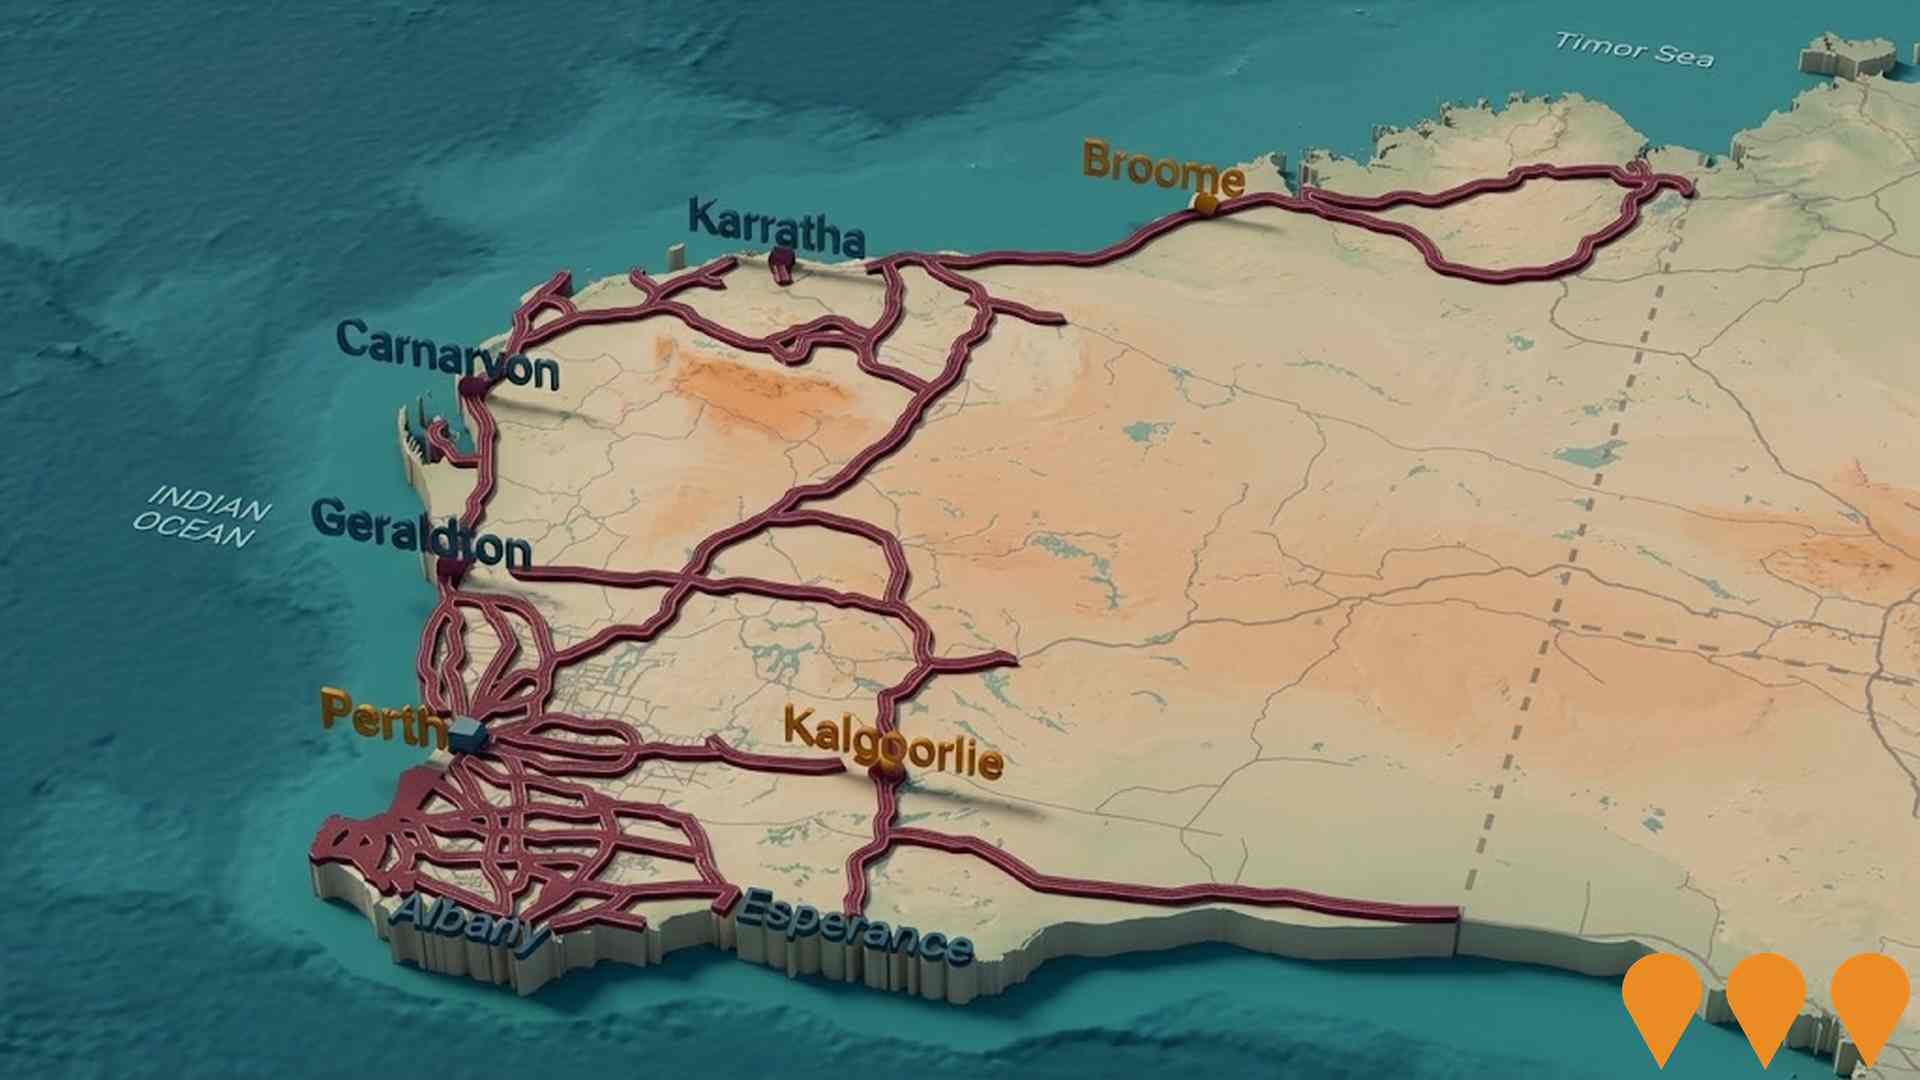
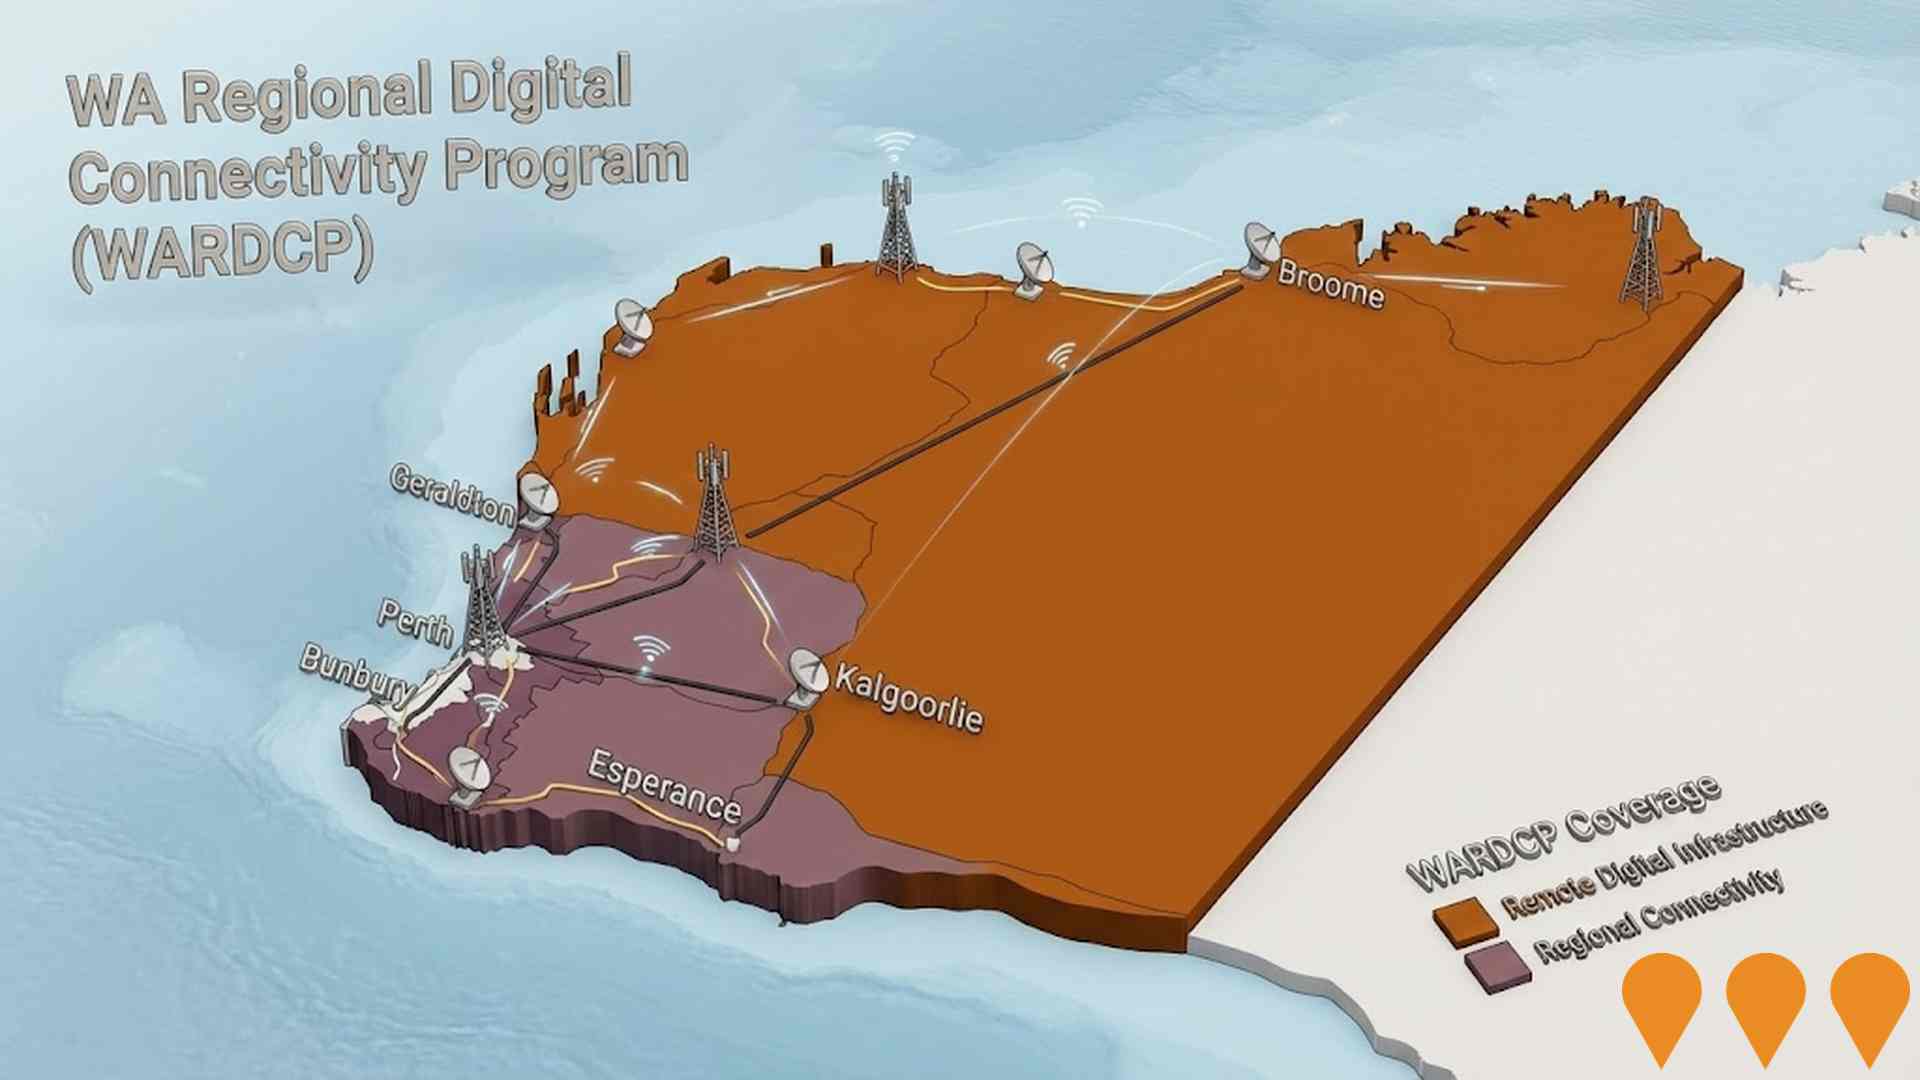
WA Regional Digital Connectivity Program (WARDCP)
Statewide co-investment program delivering new and upgraded mobile, fixed wireless and broadband infrastructure to improve reliability, coverage and performance for regional and remote Western Australia. Current workstreams include the Regional Telecommunications Project, State Agriculture Telecommunications Infrastructure Fund, and the WA Regional Digital Connectivity Program (WARDCP).
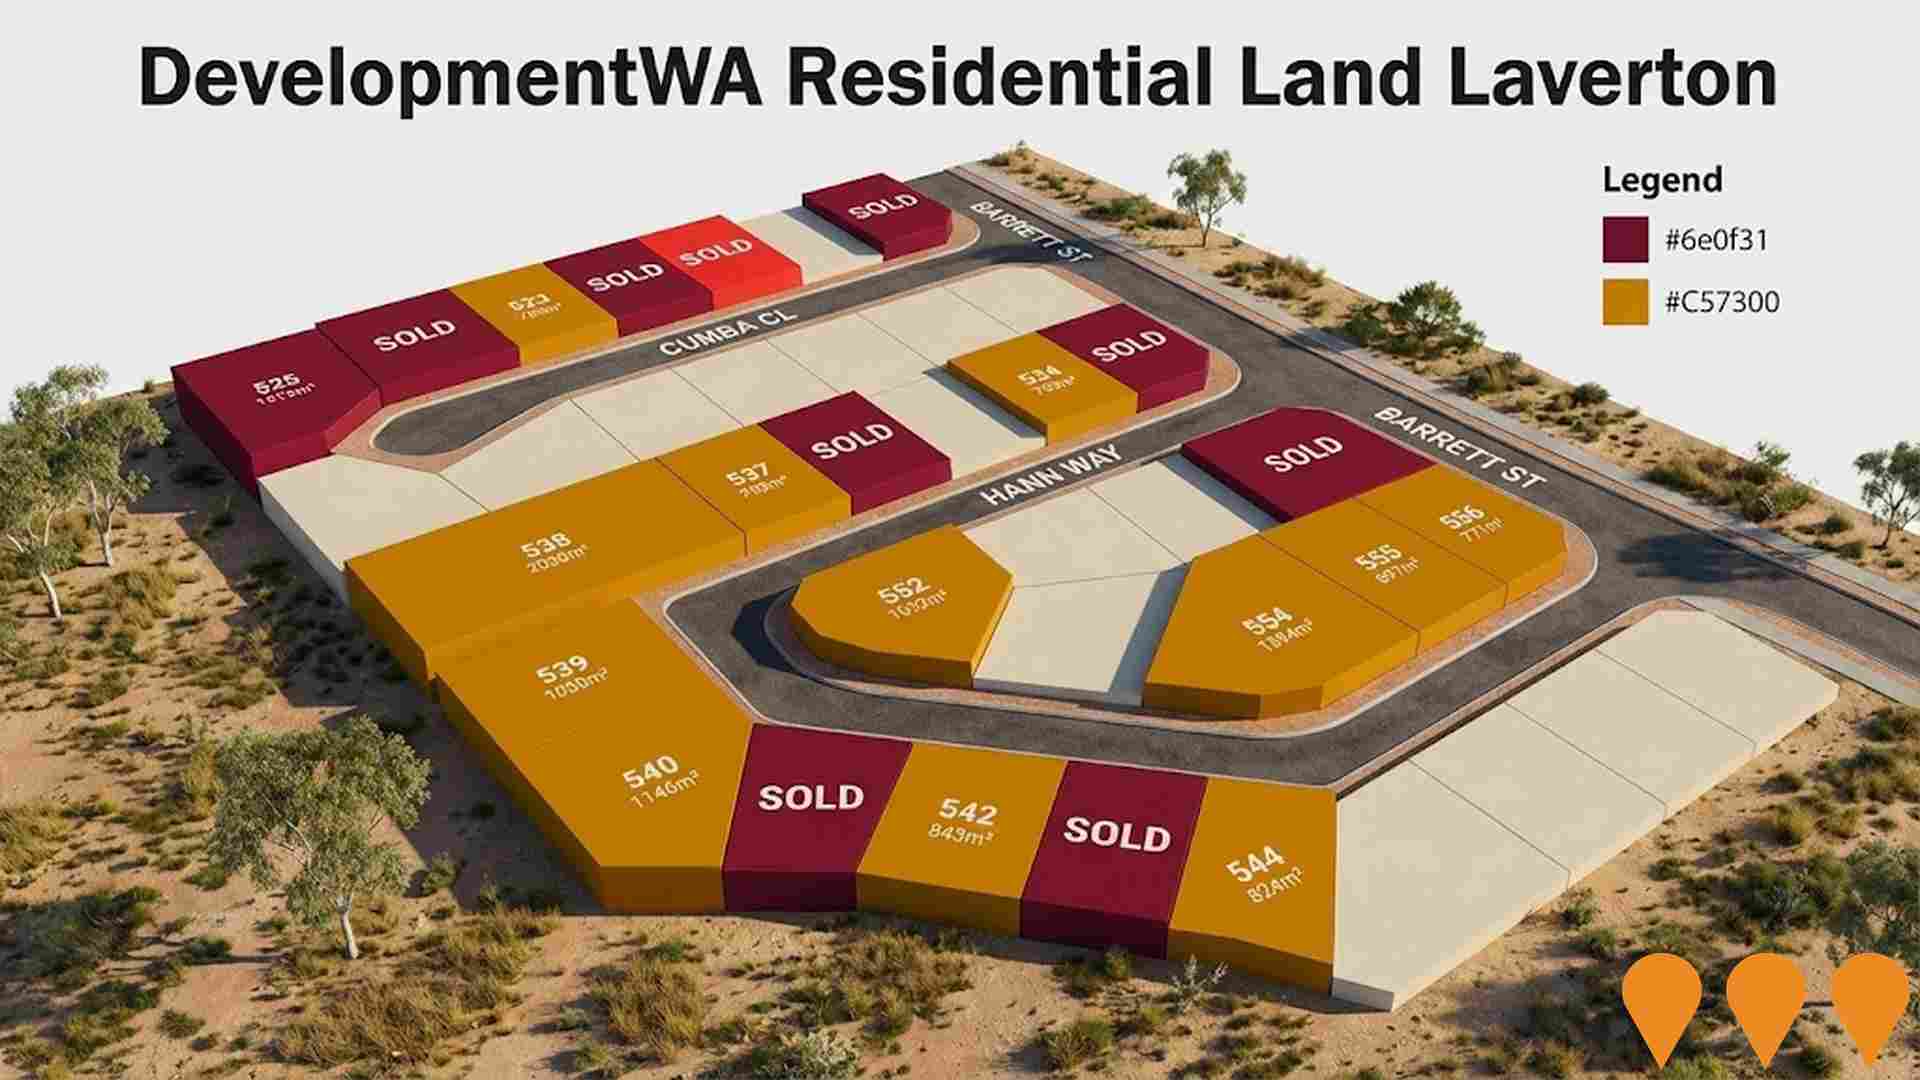
DevelopmentWA Residential Land Laverton
Residential land lots delivered by DevelopmentWA under the Regional Development Assistance Program (RDAP) in the Eastern Goldfields town of Laverton. Fully serviced with sewer, overhead power and telephone. Current sales material indicates multiple titled lots with some still Available and others Sold/Under Offer. Purchasers are required to build within 36 months of settlement. Example listings show guide pricing from about $10,000 per lot.
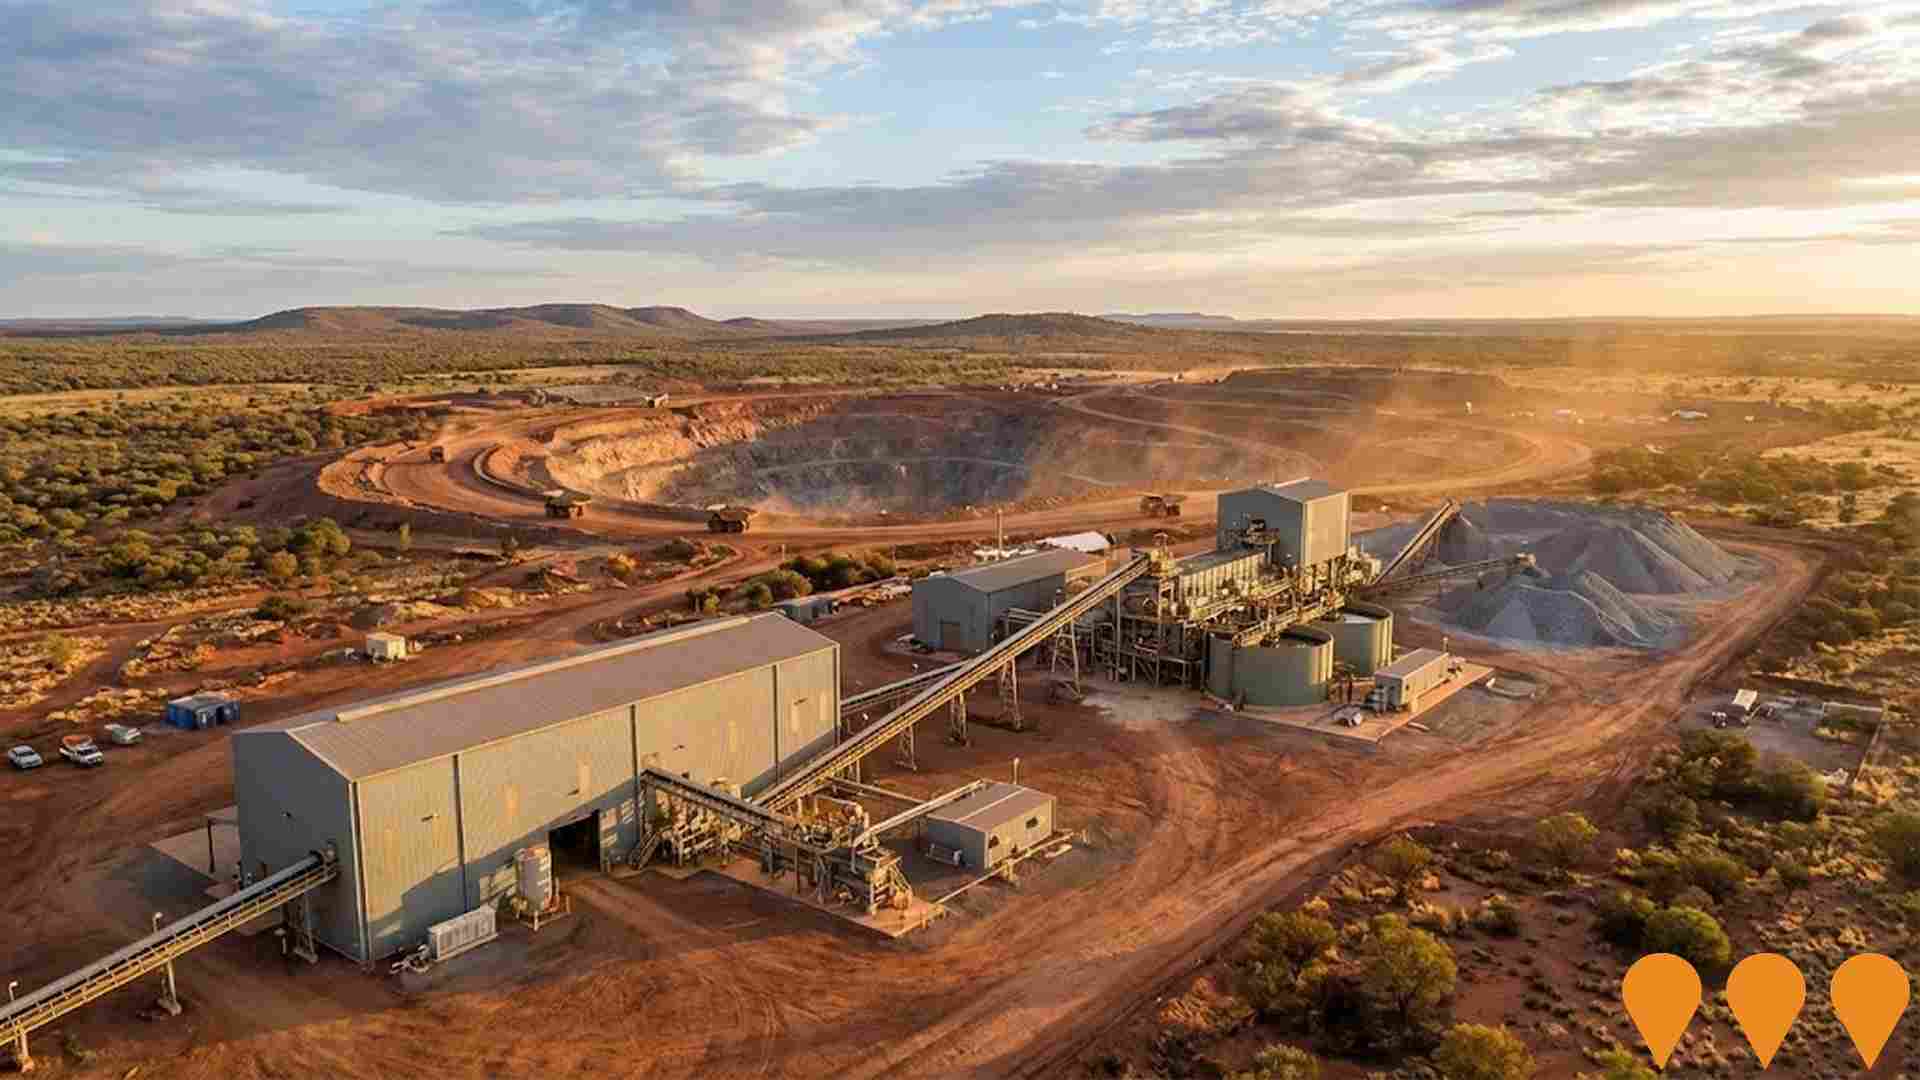
Genesis Minerals Laverton Gold Project
Acquisition of the Laverton Gold Project from Focus Minerals Limited, consolidating the Laverton assets of Focus and Genesis, including the recently restarted 3Mtpa Laverton mill.
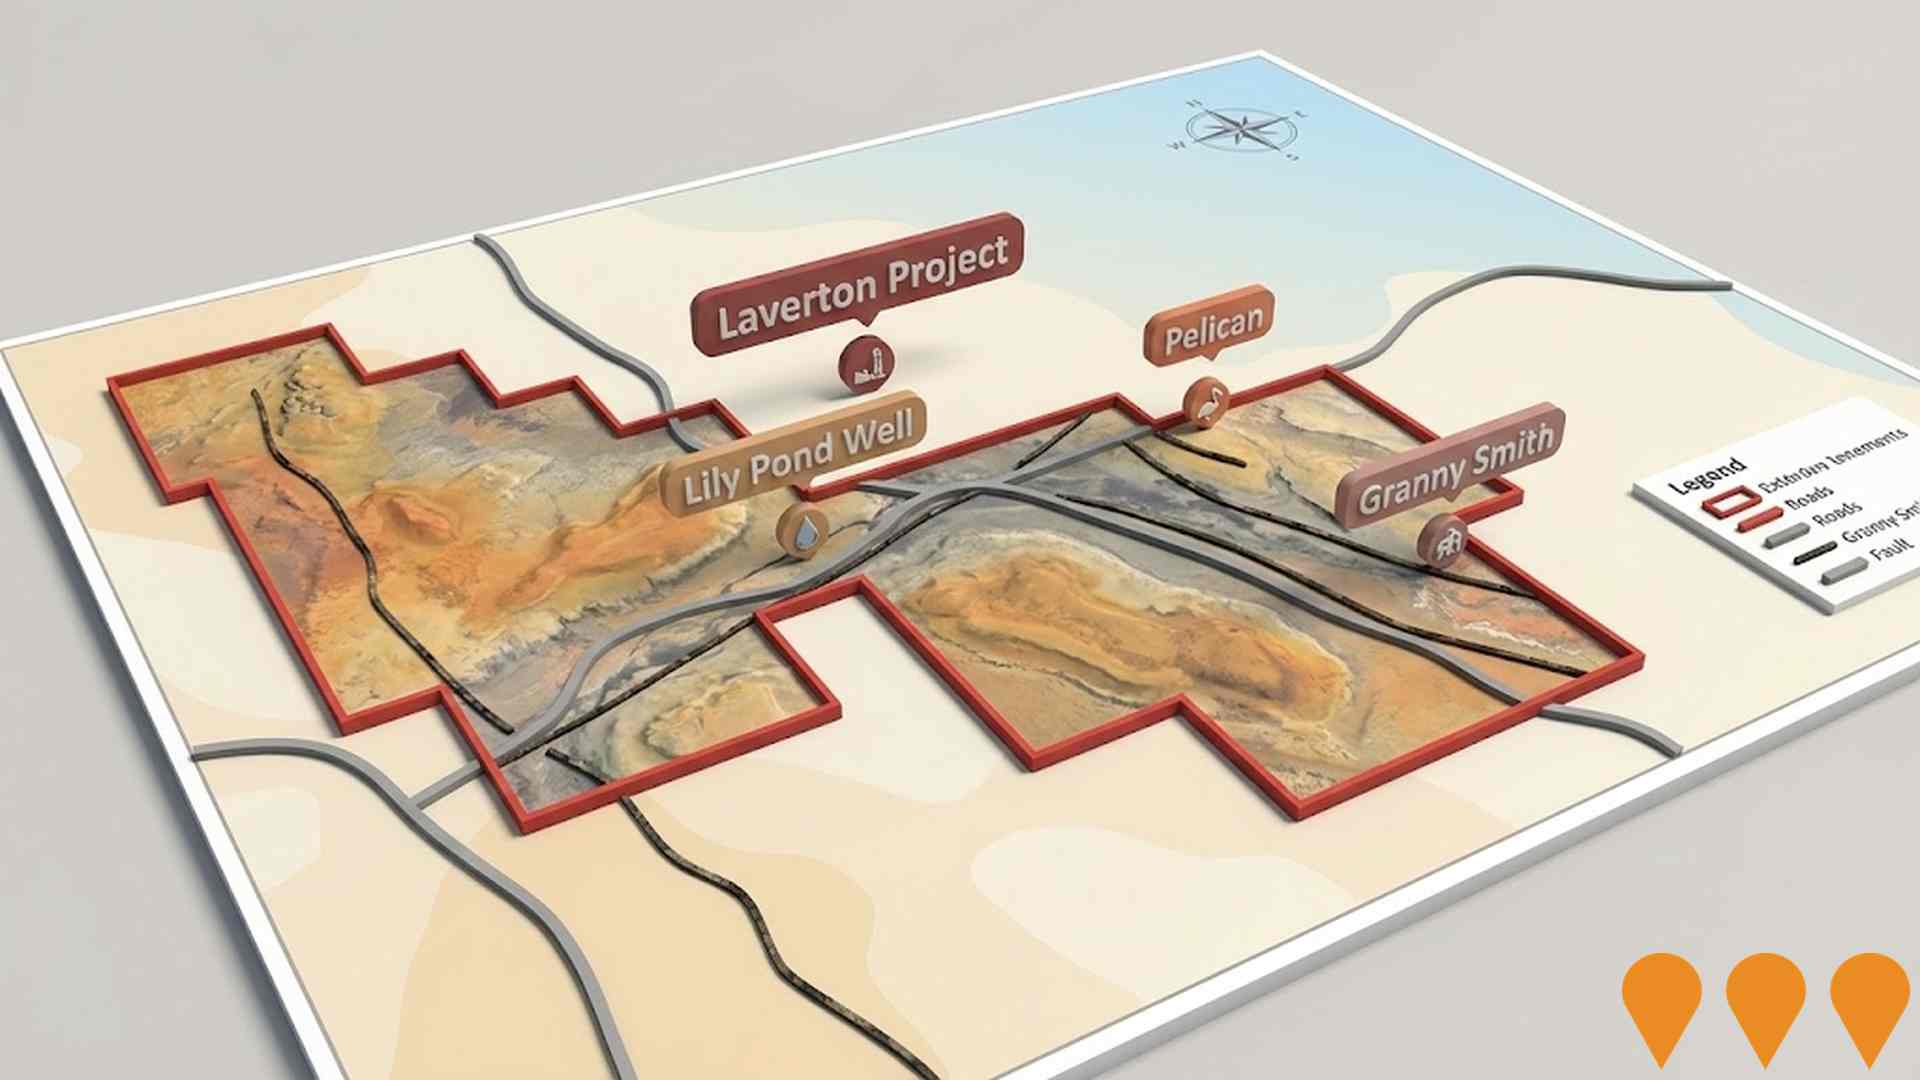
Catalina Resources Laverton Project
Exploration project targeting a large gold system. A broad supergene gold anomaly has been identified.
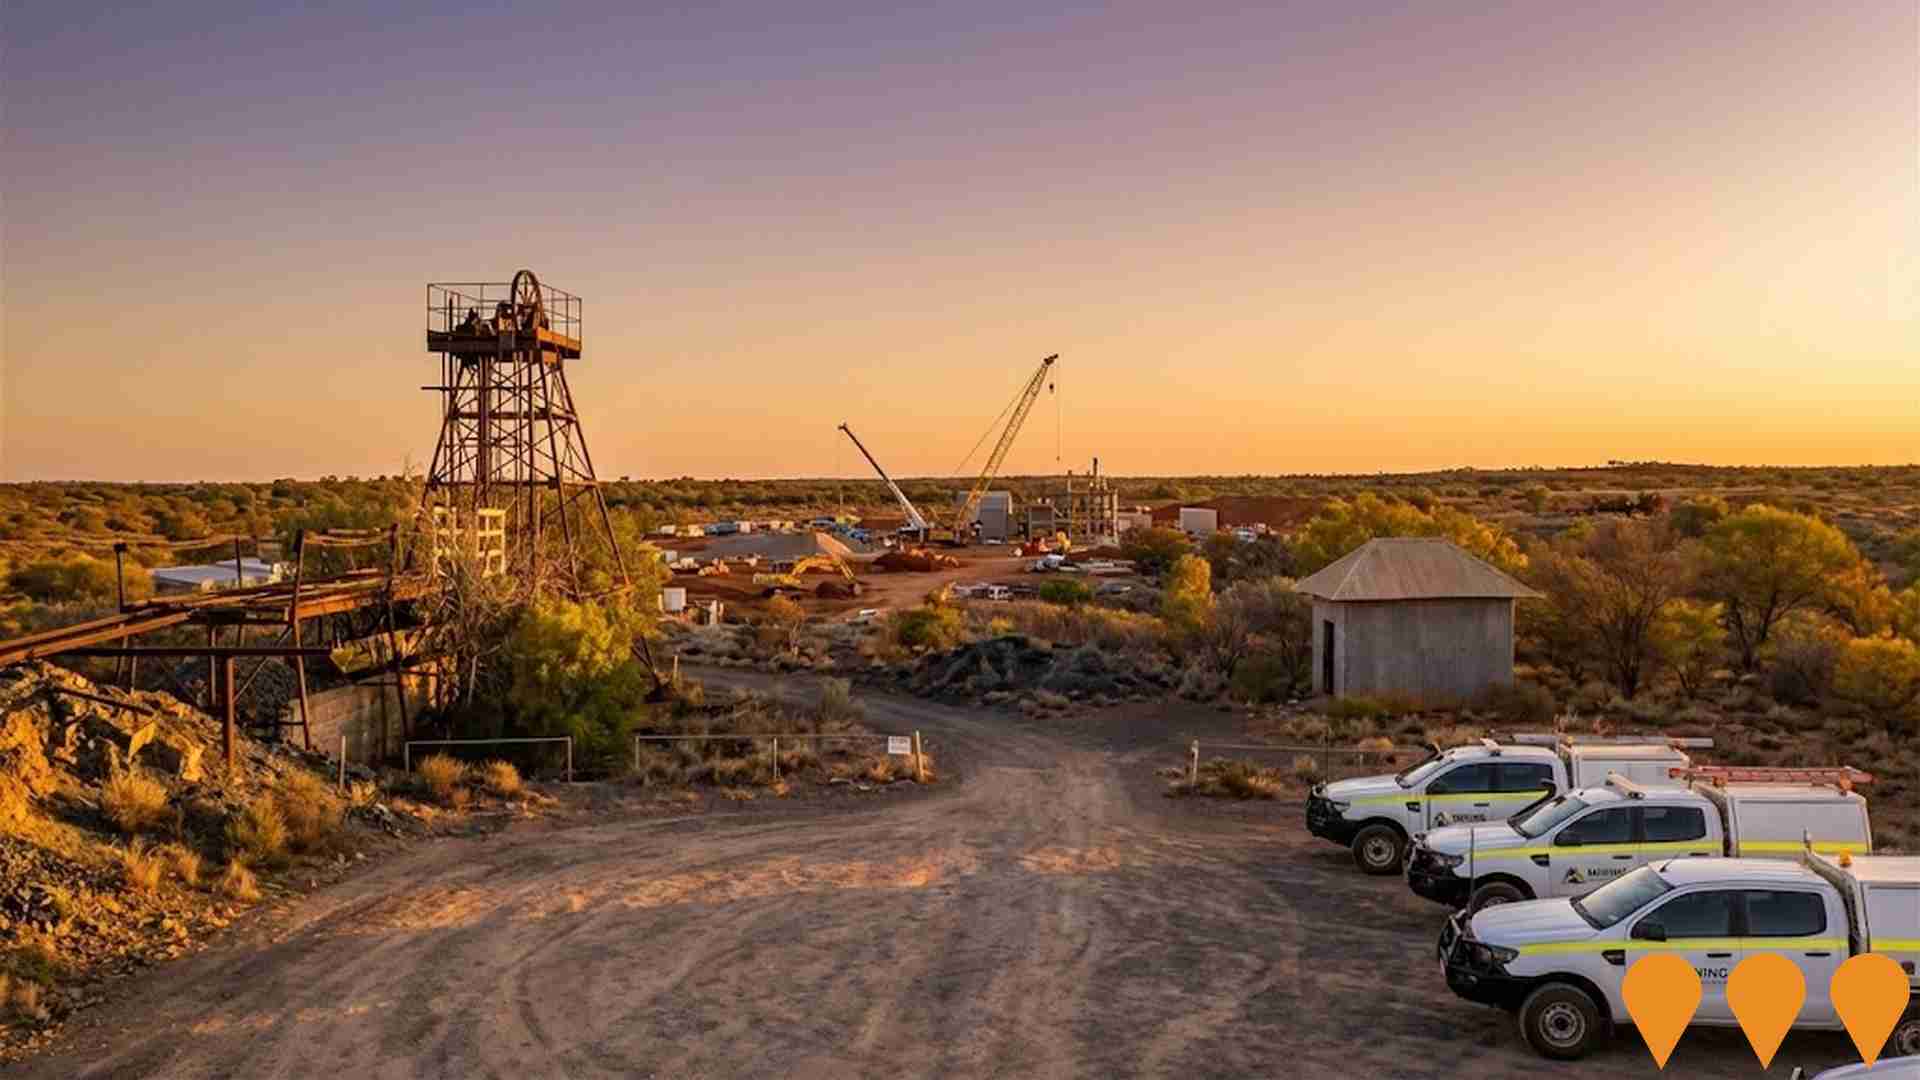
Menzies and Laverton Gold Projects
A staged development of Menzies and Laverton gold deposits. The project includes the construction of a new 1Mtpa CIL processing plant south-east of Laverton.
Laverton Hospital Redevelopment
The new Laverton Hospital will provide modern emergency and contemporary multidisciplinary ambulatory care facilities and outpatient services, including community health, mental health, drug and alcohol services, specialist facilities for visiting clinicians, and space for an on-site private GP clinic.

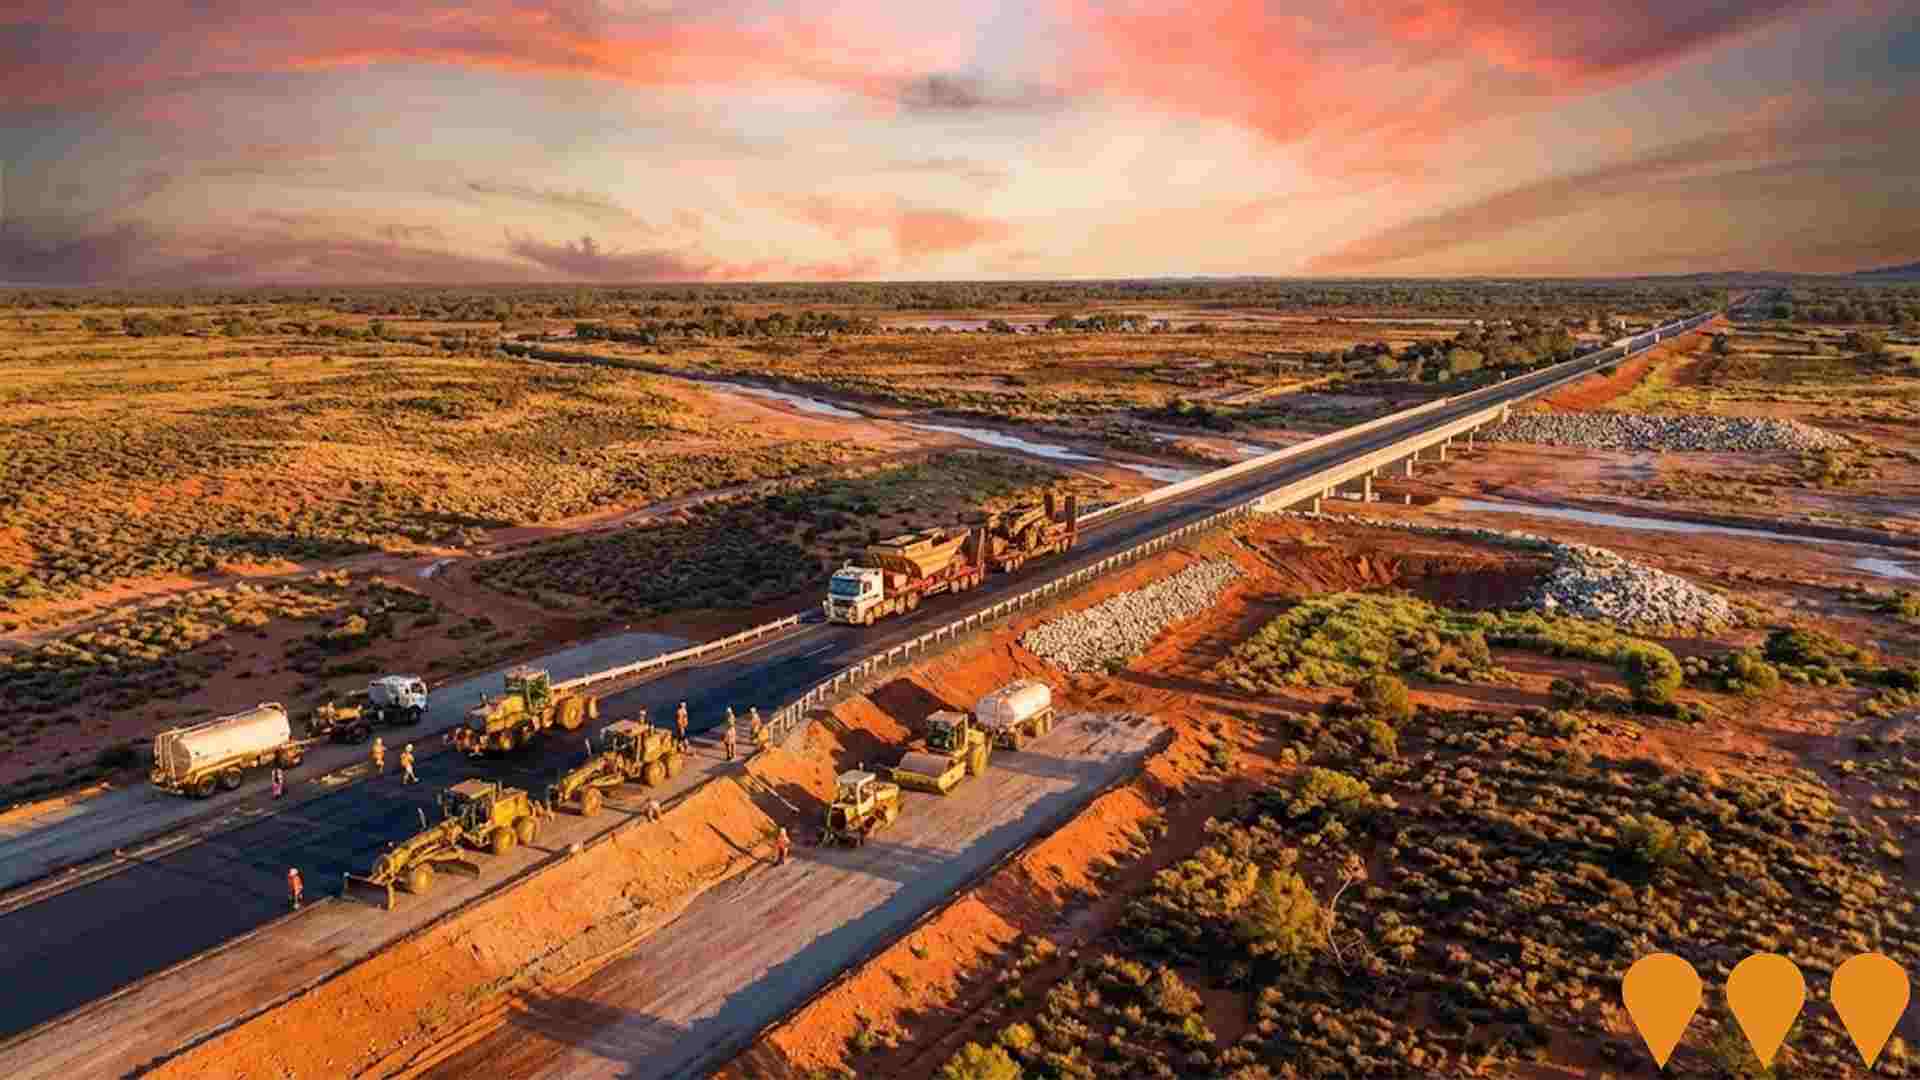
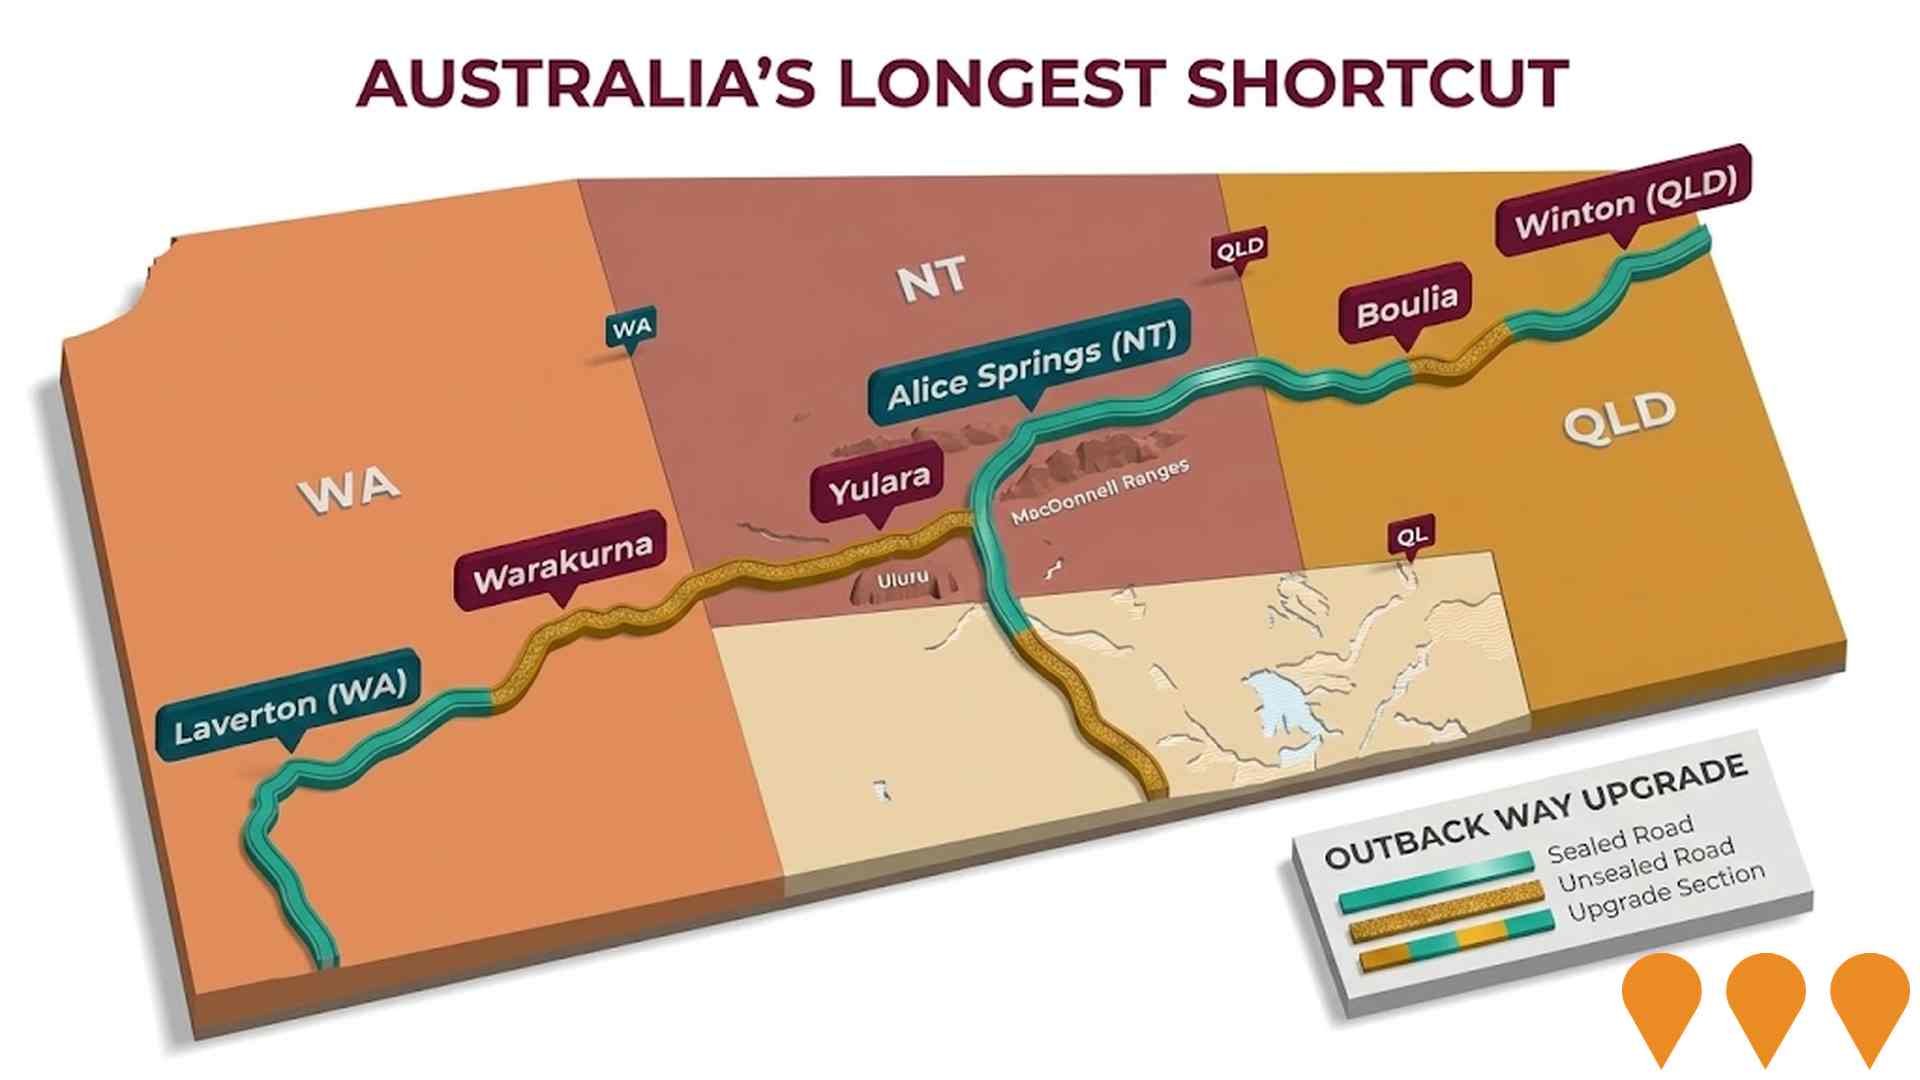
Outback Way Upgrade
The Outback Way covers 2,720 kilometres from Laverton in Western Australia to Winton in Queensland, via Alice Springs and the Uluru-Kata Tjuta National Park in the Northern Territory. The route includes sections of two-lane sealed, single-lane sealed, gravel, and unformed roads. The upgrade aims to seal the remaining unsealed sections between Laverton and Winton. The WA section is 872 kilometres long, with 736 kilometres unsealed. The NT section is 1,246 kilometres, with 367 kilometres unsealed (29%). The Queensland section has 51 kilometres unsealed.
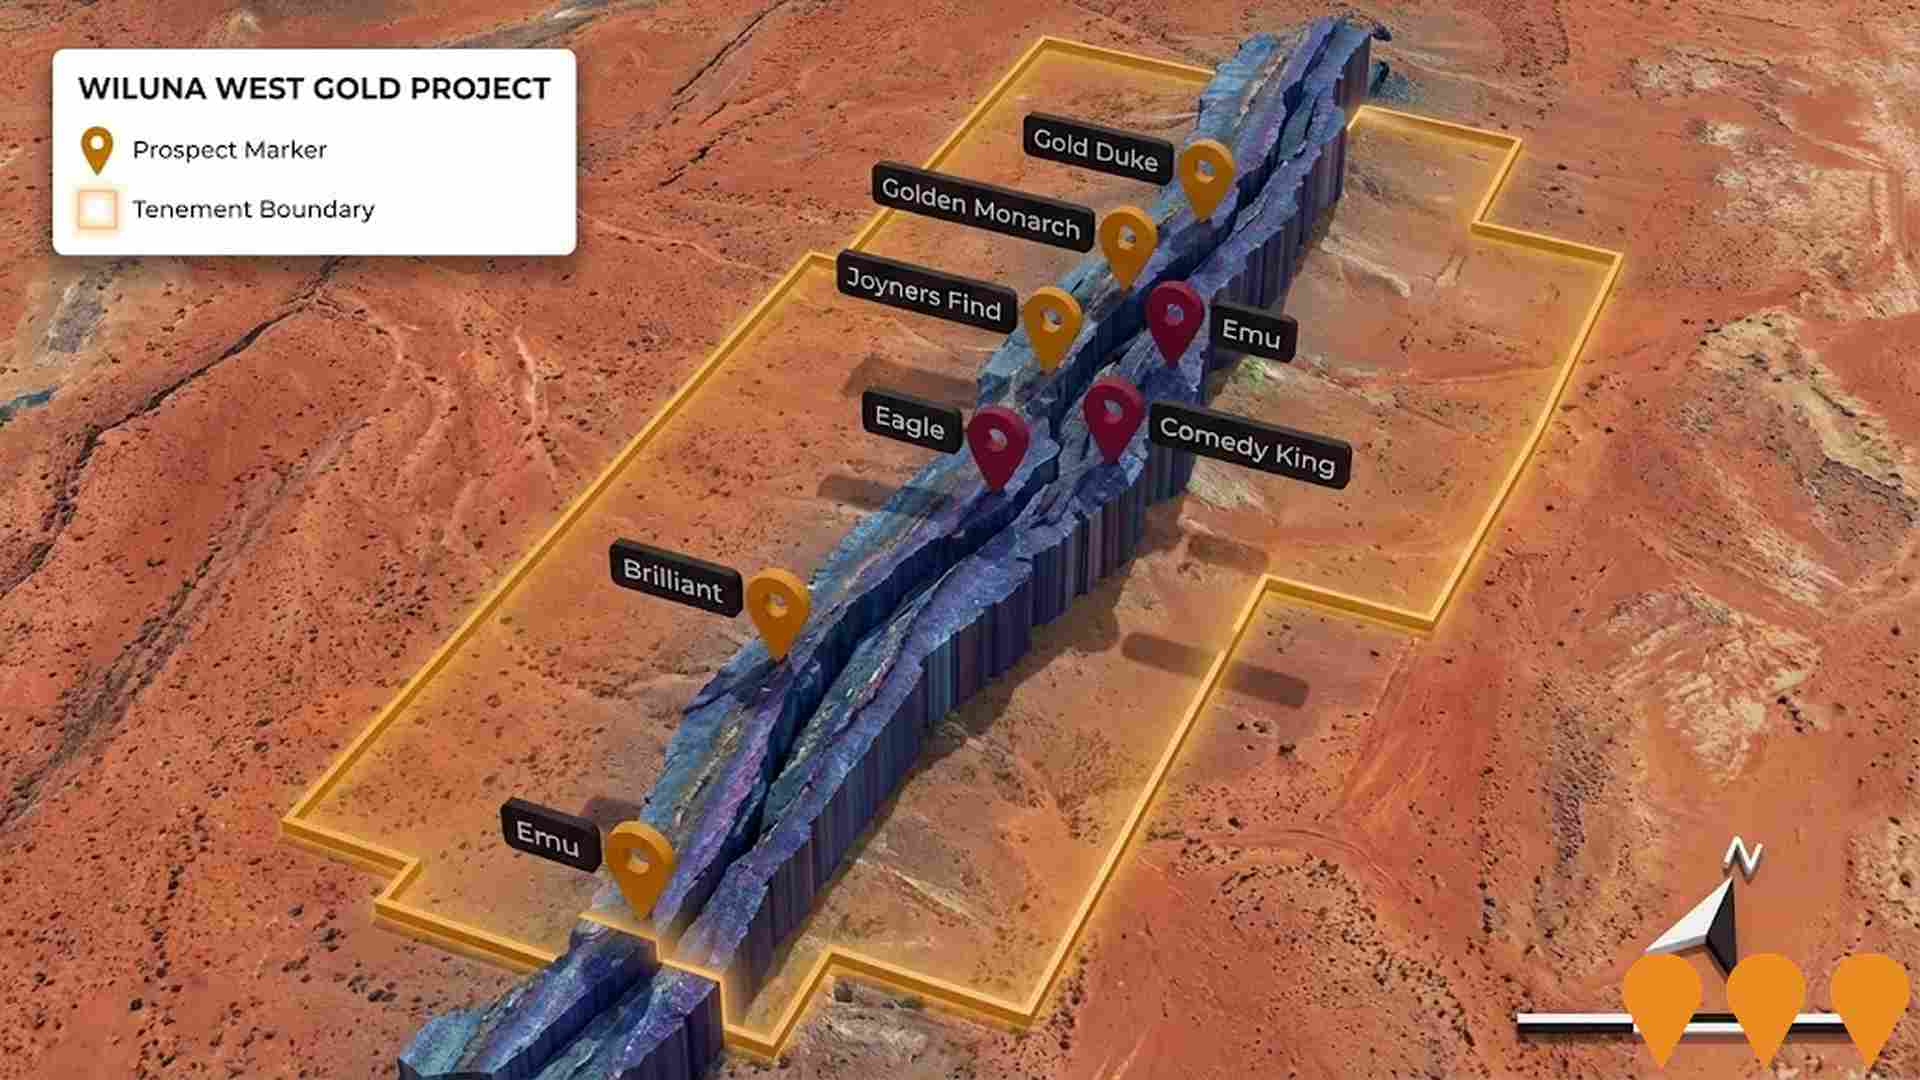
Wiluna Uranium Project
The Wiluna Uranium Project consists of the Centipede, Millipede, Lake Maitland, and Lake Way uranium deposits. The project has received federal and state government environmental approvals for mining uranium, the construction of a processing facility, and all related infrastructure. An updated scoping study in 2025 highlighted robust project economics, with a focus on the Lake Maitland deposit.
Employment
AreaSearch assessment indicates Leinster - Leonora faces employment challenges relative to the majority of Australian markets
Leinster - Leonora has a balanced workforce with both white and blue collar jobs, predominantly in manufacturing and industrial sectors. As of September 2025, the unemployment rate is 12.6%.
Over the past year, there's been an estimated employment growth of 5.4%. There are currently 2,375 residents employed, with an unemployment rate that is 9.3% higher than the Rest of WA's rate of 3.3%. The workforce participation rate in Leinster - Leonora is significantly lower at 43.9%, compared to Rest of WA's 59.4%. Leading employment industries among residents include mining, public administration & safety, and education & training.
Mining shows particularly strong specialization, with an employment share 3.8 times the regional level. Conversely, agriculture, forestry & fishing has lower representation at 2.3% compared to the regional average of 9.3%. There are 1.6 workers for every resident in Leinster - Leonora, indicating it functions as an employment hub attracting workers from surrounding areas. Between September 2024 and September 2025, employment increased by 5.4%, while labour force increased by 0.1%, resulting in a decrease of unemployment by 4.4 percentage points. In comparison, Rest of WA recorded employment growth of 1.4% over the same period. National employment forecasts from Jobs and Skills Australia, released in May-25, project national employment growth at 6.6% over five years and 13.7% over ten years. Applying these projections to Leinster - Leonora's employment mix suggests local employment should increase by 4.0% over five years and 10.4% over ten years, though this is a simplified extrapolation for illustrative purposes only and does not consider localized population projections.
Frequently Asked Questions - Employment
Income
The economic profile demonstrates above-average performance, with income metrics exceeding national benchmarks based on AreaSearch comparative assessment
AreaSearch's latest postcode level ATO data for financial year 2022 shows that Leinster - Leonora SA2 had a median income of $60,471 and an average income of $69,857. This is higher than the national averages of $57,323 (median) and $71,163 (average) for Rest of WA. Based on Wage Price Index growth of 14.2% since financial year 2022, estimated median income as of September 2025 would be approximately $69,058, with average income at around $79,777. According to Census 2021 income data, personal income ranks at the 67th percentile ($900 weekly), and household income is at the 29th percentile. Income brackets indicate that 31.6% of individuals (1,665 people) earn between $1,500 - $2,999 weekly, aligning with metropolitan regions where this cohort also represents 31.1%. Housing costs take up 45.6%, leaving disposable income below average at the 41st percentile.
Frequently Asked Questions - Income
Housing
Leinster - Leonora is characterized by a predominantly suburban housing profile, with a higher proportion of rental properties than the broader region
Leinster - Leonora's dwelling structure, as per the latest Census, was 87.0% houses and 13.0% other dwellings (semi-detached, apartments, 'other' dwellings). Non-Metro WA had 82.9% houses and 17.0% other dwellings. Home ownership in Leinster - Leonora was 14.4%, with mortgaged dwellings at 6.0% and rented ones at 79.6%. The median monthly mortgage repayment was $634, lower than Non-Metro WA's average of $1,517. The median weekly rent figure was $70, compared to Non-Metro WA's $280. Nationally, Leinster - Leonora's mortgage repayments were significantly lower at $634 versus Australia's average of $1,863, and rents were substantially below the national figure of $375.
Frequently Asked Questions - Housing
Household Composition
Leinster - Leonora features high concentrations of lone person households, with a higher-than-average median household size
Family households account for 68.0% of all households, including 26.0% couples with children, 23.8% couples without children, and 15.0% single parent families. Non-family households constitute the remaining 32.0%, with lone person households at 31.0% and group households comprising 1.5%. The median household size is 2.8 people, larger than the Rest of WA average of 2.5.
Frequently Asked Questions - Households
Local Schools & Education
Leinster - Leonora faces educational challenges, with performance metrics placing it in the bottom quartile of areas assessed nationally
The area has university qualification rates of 14.2%, significantly lower than the Australian average of 30.4%. Bachelor degrees are most common at 10.4%, followed by postgraduate qualifications (2.2%) and graduate diplomas (1.6%). Vocational credentials are prevalent, with 42.3% of residents aged 15+ holding them, including advanced diplomas (9.1%) and certificates (33.2%). Educational participation is high at 39.1%, with 19.0% in primary education, 11.0% in secondary education, and 2.4% pursuing tertiary education.
Educational participation is notably high, with 39.1% of residents currently enrolled in formal education. This includes 19.0% in primary education, 11.0% in secondary education, and 2.4% pursuing tertiary education.
Frequently Asked Questions - Education
Schools Detail
Nearby Services & Amenities
Transport
No public transport data available for this catchment area.
Frequently Asked Questions - Transport
Transport Stops Detail
Health
Leinster - Leonora's residents are extremely healthy with younger cohorts in particular seeing very low prevalence of common health conditions
Analysis of health metrics shows strong performance throughout Leinster - Leonora, with younger cohorts in particular experiencing very low prevalence of common health conditions. The rate of private health cover was found to be very high at approximately 54% of the total population (~2866 people), compared to 62.3% across Rest of WA.
The most common medical conditions were diabetes and asthma, impacting 7.2% and 6.3% of residents respectively, while 77.4% declared themselves completely clear of medical ailments, compared to 74.9% across Rest of WA. The area has 7.7% of residents aged 65 and over (407 people), which is lower than the 9.2% in Rest of WA.
Frequently Asked Questions - Health
Cultural Diversity
The level of cultural diversity witnessed in Leinster - Leonora was found to be above average when compared nationally for a number of language and cultural background related metrics
Leinster-Leonora is more culturally diverse than most local markets, with 17.5% of its population born overseas and 45.3% speaking a language other than English at home. The dominant religion in Leinster-Leonora is Christianity, comprising 41.4% of the population. Notably, the category 'Other' makes up 5.5% of the population in Leinster-Leonora, compared to 1.2% across Rest of WA.
In terms of ancestry, Australian Aboriginal is the most represented group at 38.1%, significantly higher than the regional average of 8.6%. English and Australian groups are underrepresented at 19.2% and 15.8% respectively, compared to regional averages of 25.8%. Maori (2.0%), New Zealand (1.1%), and Samoan (0.4%) groups show notable variations in representation compared to regional figures of 3.3%, 1.5%, and 0.4% respectively.
Frequently Asked Questions - Diversity
Age
Leinster - Leonora's population is younger than the national pattern
Leinster-Leonora has a median age of 34, which is lower than the Rest of WA's figure of 40 and Australia's national average of 38 years. The 25-34 age group makes up 24.2% of Leinster-Leonora's population, higher than the Rest of WA and significantly above the national average of 14.5%. Meanwhile, the 75-84 cohort is less prevalent at 1.2%. Between 2021 and present, the 25-34 age group has increased from 21.0% to 24.2%, while the 65-74 cohort has risen from 4.8% to 6.4%. Conversely, the 5-14 cohort has decreased from 10.2% to 8.4%, and the 15-24 group has dropped from 13.6% to 11.9%. By 2041, demographic projections show significant shifts in Leinster-Leonora's age structure. The 25-34 group is expected to grow by 26% (336 people), reaching 1,614 from 1,277. Simultaneously, both the 85+ and 5-14 age groups are projected to decrease in number.
