Chart Color Schemes
est. as @ -- *
ABS ERP | -- people | --
2021 Census | -- people
Sales Activity
Curious about local property values? Filter the chart to assess the volume and appreciation (including resales) trends and regional comparisons, or scroll to the map below view this information at an individual property level.
Find a Recent Sale
Sales Detail
Population
Karrinyup - Gwelup - Carine lies within the top quartile of areas nationally for population growth performance according to AreaSearch analysis of recent, and medium to long-term trends
Karrinyup-Gwelup-Carine's population was approximately 24,486 as of November 2025. This figure represents an increase of 1,884 people since the 2021 Census, which recorded a population of 22,602. The growth is inferred from ABS data showing an estimated resident population of 24,375 in June 2024 and additional validated new addresses since the Census date. This results in a density ratio of 1,737 persons per square kilometer, higher than average national levels assessed by AreaSearch. Over the past decade, from 2012 to 2022, Karrinyup-Gwelup-Carine exhibited resilient growth patterns with a compound annual growth rate of 1.5%. Overseas migration contributed approximately 66.6% of overall population gains during recent periods.
AreaSearch uses ABS/Geoscience Australia projections for each SA2 area released in 2024, with a base year of 2022. For areas not covered by this data and post-2032 growth estimation, AreaSearch utilizes growth rates by age cohort provided by the ABS in its latest Greater Capital Region projections (released in 2023, based on 2022 data). Looking ahead, an above median population growth is projected for the area, with an expected increase of 3,809 persons to 2041, resulting in a total gain of 15.1% over the 17 years.
Frequently Asked Questions - Population
Development
AreaSearch assessment of residential development activity positions Karrinyup - Gwelup - Carine among the top 25% of areas assessed nationwide
Karrinyup-Gwelup-Carine averaged approximately 80 new dwelling approvals annually over several years. Between financial year 2021 (FY-21) and FY-25401 homes were approved, with an additional 21 approved in FY-26 so far. Over the past five financial years, an average of 4.5 new residents arrived per dwelling constructed.
This high demand outpaces supply, typically leading to price growth and increased buyer competition. Developers target the premium market segment, with new dwellings valued at approximately $440,000 on average. In FY-26, there have been $54.7 million in commercial approvals, indicating significant local commercial activity. Compared to Greater Perth, Karrinyup-Gwelup-Carine has around three-quarters the rate of new dwelling approvals per person and ranks among the 43rd percentile nationally for areas assessed, offering more limited choices for buyers and supporting demand for existing properties.
This is below average nationally, suggesting maturity and possible planning constraints. New development consists of 75% detached dwellings and 25% townhouses or apartments, maintaining the area's suburban identity with a focus on family homes suited to buyers seeking space. The location has approximately 385 people per dwelling approval, reflecting an established area. Future projections indicate Karrinyup-Gwelup-Carine will add around 3,698 residents by 2041. If current construction levels persist, housing supply may lag population growth, potentially intensifying buyer competition and underpinning price growth.
Frequently Asked Questions - Development
Infrastructure
Karrinyup - Gwelup - Carine has emerging levels of nearby infrastructure activity, ranking in the 26thth percentile nationally
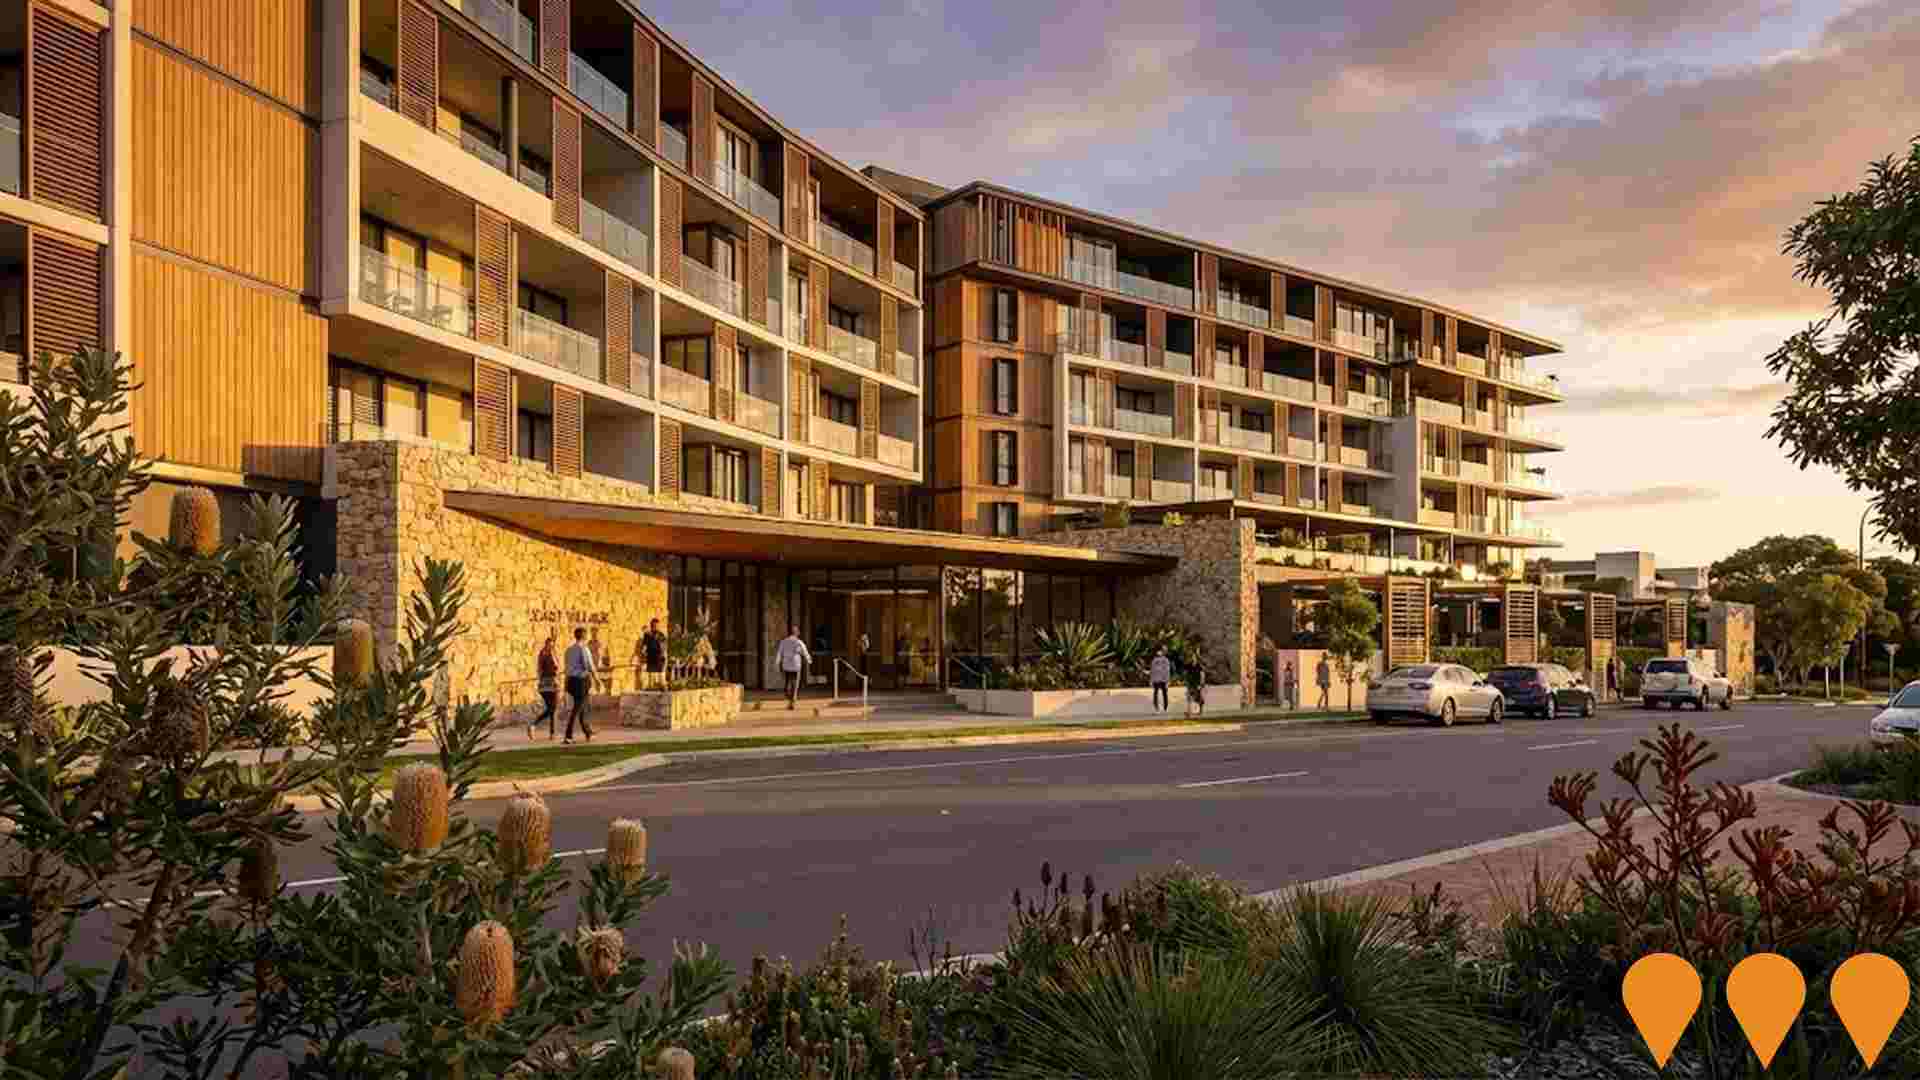
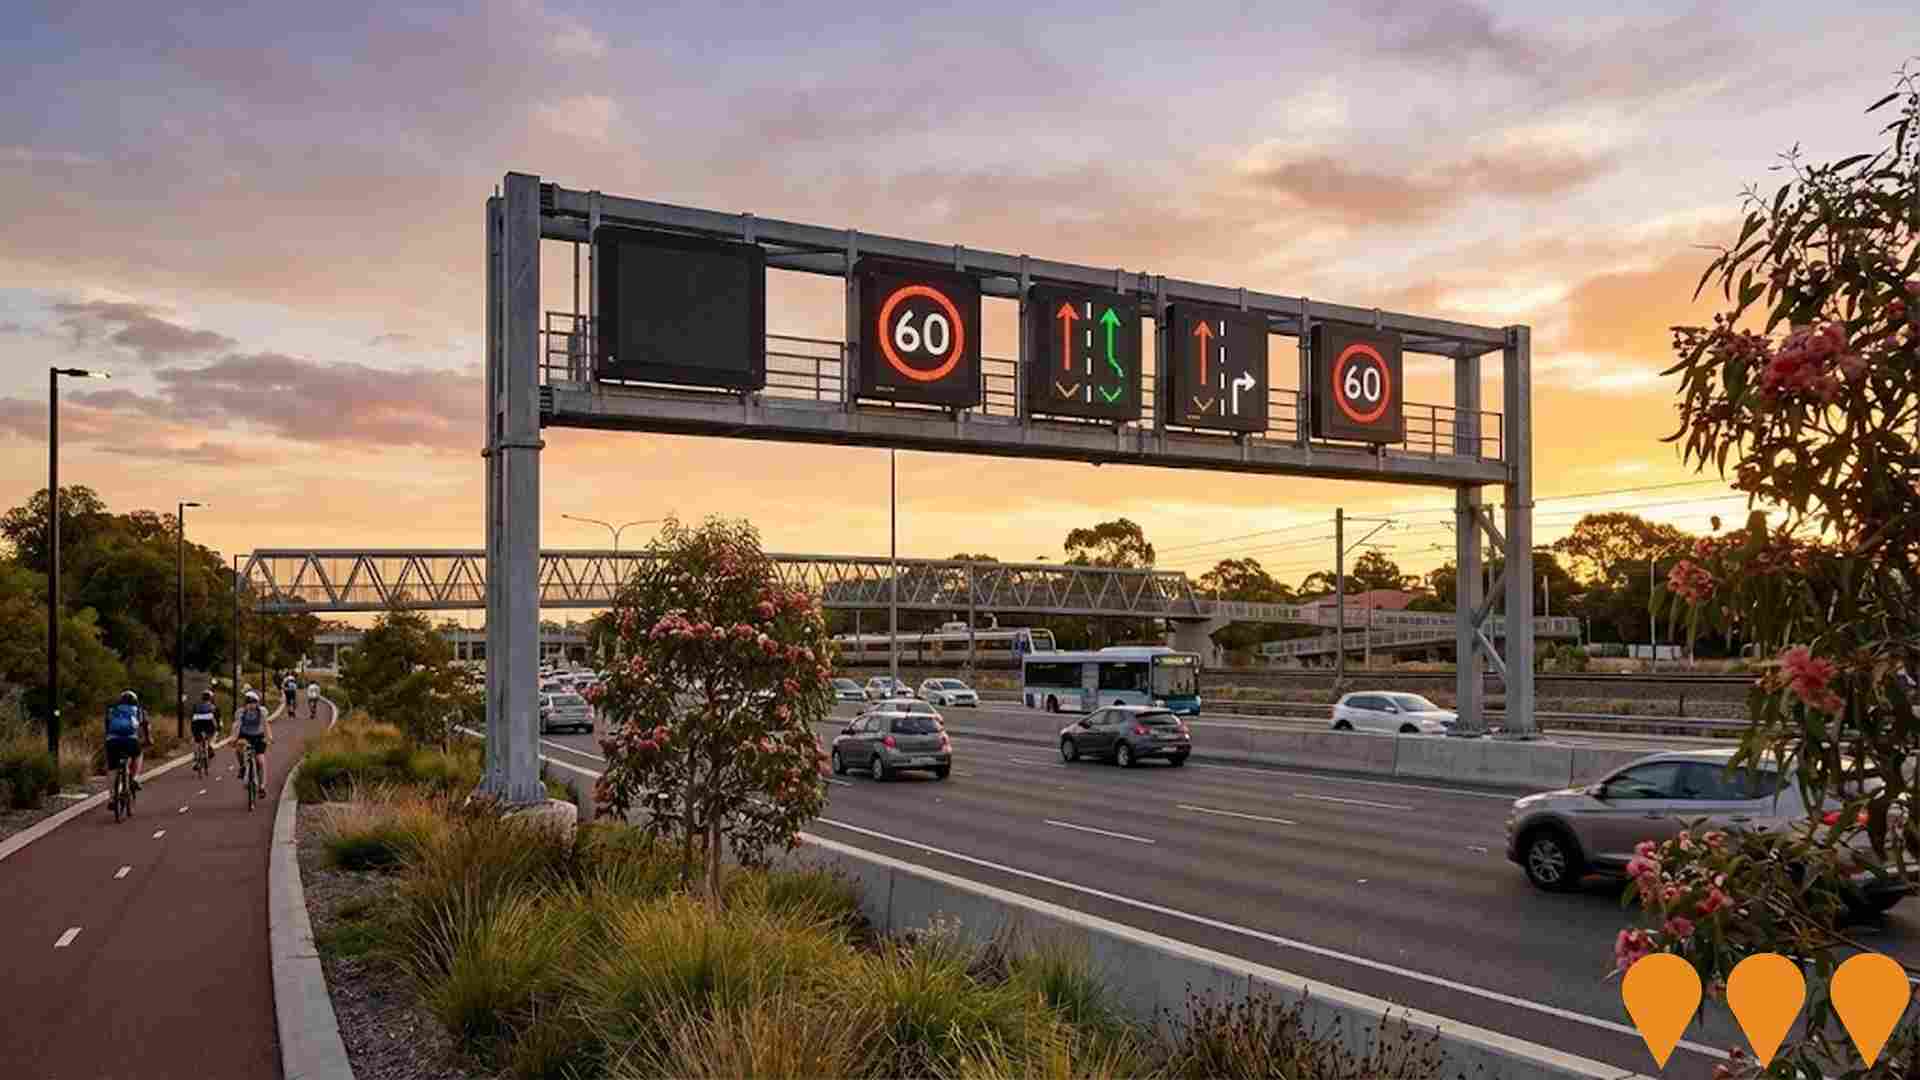
Changes to local infrastructure significantly influence an area's performance. AreaSearch identified 29 projects that could impact the area. Notable ones include West Village, Karrinyup Bus Depot Transformation, Stirling City Centre Sports Precinct, and Bold Park Community Facilities Upgrade. The following list details those likely to be most relevant.
Professional plan users can use the search below to filter and access additional projects.
INFRASTRUCTURE SEARCH
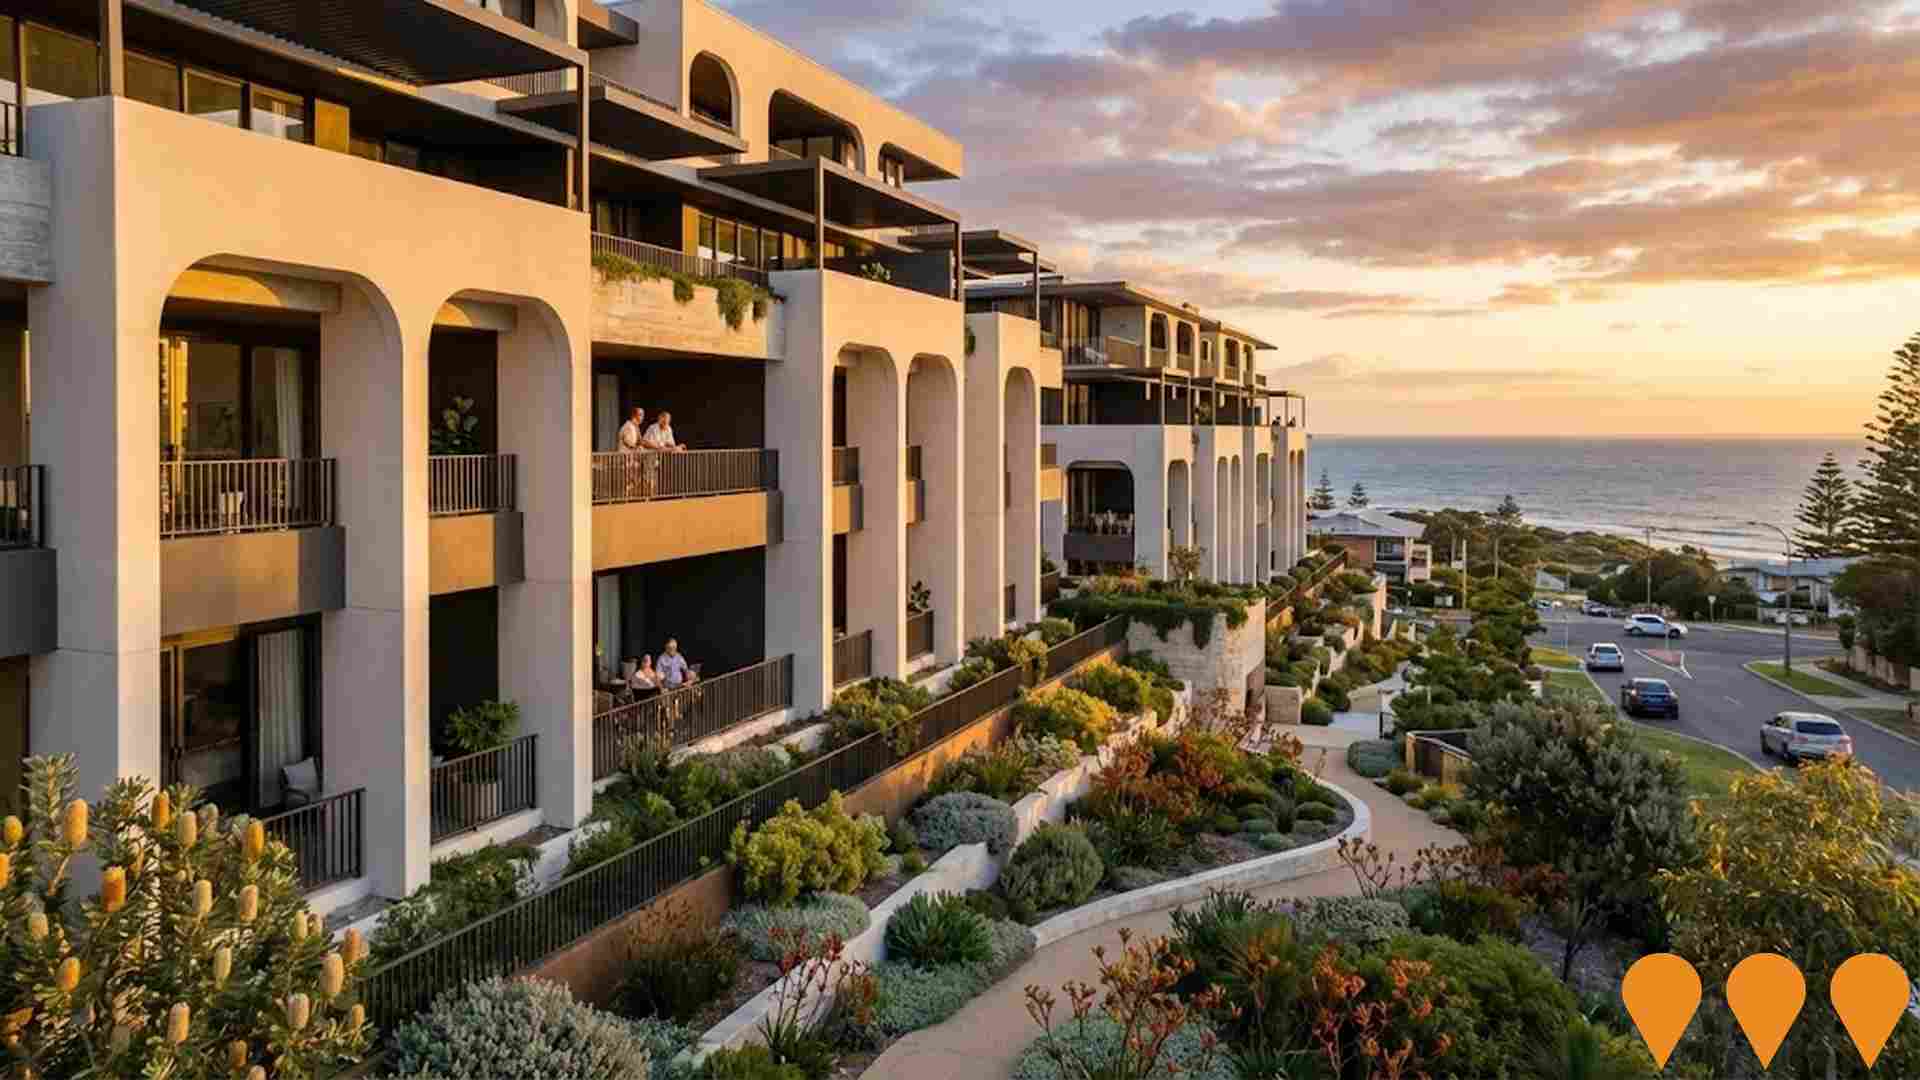
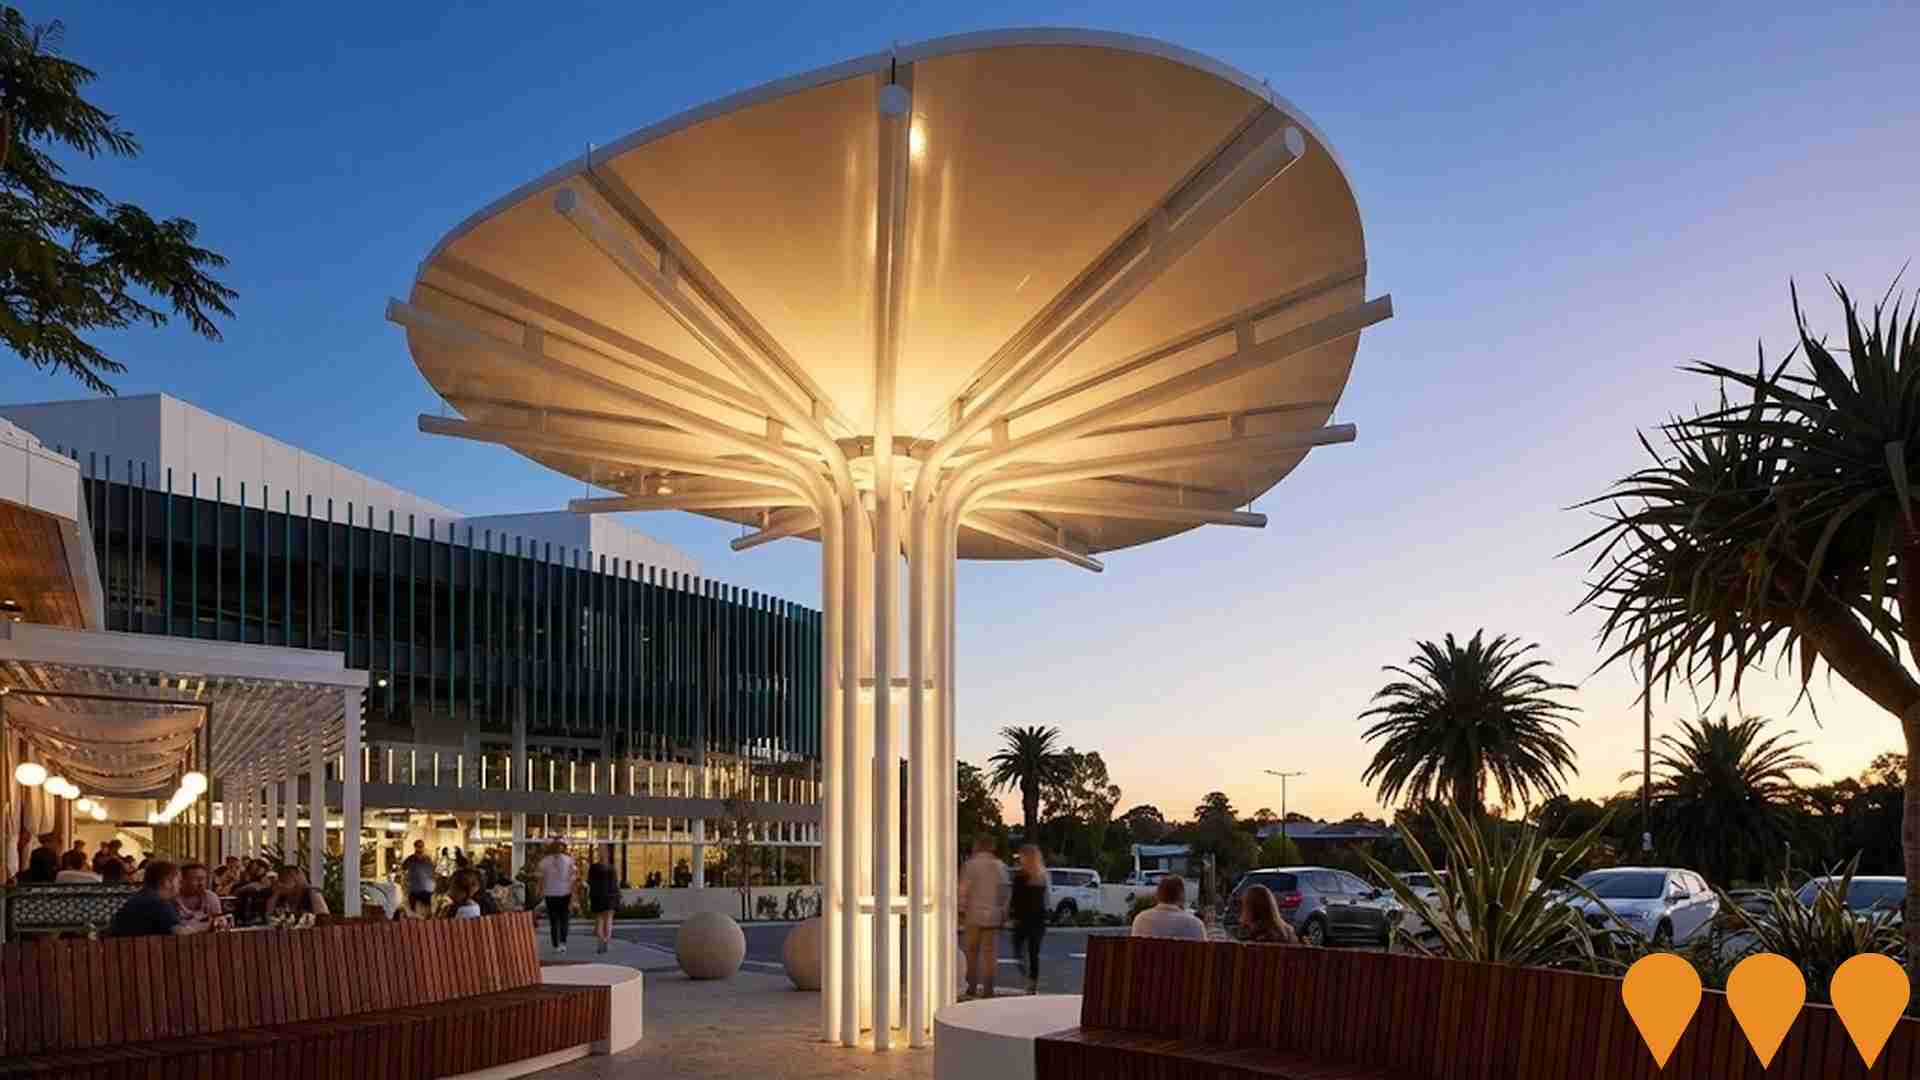
 Denotes AI-based impression for illustrative purposes only, not to be taken as definitive under any circumstances. Please follow links and conduct other investigations from the project's source for actual imagery. Developers and project owners wishing us to use original imagery please Contact Us and we will do so.
Frequently Asked Questions - Infrastructure
Karrinyup Shopping Centre Redevelopment
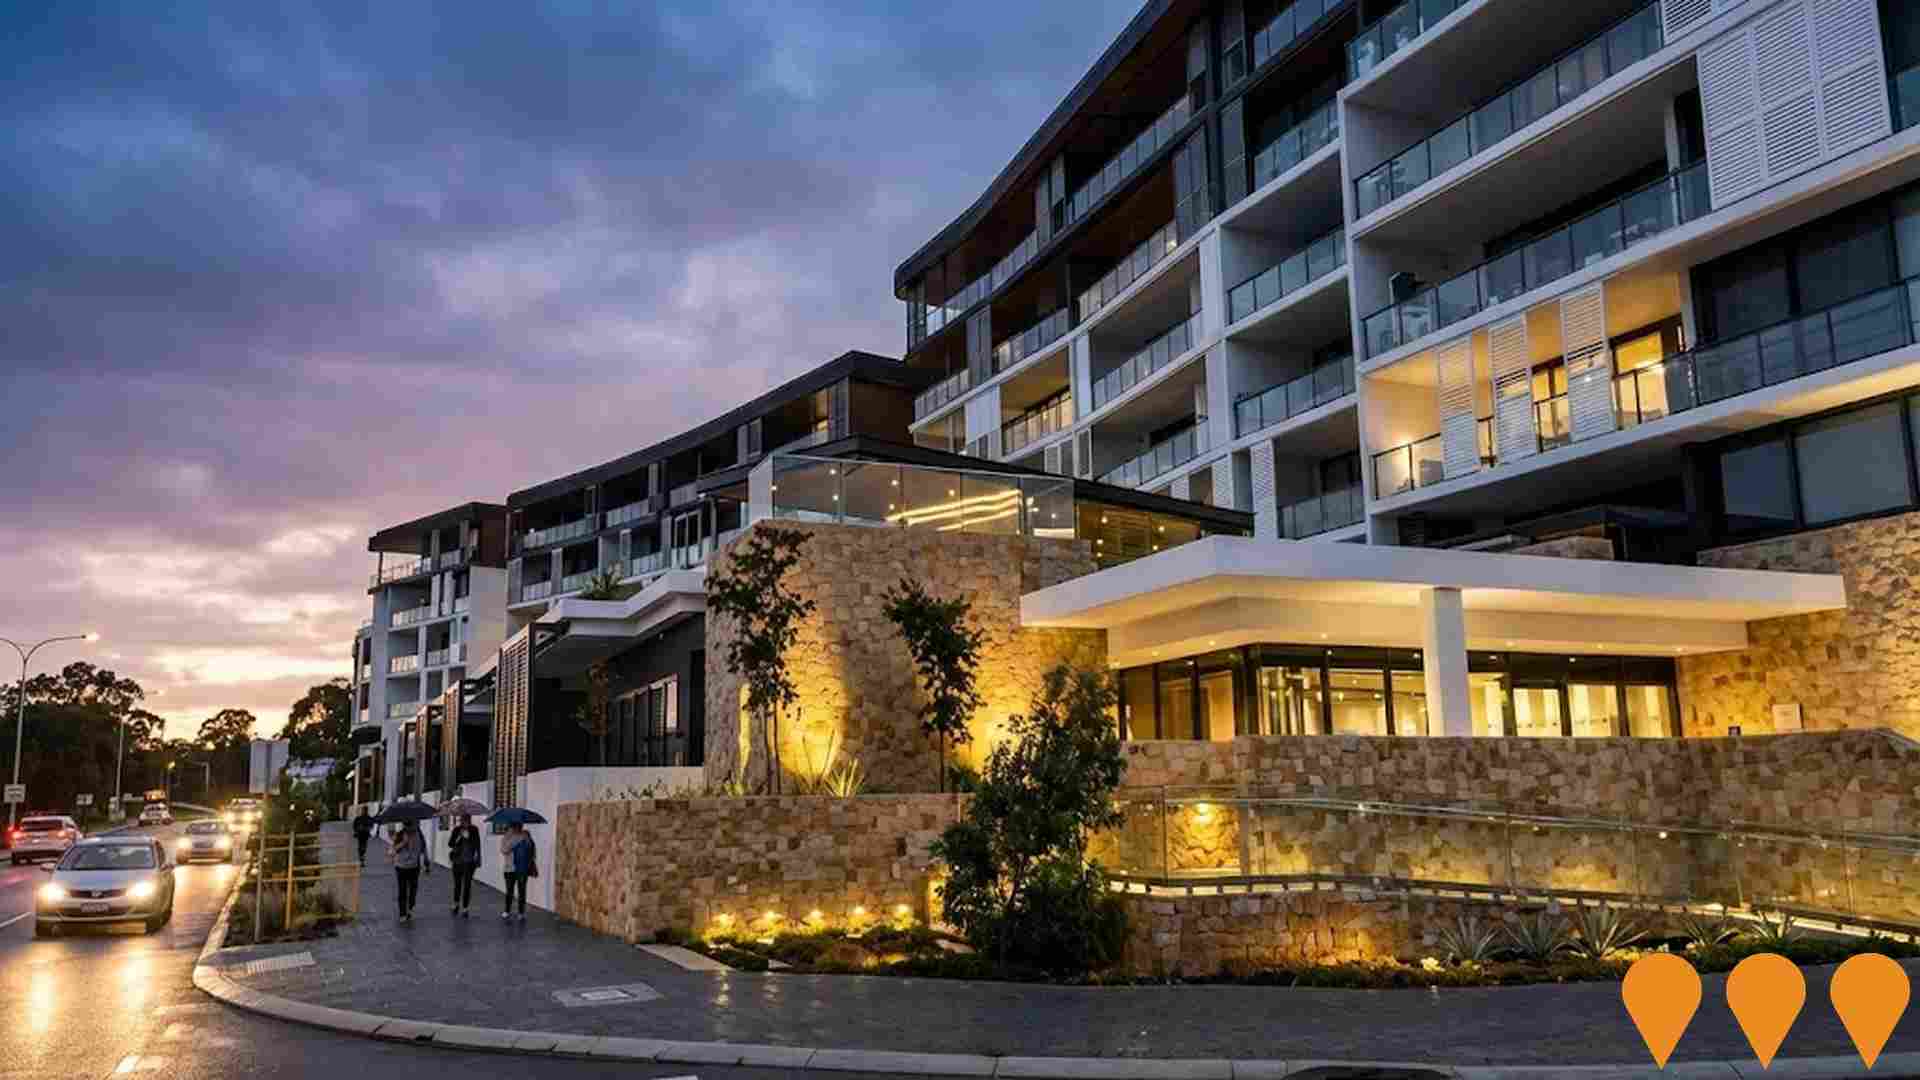
Major $800 million redevelopment completed in October 2021 that doubled the shopping centre from 59,874 to 109,000 square metres, featuring 290 retail stores including major retailers like Myer, David Jones, Zara, H&M, and Sephora. Includes entertainment precinct The West Deck with over 20 dining venues, 10-screen HOYTS cinema, and mixed-use residential development (364 total apartments across East Village and West Village). Perth's largest commercial construction project from 2018-2021, supporting 2,500 construction jobs and creating 2,500 permanent retail jobs. Features associated road infrastructure improvements and intersection upgrades.
Stephenson Avenue Extension
Major $165 million road extension project extending Stephenson Avenue from Scarborough Beach Road to Mitchell Freeway, delivered in two phases. Phase 1 (completed February 2022) extended the road from Scarborough Beach Road to Howe Street. Phase 2 (expected completion mid-2025) includes grade-separated interchange at Mitchell Freeway with bridges over freeway and Joondalup rail line, shared path network extension, connection to Stirling City Centre, and modifications to Mitchell Freeway/Cedric Street interchange. Part of broader transport infrastructure upgrade to reduce congestion and improve connectivity, unlocking 55 hectares of development land near Stirling Station and supporting 800 jobs. Jointly funded by Australian Government ($65 million) and WA Government ($60 million).
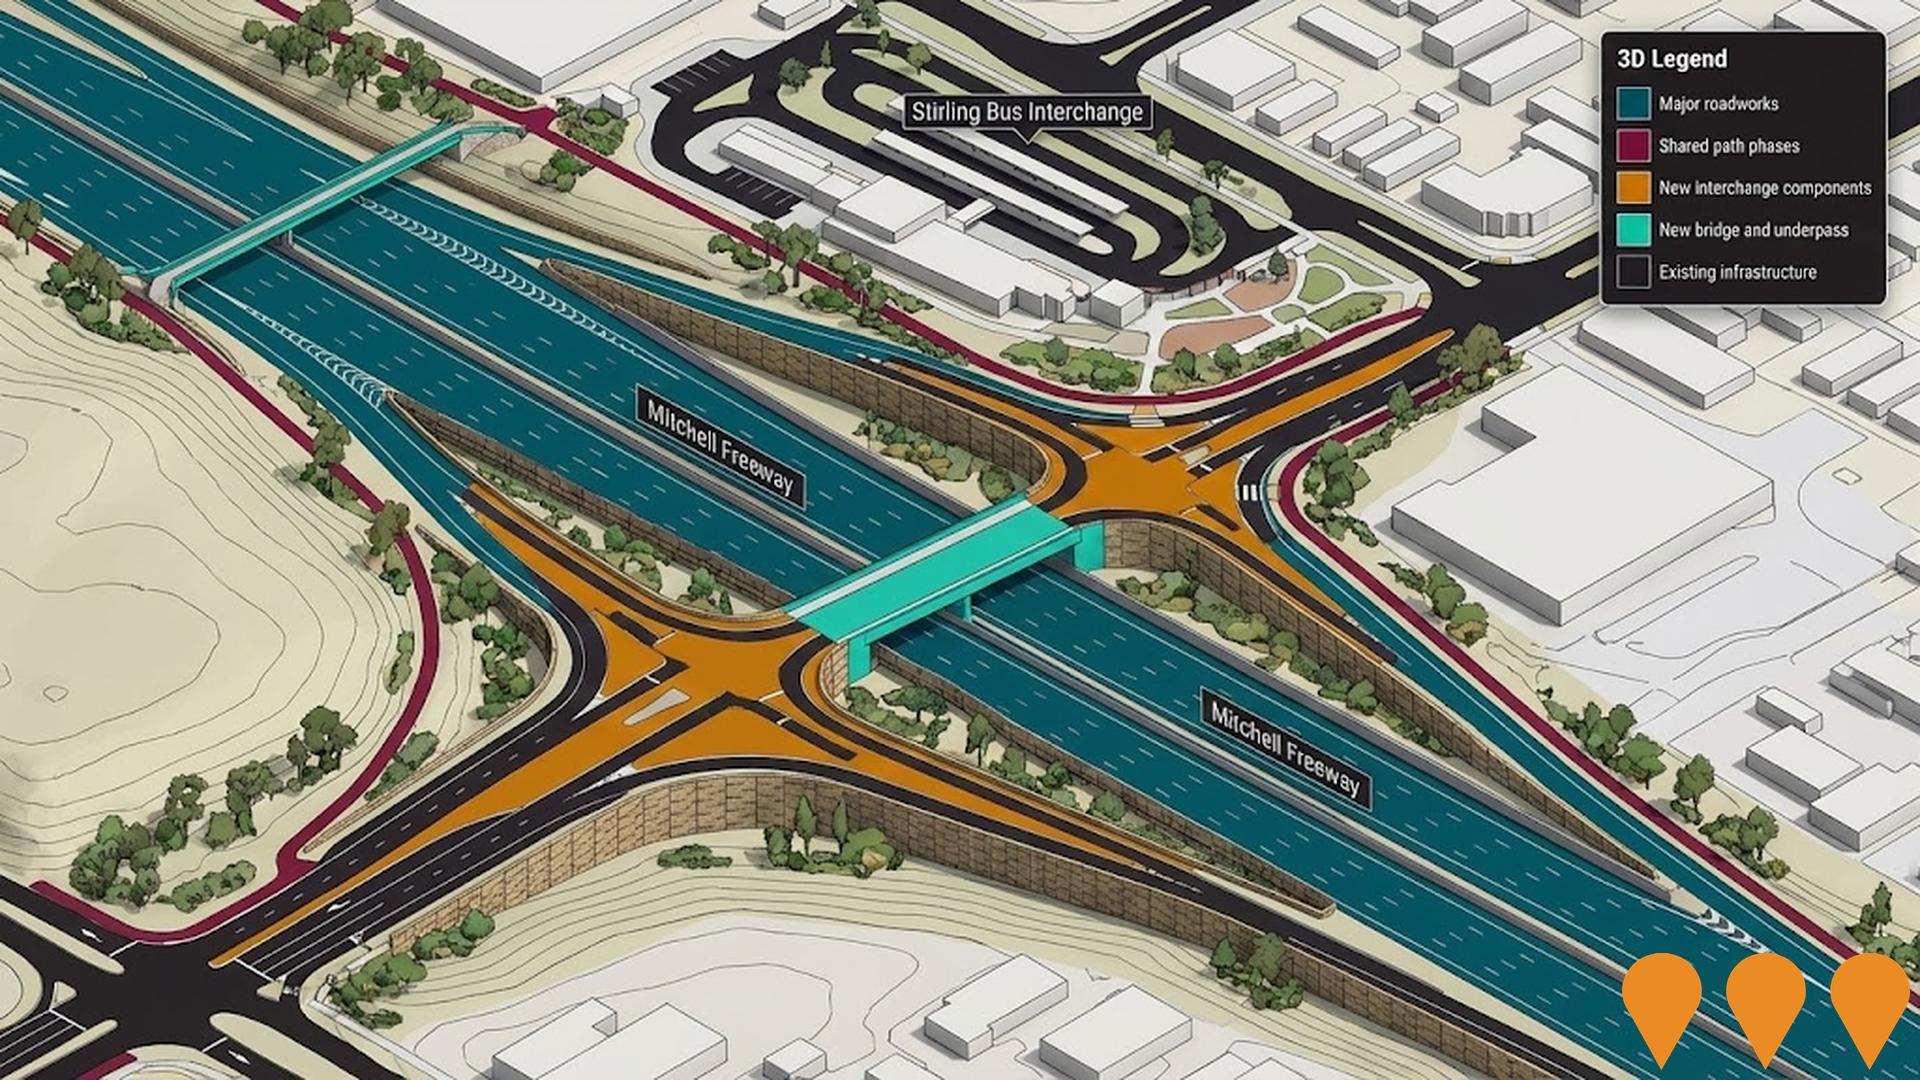
Stirling City Centre Infrastructure Package
Major infrastructure package including $165M Stephenson Avenue Extension, $90M Stirling Bus Interchange upgrade, $140M Smart Freeway (Mitchell Freeway), $21M Principal Shared Path extension, and Mitchell Freeway widening to support Perth's second CBD development.
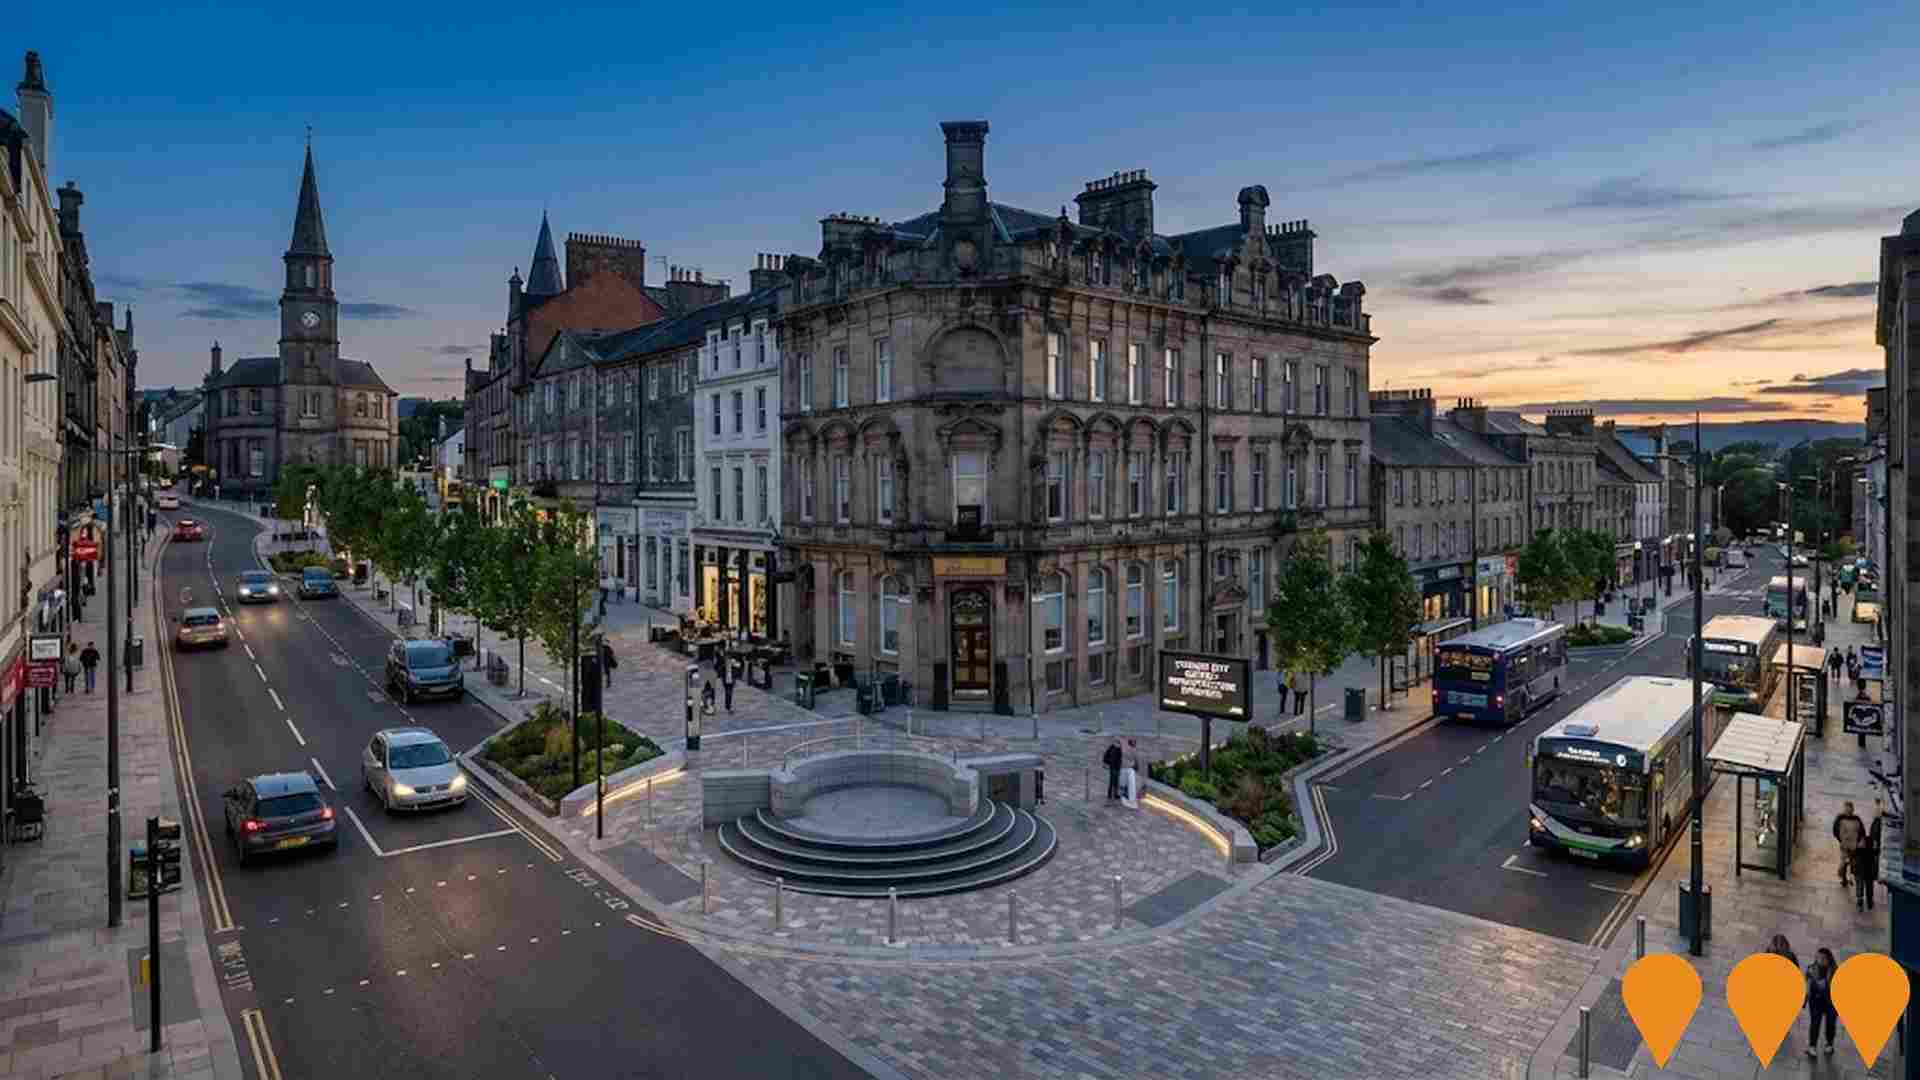
Stirling Bus Interchange Upgrade
Major upgrade of Stirling Bus Interchange from 18-stand to 30-stand facility, including new pedestrian access bridge between Stirling Station and southern car park. Part of $90 million investment to improve public transport connectivity for the growing northern suburbs. Being delivered in coordination with the Stephenson Avenue Extension project, with car park access to be via Cedric Street and new Stephenson Avenue upon completion. Delivered by Main Roads WA on behalf of Public Transport Authority.
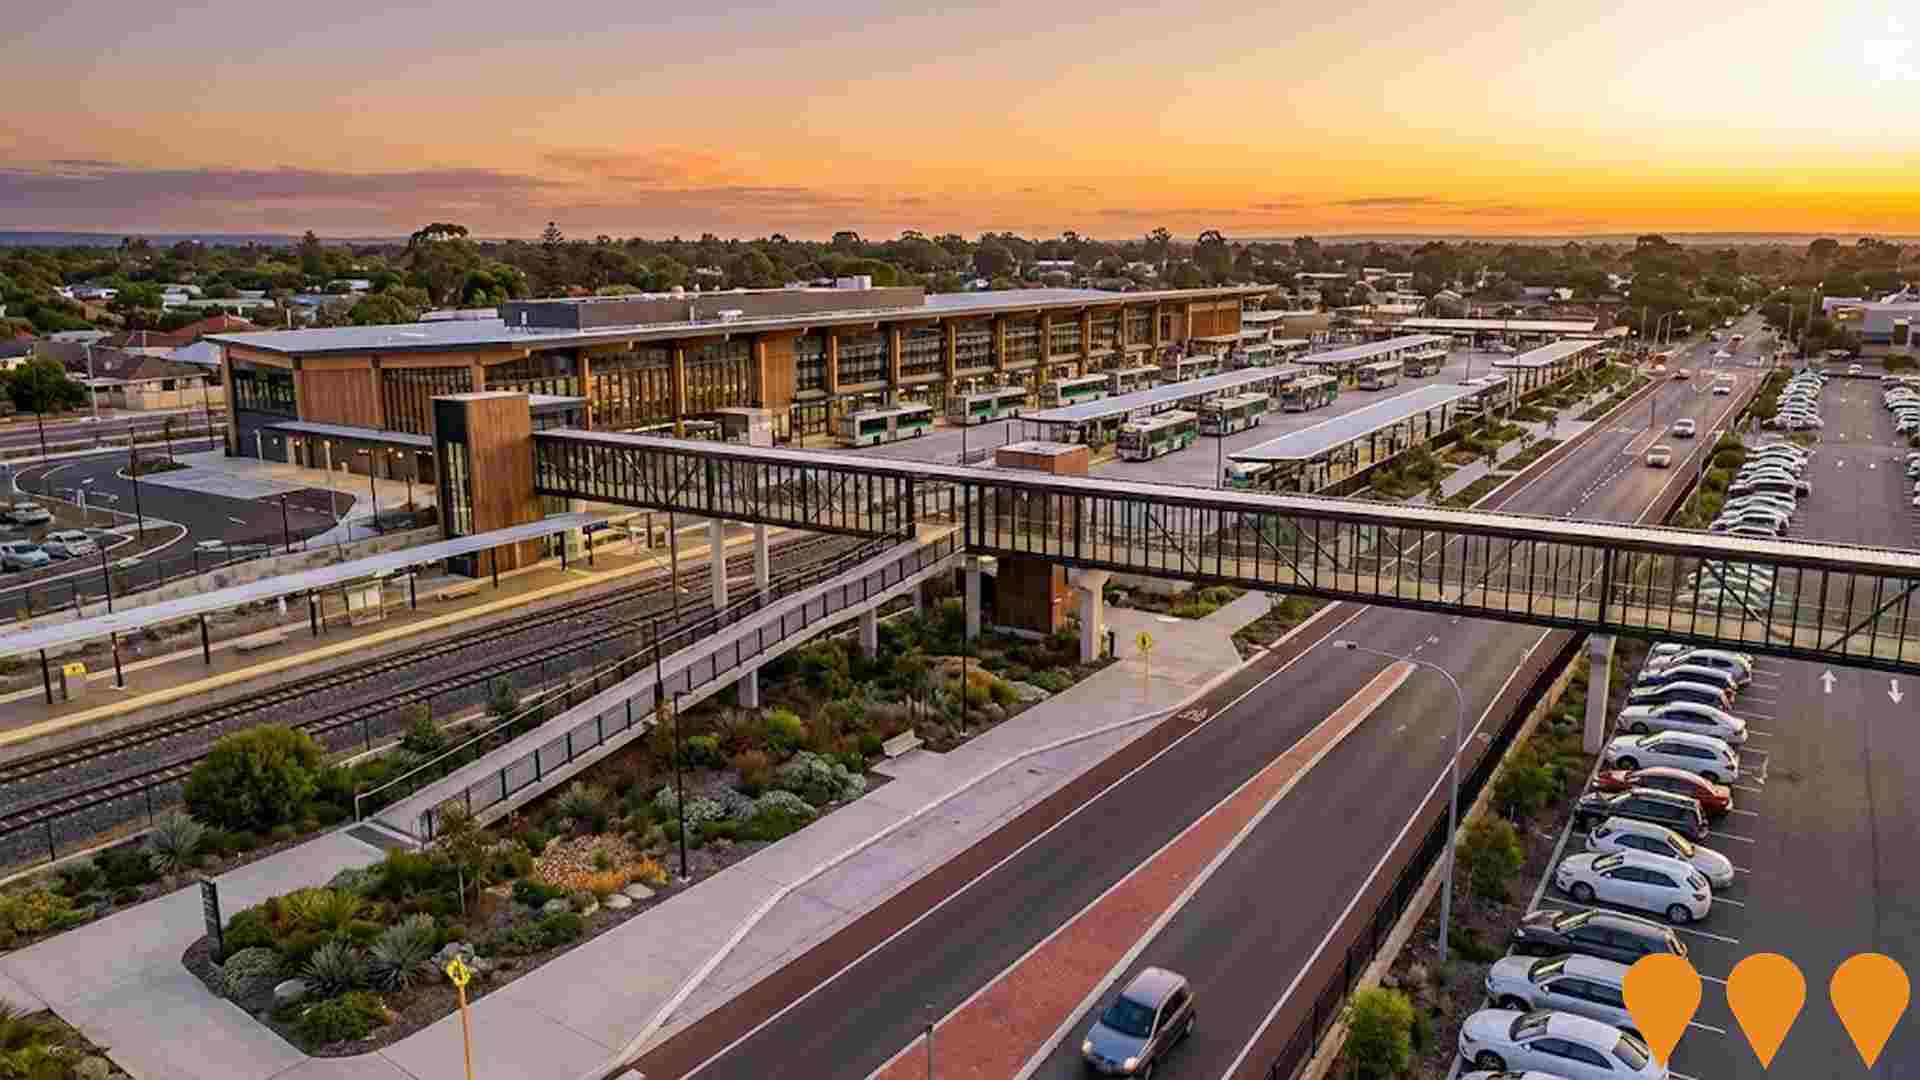
Stirling City Centre Sports Precinct
New sports and recreation precinct as part of Stirling City Centre development, featuring modern sporting facilities, community spaces and recreational amenities to serve the growing northern suburbs population.
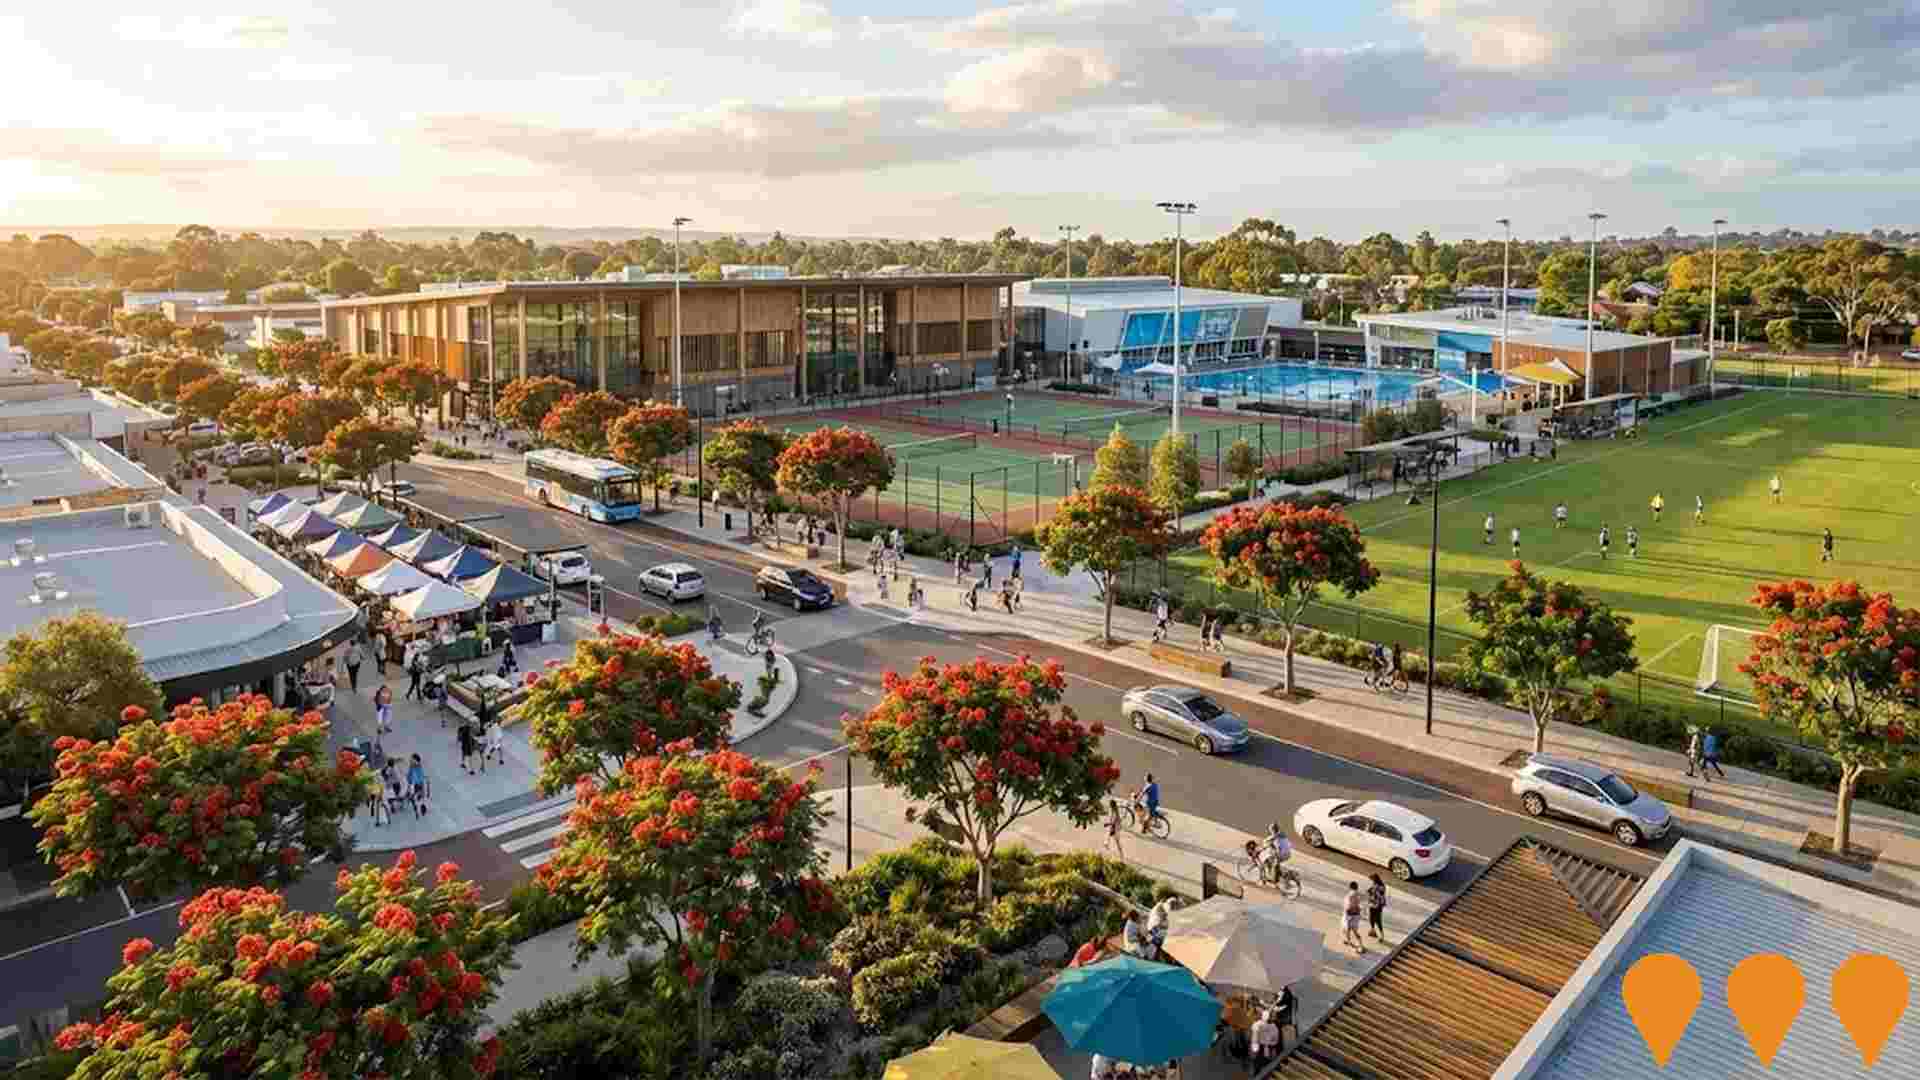
Karrinyup Bus Depot Transformation
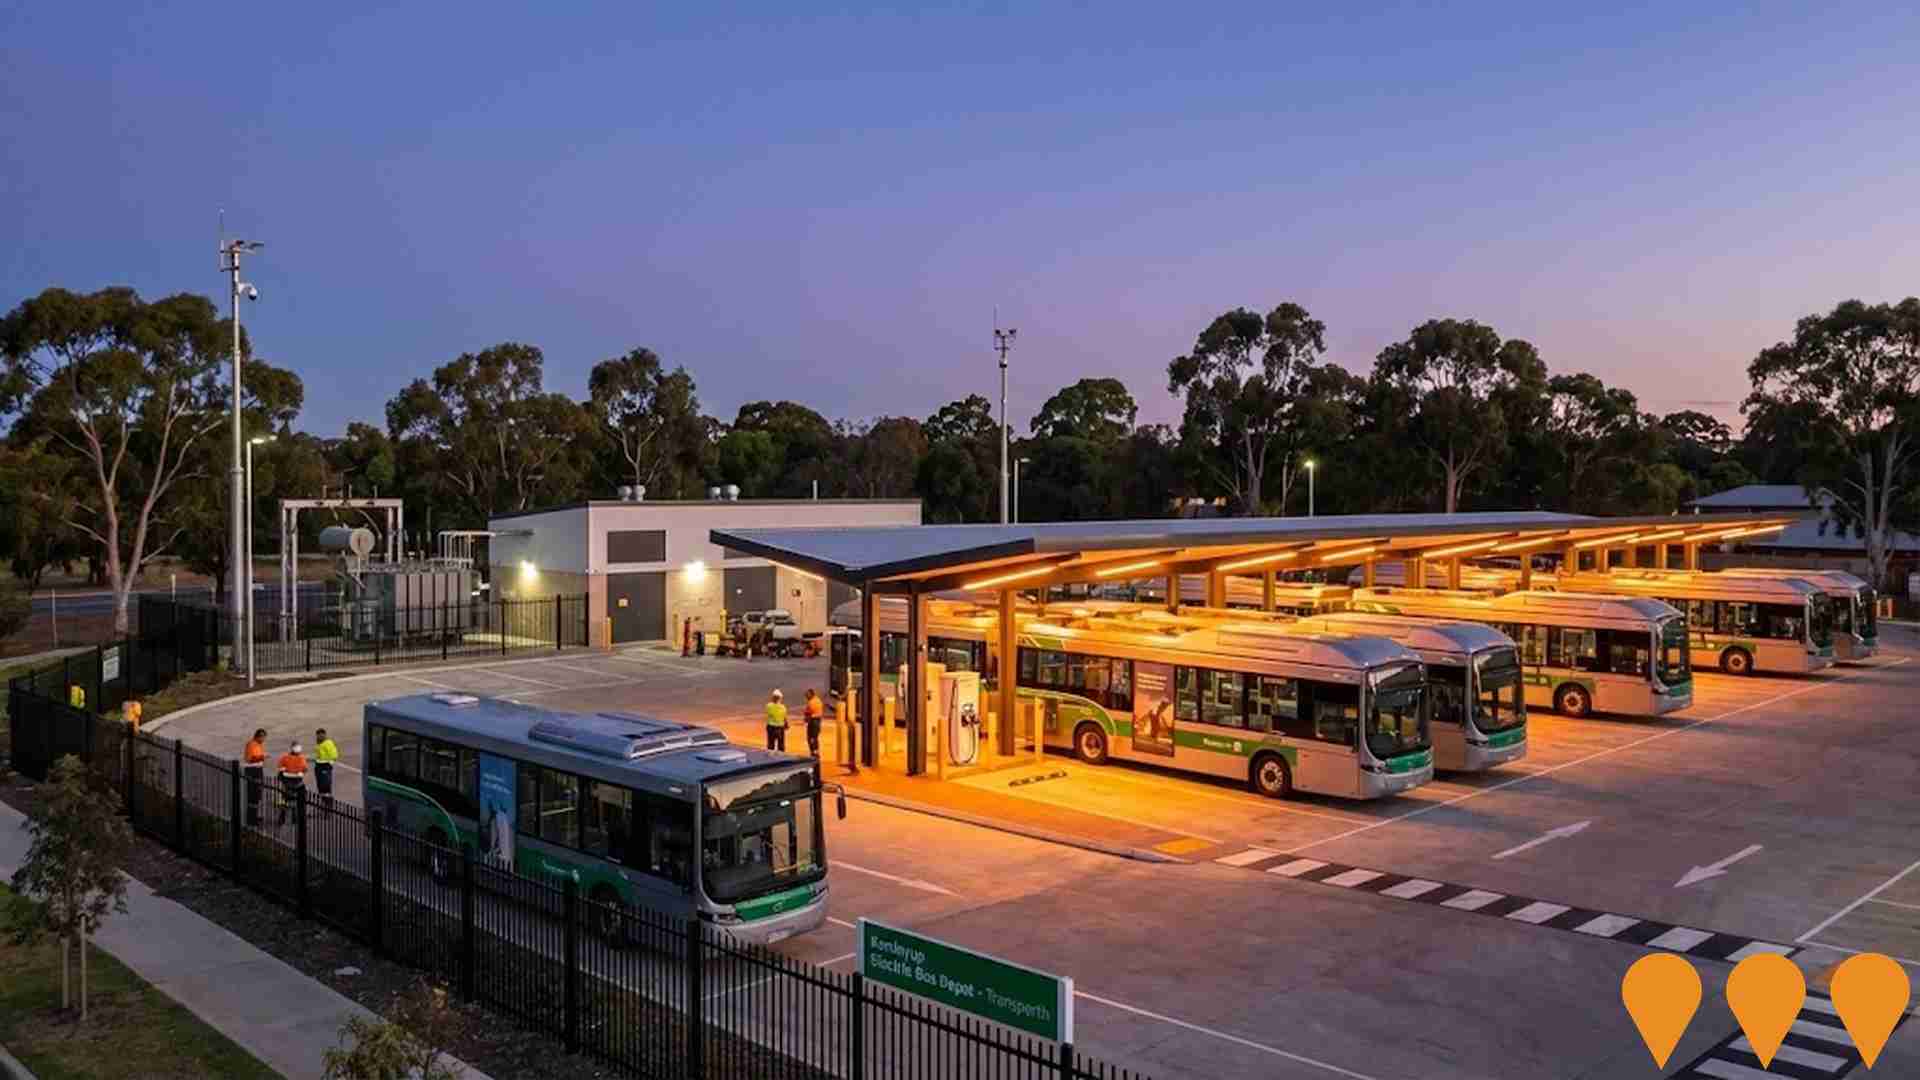
Retrofit of Karrinyup Bus Depot to support electric buses, including installation of EV charging equipment, substation upgrades, and CCTV enhancements. The depot will have capacity to support 110 electric buses. Part of a $250 million joint State and Federal Government initiative to transition Perth's public transport to electric buses. Works expected to be completed by end of 2025, with first electric buses operating from the depot in early 2026. This will be the first electric bus service to run outside of Perth's CBD.
Bold Park Community Facilities Upgrade
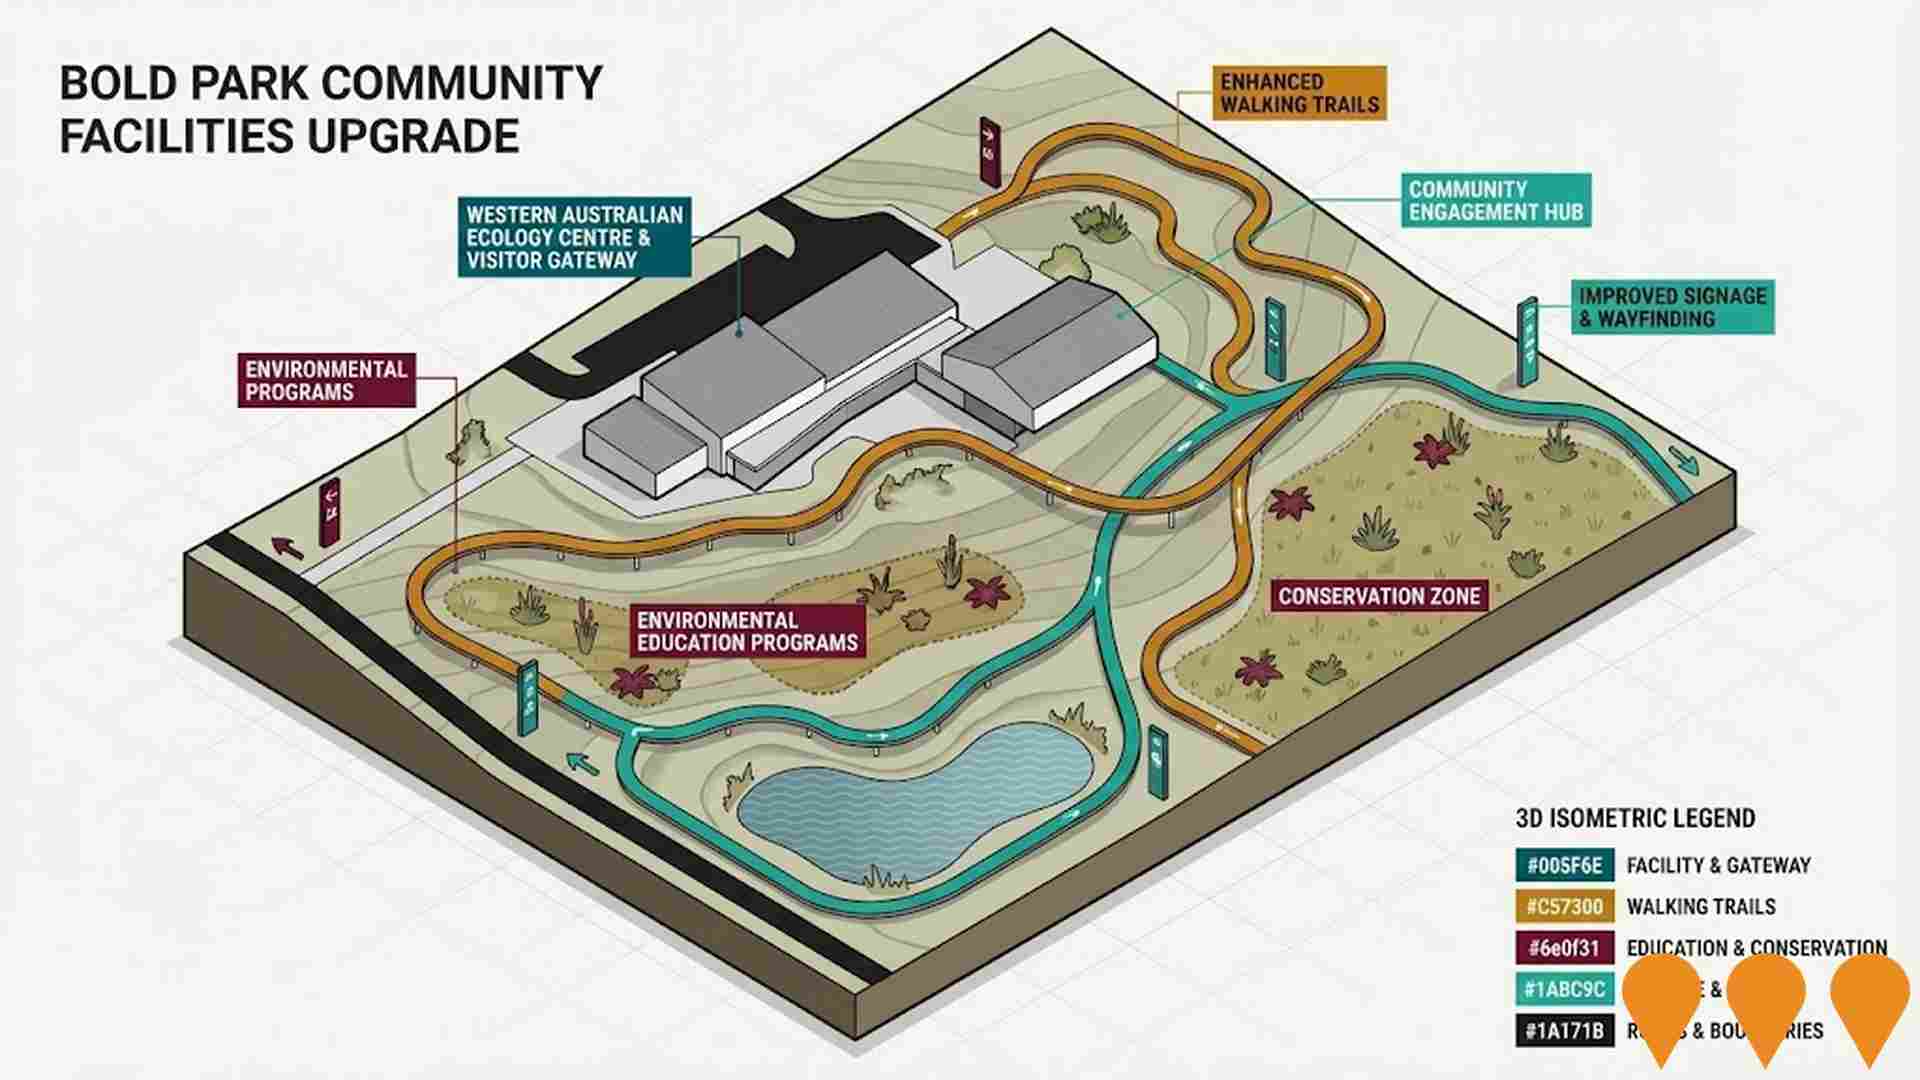
The Bold Park Management Plan 2022-2027 outlines upgrades to community facilities including transforming the Western Australian Ecology Centre into a visitor gateway and community engagement hub, enhancing walking trails for improved access and safety, developing environmental education programs, and improving signage for better wayfinding and educational outcomes to support conservation and recreation activities.
Karrinyup Library
The Karrinyup Library is part of the City of Stirling's network of six public libraries. While previous discussions addressed potential redevelopment to improve accessibility, parking, and infrastructure, the City of Stirling has confirmed there are currently no active redevelopment plans for the library or its site. The library continues to operate with regular programming and community services.
Employment
AreaSearch analysis of employment trends sees Karrinyup - Gwelup - Carine performing better than 90% of local markets assessed across Australia
Karrinyup-Gwelup-Carine has a highly educated workforce with strong representation in professional services. Its unemployment rate was 1.2% as of June 2025.
This rate is 2.7% lower than Greater Perth's rate of 3.9%. Workforce participation is similar to Greater Perth at 65.2%. Major employment sectors include health care & social assistance, professional & technical services, and education & training. Notably, professional & technical services have an employment level 1.5 times the regional average, while manufacturing has limited presence at 3.2% compared to the regional average of 5.5%.
The area's predominantly residential nature suggests limited local employment opportunities. Between June 2024 and June 2025, employment increased by 4.3%, labour force grew by 4.0%, and unemployment decreased by 0.3 percentage points. In contrast, Greater Perth saw employment rise by 3.7% while unemployment rose slightly. National employment forecasts from Jobs and Skills Australia (May 2025) project national growth of 6.6% over five years and 13.7% over ten years. Applying these projections to Karrinyup-Gwelup-Carine's employment mix suggests local growth of approximately 6.8% over five years and 13.9% over ten years, though these are simple extrapolations for illustrative purposes only.
Frequently Asked Questions - Employment
Income
The economic profile demonstrates exceptional strength, placing the area among the top 10% nationally based on comprehensive AreaSearch income analysis
Karrinyup-Gwelup-Carine has an exceptionally high national income level according to AreaSearch's aggregation of latest ATO data for FY2022. Its median taxpayer income is $65,515 and average income stands at $93,610, compared to Greater Perth's $58,380 and $78,020 respectively. Based on a 14.2% growth in Wage Price Index since FY2022, estimates for September 2025 are approximately $74,818 (median) and $106,903 (average). Census data shows incomes rank highly nationally, between the 77th and 90th percentiles. The $4000+ income bracket dominates with 28.3% of residents (6,929 people), differing from broader areas where the $1,500-$2,999 category predominates at 32.0%. Notably, 42.4% earn above $3,000 weekly. After housing costs, residents retain 87.4% of income, indicating strong purchasing power. The area's SEIFA income ranking places it in the 9th decile.
Frequently Asked Questions - Income
Housing
Karrinyup - Gwelup - Carine is characterized by a predominantly suburban housing profile, with above-average rates of outright home ownership
The dwelling structure in Karrinyup - Gwelup - Carine, as per the latest Census, consisted of 86.1% houses and 13.9% other dwellings (semi-detached, apartments, 'other' dwellings). In contrast, Perth metro had 59.6% houses and 40.4% other dwellings. Home ownership in Karrinyup - Gwelup - Carine stood at 42.8%, with mortgaged dwellings at 43.3% and rented ones at 13.9%. The median monthly mortgage repayment was $2,500, higher than Perth metro's average of $1,950. The median weekly rent figure was $460, compared to Perth metro's $350. Nationally, Karrinyup - Gwelup - Carine's mortgage repayments were significantly higher at $2,500 versus the Australian average of $1,863, while rents were substantially above the national figure of $375 at $460.
Frequently Asked Questions - Housing
Household Composition
Karrinyup - Gwelup - Carine features high concentrations of family households, with a higher-than-average median household size
Family households comprise 79.6% of all households, including 43.2% couples with children, 28.3% couples without children, and 7.4% single parent families. Non-family households make up the remaining 20.4%, with lone person households at 18.4% and group households comprising 2.0%. The median household size is 2.8 people, larger than the Greater Perth average of 2.4.
Frequently Asked Questions - Households
Local Schools & Education
Educational achievement in Karrinyup - Gwelup - Carine places it within the top 10% nationally, reflecting strong academic performance and high qualification levels across the community
Educational attainment in Karrinyup - Gwelup - Carine is significantly higher than broader benchmarks. 41.7% of residents aged 15+ hold university qualifications, compared to 27.9% in WA and 29.0% in the SA4 region. Bachelor degrees are most common at 28.8%, followed by postgraduate qualifications (8.4%) and graduate diplomas (4.5%). Vocational credentials are also prominent, with 28.0% of residents aged 15+ holding them - advanced diplomas account for 11.6% and certificates for 16.4%.
Educational participation is high, with 30.1% of residents currently enrolled in formal education. This includes 11.1% in primary education, 9.3% in secondary education, and 5.0% pursuing tertiary education. There are 8 schools operating within Karrinyup - Gwelup - Carine, educating approximately 6,607 students. The area has significant socio-educational advantages and academic achievement (ICSEA: 1113). The educational mix includes 6 primary, 1 secondary, and 1 K-12 school. As an education hub, the area has 27.0 school places per 100 residents, significantly above the regional average of 14.5, attracting students from surrounding communities.
Frequently Asked Questions - Education
Schools Detail
Nearby Services & Amenities
Transport
Transport servicing is moderate compared to other areas nationally based on assessment of service frequency, route connectivity and accessibility
The analysis of public transport in the Karrinyup - Gwelup - Carine area shows that there are 120 active transport stops operating. These stops serve a mix of bus routes, with a total of 12 individual routes providing 1,773 weekly passenger trips combined. The accessibility of transport is rated as good, with residents typically located 222 meters from the nearest transport stop.
Across all routes, service frequency averages 253 trips per day, which equates to approximately 14 weekly trips per individual stop.
Frequently Asked Questions - Transport
Transport Stops Detail
Health
Karrinyup - Gwelup - Carine's residents are healthier than average in comparison to broader Australia with prevalence of common health conditions quite low across both younger and older age cohorts
Health data shows relatively positive outcomes for Karrinyup - Gwelup - Carine residents. The prevalence of common health conditions is quite low across both younger and older age cohorts. Approximately 68% of the total population (16,699 people) has private health cover, compared to 59.9% across Greater Perth and a national average of 55.3%.
The most prevalent medical conditions in the area are arthritis and asthma, affecting 7.5 and 6.6% of residents respectively. A total of 71.2% of residents declare themselves completely clear of medical ailments, compared to 73.0% across Greater Perth. The area has 22.1% of residents aged 65 and over (5,423 people), which is higher than the 18.3% in Greater Perth. Health outcomes among seniors are above average, broadly in line with the general population's health profile.
Frequently Asked Questions - Health
Cultural Diversity
Karrinyup - Gwelup - Carine was found to be more culturally diverse than the vast majority of local markets in Australia, upon assessment of a range of language and cultural background related metrics
Karrinyup-Gwelup-Carine has a higher cultural diversity than most local markets, with 12.6% of its population speaking a language other than English at home and 29.2% born overseas. Christianity is the predominant religion in Karrinyup-Gwelup-Carine, comprising 51.1% of people. However, Judaism is overrepresented compared to Greater Perth, making up 0.2% versus 1.4%.
In terms of ancestry, English is the most represented group at 29.7%, higher than the regional average of 23.5%. Australian and Irish follow with 23.7% and 8.4% respectively. Notable divergences include South African (1.3% vs regional 1.0%), Croatian (1.2% vs 1.1%), and Welsh (0.8% vs 0.6%).
Frequently Asked Questions - Diversity
Age
Karrinyup - Gwelup - Carine hosts an older demographic, ranking in the top quartile nationwide
The median age in Karrinyup - Gwelup - Carine is 42 years, significantly higher than Greater Perth's average of 37 years and Australia's average of 38 years. The 75-84 age group comprises 8.5% of the population, compared to Greater Perth, while the 25-34 age group makes up 7.3%. According to post-2021 Census data, the 15-24 age group has increased from 10.5% to 12.1%, and the 75-84 cohort has risen from 7.2% to 8.5%. Conversely, the 65-74 age group has decreased from 11.0% to 9.8%. By 2041, population forecasts indicate substantial demographic changes for Karrinyup - Gwelup - Carine. The 85+ age group is projected to grow by 139%, reaching 2,277 people from 952. Notably, the combined 65+ age groups will account for 60% of total population growth, reflecting the area's aging demographic profile. In contrast, the 0-4 and 5-14 age cohorts are expected to experience population declines.
