Chart Color Schemes
est. as @ -- *
ABS ERP | -- people | --
2021 Census | -- people
Sales Activity
Curious about local property values? Filter the chart to assess the volume and appreciation (including resales) trends and regional comparisons, or scroll to the map below view this information at an individual property level.
Find a Recent Sale
Sales Detail
Population
An assessment of population growth drivers in Duncraig reveals an overall ranking slightly below national averages considering recent, and medium term trends
Duncraig's population is approximately 17,310 as of Aug 2025. This figure represents an increase of 1,328 people from the 2021 Census total of 15,982, reflecting a growth rate of 8.3%. The change is inferred from ABS estimates: 17,263 residents in June 2024 plus 73 new addresses validated since the Census date. This results in a population density of 2,262 persons per square kilometer, exceeding national averages assessed by AreaSearch. Over the past decade, Duncraig has shown steady growth with a compound annual growth rate of 0.8%, outperforming its SA3 area. Recent population gains were predominantly driven by overseas migration, contributing approximately 81.7% to overall increases.
AreaSearch uses ABS/Geoscience Australia projections for each SA2 area released in 2024 (with base year 2022), and ABS Greater Capital Region projections from 2023 (based on 2022 data) for areas not covered by this data or for estimates post-2032. Future population trends indicate a median increase, with Duncraig expected to expand by 1,991 persons to 2041, recording an 11.2% total gain over the 17-year period.
Frequently Asked Questions - Population
Development
Recent residential development output has been above average within Duncraig when compared nationally
Duncraig has averaged approximately 77 new dwelling approvals per year. Development approval data is produced by the Australian Bureau of Statistics on a financial year basis, with 385 homes approved over the past five financial years from FY-20 to FY-25, and three approvals so far in FY-26. On average, 5.4 new residents are associated with each home built during these five financial years. Supply has substantially lagged demand, indicating heightened buyer competition and pricing pressures.
New homes are being constructed at an average expected cost of $530,000, slightly above the regional average, suggesting a focus on quality developments. This financial year has seen $7.7 million in commercial approvals, reflecting the area's residential character. Compared to Greater Perth, Duncraig has 12.0% less new development per person and ranks among the 33rd percentile of areas assessed nationally, resulting in relatively constrained buyer choice and interest in existing homes. This activity is also below average nationally, indicating the area's maturity and possible planning constraints.
New building activity consists of 81.0% detached dwellings and 19.0% townhouses or apartments, maintaining Duncraig's suburban identity with a concentration of family homes suited to buyers seeking space. With around 502 people per approval, Duncraig indicates a mature market. Population forecasts suggest Duncraig will gain 1,944 residents by 2041. Based on current development patterns, new housing supply should readily meet demand, offering good conditions for buyers and potentially facilitating population growth beyond current projections.
Frequently Asked Questions - Development
Infrastructure
Duncraig has moderate levels of nearby infrastructure activity, ranking in the top 50% nationally
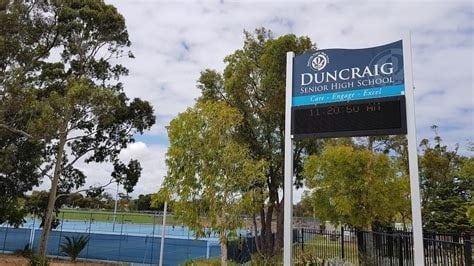
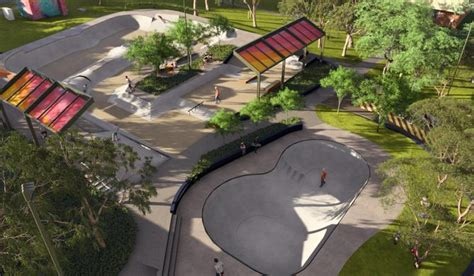
AreaSearch has identified eight projects that could impact the area, with key ones being Glengarry Shopping Centre Redevelopment, 57 Marri Road Aged and Dependent Persons Dwellings, Duncraig Senior High School Redevelopment, and Duncraig Adventure Hub. The following list details those most relevant.
Professional plan users can use the search below to filter and access additional projects.
INFRASTRUCTURE SEARCH
Frequently Asked Questions - Infrastructure
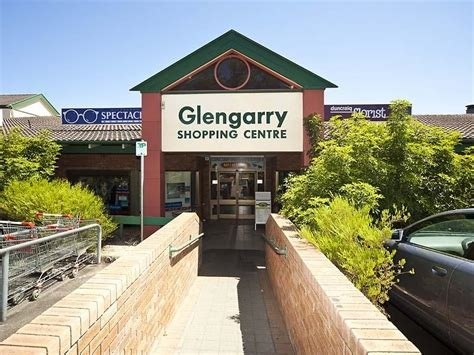
Glengarry Shopping Centre Redevelopment
Redevelopment of the existing nearly 50-year-old Glengarry Shopping Centre into a modern retail precinct featuring a new full-line Woolworths supermarket, specialty shops, cafes, restaurants, convenience stores, and offices, creating a vibrant village atmosphere.
Smart Freeway Mitchell Southbound
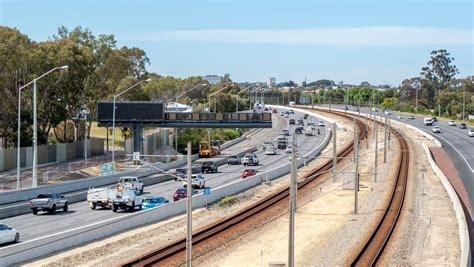
Smart freeway technology system completed December 2024, featuring over 1,400 pieces of smart technology including 16 upgraded on-ramps with coordinated signals, 23 overhead electronic gantries with variable speed and lane-use signs, road sensors, CCTV cameras, incident detection sensors, and digital message boards. Includes third lane added from Hodges Drive to Hepburn Avenue and Principal Shared Paths (PSP) improvements including connections to Warwick Train Station and Stephenson Avenue Extension. Serves 190,000+ daily motorists with expected time savings of up to 7 minutes during morning peak. Part of $209.6 million project jointly funded by Australian and Western Australian governments.
Stirling City Centre Infrastructure Package
Major infrastructure package including $165M Stephenson Avenue Extension, $90M Stirling Bus Interchange upgrade, $140M Smart Freeway (Mitchell Freeway), $21M Principal Shared Path extension, and Mitchell Freeway widening to support Perth's second CBD development.

Ocean Reef Road Grade Separation
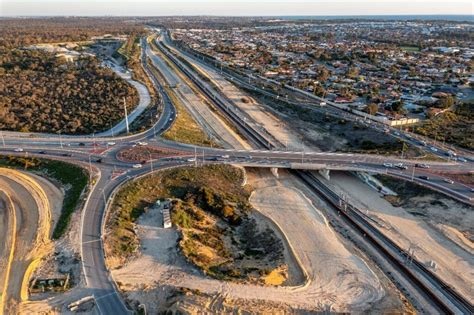
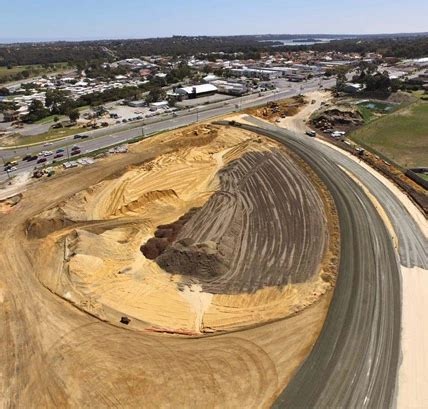
Grade separation project to eliminate traffic congestion at major intersection serving Ocean Reef Marina precinct. Features overpass construction, improved traffic flow, enhanced safety measures, and supporting infrastructure to accommodate growing traffic volumes in northern Perth coastal corridor and marina development.
Carine Senior High School Redevelopment
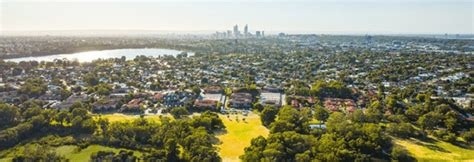
Redevelopment of Carine Senior High School delivering a new four storey building with a sports hall, four science laboratories, a prep room, two food technology classrooms, eighteen general learning classrooms, two IT laboratories and associated amenities. The upgrade was designed to support an additional 600 students and was completed by mid 2023.

City of Stirling Local Planning Scheme No. 4 (LPS4)
Draft Local Planning Scheme No. 4 to replace LPS3 across the City of Stirling. The scheme simplifies the planning framework, introduces specialised residential land uses (including aged care), and removes some apartment development restrictions in low-density areas to reduce complexity. Public consultation closed on 24 January 2025. The City has forwarded the draft, with submissions, to the Western Australian Planning Commission for consideration, prior to a final decision by the Minister for Planning. Last official project page update noted on 28 July 2025.
Chichester Park Community Sporting Facility
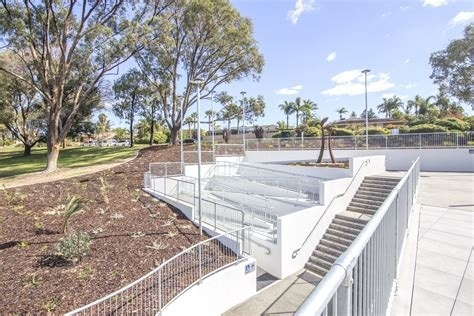
New community sporting facility development at Chichester Park to enhance local recreational opportunities and provide modern sporting amenities for the community.
57 Marri Road Aged and Dependent Persons Dwellings
Development of 14 two-bedroom, two-bathroom dwellings for aged and dependent persons on a vacant site in Duncraig, designed for universal access and meeting Special Disability Accommodation standards.
Employment
AreaSearch analysis of employment trends sees Duncraig performing better than 90% of local markets assessed across Australia
Duncraig has an educated workforce with professional services well represented. Its unemployment rate is 1.6%, with estimated employment growth of 4.1% in the past year.
As of June 2025, 9,483 residents are employed while the unemployment rate is 2.2 percentage points lower than Greater Perth's 3.9%. Workforce participation is similar to Greater Perth's 65.2%. The leading employment industries among residents are health care & social assistance, education & training, and professional & technical services, with the latter having employment levels at 1.5 times the regional average. Transport, postal & warehousing has limited presence, with 2.4% employment compared to 4.7% regionally.
Over the 12 months to June 2025, employment increased by 4.1% while labour force increased by 4.0%, with unemployment remaining essentially unchanged. In contrast, Greater Perth experienced employment growth of 3.7% and labour force growth of 3.8%, with a 0.1 percentage point rise in unemployment. State-level data to Sep-25 shows WA employment contracted by 0.82% (losing 14,590 jobs), with the state unemployment rate at 4.3%. National unemployment is 4.5%, with national employment growth of 0.26%. Jobs and Skills Australia's projections from May 2025 forecast national employment expansion by 6.6% over five years and 13.7% over ten years, but growth rates differ significantly between industry sectors. Applying these projections to Duncraig's employment mix suggests local growth of approximately 6.7%% over five years and 13.8% over ten years.
Frequently Asked Questions - Employment
Income
Income metrics indicate excellent economic conditions, with the area achieving higher performance than 75% of national locations assessed by AreaSearch
AreaSearch's latest postcode level ATO data released for financial year 2022 indicates Duncraig's median income among taxpayers is $61,044. The average income in the same period was $82,703. Both figures rank high compared to national averages. Greater Perth's median income was $58,380 and average income was $78,020 during this period. Based on Wage Price Index growth of 11.61% since financial year 2022, current estimates for Duncraig would be approximately $68,131 (median) and $92,305 (average) as of March 2025. According to 2021 Census figures, household incomes in Duncraig rank between the 74th and 88th percentiles nationally. The predominant income cohort spans 27.3% of locals (4,725 people), earning $1,500 - 2,999 annually. This aligns with the surrounding region where this cohort represents 32.0%. Duncraig's economic strength is evident through 40.0% of households achieving high weekly earnings exceeding $3,000. After housing costs, residents retain 88.0% of income, reflecting strong purchasing power. The area's SEIFA income ranking places it in the 9th decile.
Frequently Asked Questions - Income
Housing
Duncraig is characterized by a predominantly suburban housing profile, with above-average rates of outright home ownership
Dwelling structure in Duncraig, as evaluated at the latest Census held on 29 August 2016, comprised 91.9% houses and 8.1% other dwellings. In comparison, Perth metropolitan area had 88.7% houses and 11.3% other dwellings. Home ownership in Duncraig was at 42.2%, with mortgaged dwellings at 45.5% and rented ones at 12.3%. The median monthly mortgage repayment in the area, as of the latest figures available, was $2,208. The median weekly rent figure stood at $460. Nationally, Duncraig's mortgage repayments were higher than the Australian average of $1,863, while rents were substantially above the national figure of $375.
Frequently Asked Questions - Housing
Household Composition
Duncraig features high concentrations of family households, with a higher-than-average median household size
Family households account for 81.8 percent of all households, including 43.4 percent couples with children, 28.4 percent couples without children, and 9.3 percent single parent families. Non-family households constitute the remaining 18.2 percent, with lone person households at 16.6 percent and group households comprising 1.7 percent of the total. The median household size is 2.8 people, larger than the Greater Perth average of 2.7.
Frequently Asked Questions - Households
Local Schools & Education
Duncraig shows strong educational performance, ranking in the upper quartile nationally when assessed across multiple qualification and achievement indicators
The area's university qualification rate is 37.7% among residents aged 15+, surpassing the Western Australia average of 27.9% and the SA4 region average of 29.0%. Bachelor degrees are most common at 25.4%, followed by postgraduate qualifications (7.9%) and graduate diplomas (4.4%). Vocational credentials are held by 31.8% of residents aged 15+, with advanced diplomas at 12.3% and certificates at 19.5%.
Educational participation is high, with 30.4% of residents currently enrolled in formal education: 11.3% in primary, 10.2% in secondary, and 4.5% in tertiary education. Duncraig has a robust network of seven schools educating approximately 5,961 students, with an above-average socio-educational condition index (ICSEA: 1096). The educational mix includes four primary, two secondary, and one K-12 school. As an education hub, Duncraig offers 34.4 school places per 100 residents, significantly higher than the regional average of 19.7, attracting students from surrounding communities.
Frequently Asked Questions - Education
Schools Detail
Nearby Services & Amenities
Transport
Transport servicing is moderate compared to other areas nationally based on assessment of service frequency, route connectivity and accessibility
Public transport analysis indicates 94 active transport stops in Duncraig, comprising a mix of buses. These stops are serviced by 6 individual routes, collectively providing 1,385 weekly passenger trips. Transport accessibility is rated good, with residents typically located 202 meters from the nearest stop.
Service frequency averages 197 trips per day across all routes, equating to approximately 14 weekly trips per individual stop.
Frequently Asked Questions - Transport
Transport Stops Detail
Health
The level of general health in Duncraig is notably higher than the national average with both young and old age cohorts seeing low prevalence of common health conditions
Duncraig shows above-average health outcomes with both young and elderly cohorts having low prevalence of common conditions. The rate of private health cover is exceptionally high at approximately 61% of its total population (10,611 people), compared to the national average of 55.3%.
The most prevalent medical conditions are arthritis and asthma, affecting 7.4% and 7.0% of residents respectively. 72.0% of residents declare themselves completely clear of ailments, slightly higher than Greater Perth's 71.5%. Duncraig has a higher proportion of seniors aged 65 and over at 21.8% (3,770 people) compared to Greater Perth's 20.1%. Health outcomes among seniors are particularly strong, outperforming the general population in health metrics.
Frequently Asked Questions - Health
Cultural Diversity
Duncraig was found to be more culturally diverse than the vast majority of local markets in Australia, upon assessment of a range of language and cultural background related metrics
Duncraig has a higher cultural diversity compared to most local markets, with 11.1% of its population speaking languages other than English at home and 33.7% born overseas. Christianity is the predominant religion in Duncraig, comprising 48.4% of its people. Judaism, however, is overrepresented, making up 0.1% compared to Greater Perth's 0.1%.
The top three ancestry groups are English (31.6%), Australian (23.4%), and Irish (8.4%). Notably, South African, Welsh, and Dutch ethnicities have similar representations in Duncraig as they do regionally: 1.8%, 1.1%, and 1.8% respectively.
Frequently Asked Questions - Diversity
Age
Duncraig hosts an older demographic, ranking in the top quartile nationwide
The median age in Duncraig is 42 years, significantly higher than Greater Perth's average of 37 years, and also older than Australia's median age of 38 years. The 75-84 age group constitutes 8.5% of the population in Duncraig, a stronger representation compared to Greater Perth, while the 25-34 cohort makes up 6.3%. According to data from the post-2021 Census, the 15 to 24 age group has increased from 10.7% to 13.1%, and the 75 to 84 cohort has risen from 6.2% to 8.5%. Conversely, the 65 to 74 age group has decreased from 12.2% to 10.9%, and the 55 to 64 group has dropped from 11.1% to 9.8%. Population forecasts for the year 2041 indicate substantial demographic changes in Duncraig, with the 85+ age group projected to grow by 202%, reaching 1,254 people from a previous figure of 415. Notably, the combined 65+ age groups will account for 67% of total population growth, reflecting the area's aging demographic profile. In contrast, the 0 to 4 and 5 to 14 age cohorts are expected to experience population declines.
