Chart Color Schemes
This analysis uses ABS Statistical Areas Level 2 (SA2) boundaries, which can materially differ from Suburbs and Localities (SAL) even when sharing similar names.
SA2 boundaries are defined by the Australian Bureau of Statistics and are designed to represent communities for statistical reporting (e.g., census and ERP).
Suburbs and Localities (SAL) represent commonly-used suburb/locality names (postal-style areas) and may use different geographic boundaries. For comprehensive analysis, consider reviewing both boundary types if available.
est. as @ -- *
ABS ERP | -- people | --
2021 Census | -- people
Sales Activity
Curious about local property values? Filter the chart to assess the volume and appreciation (including resales) trends and regional comparisons, or scroll to the map below view this information at an individual property level.
Find a Recent Sale
Sales Detail
Population
An assessment of population growth drivers in Padbury reveals an overall ranking slightly below national averages considering recent, and medium term trends
Padbury's population is approximately 9,526 as of November 2025. This figure represents an increase of 900 people, a 10.4% rise from the 2021 Census which reported a population of 8,626. The growth was inferred from the estimated resident population of 9,519 in June 2024 and an additional 31 validated new addresses since the Census date. This results in a population density ratio of 1,579 persons per square kilometer, higher than the average across national locations assessed by AreaSearch. Padbury's growth rate exceeded both its SA3 area (8.9%) and the national average, positioning it as a growth leader in the region. Natural growth contributed approximately 51.5% of overall population gains during recent periods.
AreaSearch is using ABS/Geoscience Australia projections for each SA2 area, released in 2024 with a base year of 2022. For areas not covered by this data and to estimate growth post-2032, AreaSearch uses the growth rates by age cohort provided by the ABS in its latest Greater Capital Region projections (released in 2023, based on 2022 data). According to demographic trends, an above median population growth is projected for the area, with an expected expansion of 1,382 persons to reach a total of 10,908 by 2041, reflecting a 14.4% increase over the 17-year period.
Frequently Asked Questions - Population
Development
Recent residential development output has been above average within Padbury when compared nationally
Padbury has recorded approximately 39 residential properties granted approval each year over the past five financial years, totalling 196 homes. As of FY26, 10 approvals have been recorded. On average, 4.4 people move to the area annually for each dwelling built between FY21 and FY25, indicating high demand exceeding new supply, which typically leads to price growth and increased buyer competition. The average construction cost value of new properties is $184,000, below the regional average, suggesting more affordable housing options for buyers.
This financial year has seen $1.2 million in commercial approvals, reflecting minimal commercial development activity. Compared to Greater Perth, Padbury shows moderately higher new home approvals, with 38.0% above the regional average per person over the five-year period, preserving buyer options while sustaining existing property demand. However, building activity has slowed in recent years.
New building activity consists of 95.0% detached houses and 5.0% townhouses or apartments, maintaining Padbury's traditional suburban character focused on family homes. The area currently has approximately 494 people per dwelling approval, reflecting an established location. Future projections estimate Padbury will add 1,375 residents by 2041, with building activity keeping pace with growth projections despite potential heightened competition as the population grows.
Frequently Asked Questions - Development
Infrastructure
Padbury has emerging levels of nearby infrastructure activity, ranking in the 37thth percentile nationally
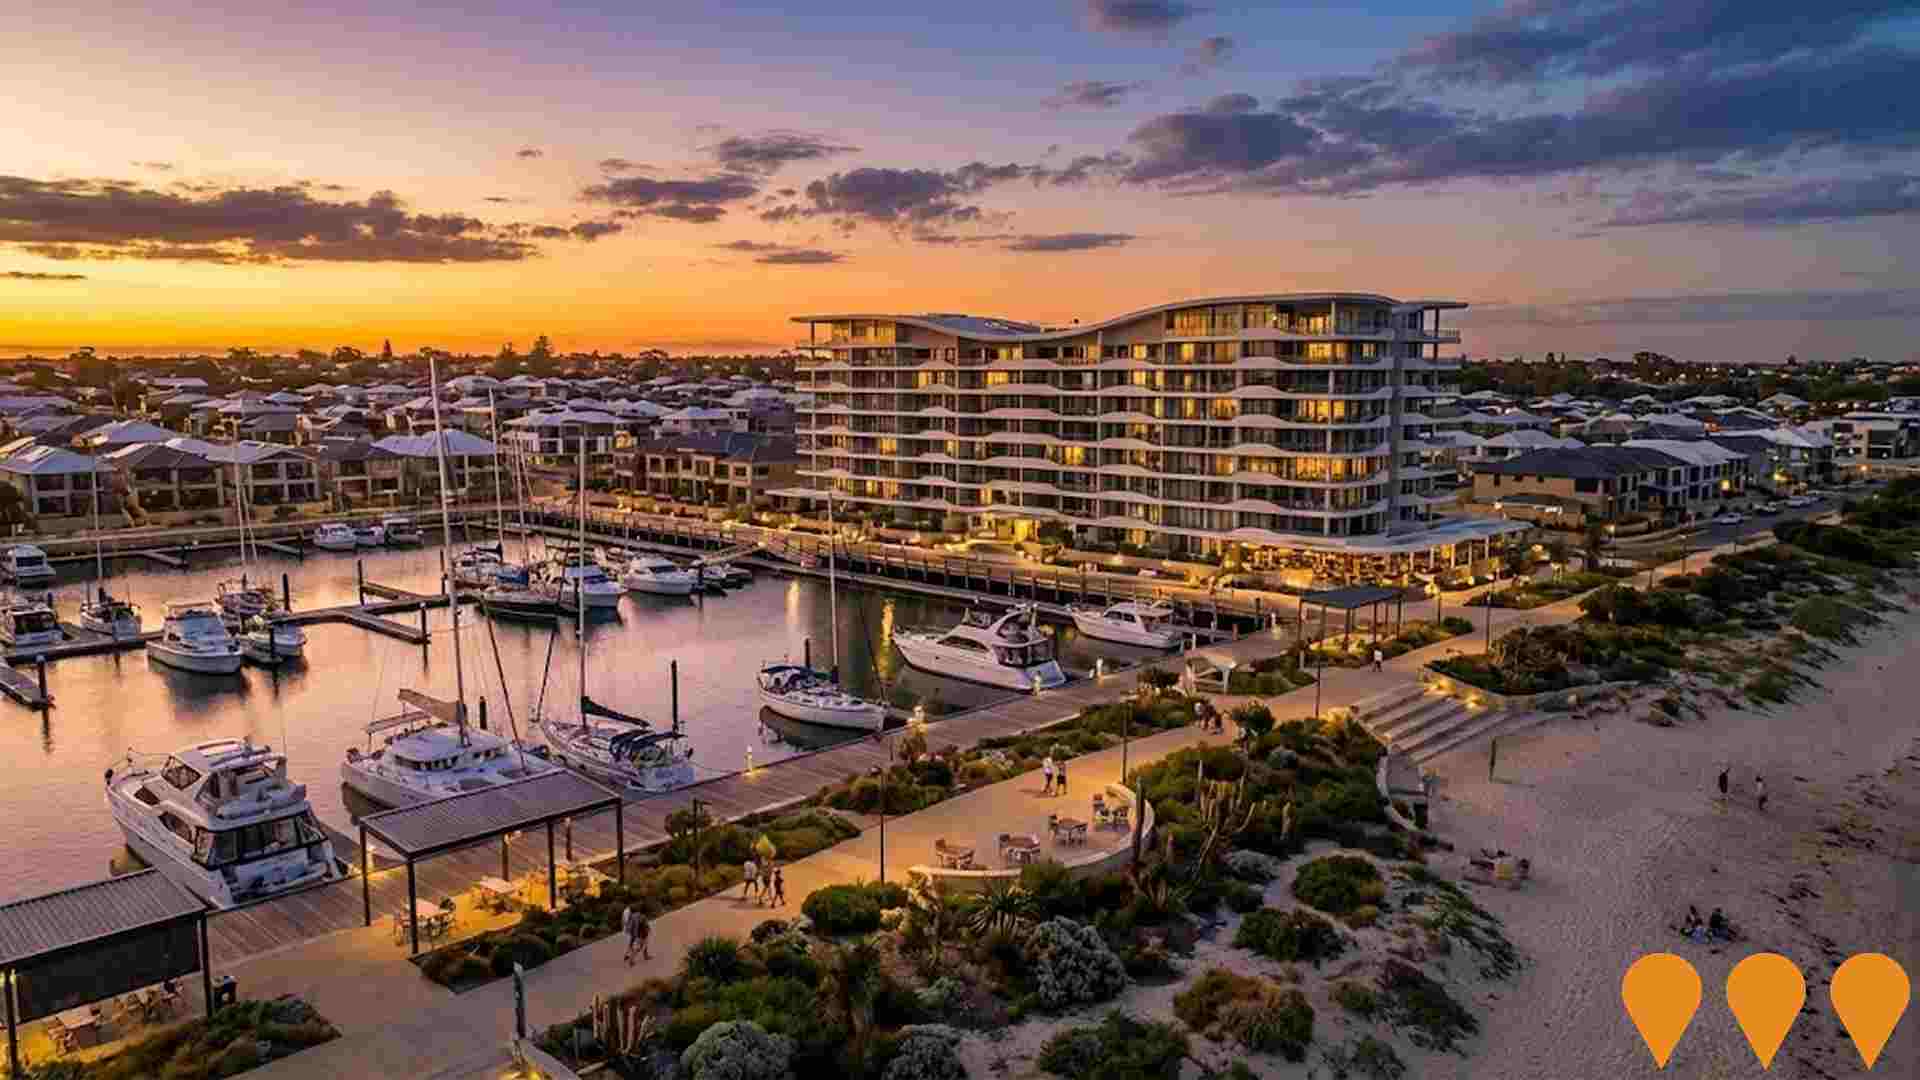
Nine projects identified by AreaSearch are expected to impact the area significantly. These include Regents Garden Padbury Residential Aged Care Facility, Harbour Rise Masterplanned Community in its final stages, Chichester Park Skate Facility, and Whitfords Activity Centre Precinct (West) Redevelopment. The following list details those projects likely to be most relevant.
Professional plan users can use the search below to filter and access additional projects.
INFRASTRUCTURE SEARCH
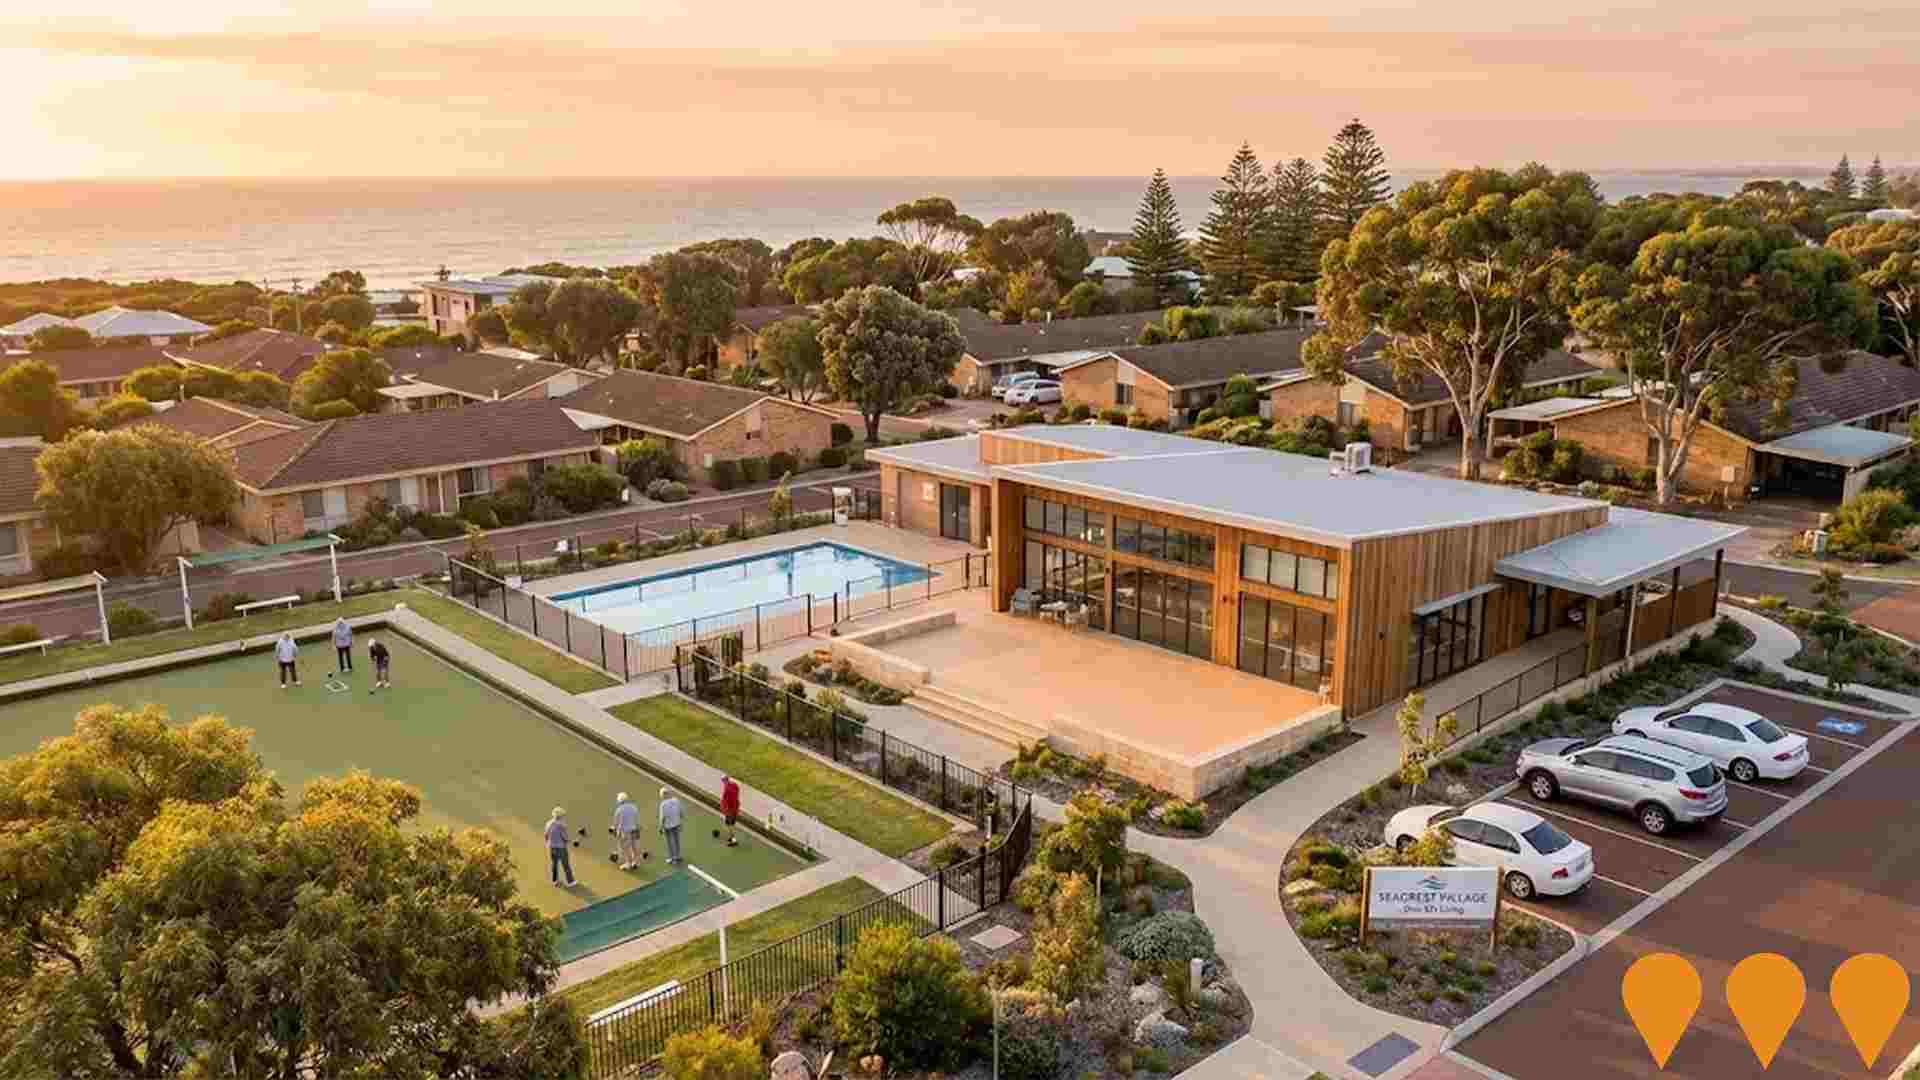
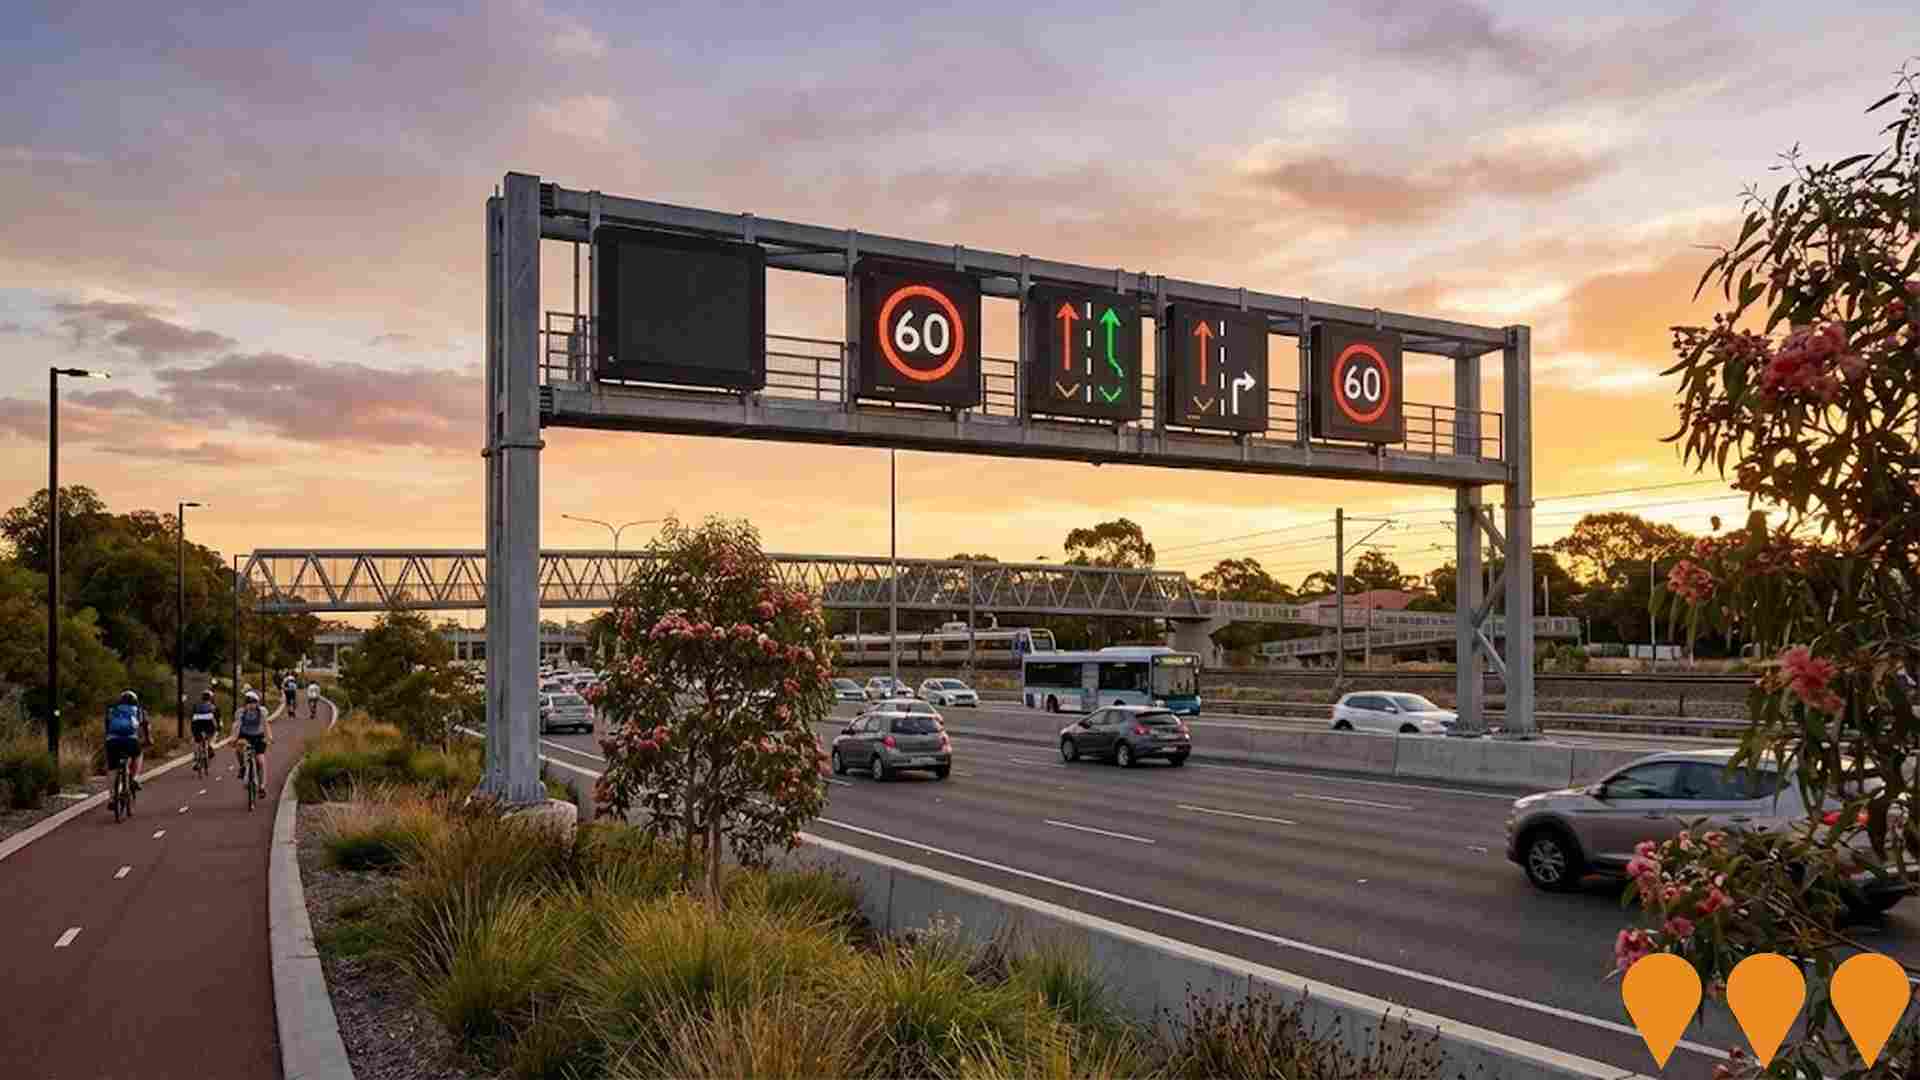
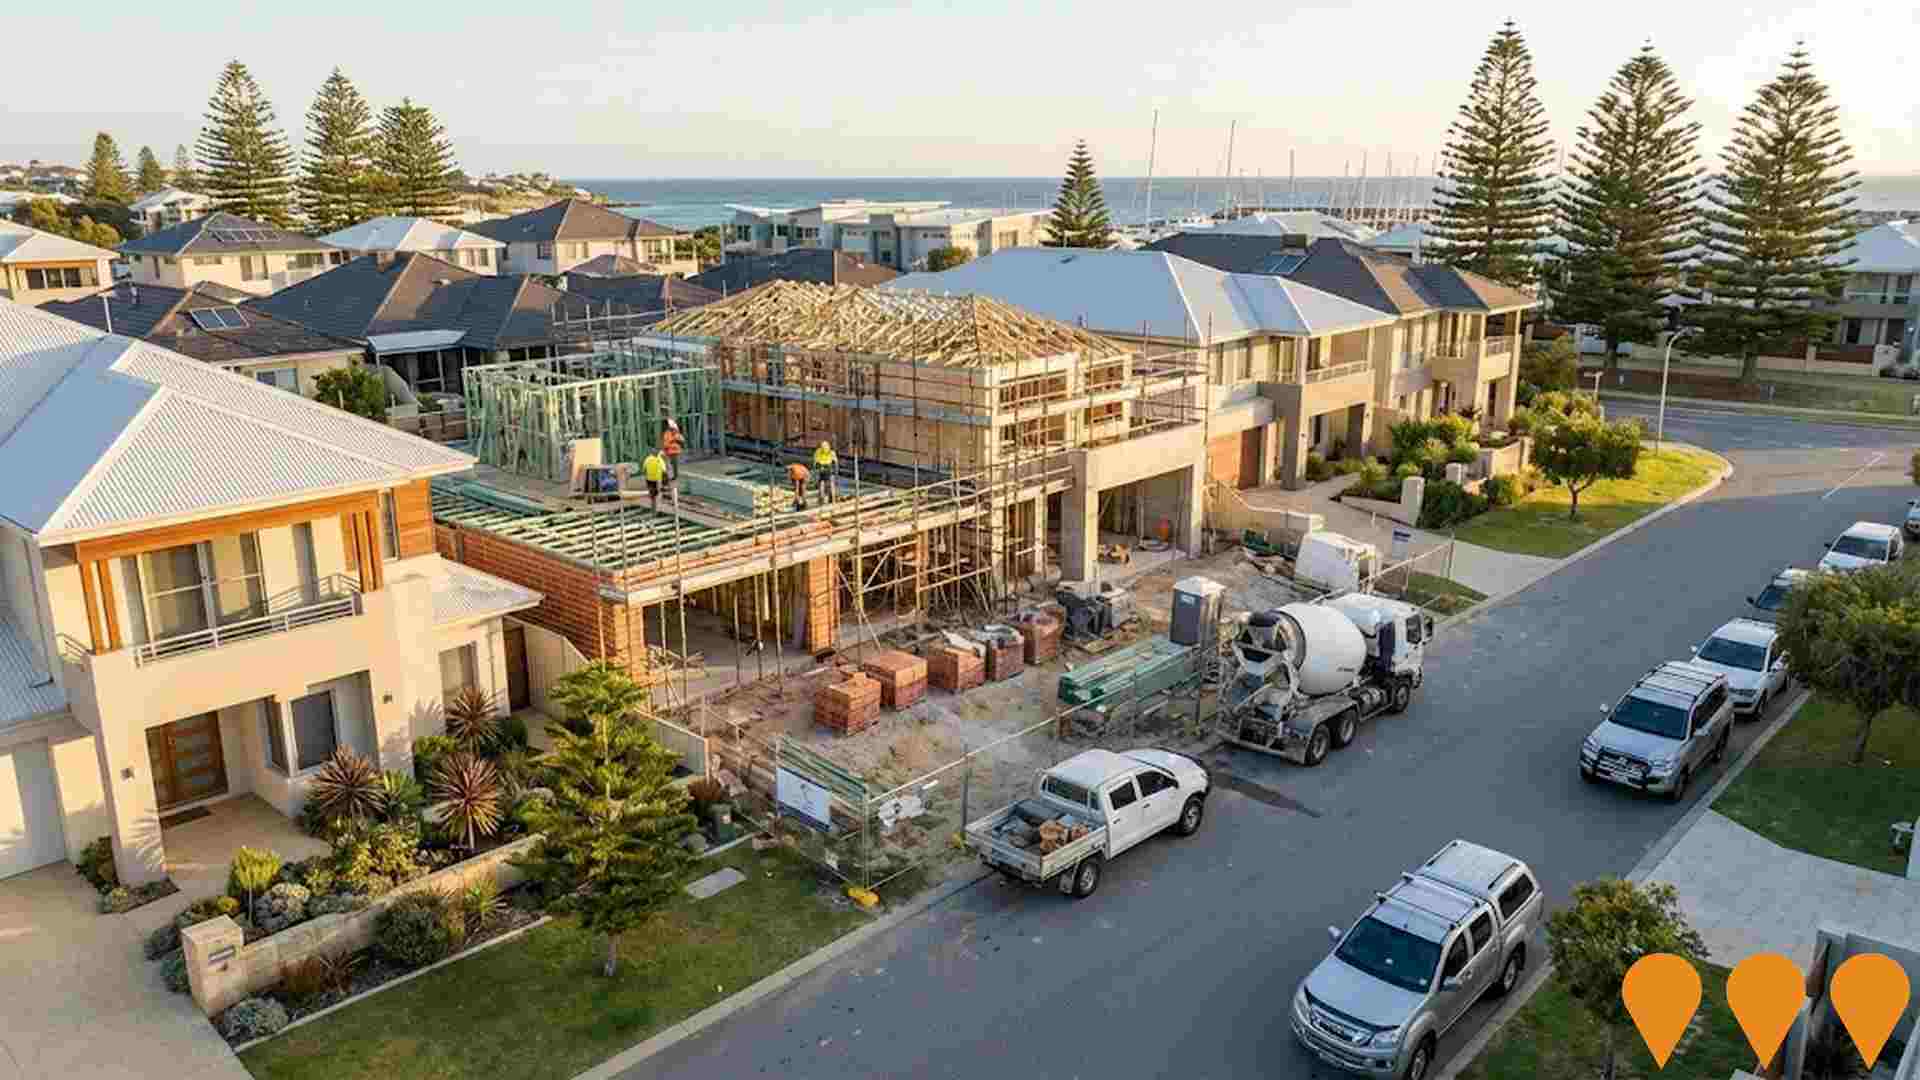
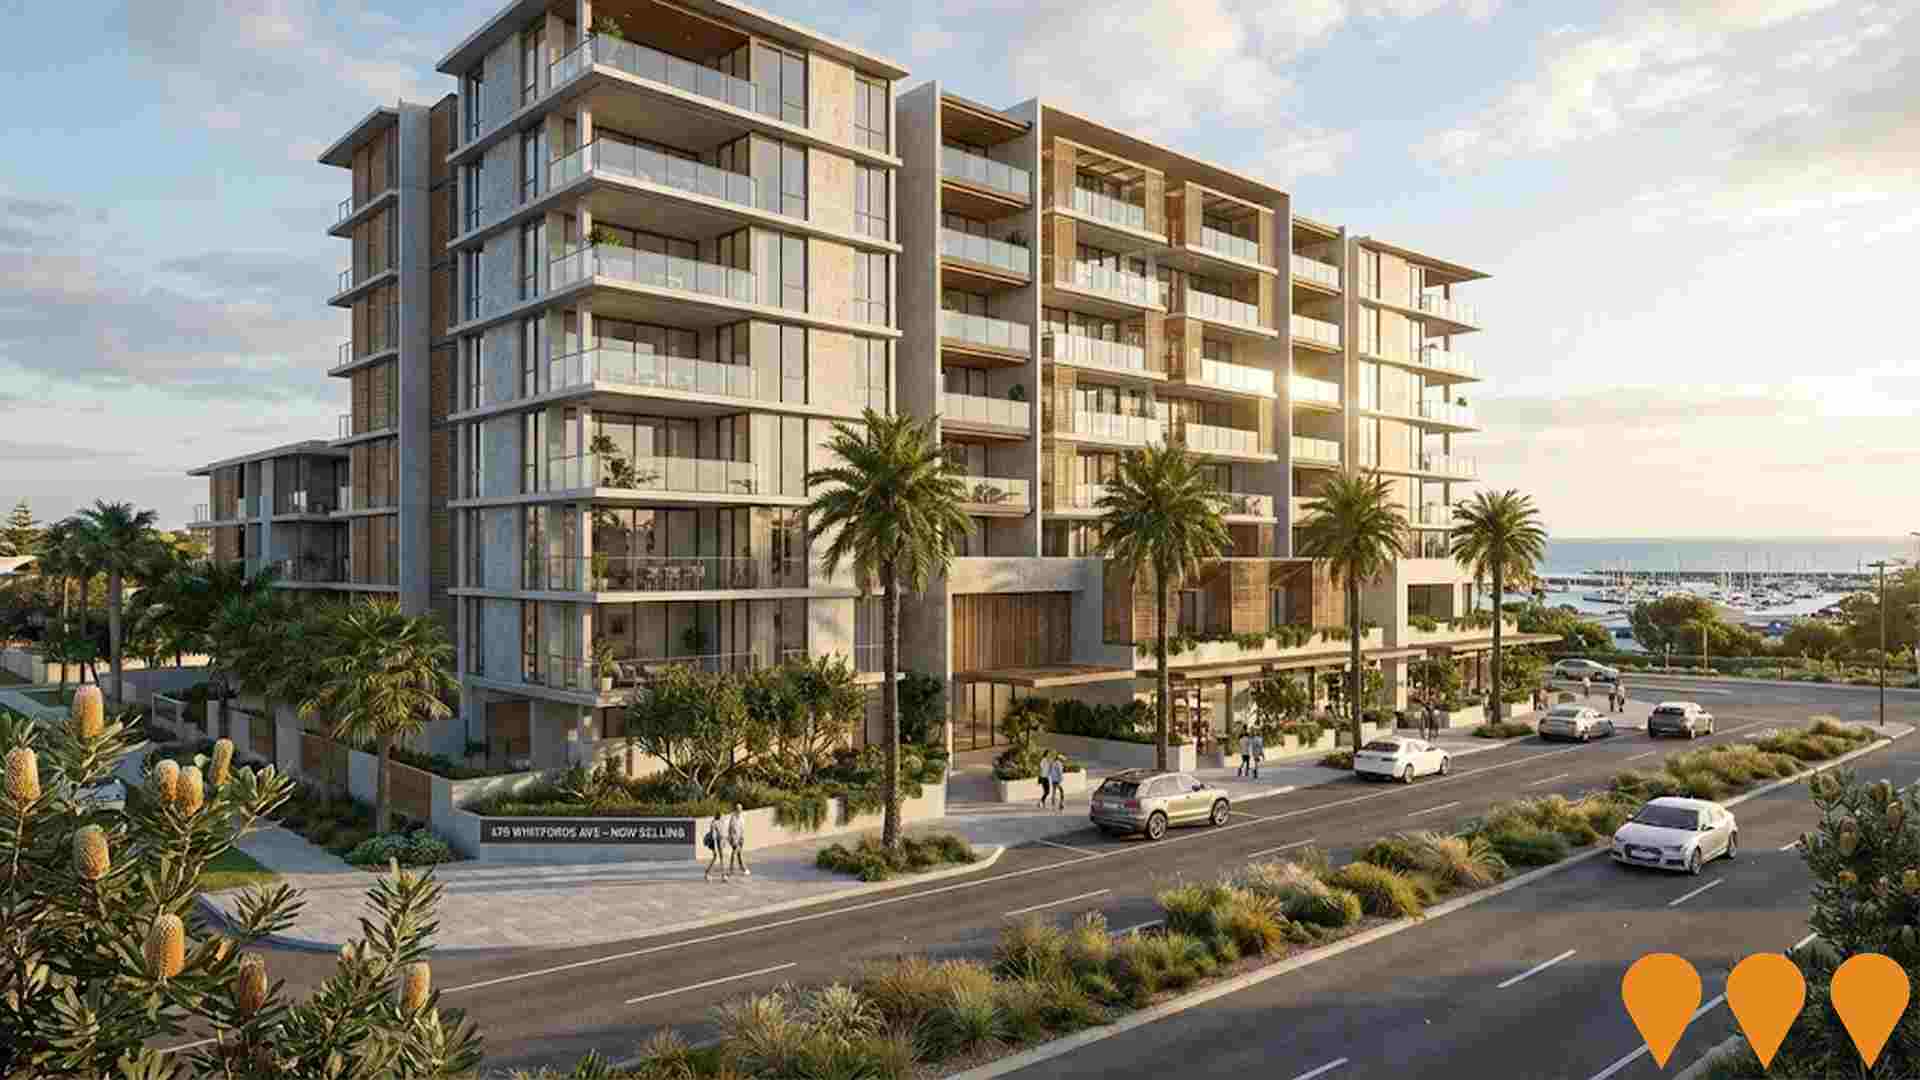
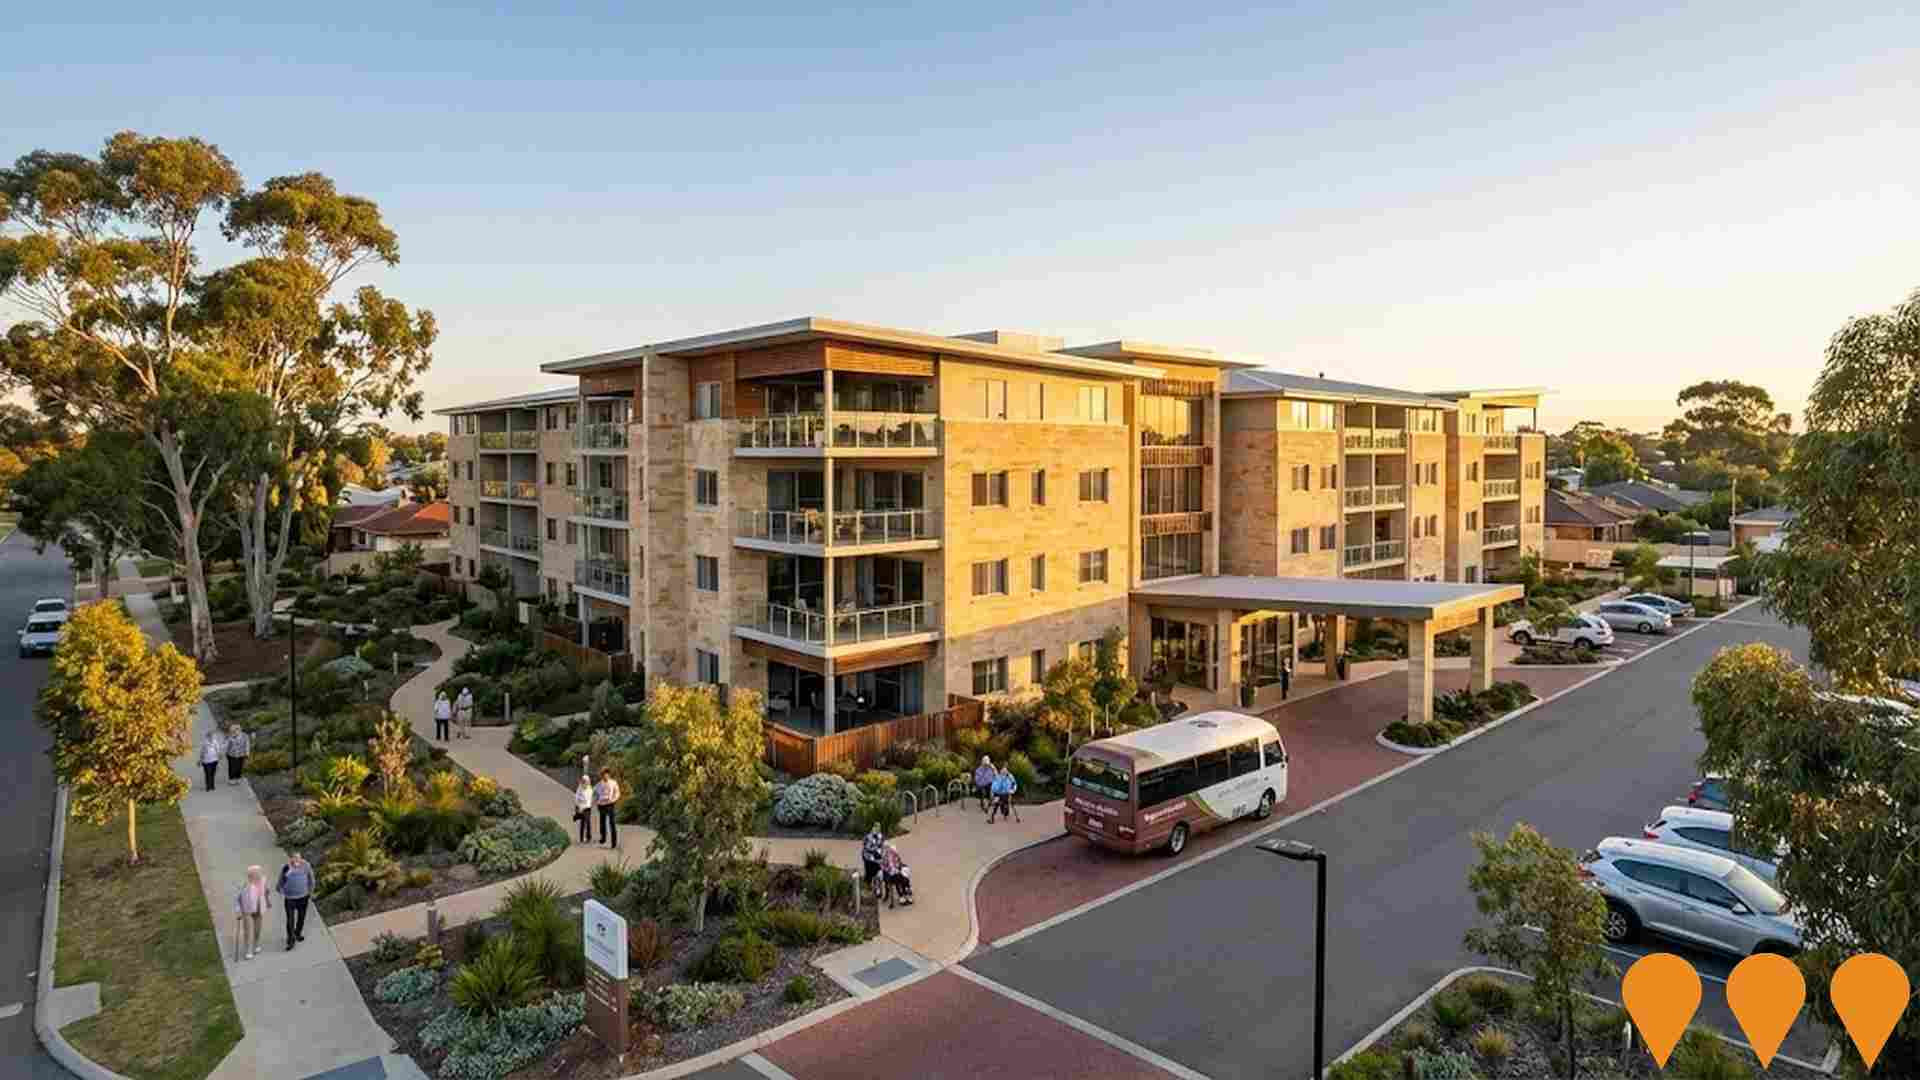
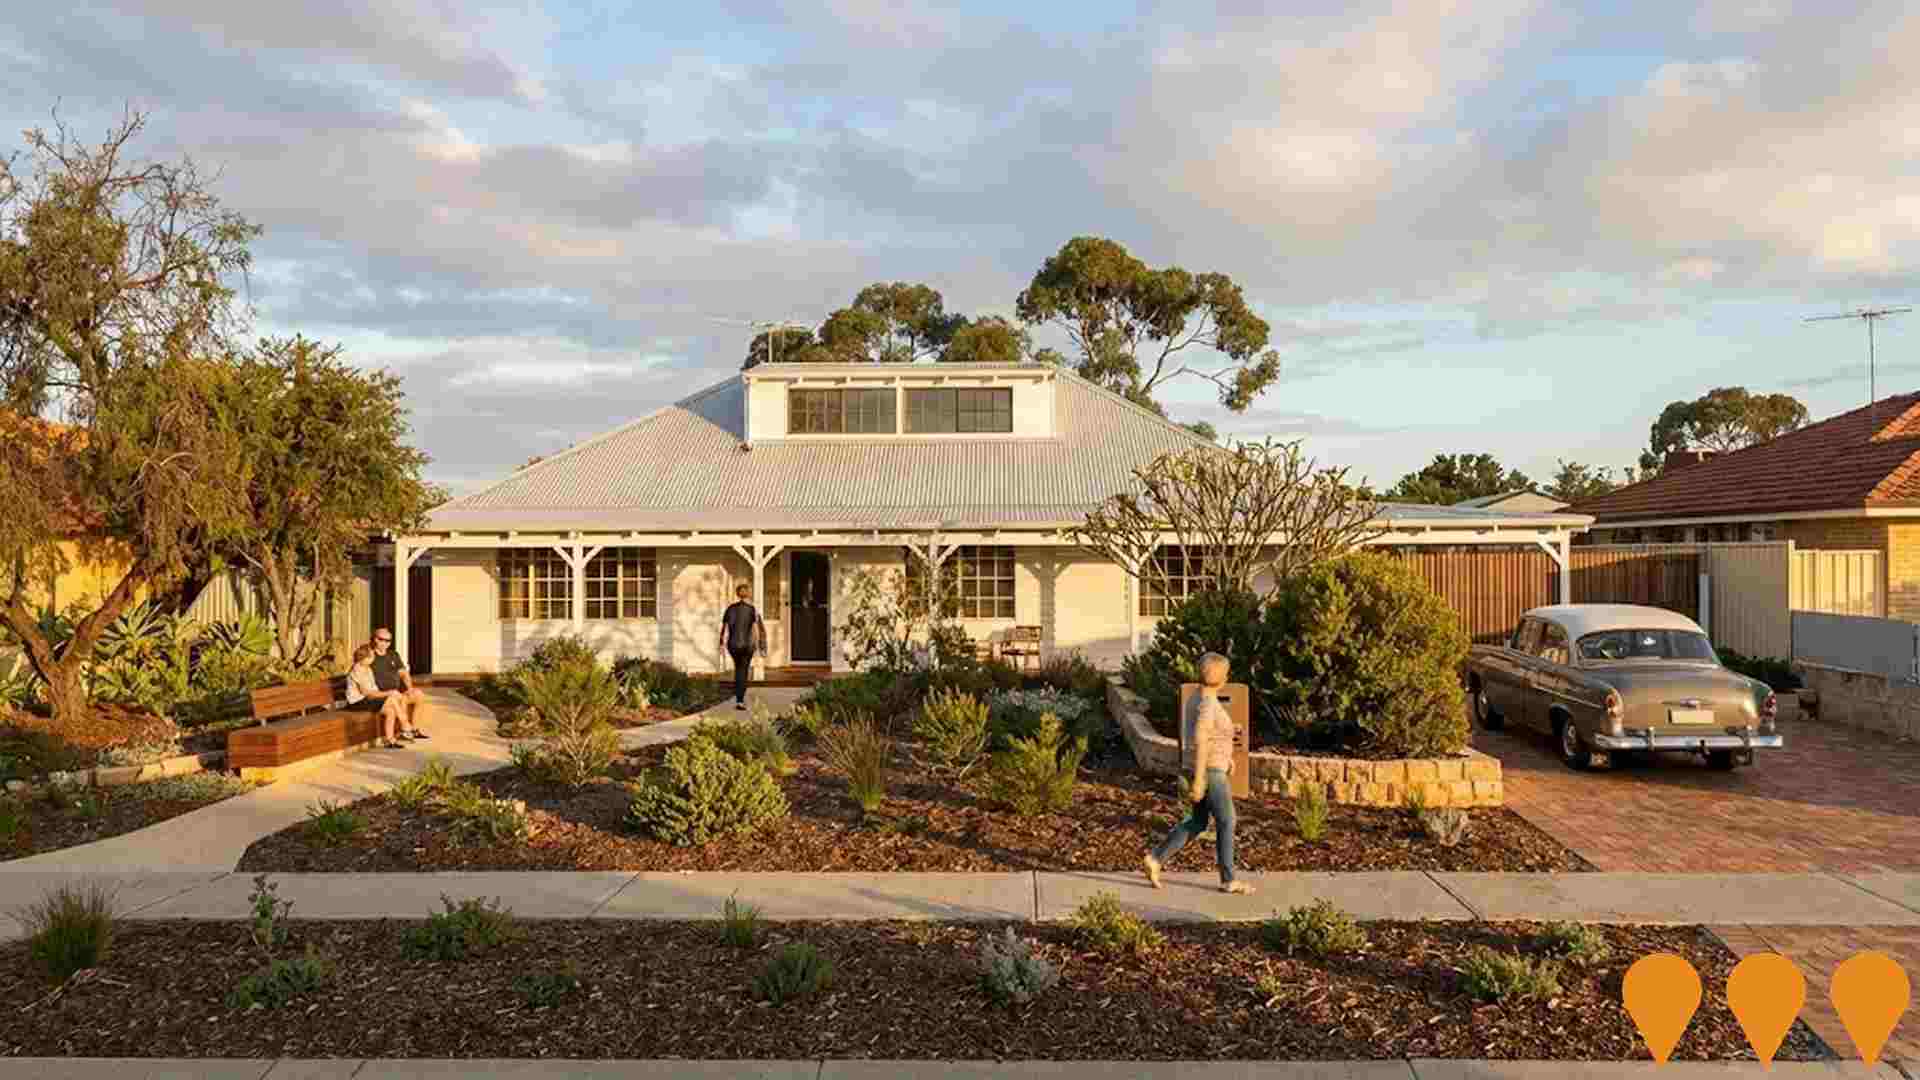
 Denotes AI-based impression for illustrative purposes only, not to be taken as definitive under any circumstances. Please follow links and conduct other investigations from the project's source for actual imagery. Developers and project owners wishing us to use original imagery please Contact Us and we will do so.
Frequently Asked Questions - Infrastructure
Regents Garden Padbury Residential Aged Care Facility
A four-storey, 108-bed residential aged care facility developed by Regents Garden Group on a 5,195 square metre lot in Padbury. The facility will provide high-quality aged care services including 24/7 nursing care, respite care, palliative care, and dementia care. Part of Regents Garden's expansion of premium aged care facilities across Perth, featuring elegant design and comprehensive resident amenities.
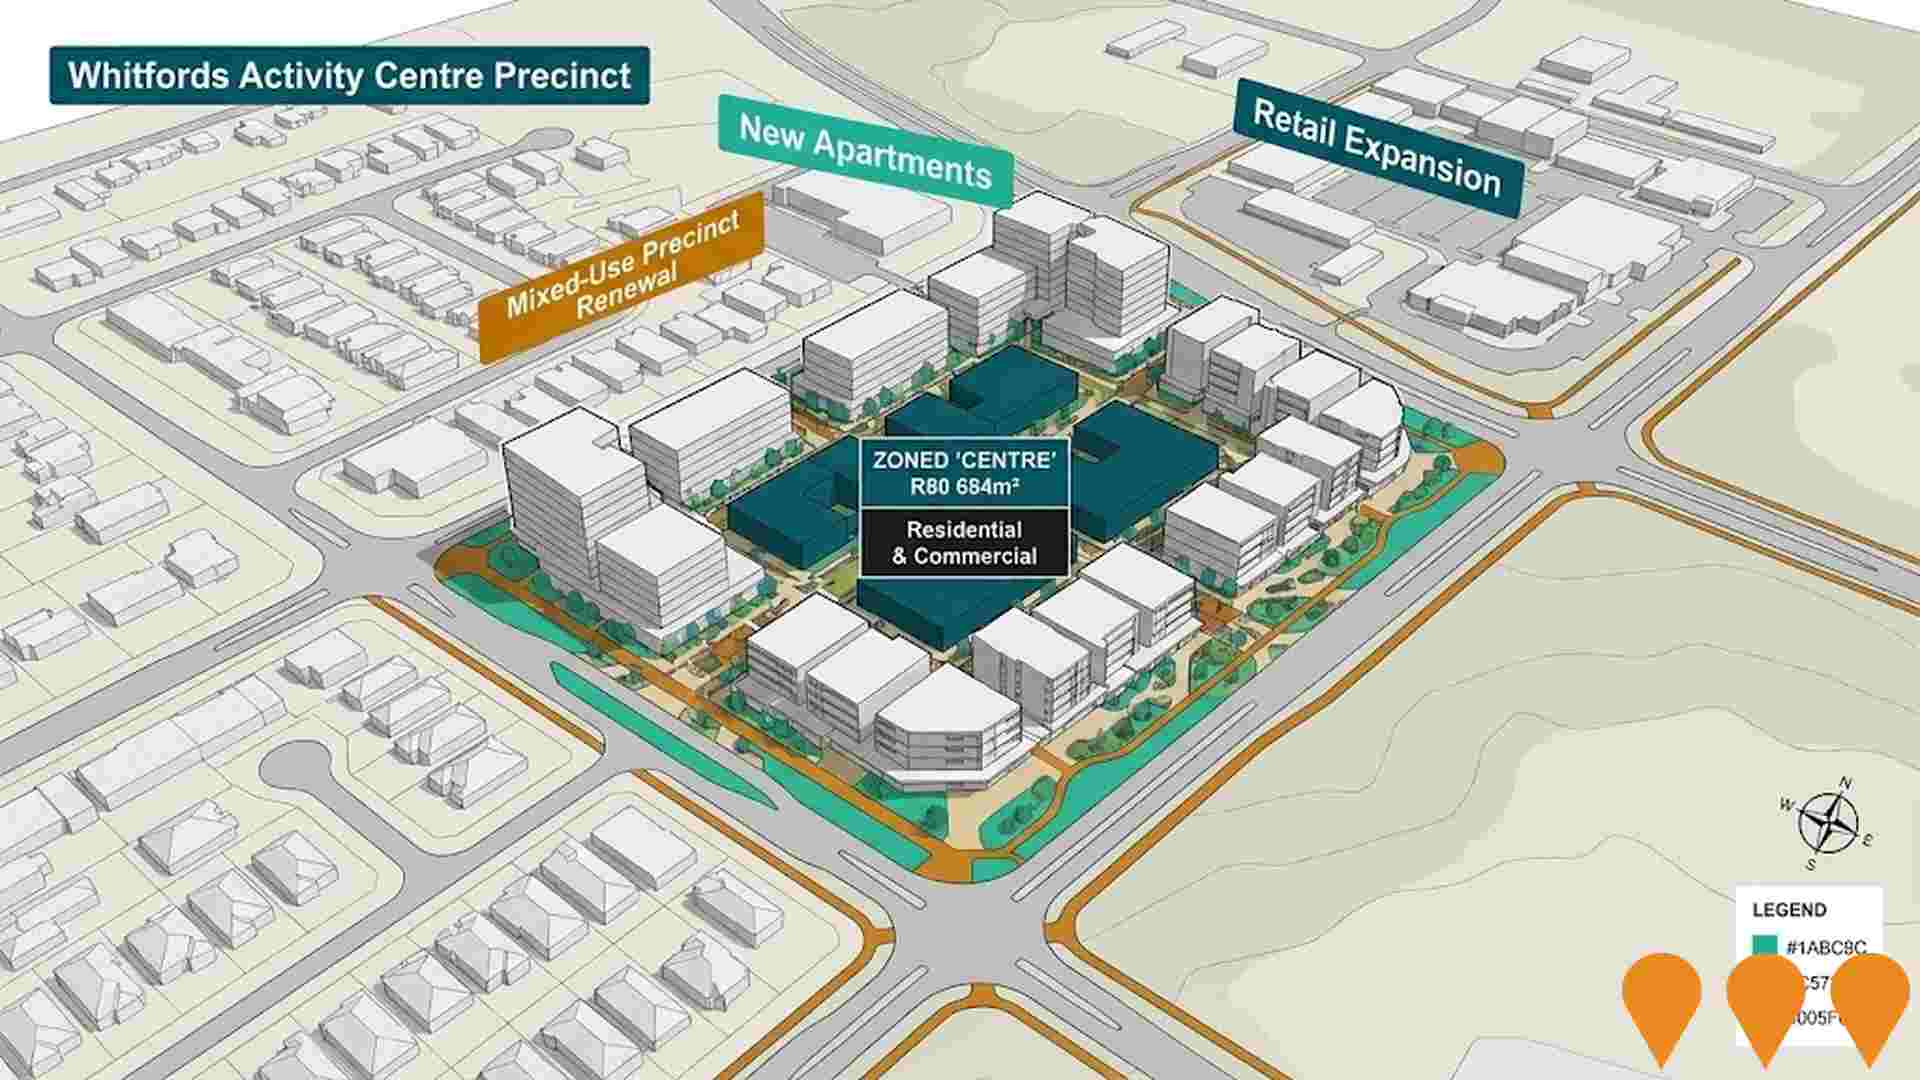
Whitfords Activity Centre Precinct (West) Redevelopment
Significant mixed-use precinct renewal immediately adjacent to Craigie including new residential apartments, retail expansion, and civic spaces as part of the City of Joondalup's long-term activity centre strategy.
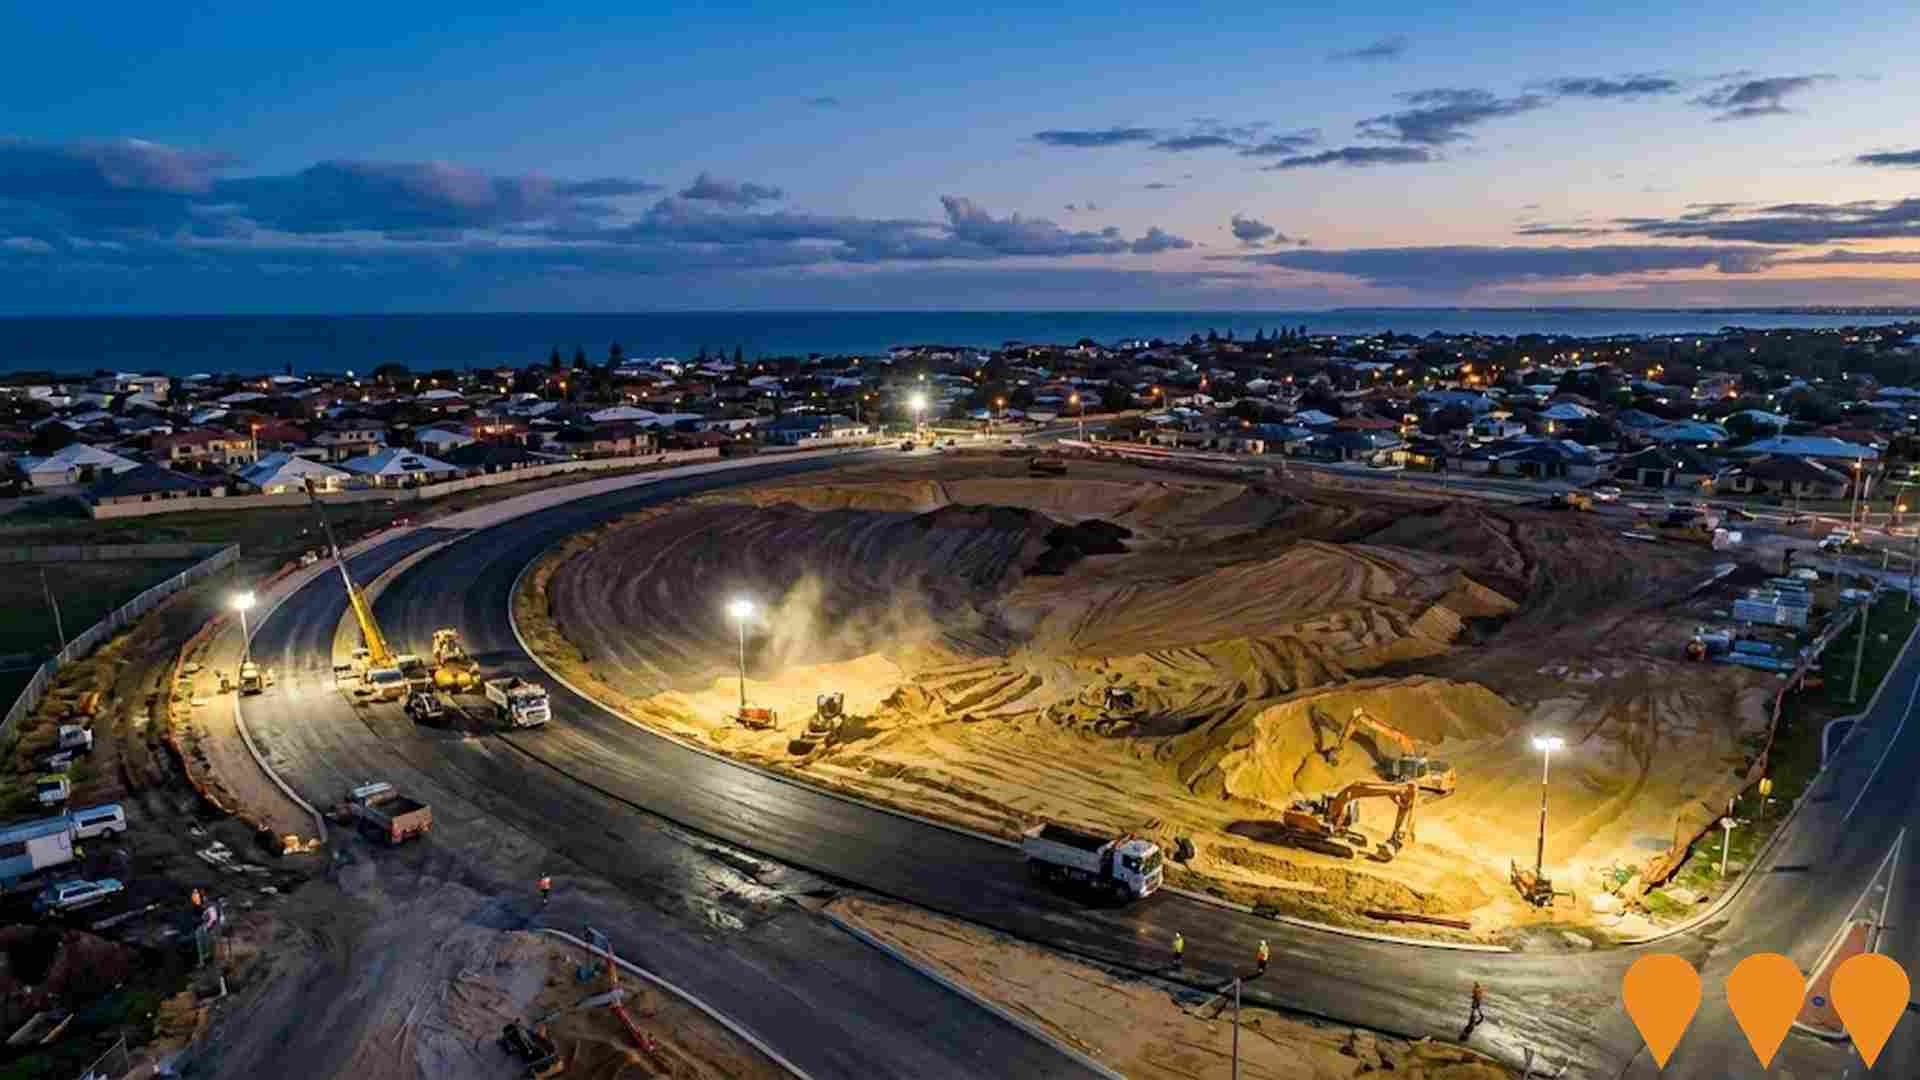
Ocean Reef Road Grade Separation
Grade separation project to eliminate traffic congestion at major intersection serving Ocean Reef Marina precinct. Features overpass construction, improved traffic flow, enhanced safety measures, and supporting infrastructure to accommodate growing traffic volumes in northern Perth coastal corridor and marina development.
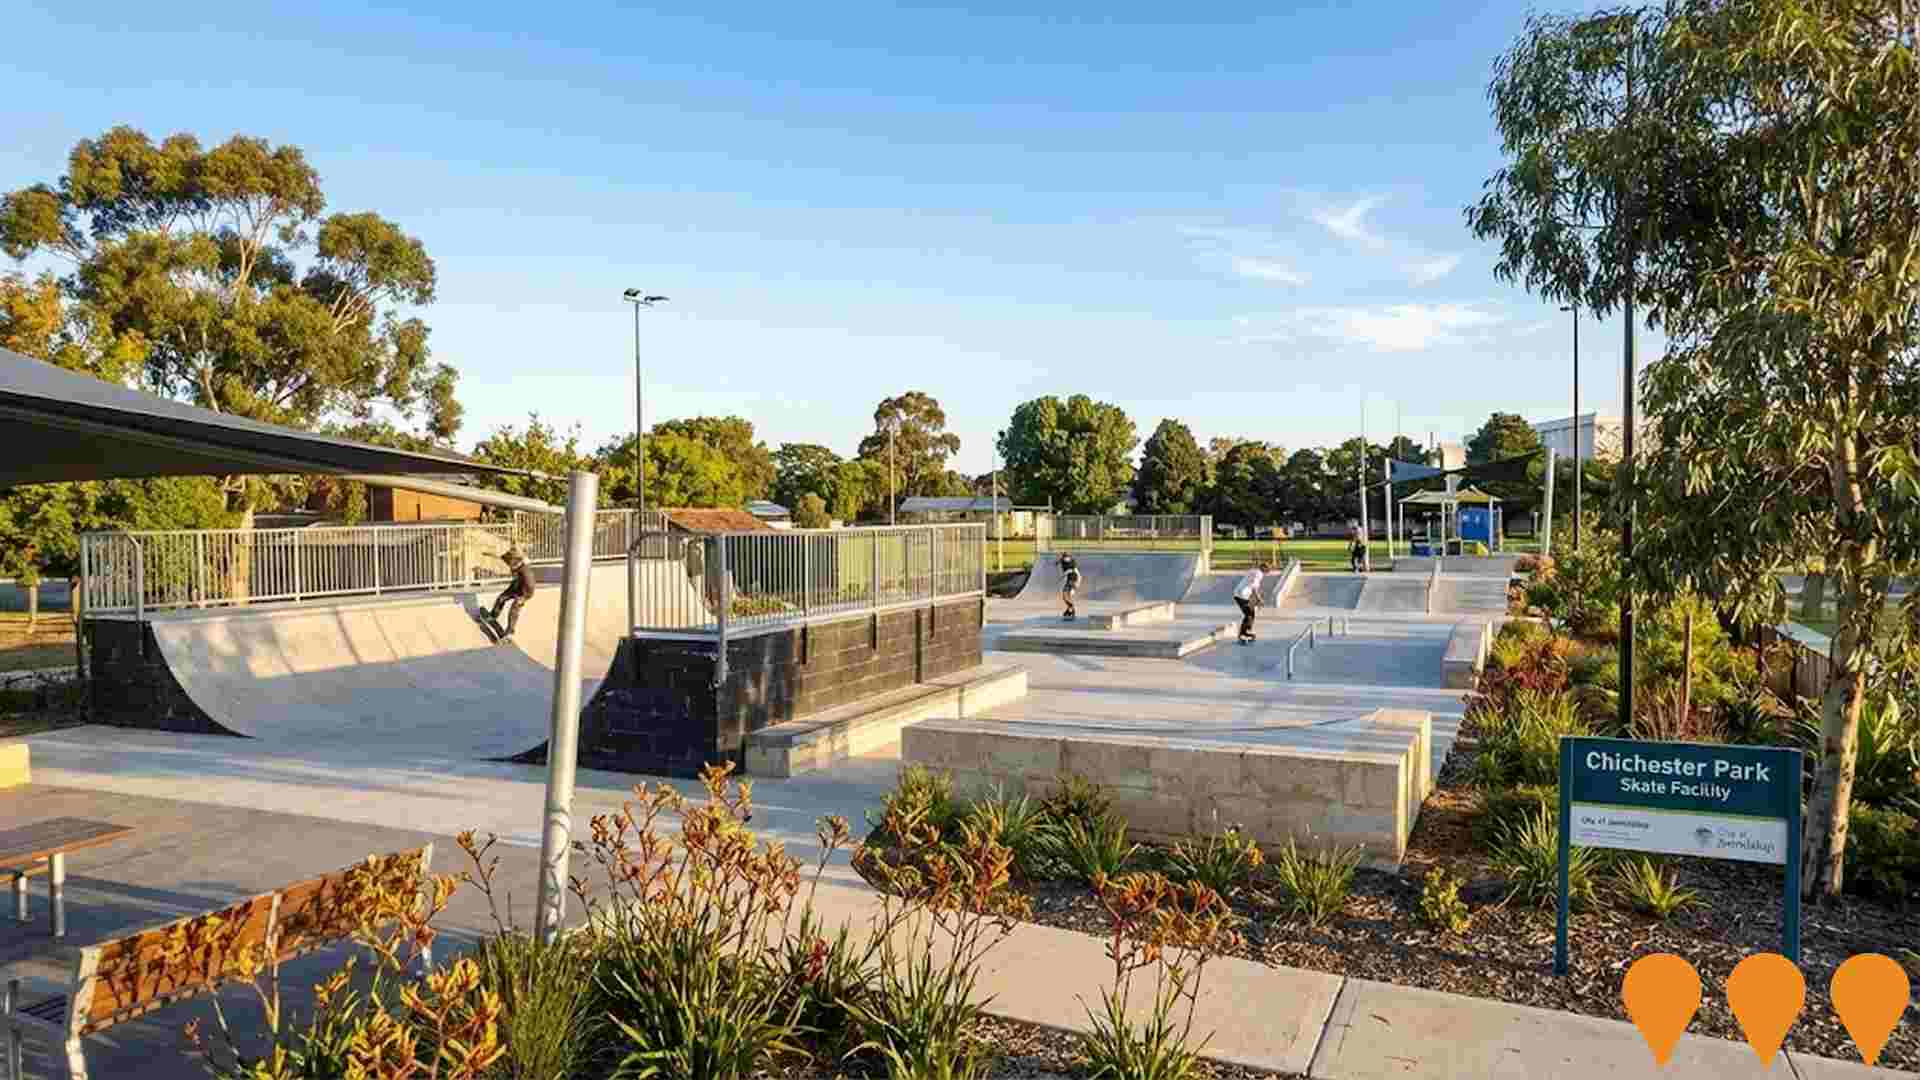
Chichester Park Skate Facility
Design and construction of an incidental-scale skate facility at Chichester Park to provide recreational opportunities for youth and the community. The project is an outcome of an investigation into a more suitable site after the proposed Woodvale Trotting Track location was deemed unfeasible. Tenders for design and construction closed in August 2025. The project has received an estimated $450,000 from the City of Joondalup's 2025/26 budget for skate and play facilities.
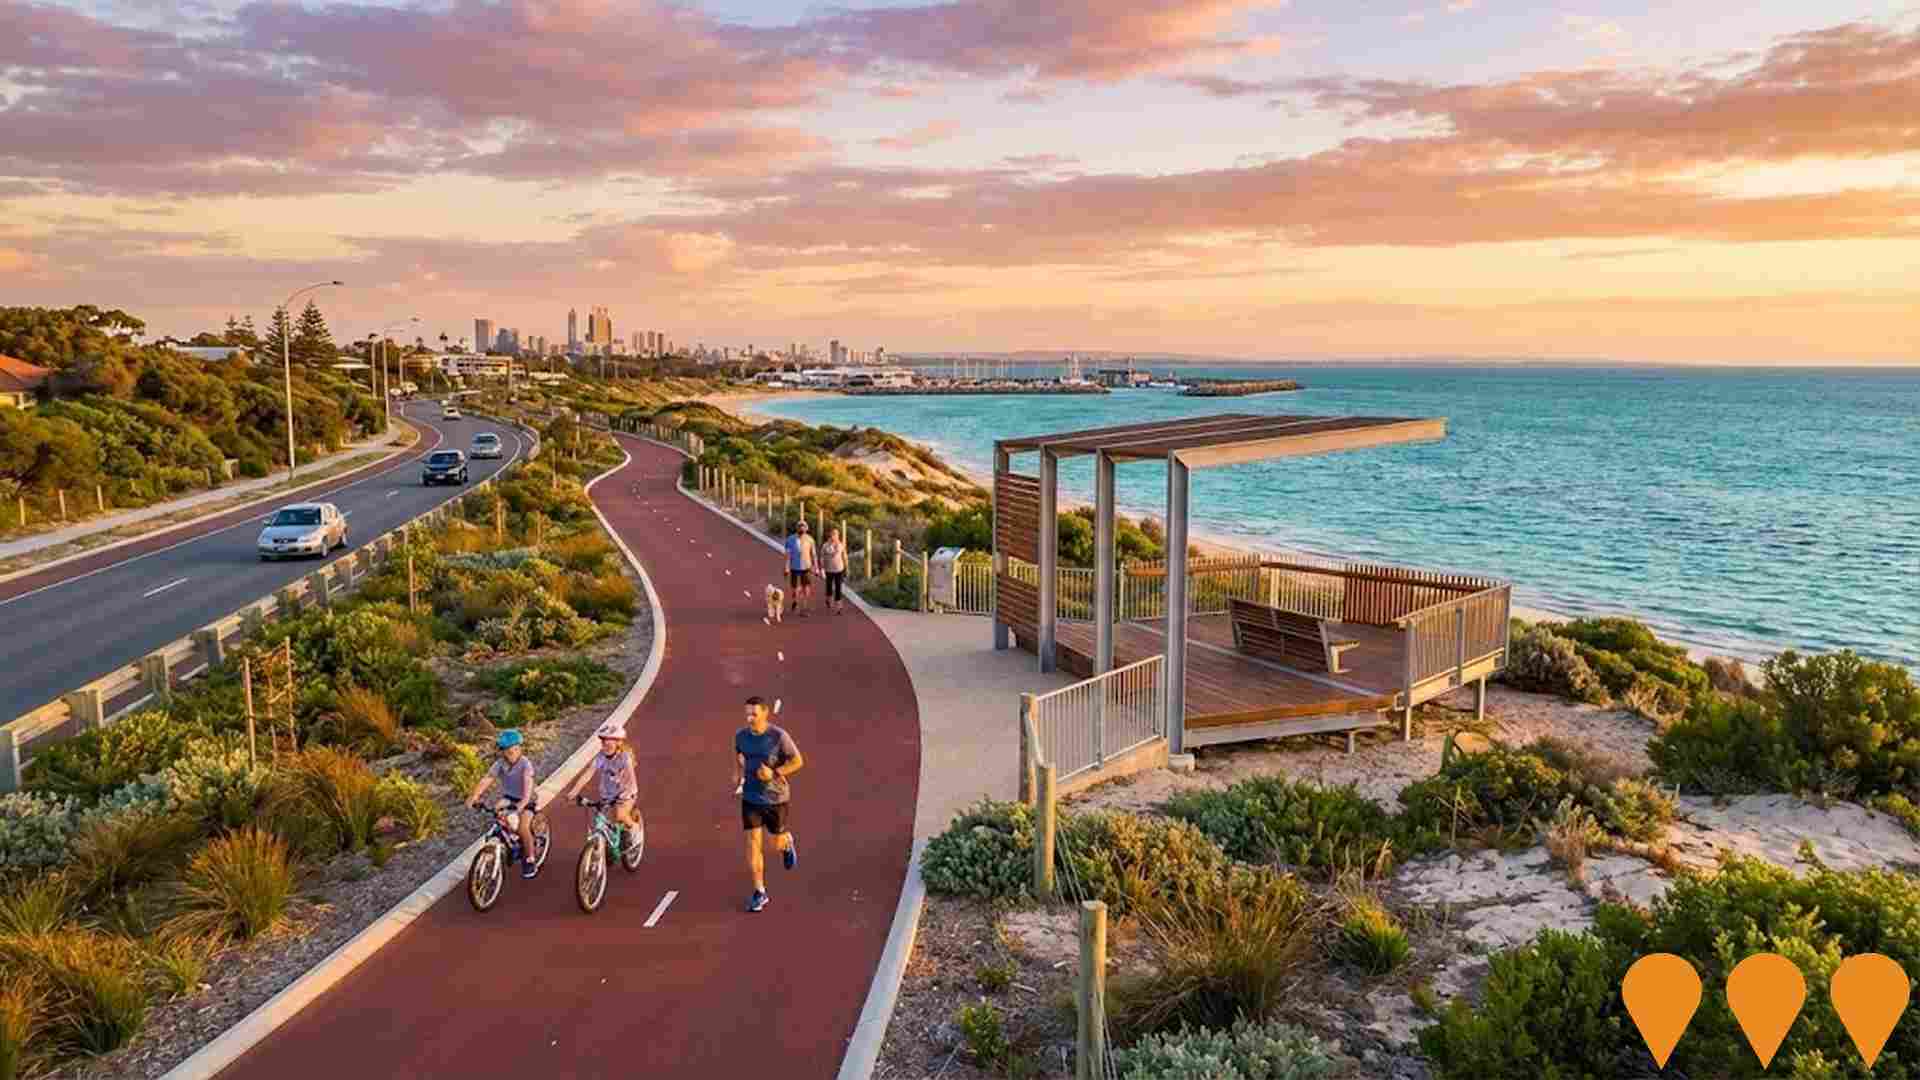
Hillarys Cycle Network Expansion
The Hillarys Cycle Network Expansion project delivers over 10 kilometers of shared paths in three sections to improve coastal connections for walking, wheeling, and riding in Perth's north-west. Section 1 (Hepburn Avenue, 2.6 km) was completed in early 2024, connecting Whitfords Avenue to Gibson Avenue. Section 2 (Coastal Section South, 5 km) commenced construction in late 2024, linking Hillarys Boat Harbour to North Mullaloo. Section 3 (Coastal Section North, 2.6 km) is scheduled for completion in mid-2026, connecting Ocean Reef Marina to Burns Beach. The project improves access to schools, beaches, marinas, and parklands with wider 4-meter red asphalt paths, enhanced bike parking, wayfinding signage, and safety improvements at road intersections.
Duffy House Activation Project
Restoration and commercial activation of the historic, State Heritage-listed Duffy House (built 1911-1913) and surrounding site in Woodvale. The project involves land transfer from the State Government to the City of Joondalup, which includes further restoration and a commercial activation through an Expression of Interest (EOI). The EOI closed in October 2024, with the aim to select an operator to enhance visitor engagement while honoring its cultural and historical significance. Proposed uses include a cafe/restaurant/wine bar, art gallery/studio, or museum/heritage display, along with wider site improvements for community use.
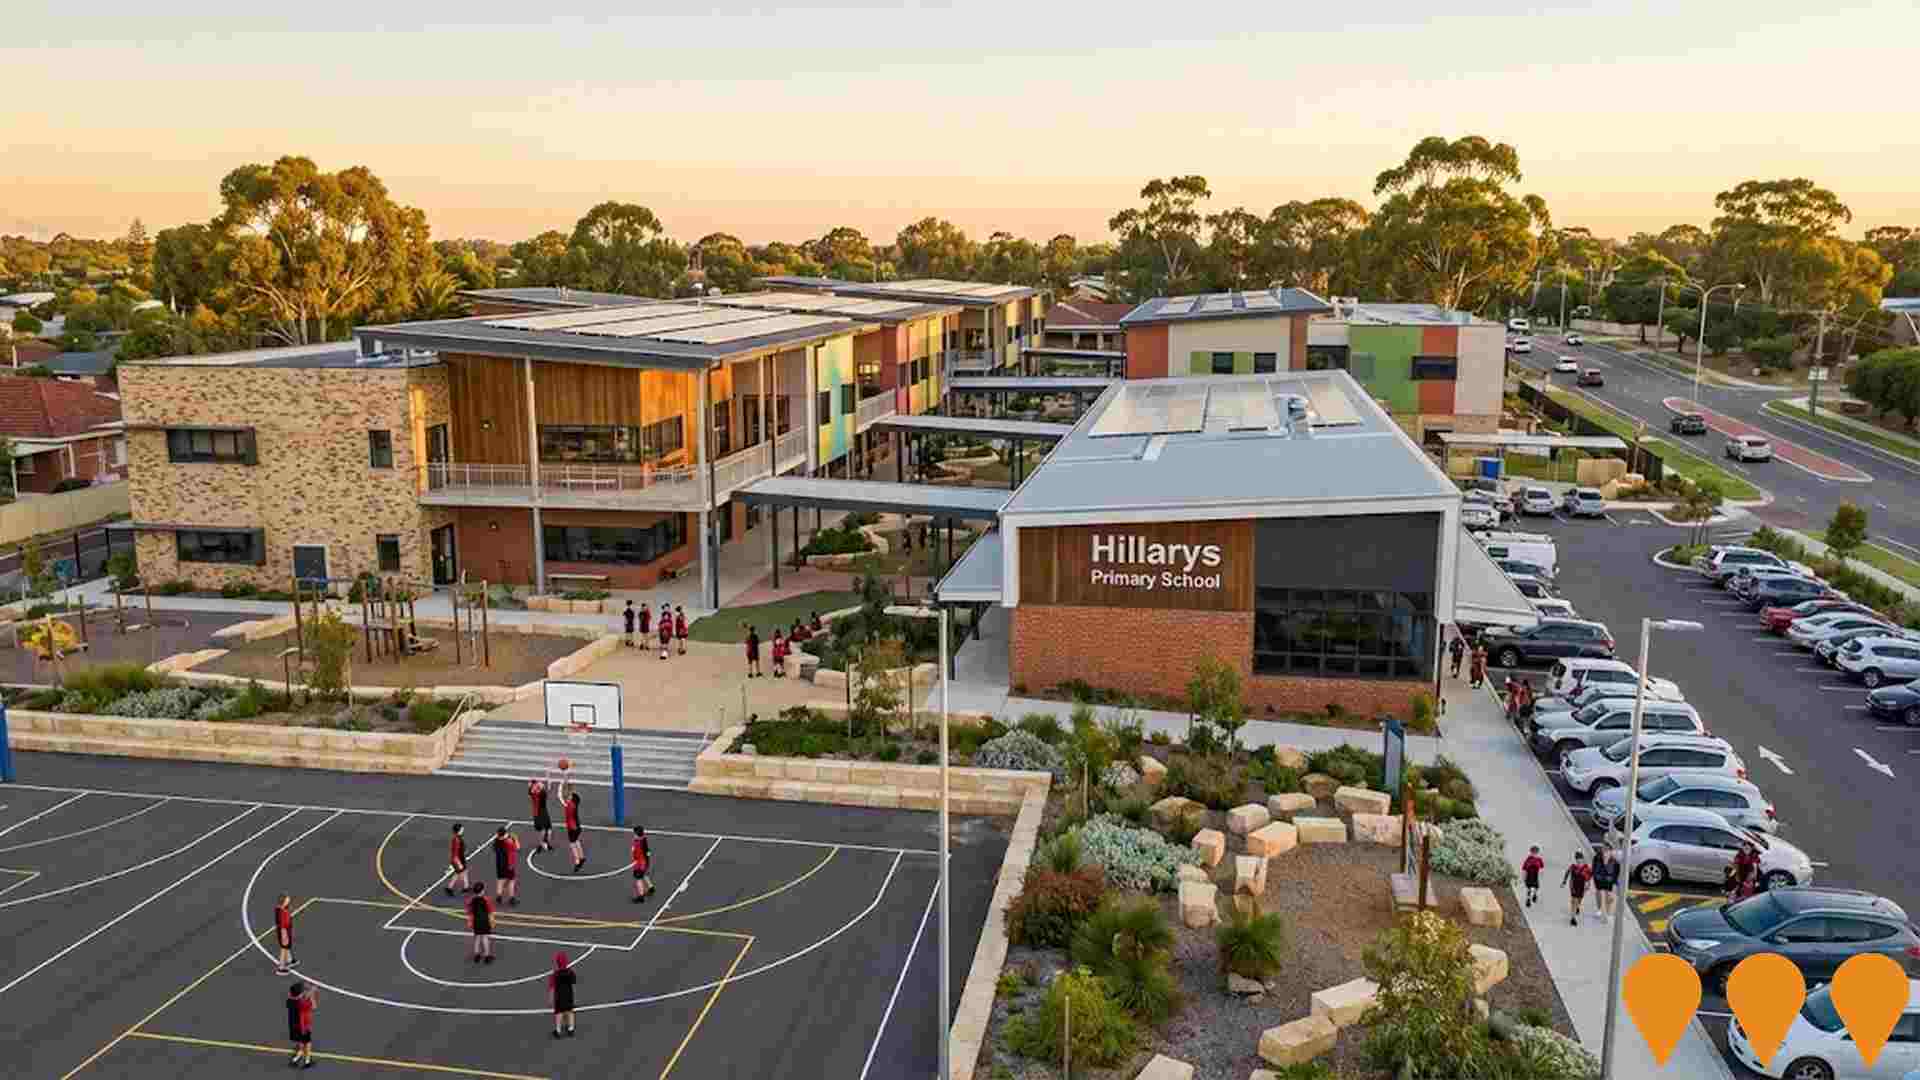
Hillarys Primary School Upgrades
State-of-the-art 22.8 million dollar major redevelopment of Hillarys Primary School delivered in three stages, providing 16 new general learning classrooms, two kindergarten classrooms, an inclusive education classroom, a new administration building, library, staffroom, hardcourts, additional parking, landscaping, outdoor teaching terraces and upgrades such as solar panels and digital connectivity. The project replaced facilities first opened in 1973 and was officially opened in October 2024 by the Cook Labor Government.
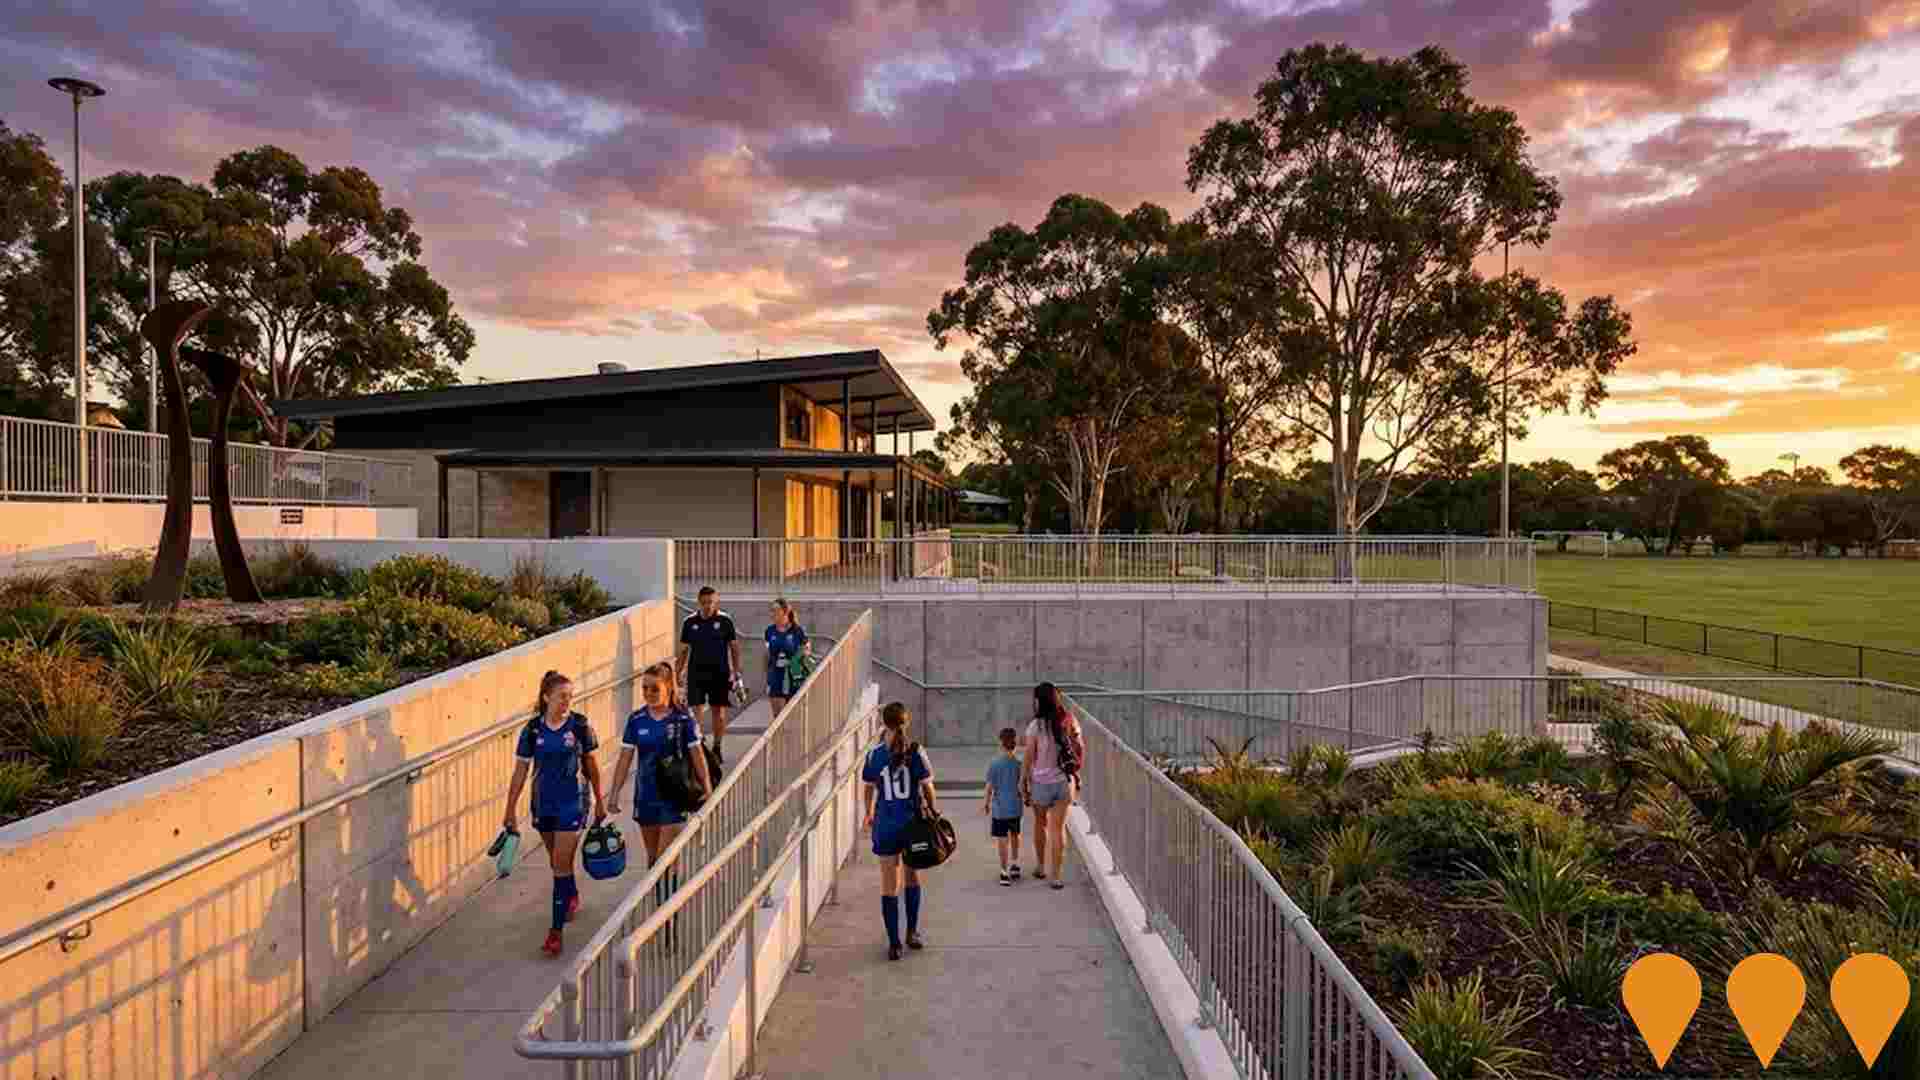
Chichester Park Community Sporting Facility Redevelopment
A $5.6 million redevelopment of the Chichester Park community sporting facility, completed in 2023. The two-storey facility features a medium-sized meeting room, four change rooms designed to better cater for female users, a referees change room, first aid room, modern kitchen, upgraded toilets, and storage areas. The project also included additional parking bays (57 total), a new barbecue and picnic area, underground drainage for the southern playing field, and enhanced accessibility features. The facility serves five sporting clubs including Kingsley Westside, Woodvale and WA Christian Football Association soccer clubs, plus Kingsley Woodvale Cricket and Junior Cricket clubs, with over 1,800 members. The park also features two active playing fields, floodlighting, an 18-basket disc golf course, and playground facilities.
Employment
Employment conditions in Padbury demonstrate exceptional strength compared to most Australian markets
Padbury has a well-educated workforce with essential services sectors well represented. The unemployment rate in Padbury is 2.7%, lower than the Greater Perth rate of 4.0%.
Employment growth over the past year was estimated at 4.5%. As of September 2025, there are 5,382 residents employed, with an unemployment rate of 1.2% below Greater Perth's rate. Workforce participation is similar to Greater Perth, at 68.9%. Employment in Padbury is concentrated in health care & social assistance, construction, and education & training.
Construction employment is particularly strong, with a share 1.5 times the regional level. Retail trade, however, is under-represented, with only 7.4% of Padbury's workforce compared to Greater Perth's 9.3%. The area appears to offer limited local employment opportunities based on Census data. Over the 12 months to September 2025, employment increased by 4.5%, while labour force increased by 3.8%, reducing the unemployment rate by 0.6 percentage points. In contrast, Greater Perth experienced employment growth of 2.9% and labour force growth of 3.0%. State-level data to 25-Nov-25 shows WA employment contracted by 0.27%, with an unemployment rate of 4.6%, compared to the national rate of 4.3%. National employment forecasts from May-25 suggest a 6.6% increase over five years and 13.7% over ten years. Applying these projections to Padbury's employment mix, local employment is expected to increase by 6.5% over five years and 13.5% over ten years.
Frequently Asked Questions - Employment
Income
Income metrics indicate excellent economic conditions, with the area achieving higher performance than 75% of national locations assessed by AreaSearch
AreaSearch's latest postcode level ATO data for financial year 2022 shows that Padbury SA2 had a median income of $58,714 and an average income of $78,500. This contrasts with Greater Perth's figures of a median income of $58,380 and an average income of $78,020. Based on Wage Price Index growth of 14.2% since financial year 2022, current estimates for Padbury would be approximately $67,051 (median) and $89,647 (average) as of September 2025. According to the 2021 Census, incomes in Padbury cluster around the 69th percentile nationally. The income distribution shows that 33.7% of residents (3,210 people) fall within the $1,500 - 2,999 bracket, similar to the metropolitan region where 32.0% occupy this bracket. Housing accounts for 14.4% of income. Padbury residents rank in the 72nd percentile for disposable income and the area's SEIFA income ranking places it in the 7th decile.
Frequently Asked Questions - Income
Housing
Padbury is characterized by a predominantly suburban housing profile, with a higher proportion of rental properties than the broader region
Padbury's dwelling structures, as per the latest Census, consisted of 92.3% houses and 7.6% other dwellings (semi-detached, apartments, 'other' dwellings). This compares to Perth metro's 88.7% houses and 11.3% other dwellings. Home ownership in Padbury stood at 32.8%, with mortgaged dwellings at 50.4% and rented ones at 16.8%. The median monthly mortgage repayment was $2,000, lower than Perth metro's average of $2,080. Median weekly rent in Padbury was $390, compared to Perth metro's $400. Nationally, Padbury's mortgage repayments exceeded the Australian average of $1,863, while rents were higher than the national figure of $375.
Frequently Asked Questions - Housing
Household Composition
Padbury features high concentrations of family households, with a lower-than-average median household size
Family households constitute 77.3% of all households, including 35.8% couples with children, 28.2% couples without children, and 12.1% single parent families. Non-family households make up the remaining 22.7%, with lone person households at 20.2% and group households comprising 2.4%. The median household size is 2.6 people, which is smaller than the Greater Perth average of 2.7.
Frequently Asked Questions - Households
Local Schools & Education
The educational profile of Padbury exceeds national averages, with above-average qualification levels and academic performance metrics
Tertiary education reaches 28.8% of Padbury residents aged 15 and above. Bachelor degrees are the most common at 20.6%, followed by postgraduate qualifications (4.9%) and graduate diplomas (3.3%). Vocational credentials are held by 39.0% of residents aged 15 and above, including advanced diplomas (12.4%) and certificates (26.6%).
Educational participation is high, with 28.2% of residents currently enrolled in formal education. This includes 10.4% in primary education, 7.6% in secondary education, and 4.4% pursuing tertiary education.
Frequently Asked Questions - Education
Schools Detail
Nearby Services & Amenities
Transport
Transport servicing is good compared to other areas nationally based on assessment of service frequency, route connectivity and accessibility
The Padbury public transport analysis shows that there are 52 active transport stops currently operating in the area. These stops offer a mix of bus services. Nine individual routes serve these stops, collectively providing 1,817 weekly passenger trips.
Transport accessibility is rated as excellent with residents typically located 197 meters from the nearest transport stop. Service frequency averages 259 trips per day across all routes, equating to approximately 34 weekly trips per individual stop.
Frequently Asked Questions - Transport
Transport Stops Detail
Health
The level of general health in Padbury is notably higher than the national average with both young and old age cohorts seeing low prevalence of common health conditions
Padbury exhibits favorable health outcomes, with both younger and older age groups reporting low prevalence of common health conditions.
The private health cover rate stands at approximately 59%, covering around 5601 individuals out of the total population. Mental health issues and asthma emerged as the most prevalent medical conditions, affecting 7.4% and 7.3% of residents respectively. Notably, 71.9% of Padbury's residents reported being free from any medical ailments, slightly higher than the 71.5% average across Greater Perth. The area has a lower proportion of seniors aged 65 and over, with 17.1% (1630 individuals) compared to Greater Perth's 20.1%. Despite this, health outcomes among seniors in Padbury are favorable, largely aligning with the general population's health profile.
Frequently Asked Questions - Health
Cultural Diversity
The level of cultural diversity witnessed in Padbury was found to be slightly above average when compared nationally for a number of language and cultural background related metrics
Padbury's population showed higher cultural diversity than most local areas, with 11.2% speaking a language other than English at home and 32.8% born overseas. Christianity was the predominant religion in Padbury, accounting for 43.5%. Islam was overrepresented compared to Greater Perth, making up 1.3% of Padbury's population.
The top three ancestry groups were English (31.8%), Australian (24.3%), and Irish (9.2%). Some ethnic groups had notable differences in representation: Welsh at 0.9% (vs regional 1.1%), South African at 0.9% (vs regional 1.8%), and New Zealand at 1.0% (vs regional 0.9%).
Frequently Asked Questions - Diversity
Age
Padbury's population is slightly younger than the national pattern
The median age in Padbury is 38 years, close to Greater Perth's average of 37 years and equivalent to Australia's median age of 38 years. Compared to Greater Perth, Padbury has a higher proportion of residents aged 35-44 (17.5%) but fewer residents aged 25-34 (11.3%). Between the 2021 Census and now, the population aged 75-84 has grown from 4.5% to 6.0%, while the 35-44 age group increased from 16.3% to 17.5%. Conversely, the 25-34 age group declined from 13.1% to 11.3%, and the 55-64 age group dropped from 11.2% to 9.5%. By 2041, Padbury's age composition is expected to shift notably. The 75-84 age group is projected to grow by 78%, reaching 1,007 people from the current 566. Meanwhile, both the 0-4 and 35-44 age groups are expected to decrease in number.
