Chart Color Schemes
est. as @ -- *
ABS ERP | -- people | --
2021 Census | -- people
Sales Activity
Curious about local property values? Filter the chart to assess the volume and appreciation (including resales) trends and regional comparisons, or scroll to the map below view this information at an individual property level.
Find a Recent Sale
Sales Detail
Population
Population growth drivers in Wembley Downs - Churchlands - Woodlands are strong compared to national averages based on AreaSearch's ranking of recent, and medium to long-term trends
Wembley Downs - Churchlands - Woodlands' population is 16,521 as of November 2025. This reflects a growth of 1,477 people since the 2021 Census, which reported a population of 15,044. The increase is inferred from ABS estimates: 16,459 in June 2024 and an additional 60 validated new addresses since the Census date. This results in a density ratio of 2,060 persons per square kilometer, above national averages assessed by AreaSearch. The area's growth rate of 9.8% since the 2021 census exceeds the national average of 8.9%. Population growth was primarily driven by overseas migration (91.4%).
AreaSearch uses ABS/Geoscience Australia projections for each SA2 area, released in 2024 with a base year of 2022. For areas not covered and years post-2032, AreaSearch utilises ABS Greater Capital Region projections released in 2023 based on 2022 data. Projected growth indicates an above median increase by 2041, with the area expected to gain 2,325 persons, representing a total increase of 13.7%.
Frequently Asked Questions - Population
Development
AreaSearch assessment of residential development activity positions Wembley Downs - Churchlands - Woodlands among the top 25% of areas assessed nationwide
Wembley Downs - Churchlands - Woodlands averaged approximately 57 new dwelling approvals annually over the past five financial years, from FY21 to FY25. A total of 289 homes were approved during this period, with an additional 11 approved in FY26 as of current data. On average, 4.4 new residents per year arrived per dwelling constructed between FY21 and FY25, indicating a significant demand exceeding new supply.
The average expected construction cost value for new dwellings was $567,000, suggesting developers targeted the premium market segment with higher-end properties. This financial year saw $12.9 million in commercial approvals, reflecting moderate levels of commercial development compared to Greater Perth. Relative to national assessments, Wembley Downs - Churchlands - Woodlands has 16.0% less new development per person and ranks among the 57th percentile of areas evaluated.
Recent construction comprised 88.0% detached dwellings and 12.0% townhouses or apartments, maintaining the area's traditional suburban character with a focus on family homes appealing to those seeking space. New construction favoured detached housing more than current patterns suggest (70.0% at Census), demonstrating ongoing robust demand for family homes despite increasing density pressures. With around 267 people per dwelling approval, Wembley Downs - Churchlands - Woodlands shows a developing market with an expected population growth of 2,263 residents by 2041. Development is keeping pace with projected growth, though buyers may face increasing competition as the population expands.
Frequently Asked Questions - Development
Infrastructure
Wembley Downs - Churchlands - Woodlands has limited levels of nearby infrastructure activity, ranking in the 19thth percentile nationally
The area's performance is significantly influenced by changes in local infrastructure, major projects, and planning initiatives. AreaSearch has identified a total of 24 projects that are expected to impact the area. Notable projects include Glendalough Green, Bold Park Aquatic Centre Redevelopment, Floreat Beach Masterplan, and Wembley Downs Local Centre Precinct Structure Plan. The following list details those projects likely to be most relevant.
Professional plan users can use the search below to filter and access additional projects.
INFRASTRUCTURE SEARCH
 Denotes AI-based impression for illustrative purposes only, not to be taken as definitive under any circumstances. Please follow links and conduct other investigations from the project's source for actual imagery. Developers and project owners wishing us to use original imagery please Contact Us and we will do so.
Frequently Asked Questions - Infrastructure
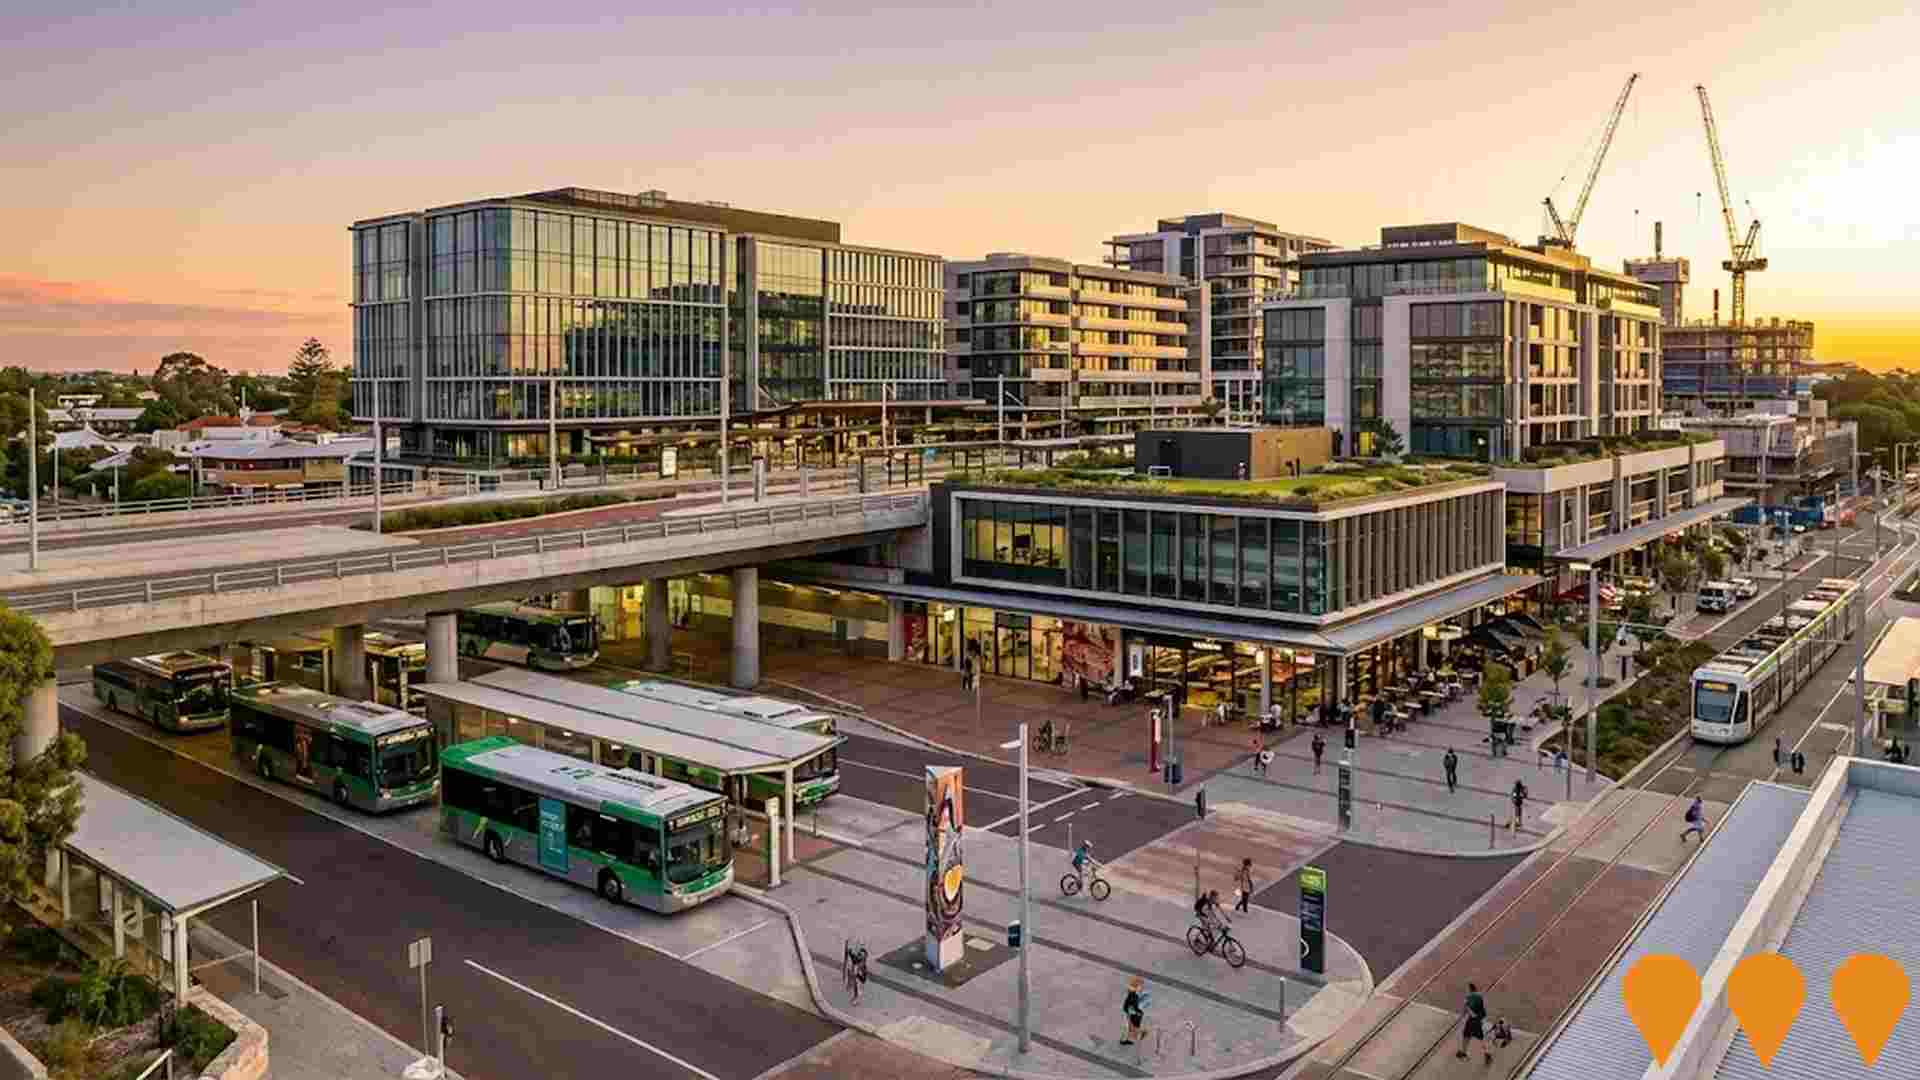
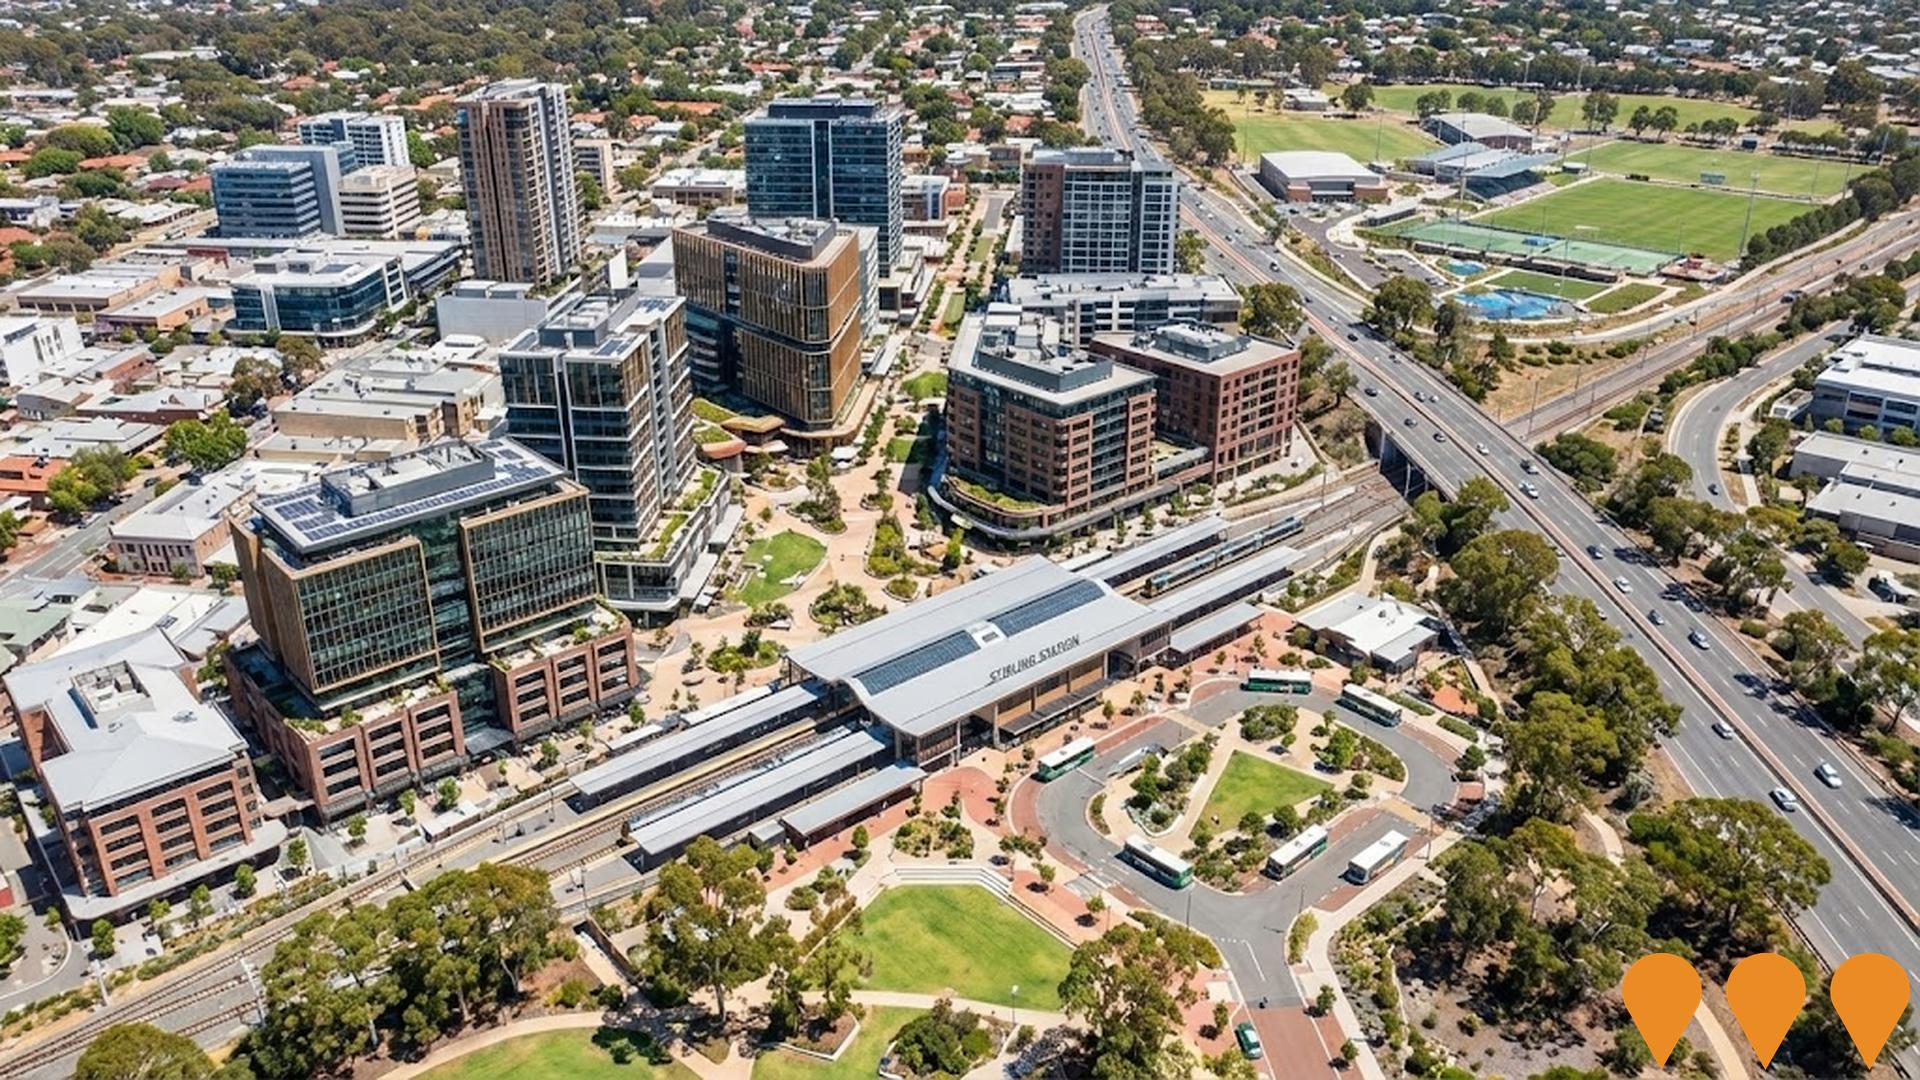
Stirling City Centre Development
Comprehensive urban renewal project for the Stirling City Centre, covering 351 hectares, aiming to transform the precinct into a higher intensity mixed-use area around the Stirling Station. Key objectives include developing public and private land to create a safe and vibrant centre, expanding the integrated transport network, offering a diverse range of housing types, and building a network of public open space, commercial uses and community facilities. The plan is guided by State and Local Planning Strategies. The City is also investigating the transformation of vacant land next to the Mitchell Freeway into a premier sports and recreation precinct as part of the redevelopment. Changes are being made to the City Centre boundaries as part of the Local Planning Scheme No. 4 (LPS4), and the Stirling City Activity Centre Plan will then be amended and re-advertised.
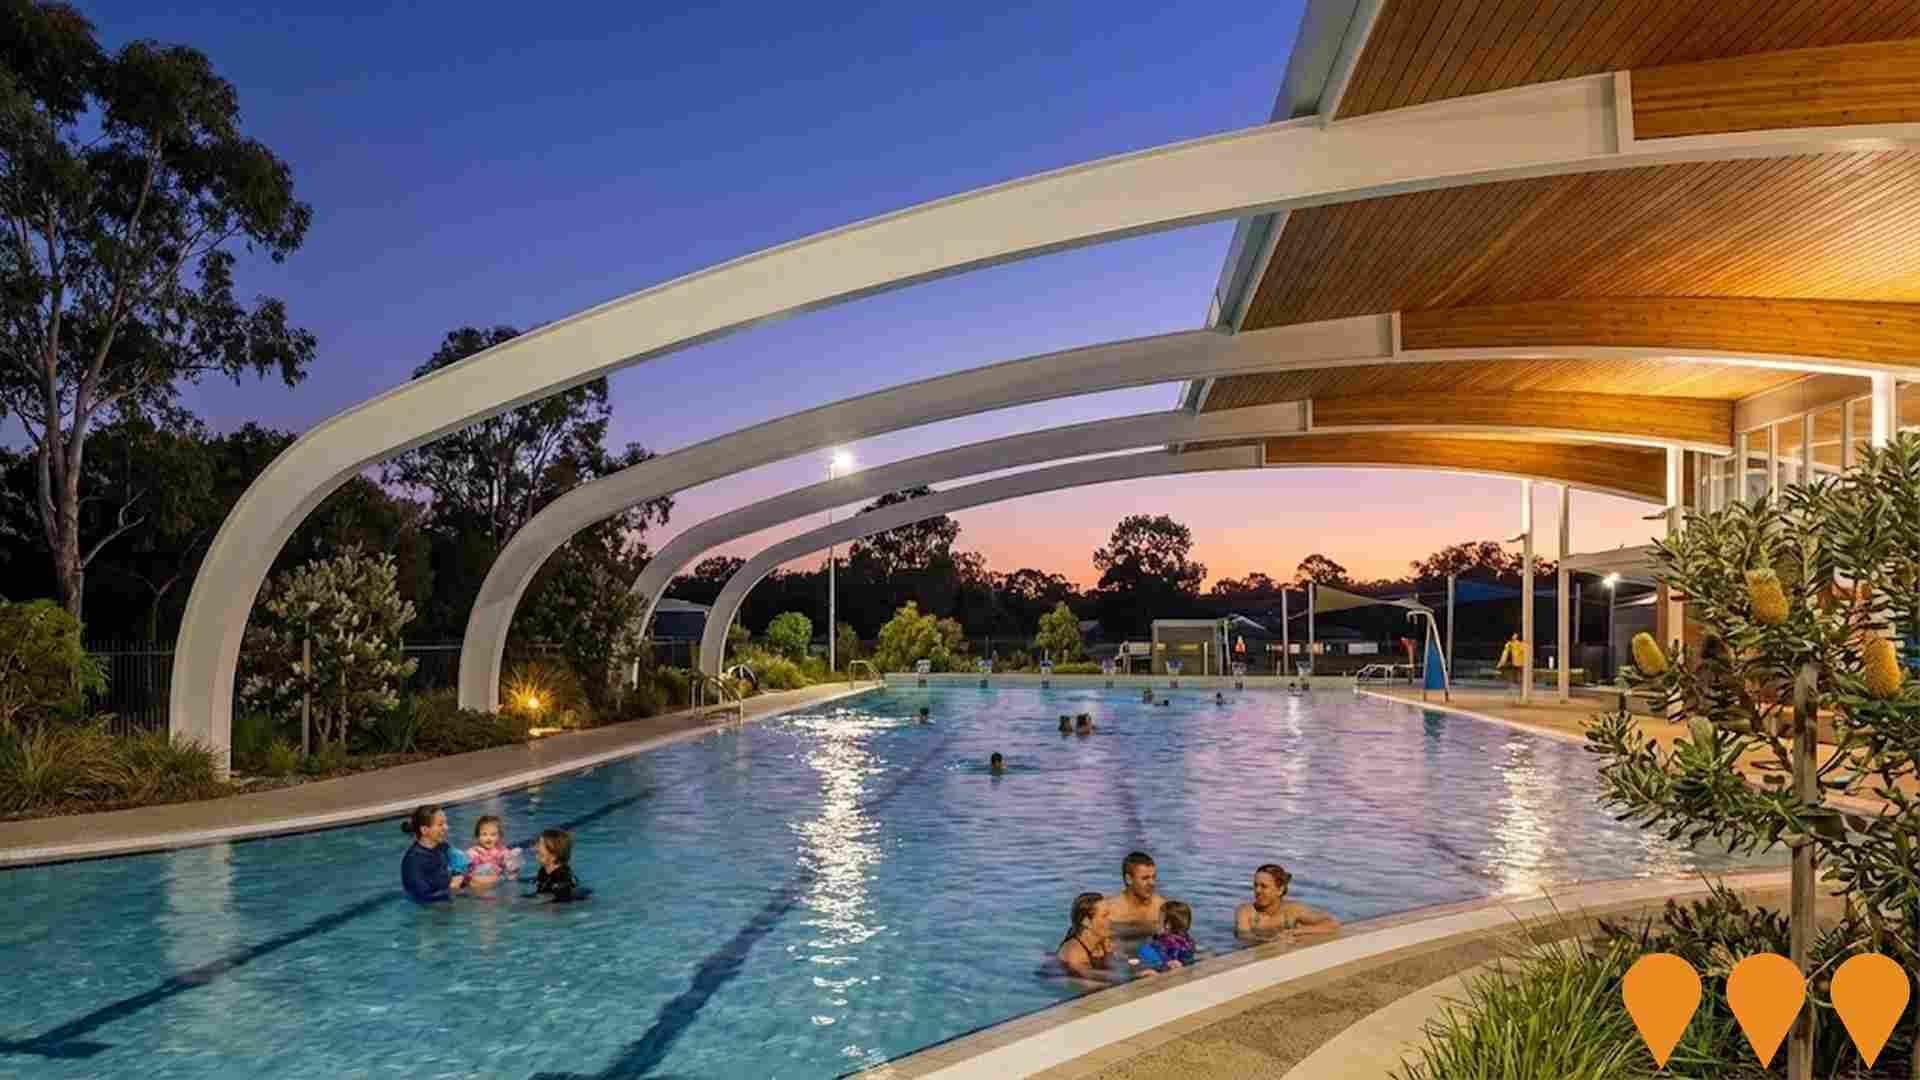
Bold Park Aquatic Centre Redevelopment
Town of Cambridge feasibility and needs assessment for potential future upgrades to Bold Park Aquatic Centre and adjacent land, aiming to enhance recreation facilities and sporting infrastructure for the western suburbs community.
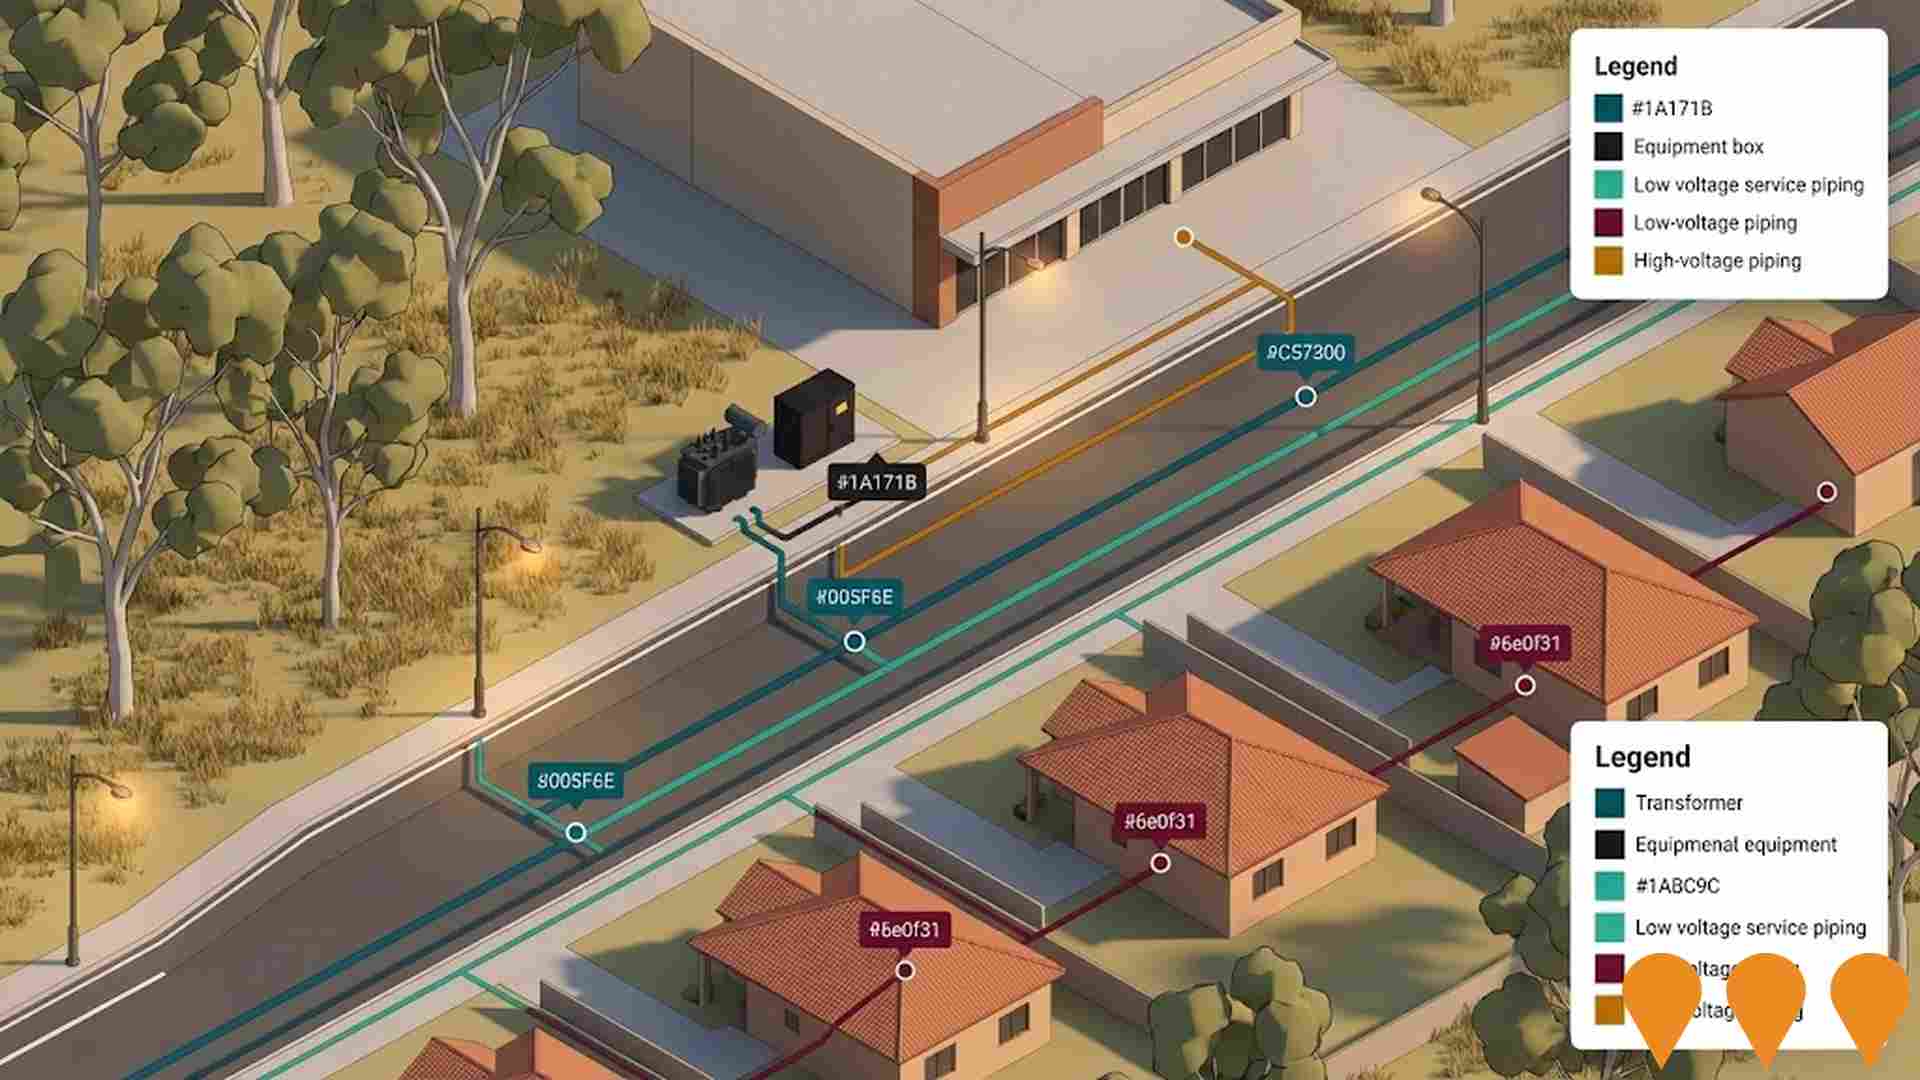
Underground Power Conversion Project
Western Power in partnership with City of Stirling is converting overhead distribution powerlines to underground power throughout Yokine and surrounding suburbs. This infrastructure upgrade improves reliability and aesthetic appeal of the streetscape.
Conservation Infrastructure Upgrades Program
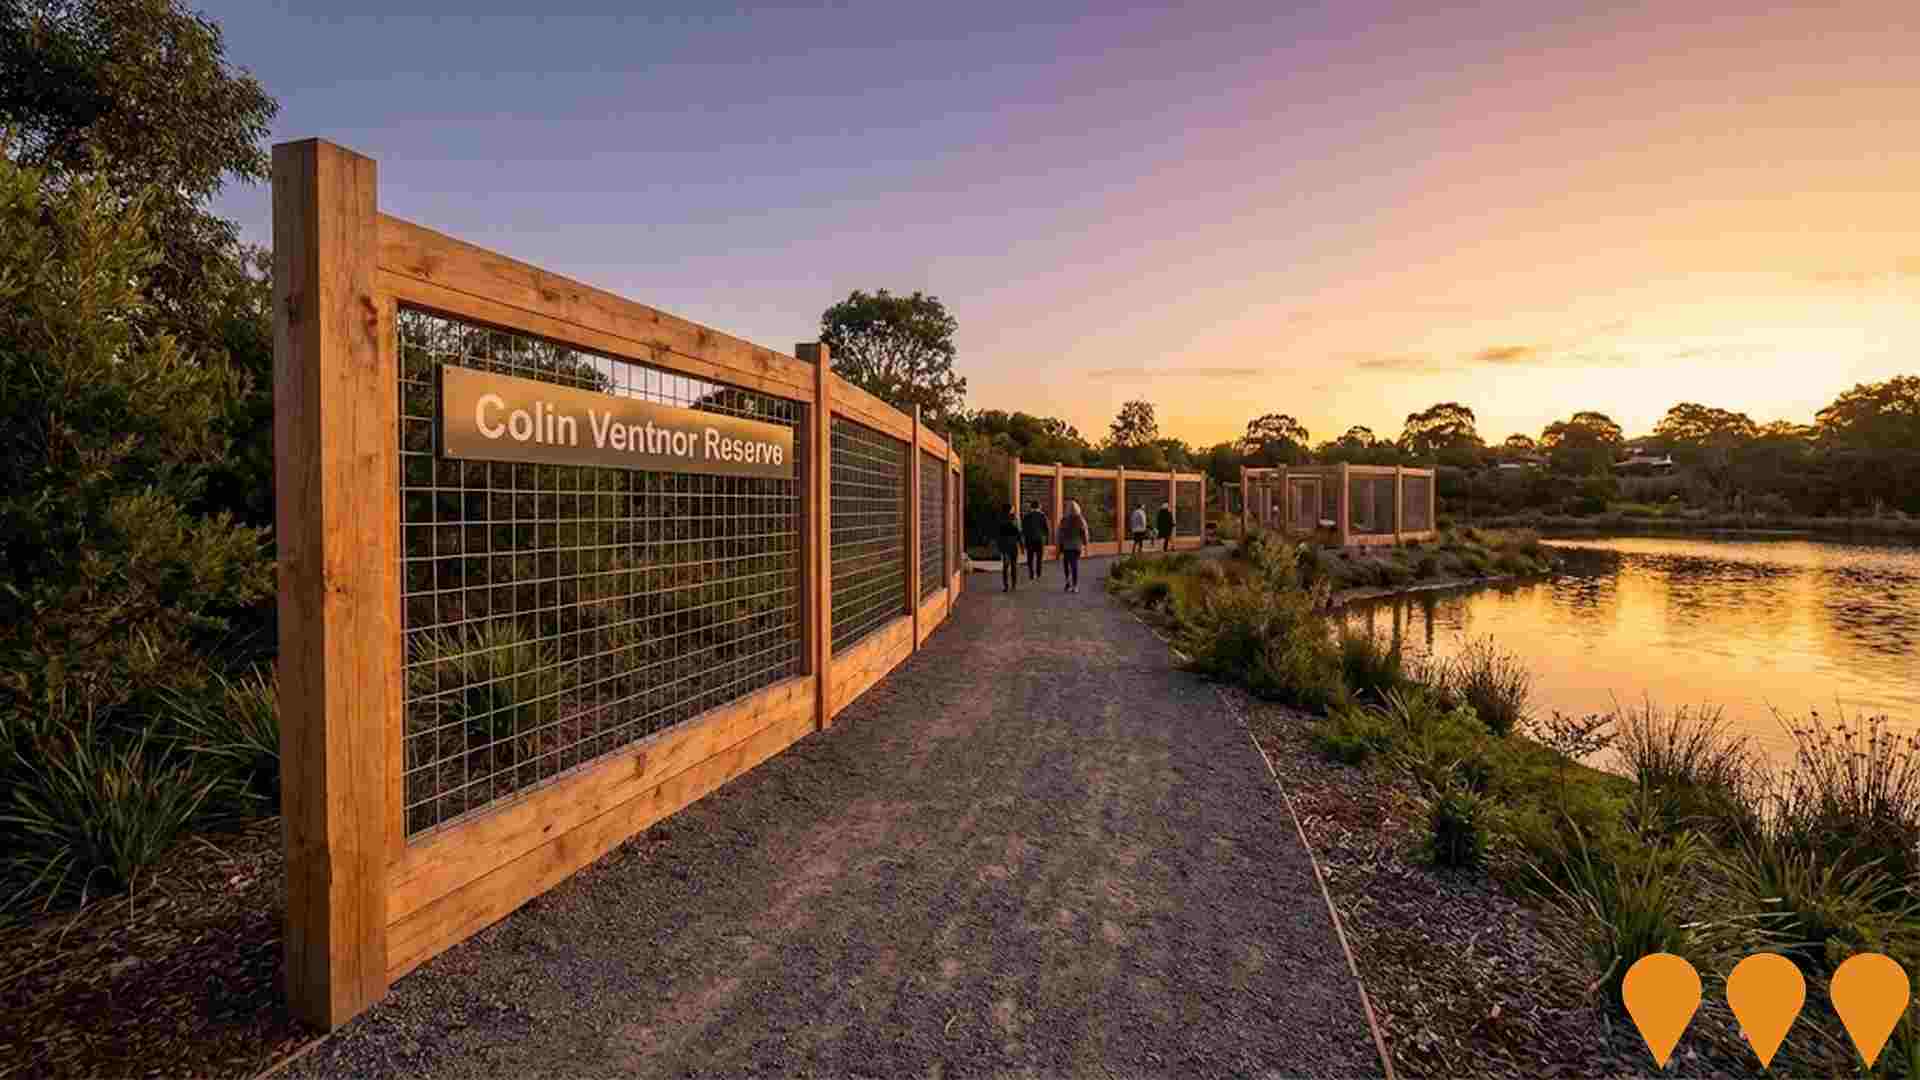
Citywide conservation reserve infrastructure upgrades including new fencing, pathways, and habitat protection measures across multiple reserves in the Stirling area. The program aims to protect biodiversity while providing sustainable recreation access.
Floreat Beach Masterplan
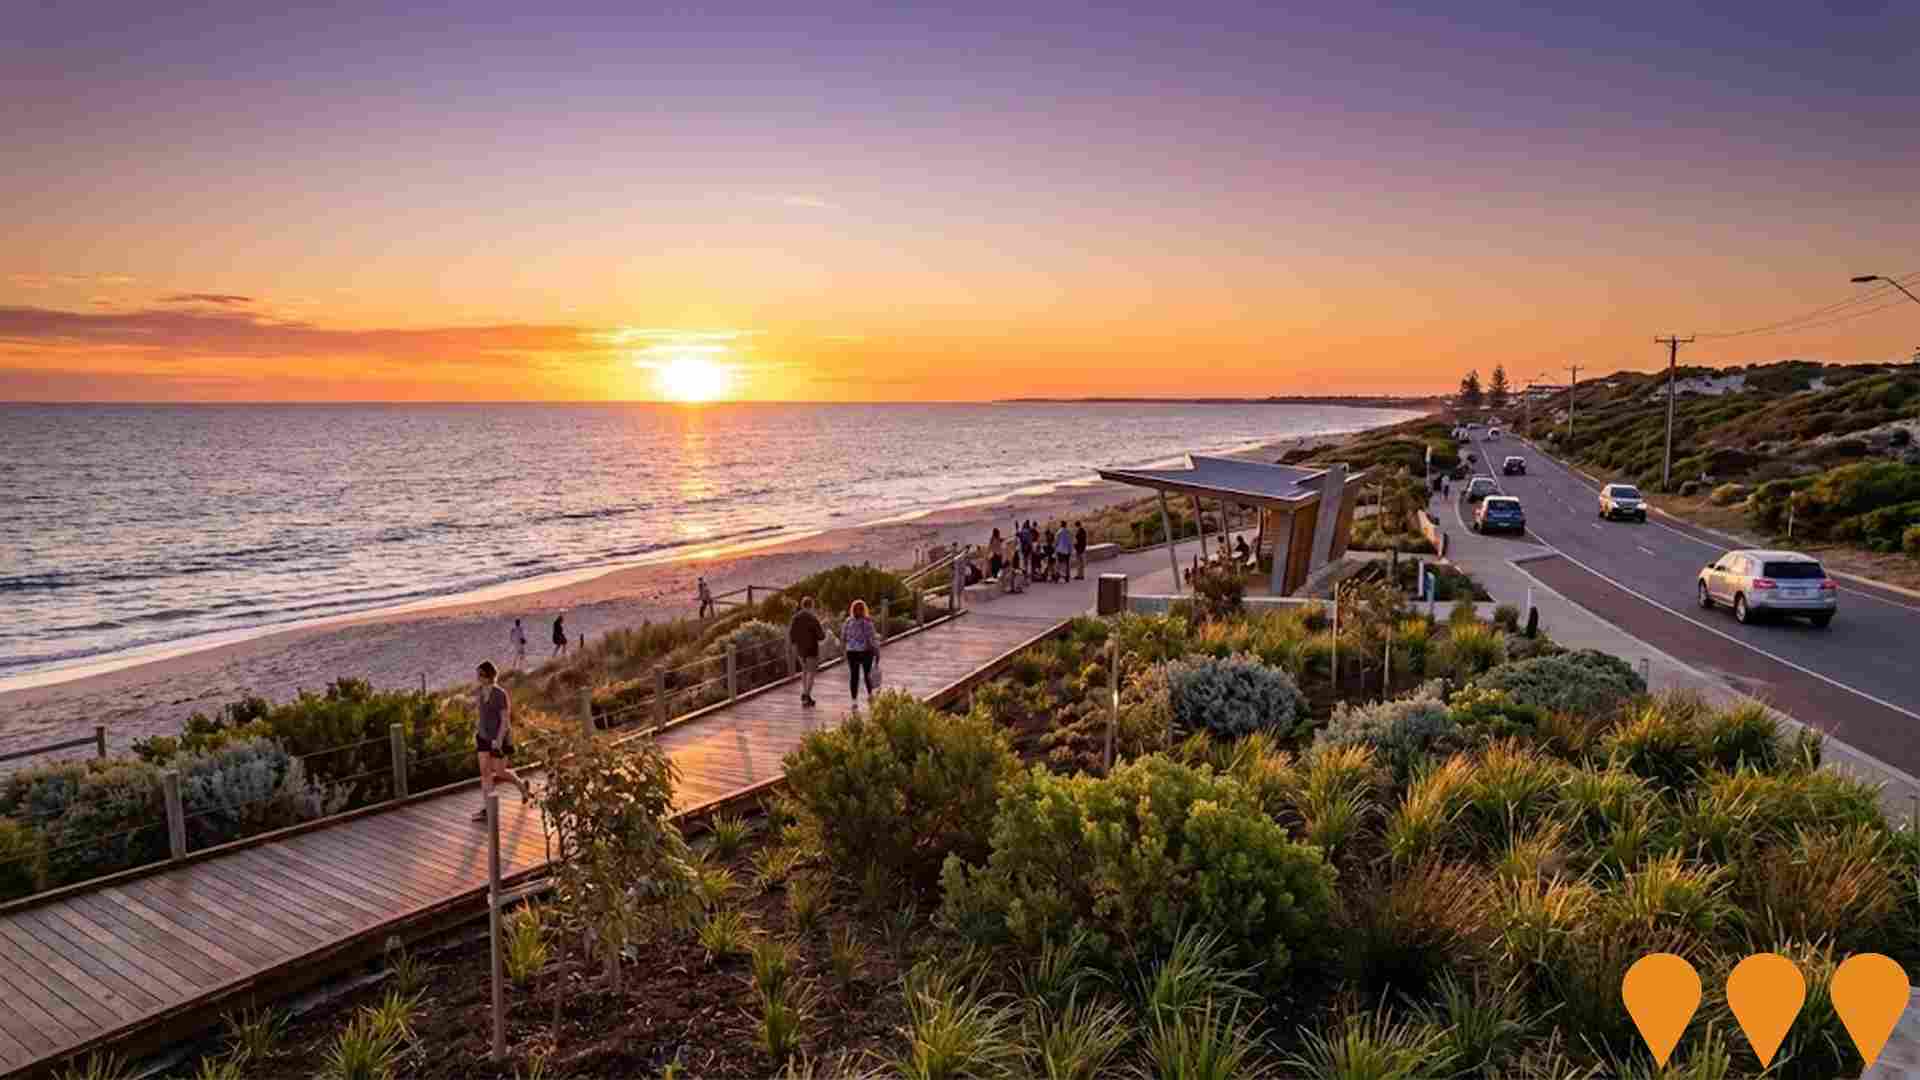
Town of Cambridge engagement project to develop masterplan for Floreat Beach precinct, determining common values and key issues. Long-term vision development for coastal management and community facilities enhancement.
Wembley Downs Local Centre Precinct Structure Plan
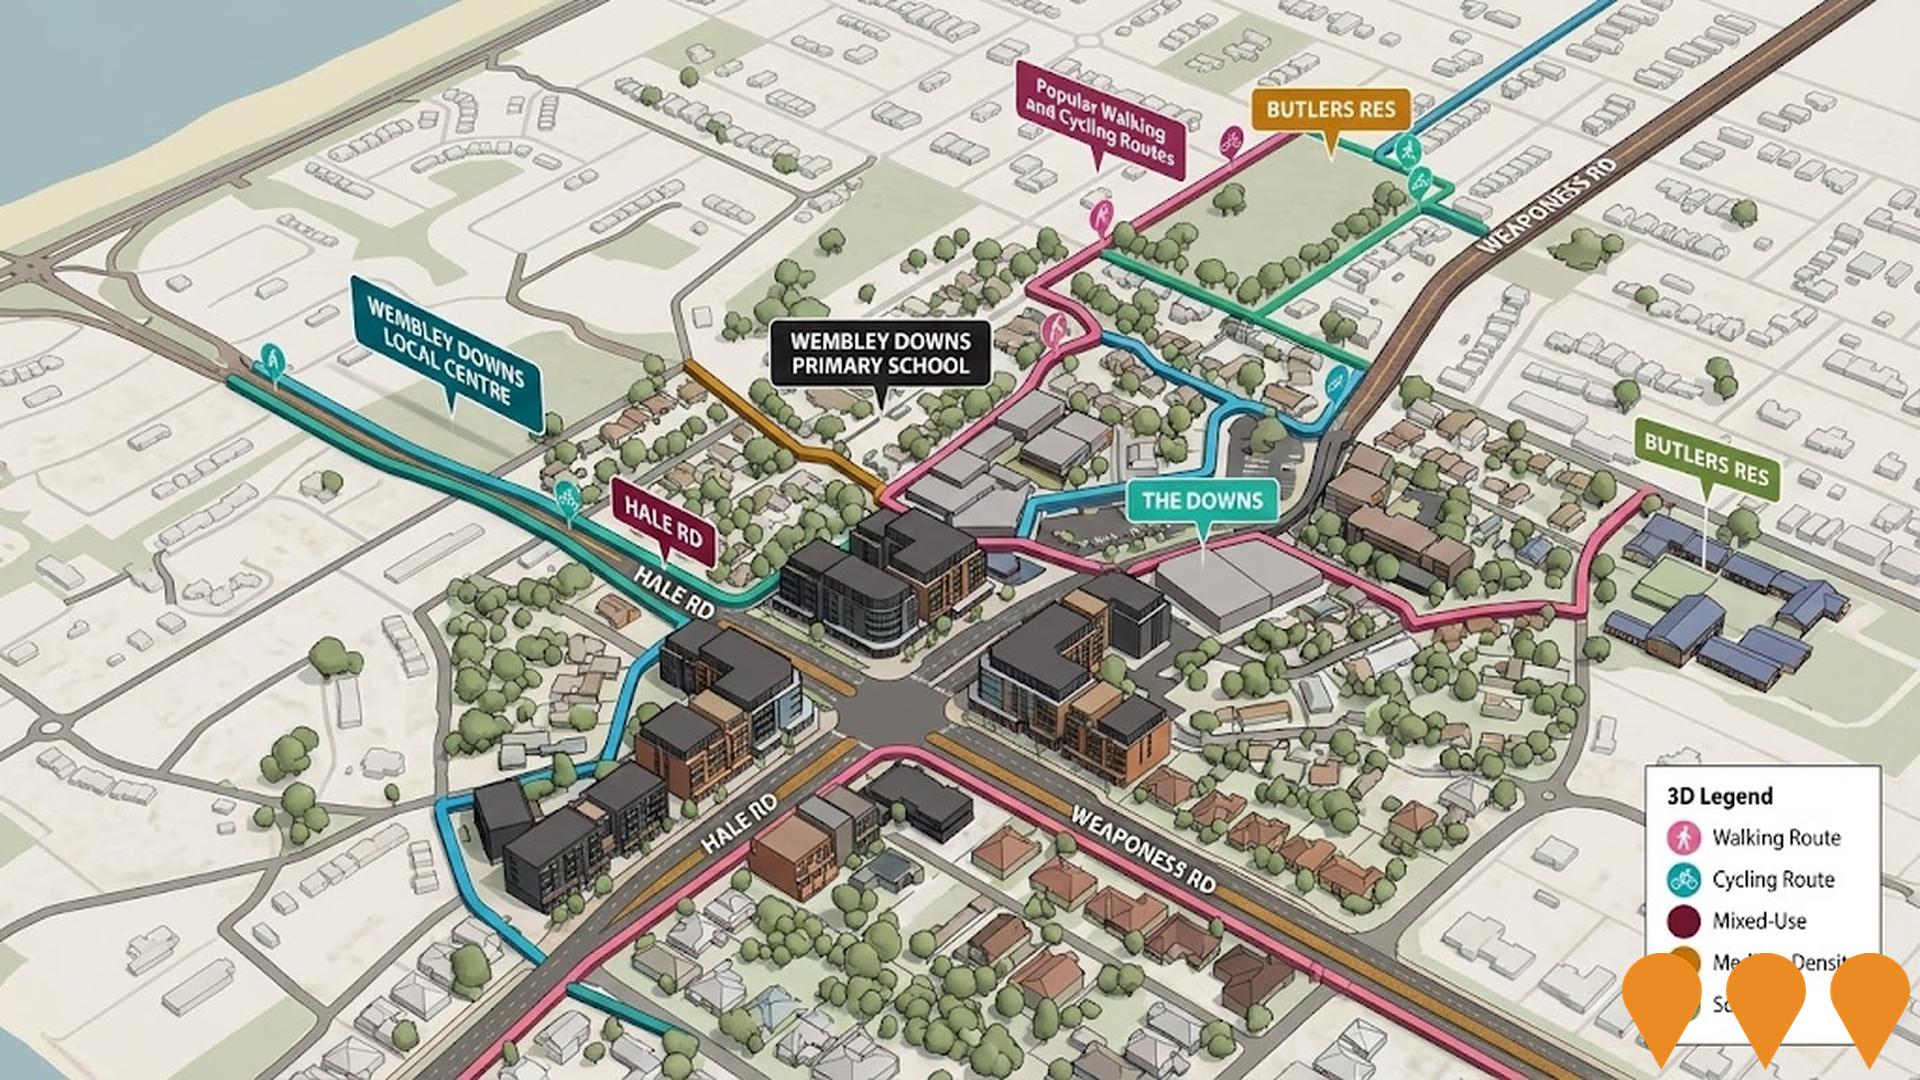
City of Stirling structure plan to guide future mixed-use intensification around the small local centre, allowing increased density, small-scale retail and potential medium-density housing.
Yokine Regional Open Space Upgrades
Comprehensive upgrades to Yokine Regional Open Space including new playground equipment, improved pathways, enhanced sporting facilities, additional parking and landscaping. The project aims to create a premier regional recreation destination.

Glendalough Green
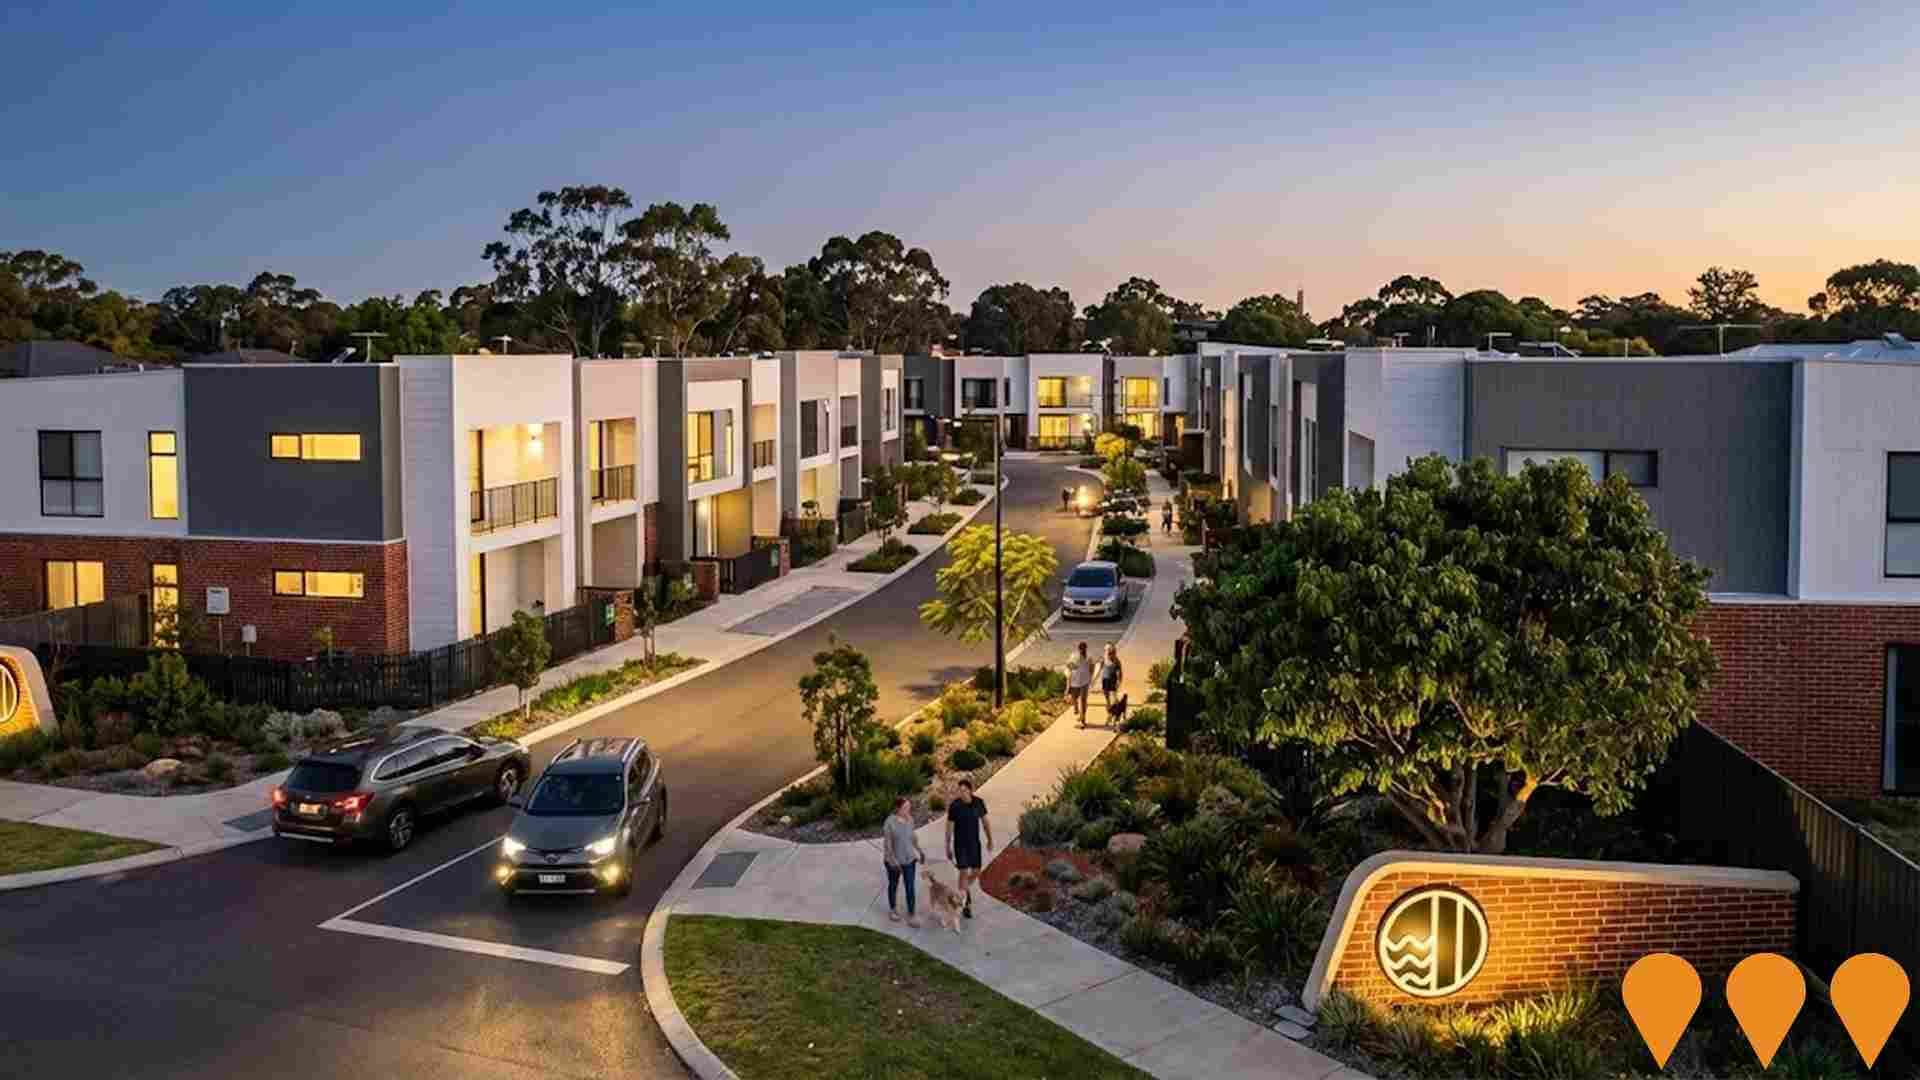
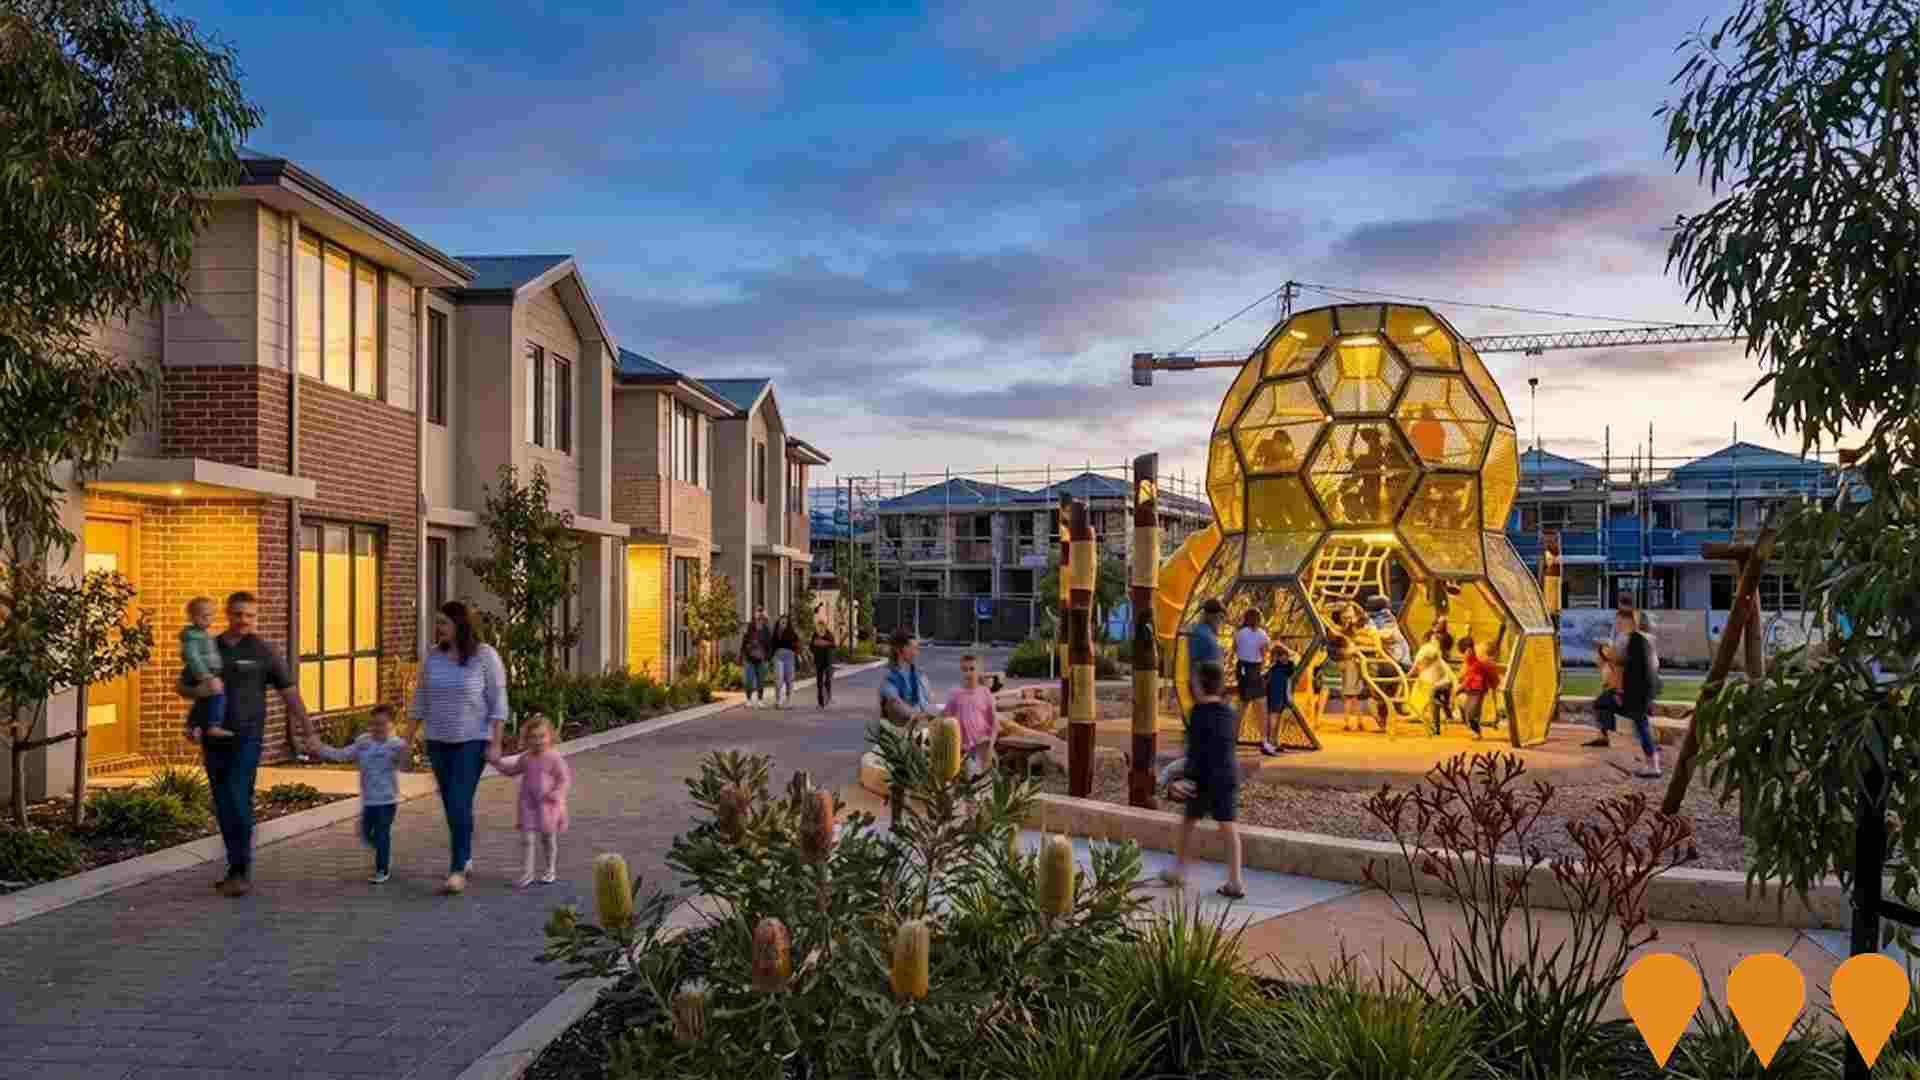
Medium-density infill project delivering 100 turnkey townhouses (2-5 bedrooms) with a central communal open space, walkable mews-style streets, and direct access to nearby transport and parklands. Stage 1 construction is well advanced and further stages are progressing.
Employment
Employment conditions in Wembley Downs - Churchlands - Woodlands rank among the top 10% of areas assessed nationally
Wembley Downs - Churchlands - Woodlands has a highly educated workforce with strong representation in professional services. The unemployment rate was 1.3% as of June 2025 and there was an estimated employment growth of 4.1% over the past year.
In June 2025, 9,101 residents were employed while the unemployment rate was 2.6% lower than Greater Perth's rate of 3.9%. Workforce participation was similar to Greater Perth's at 65.2%. Employment is concentrated in health care & social assistance, professional & technical services, and education & training. The area shows strong specialization in professional & technical services with an employment share 1.7 times the regional level.
Conversely, manufacturing has lower representation at 2.9% compared to the regional average of 5.5%. Employment opportunities locally appear limited as indicated by the count of Census working population versus resident population. Over the 12 months to June 2025, employment increased by 4.1% while labour force increased by 4.0%, leaving unemployment broadly flat. Greater Perth recorded employment growth of 3.7%, labour force growth of 3.8%, with unemployment rising slightly by 0.1 percentage points. Jobs and Skills Australia's national employment forecasts from May 2025 project national employment to expand by 6.6% over five years and 13.7% over ten years. Applying these projections to Wembley Downs - Churchlands - Woodlands' employment mix suggests local growth of approximately 7.0%% over five years and 14.4% over ten years, though this is a simple weighting extrapolation for illustrative purposes and does not account for localised population projections.
Frequently Asked Questions - Employment
Income
The economic profile demonstrates exceptional strength, placing the area among the top 10% nationally based on comprehensive AreaSearch income analysis
Wembley Downs-Churchlands-Woodlands' income level is extremely high nationally according to latest ATO data aggregated by AreaSearch for financial year 2022. Its median income among taxpayers is $67,601 and average income stands at $92,053, compared to Greater Perth's figures of $58,380 and $78,020 respectively. Based on Wage Price Index growth of 14.2% since financial year 2022, current estimates would be approximately $77,200 (median) and $105,125 (average) as of September 2025. Census data reveals household, family and personal incomes all rank highly in Wembley Downs-Churchlands-Woodlands, between the 78th and 87th percentiles nationally. Income brackets indicate largest segment comprises 30.4% earning $4000+ weekly (5,022 residents), differing from patterns across regional levels where $1,500 - 2,999 dominates with 32.0%. District demonstrates considerable affluence with 42.0% earning over $3,000 per week, supporting premium retail and service offerings. After housing costs, residents retain 86.9% of income, reflecting strong purchasing power and area's SEIFA income ranking places it in the 9th decile.
Frequently Asked Questions - Income
Housing
Wembley Downs - Churchlands - Woodlands displays a diverse mix of dwelling types, with above-average rates of outright home ownership
The dwelling structure in Wembley Downs - Churchlands - Woodlands, as per the latest Census, consisted of 69.6% houses and 30.3% other dwellings (semi-detached, apartments, 'other' dwellings). In comparison, Perth metro had 59.6% houses and 40.4% other dwellings. Home ownership in Wembley Downs - Churchlands - Woodlands was 43.4%, with mortgaged dwellings at 37.3% and rented ones at 19.3%. The median monthly mortgage repayment in the area was $2,669, higher than Perth metro's average of $1,950. The median weekly rent figure was recorded at $420, compared to Perth metro's $350. Nationally, mortgage repayments were significantly higher at $1,863 and rents substantially above the national figure of $375.
Frequently Asked Questions - Housing
Household Composition
Wembley Downs - Churchlands - Woodlands has a typical household mix, with a higher-than-average median household size
Family households account for 75.1% of all households, including 40.0% couples with children, 24.9% couples without children, and 9.5% single parent families. Non-family households constitute the remaining 24.9%, with lone person households at 22.5% and group households comprising 2.4%. The median household size is 2.7 people, which is larger than the Greater Perth average of 2.4.
Frequently Asked Questions - Households
Local Schools & Education
Wembley Downs - Churchlands - Woodlands demonstrates exceptional educational outcomes, ranking among the top 5% of areas nationally based on AreaSearch's comprehensive analysis of qualification and performance metrics
Educational attainment in Wembley Downs - Churchlands - Woodlands is notably high, with 50.4% of residents aged 15+ holding university qualifications, compared to 27.9% in WA and 29.0% in the SA4 region. Bachelor degrees are the most common at 32.6%, followed by postgraduate qualifications (12.6%) and graduate diplomas (5.2%). Vocational pathways account for 22.3% of qualifications, including advanced diplomas (10.8%) and certificates (11.5%). Educational participation is high, with 32.5% of residents currently enrolled in formal education.
This includes 11.1% in secondary education, 10.3% in primary education, and 6.8% pursuing tertiary education. There are seven schools operating within Wembley Downs - Churchlands - Woodlands, educating approximately 7,357 students. The area has significant socio-educational advantages and academic achievement, with an ICSEA score of 1135. The educational mix includes four primary, one secondary, and two K-12 schools. The area functions as an education hub, with 44.5 school places per 100 residents, significantly above the regional average of 14.5. This attracts students from surrounding communities.
Frequently Asked Questions - Education
Schools Detail
Nearby Services & Amenities
Transport
Transport servicing is good compared to other areas nationally based on assessment of service frequency, route connectivity and accessibility
Public transport analysis shows that there are 79 active transport stops operating within Wembley Downs - Churchlands - Woodlands. These stops serve a mix of bus routes. There are 19 individual routes in total, providing 2,807 weekly passenger trips collectively.
Transport accessibility is rated as excellent, with residents typically located 183 meters from the nearest transport stop. Service frequency averages 401 trips per day across all routes, equating to approximately 35 weekly trips per individual stop.
Frequently Asked Questions - Transport
Transport Stops Detail
Health
Wembley Downs - Churchlands - Woodlands's residents are extremely healthy with very low prevalence of common health conditions across all age groups
Analysis shows strong health metrics throughout Wembley Downs-Churchlands-Woodlands area. Prevalence of common health conditions is very low across all age groups. Private health cover rate is exceptionally high at approximately 67% (11,085 people), compared to Greater Perth's 59.9%.
Nationally, the average is 55.3%. Most common medical conditions are arthritis and asthma, impacting 6.6% and 6.0% of residents respectively. 74.0% declared themselves completely clear of medical ailments, compared to Greater Perth's 73.0%. The area has 20.4% (3,373 people) of residents aged 65 and over, higher than Greater Perth's 18.3%. Health outcomes among seniors are strong, broadly in line with the general population's health profile.
Frequently Asked Questions - Health
Cultural Diversity
Wembley Downs - Churchlands - Woodlands was found to be more culturally diverse than the vast majority of local markets in Australia, upon assessment of a range of language and cultural background related metrics
Wembley Downs-Churchlands-Woodlands has a higher cultural diversity than most local areas, with 20.9% of its population speaking a language other than English at home and 35.3% born overseas. Christianity is the predominant religion in Wembley Downs-Churchlands-Woodlands, making up 49.5% of the population. However, Judaism is overrepresented, comprising 0.2% compared to 1.4% across Greater Perth.
The top three ancestry groups are English (26.6%), Australian (21.9%), and Other (8.8%), which is lower than the regional average of 13.8%. Some ethnic groups show notable differences: South African at 1.6% compared to 1.0% regionally, Croatian at 0.9% versus 1.1%, and French at 0.7% compared to 0.6%.
Frequently Asked Questions - Diversity
Age
Wembley Downs - Churchlands - Woodlands hosts an older demographic, ranking in the top quartile nationwide
The median age in Wembley Downs - Churchlands - Woodlands is 42 years, significantly higher than Greater Perth's average of 37 years and Australia's national average of 38 years. The 45-54 age group constitutes 14.8% of the population, compared to Greater Perth, while the 25-34 cohort makes up only 8.5%. According to post-2021 Census data, the 15-24 age group has increased from 13.1% to 14.6%, whereas the 5-14 age group has decreased from 15.2% to 13.4%. By 2041, population forecasts indicate substantial demographic changes for Wembley Downs - Churchlands - Woodlands. The 85+ age group is projected to grow by 125%, reaching 1,473 people from the current 655. Notably, the combined 65+ age groups will account for 61% of total population growth, reflecting the area's aging demographic profile. Conversely, the 0-4 and 5-14 cohorts are expected to experience population declines.

