Chart Color Schemes
This analysis uses ABS Statistical Areas Level 2 (SA2) boundaries, which can materially differ from Suburbs and Localities (SAL) even when sharing similar names.
SA2 boundaries are defined by the Australian Bureau of Statistics and are designed to represent communities for statistical reporting (e.g., census and ERP).
Suburbs and Localities (SAL) represent commonly-used suburb/locality names (postal-style areas) and may use different geographic boundaries. For comprehensive analysis, consider reviewing both boundary types if available.
est. as @ -- *
ABS ERP | -- people | --
2021 Census | -- people
Sales Activity
Curious about local property values? Filter the chart to assess the volume and appreciation (including resales) trends and regional comparisons, or scroll to the map below view this information at an individual property level.
Find a Recent Sale
Sales Detail
Population
Beechboro lies within the top quartile of areas nationally for population growth performance according to AreaSearch analysis of recent, and medium to long-term trends
Beechboro's population, as of November 2025, is approximately 26,150. This figure represents a 4,802 person increase (22.5%) since the 2021 Census, which recorded a population of 21,348. The growth is inferred from ABS data: an estimated resident population of 25,521 in June 2024 and 991 new addresses validated since the Census date. This results in a density ratio of 555 persons per square kilometer. Beechboro's growth rate exceeds the national average (8.9%) and the state average, positioning it as a regional growth leader. Interstate migration contributed approximately 42.8% to overall population gains recently.
AreaSearch uses ABS/Geoscience Australia projections for each SA2 area, released in 2024 with a base year of 2022. For areas not covered by this data and years post-2032, AreaSearch utilises ABS growth rates by age cohort from its Greater Capital Region projections (released in 2023, based on 2022 data). Future trends forecast significant population increase for the area, with an expected growth of 6,813 persons to 2041, reflecting a total gain of 23.6% over these years.
Frequently Asked Questions - Population
Development
The level of residential development activity in Beechboro was found to be higher than 90% of real estate markets across the country
Beechboro has averaged approximately 339 new dwelling approvals each year over the past five financial years, totalling 1698 homes. As of FY26159 approvals have been recorded. Over this period, an average of three people per year moved to the area for each new home constructed, indicating strong demand that supports property values. The average construction cost value of these new homes is $206,000, which is below the regional average, suggesting more affordable housing options for buyers.
In FY26, there have been $22.1 million in commercial approvals, demonstrating moderate levels of commercial development. Compared to Greater Perth, Beechboro has slightly more development, with 16.0% above the regional average per person over the five-year period, reflecting strong developer confidence in the location. The majority of new developments consist of detached dwellings (96.0%), with townhouses or apartments making up the remaining 4.0%, preserving the area's low-density nature and attracting space-seeking buyers. With approximately 80 people per approval, Beechboro reflects a developing area.
According to the latest AreaSearch quarterly estimate, Beechboro is projected to add 6184 residents by 2041. At current development rates, new housing supply should comfortably meet demand, providing good conditions for buyers and potentially supporting population growth beyond current projections.
Frequently Asked Questions - Development
Infrastructure
Beechboro has limited levels of nearby infrastructure activity, ranking in the 14thth percentile nationally
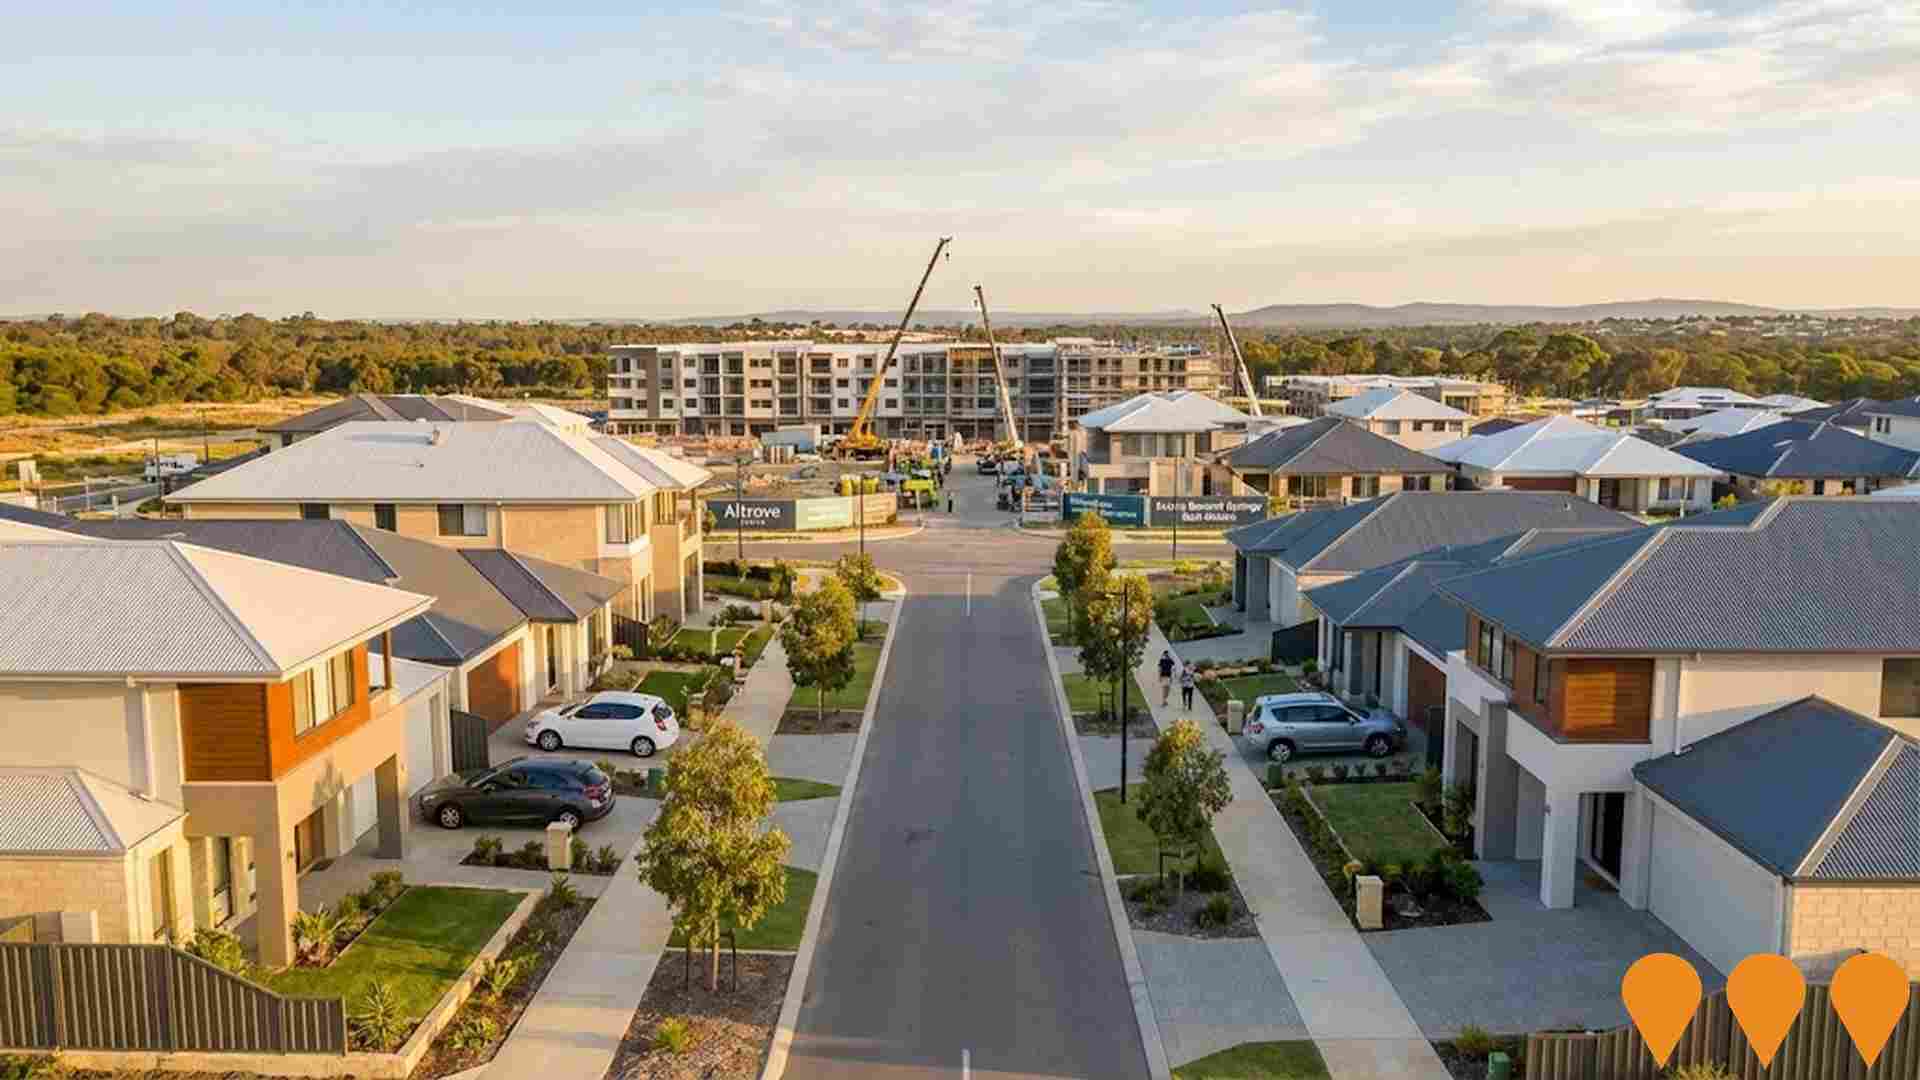
Area's performance is significantly influenced by local infrastructure changes, major projects, and planning initiatives. AreaSearch has identified 47 such projects likely to impact the area. Notable ones include Altrove Estate, Bennett Springs East Structure Plan, Dayton Central developed by LWP Property Group, and St Leonards Private Estate - Dayton Release. The following details those most relevant.
Professional plan users can use the search below to filter and access additional projects.
INFRASTRUCTURE SEARCH
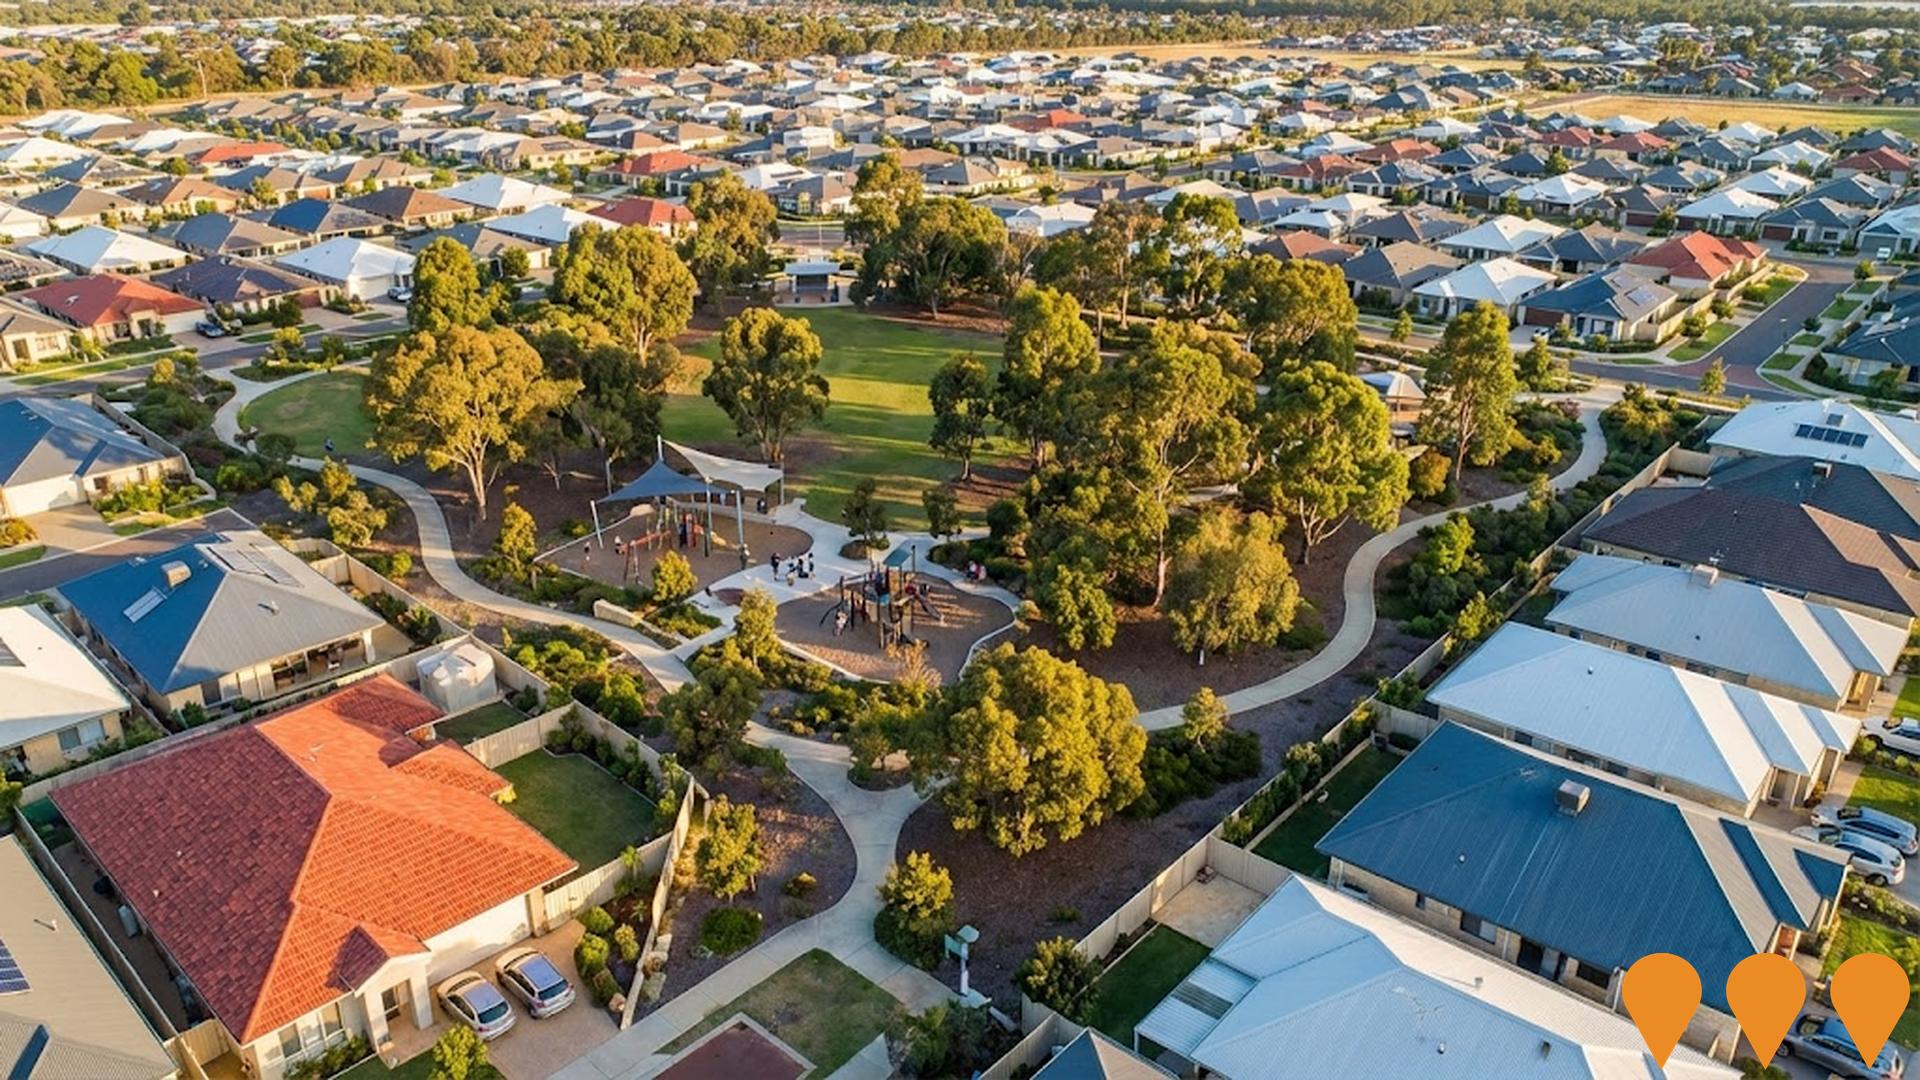
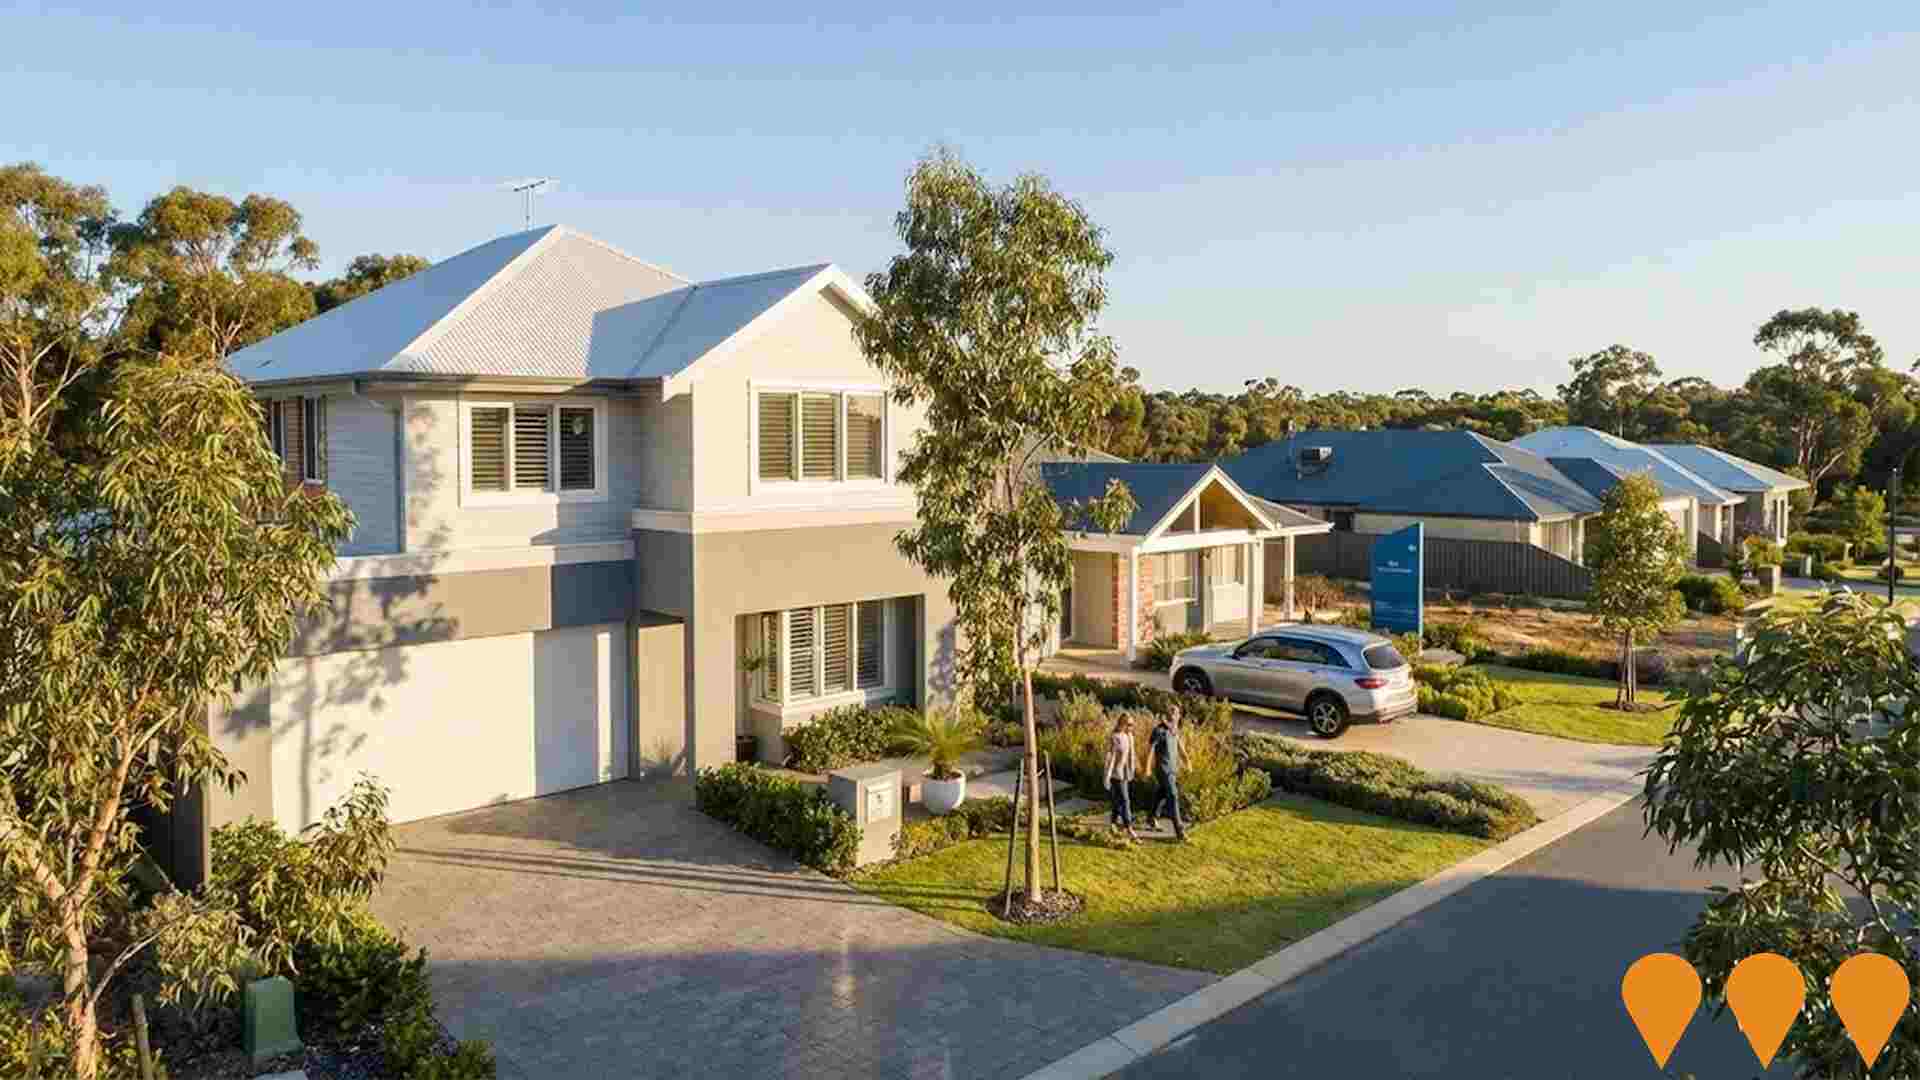
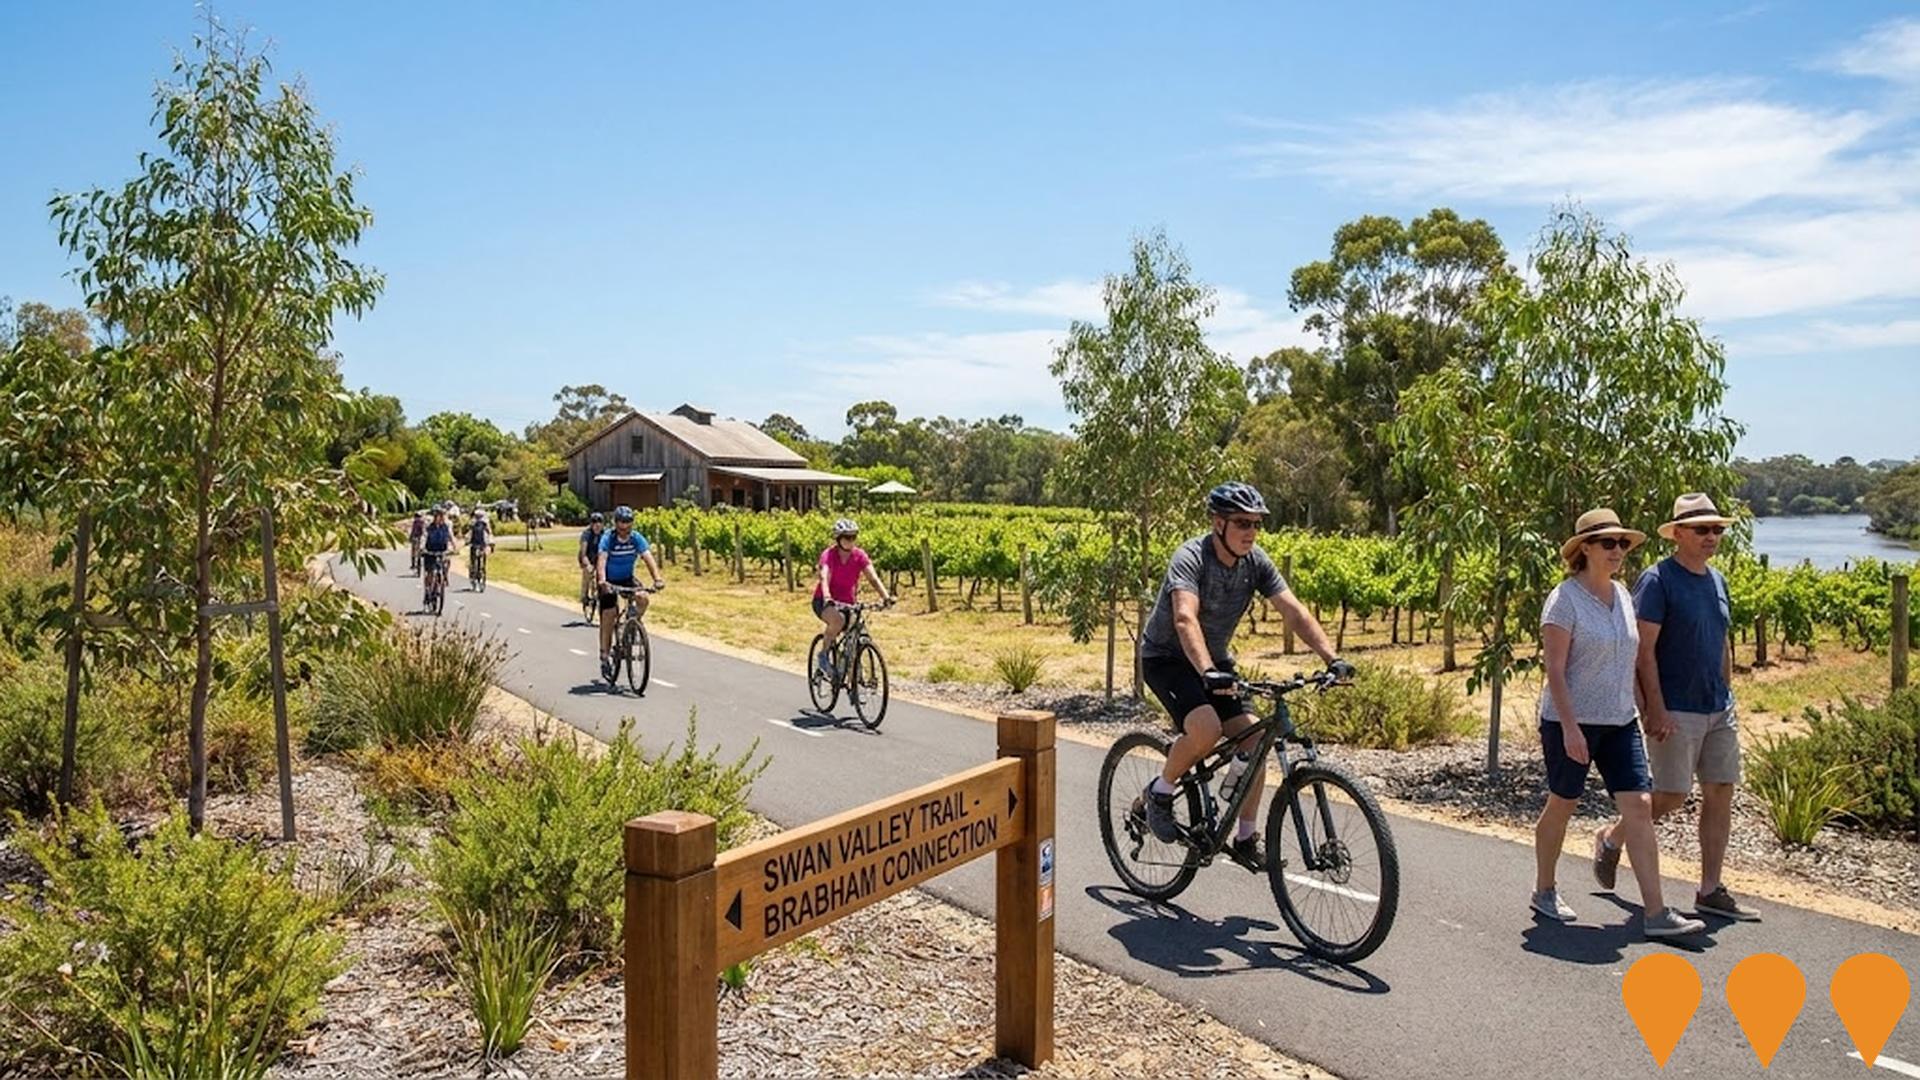
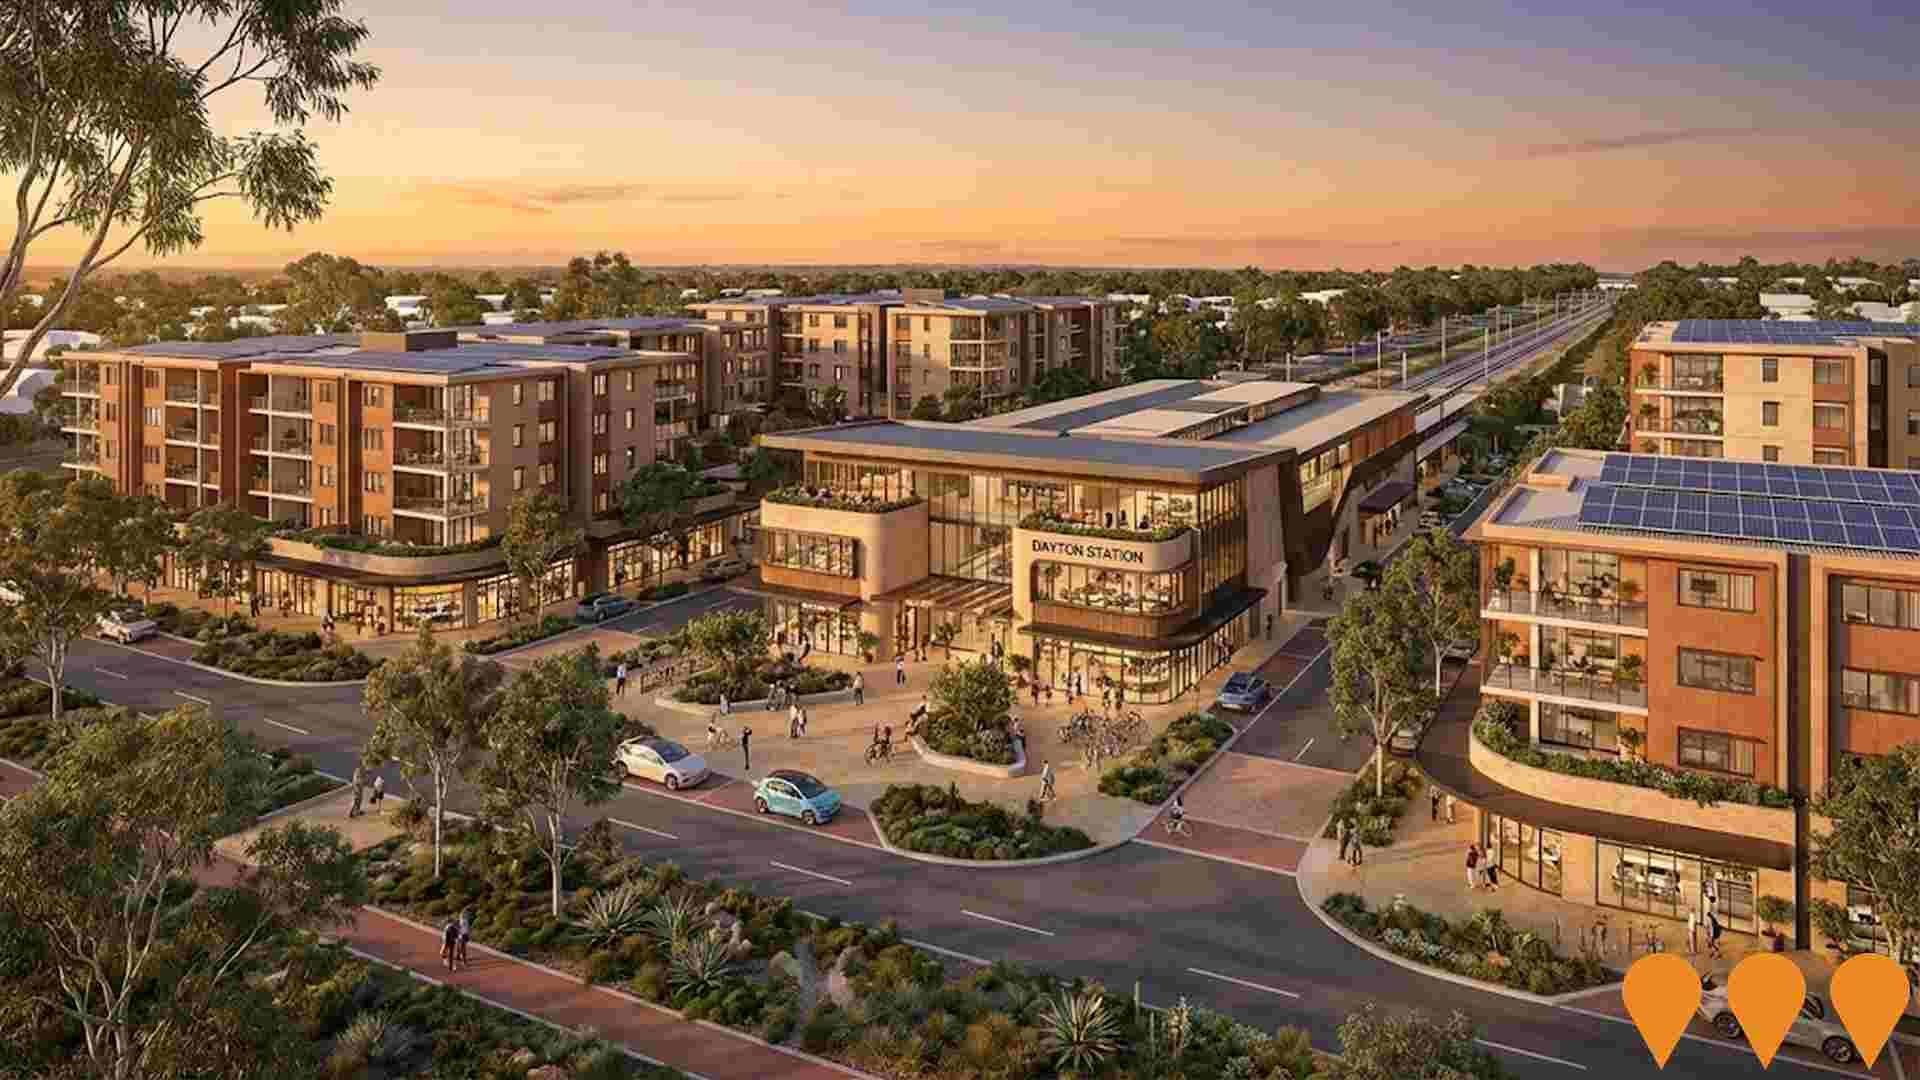
 Denotes AI-based impression for illustrative purposes only, not to be taken as definitive under any circumstances. Please follow links and conduct other investigations from the project's source for actual imagery. Developers and project owners wishing us to use original imagery please Contact Us and we will do so.
Frequently Asked Questions - Infrastructure
Hazelmere Logistics Estate
State-of-the-art logistics and industrial estate strategically positioned for ultimate connectivity. The 90,088sqm development includes multiple warehouse buildings with sustainability features targeting 5-star Green Star ratings. Major tenants include DHL, Inghams, Fisher & Paykel, Bluestar Global Logistics.

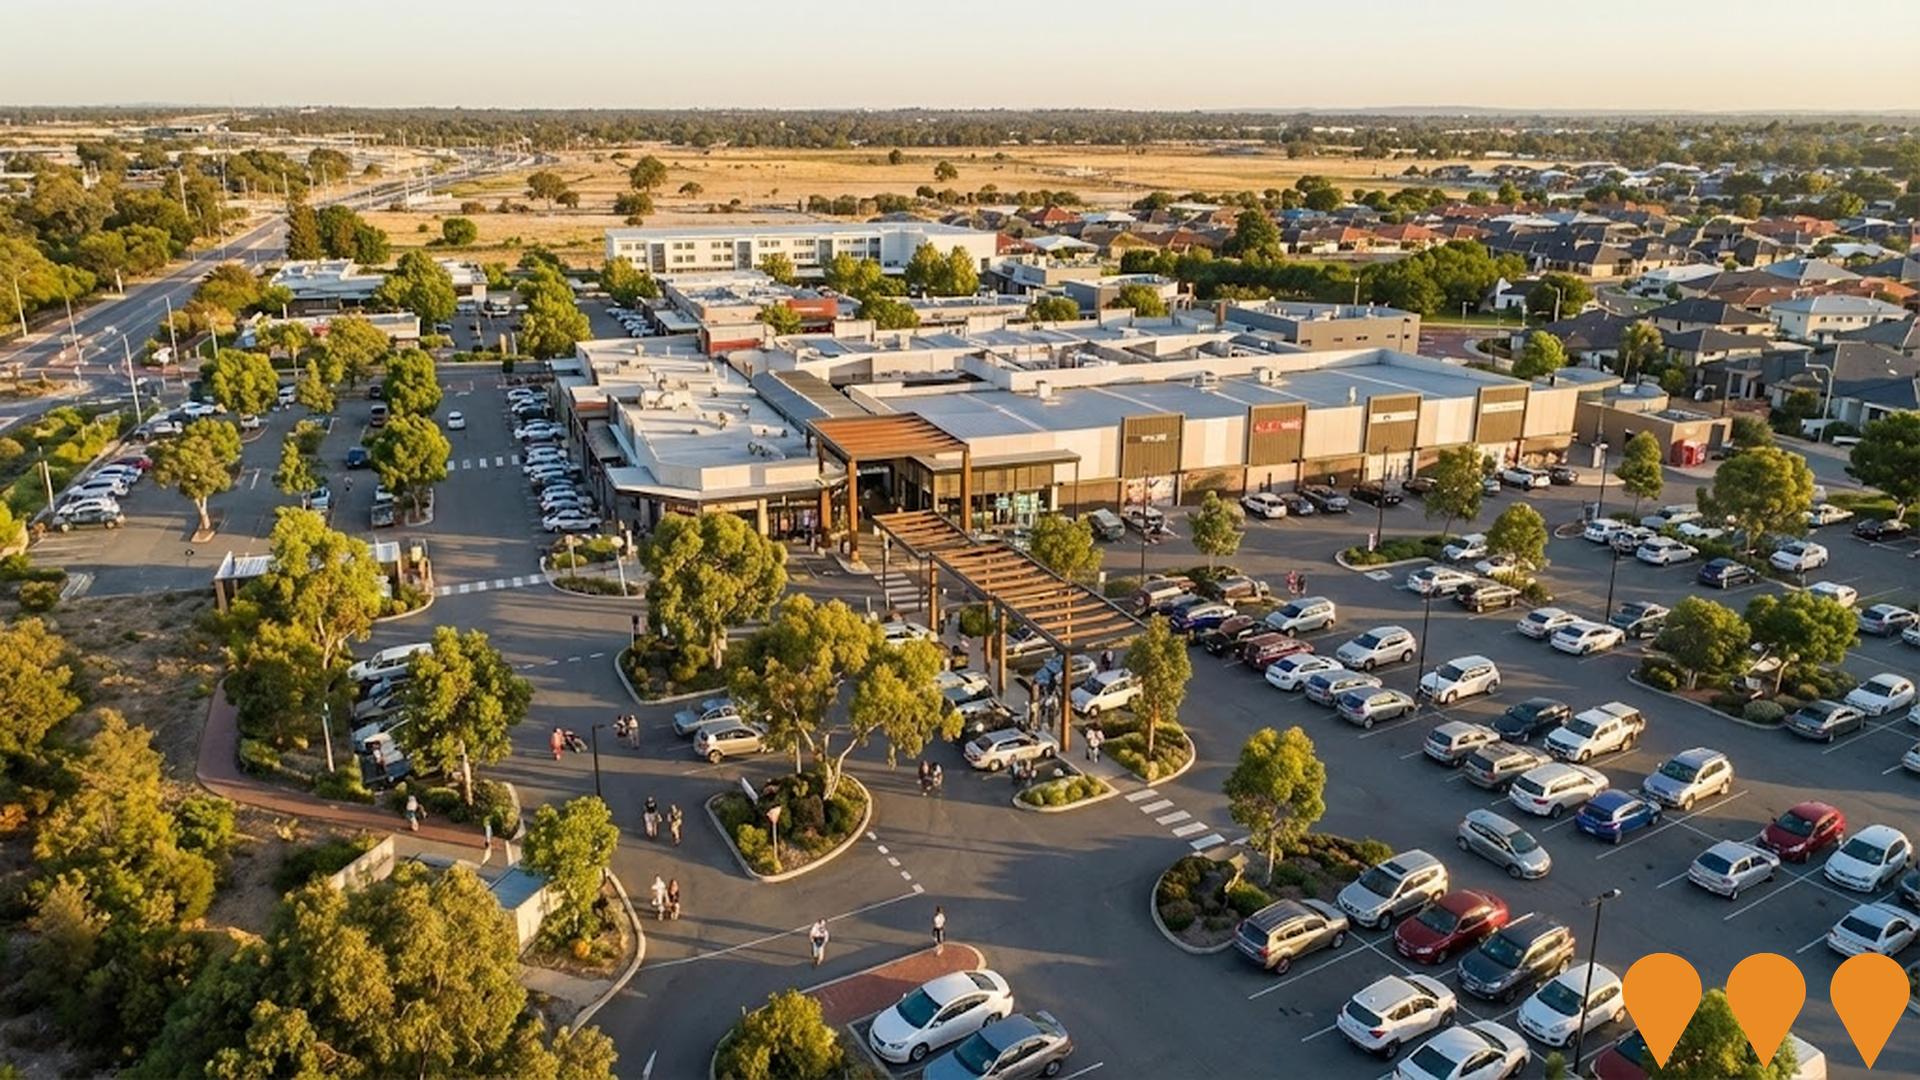
Springs Shopping Centre Expansion
Proposed expansion of the existing Springs Shopping Centre, located at 198 Bennett Springs Drive (formerly identified as Corner Bennett Springs Drive & Beechboro Road North). The initial proposal was for an expansion to include additional specialty retail, a medical centre, and a possible small supermarket, aligning with surrounding residential growth. A recent Development Application (DA-1219/2025) has been received by the City of Swan for a 'Proposed Garden Room Cube' at this address, which may be part of or an amendment to the overall expansion plan. The centre is owned/managed by Erceg Management.

Dayton District Centre (Future Town Centre & Train Station Precinct)
Future mixed-use district centre anchored by Dayton Railway Station (Morley-Ellenbrook Line), planned to include retail, commercial offices, medical, childcare and high-density residential surrounding the station.
Bennett Springs East Station (Future)
Future railway station planned for Bennett Springs East as part of METRONET expansion. Will provide direct access to Perth CBD and major employment centres.
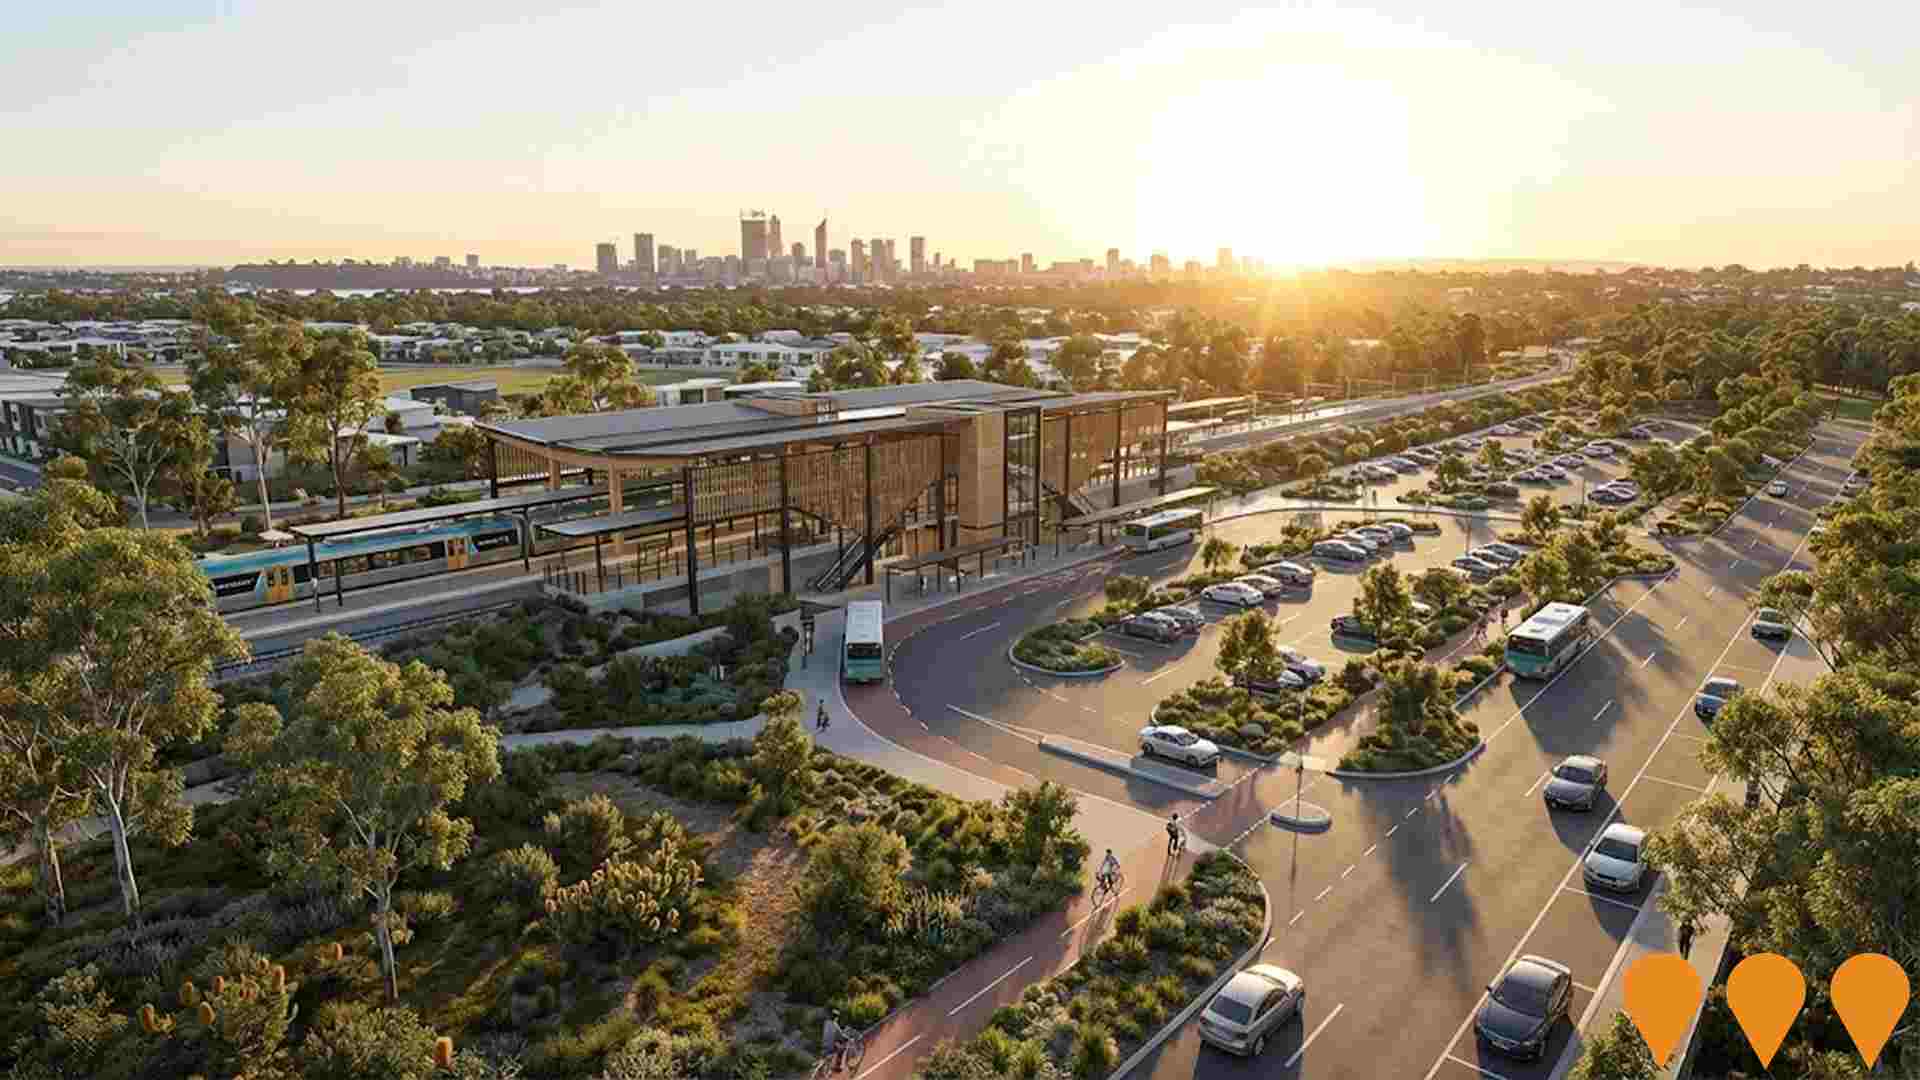
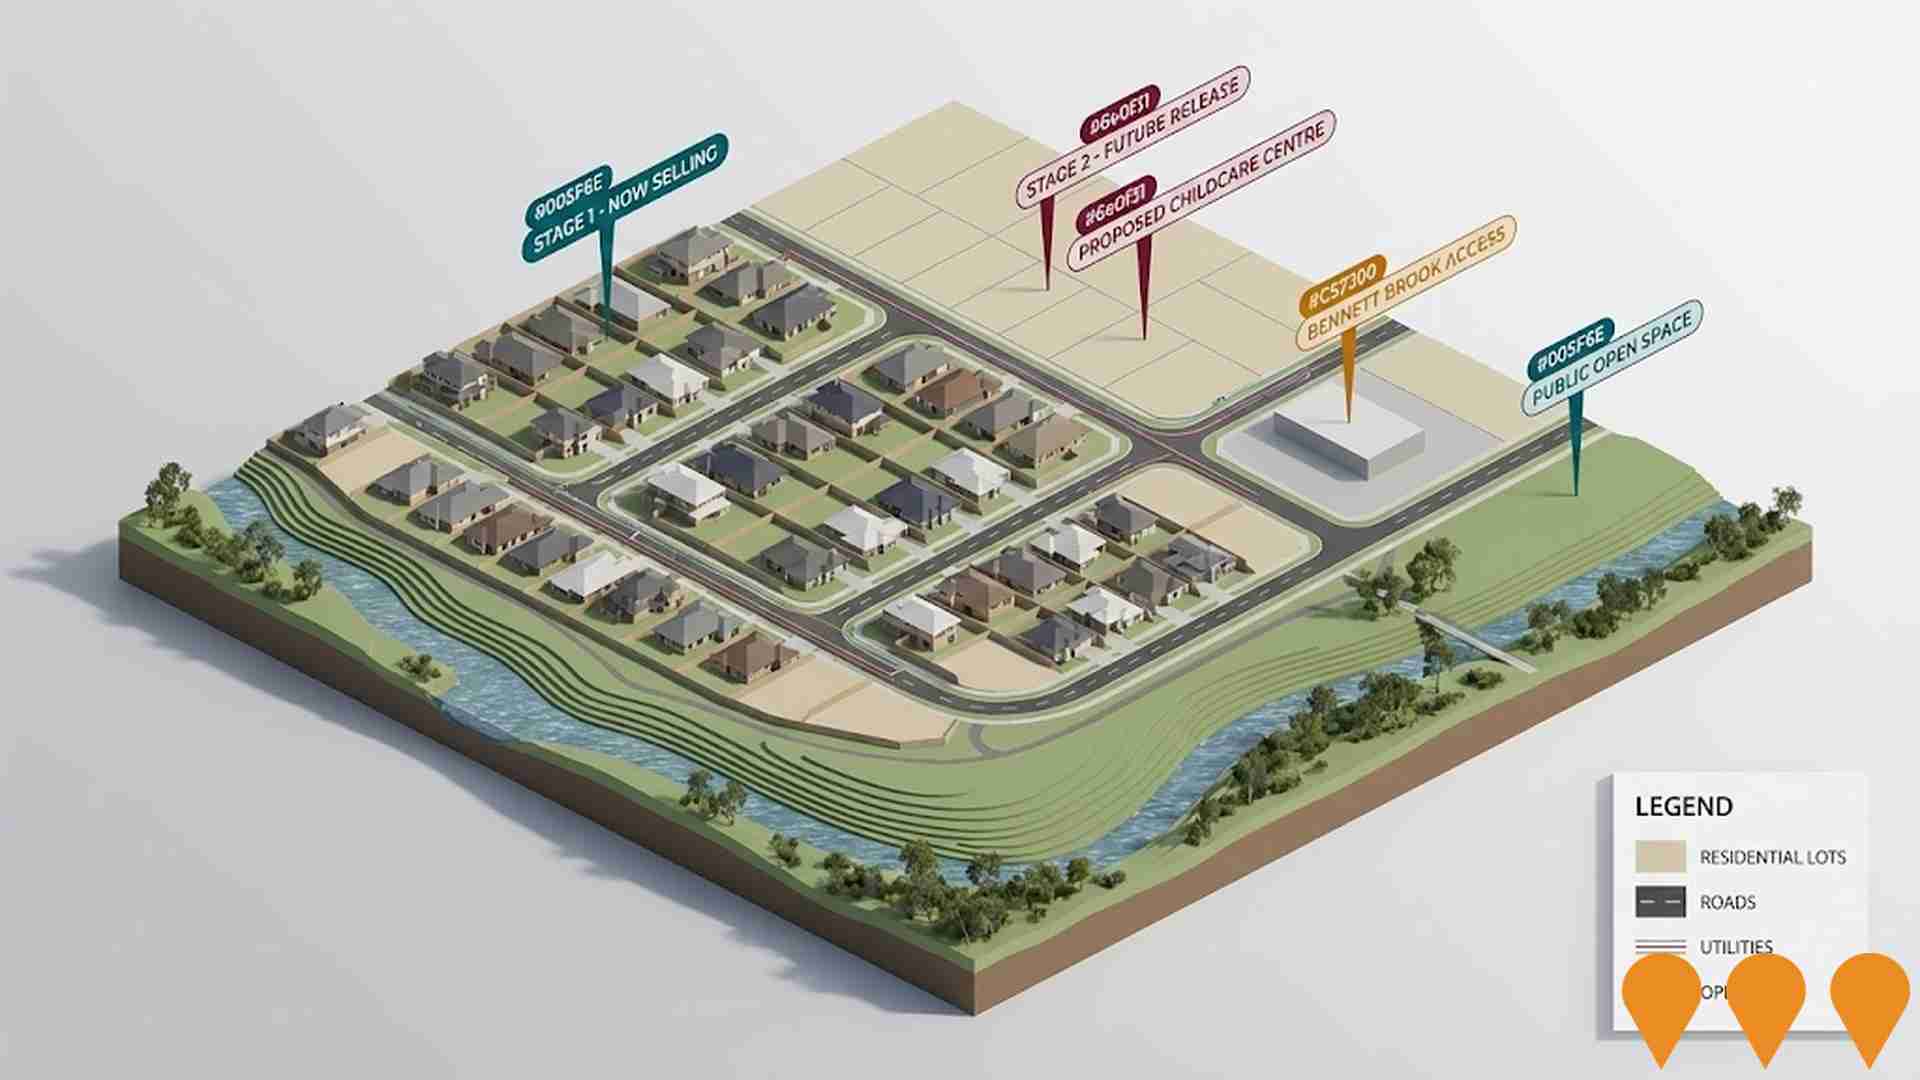
Bennett Springs East Structure Plan
58.77ha residential development by Mirvac providing 676+ dwellings for 1,892+ residents. Includes public open space, wetland buffers, and infrastructure for urban development.
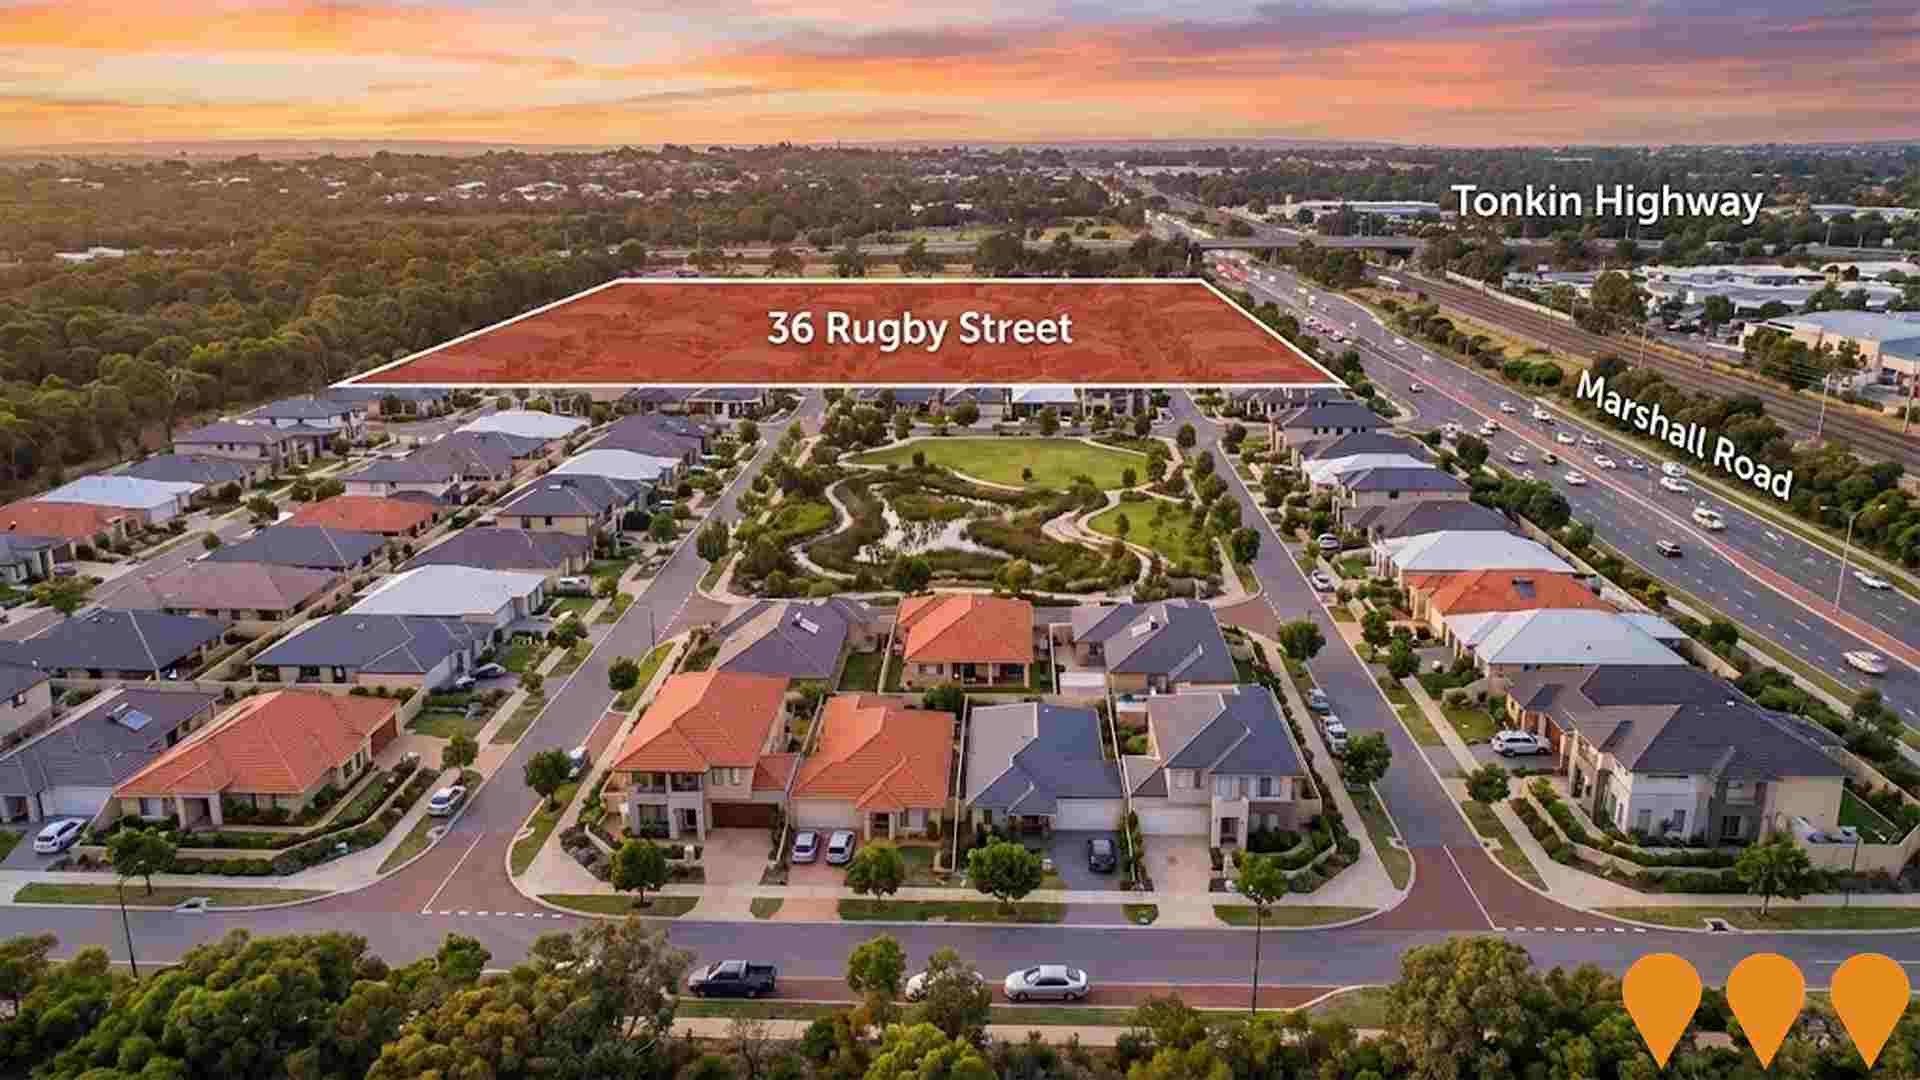
Dayton Central by LWP Property Group
Masterplanned community in Dayton featuring over 800 lots, future local parks, primary school site, and direct connection to the new Dayton Metronet Station precinct.
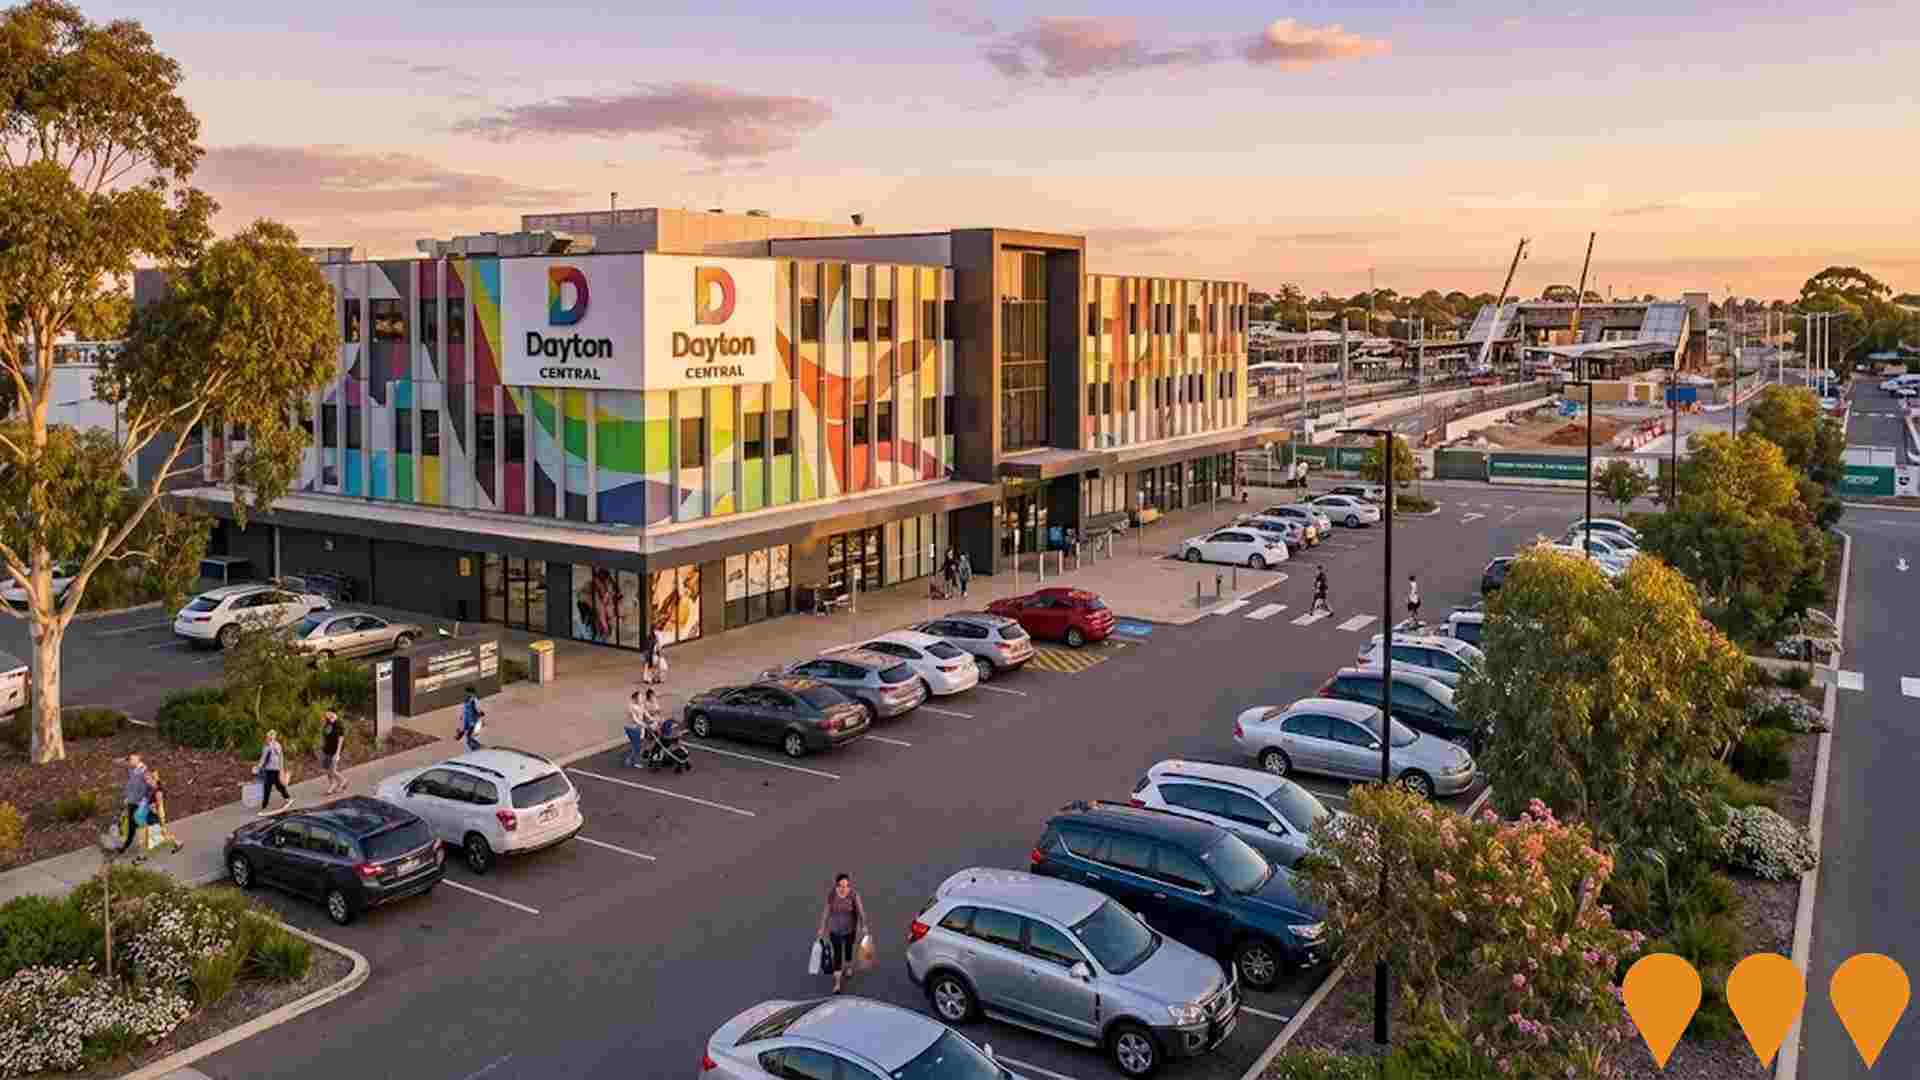
Brabham Senior High School
A new state-of-the-art senior high school in Brabham to accommodate around 1000 students from Years 7 to 10, serving Brabham, Dayton, Henley Brook and surrounding suburbs. Stage 1 is funded at $130 million and will deliver contemporary learning areas, science and technology spaces, a resource centre, performing and physical education facilities, and outdoor sports grounds. The project is currently in the detailed planning and design phase with early contractor involvement awarded, and is intended to ease enrolment pressure on Ellenbrook Secondary College from day one of school in 2028.
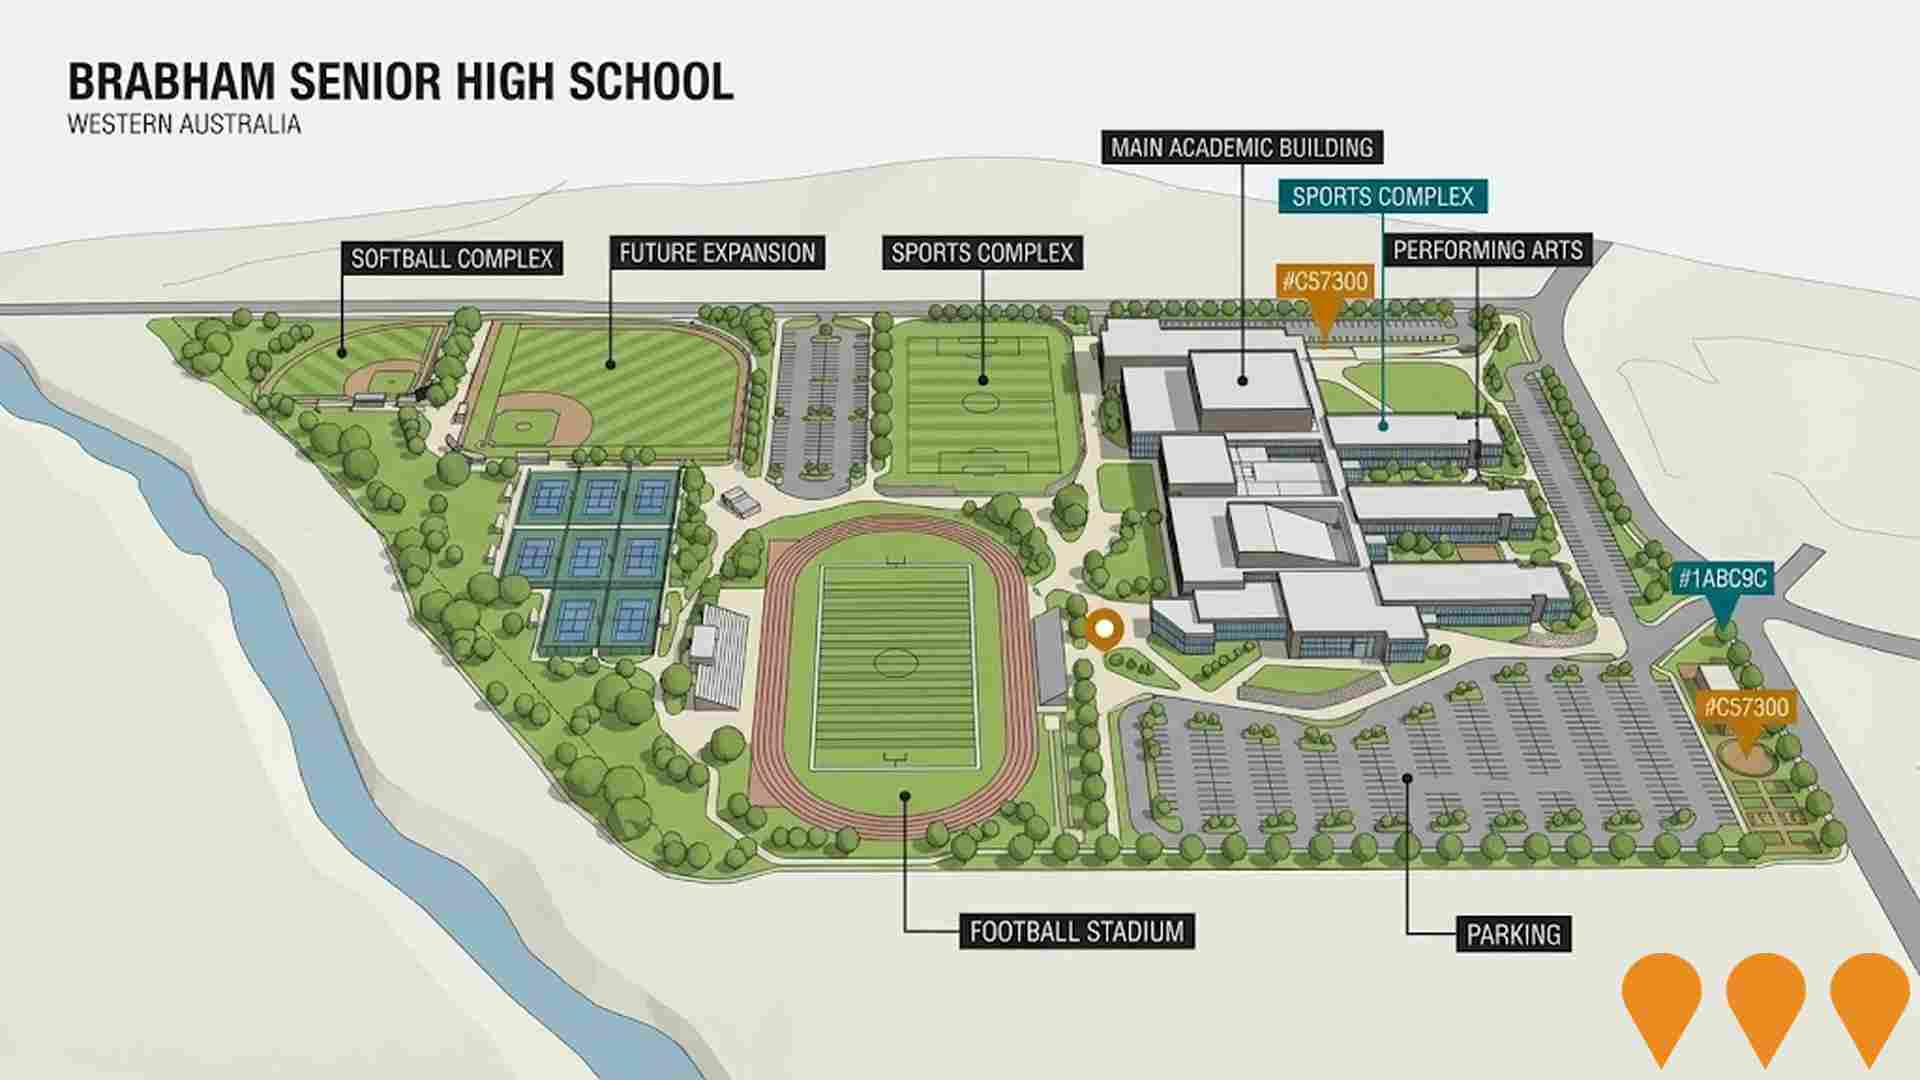
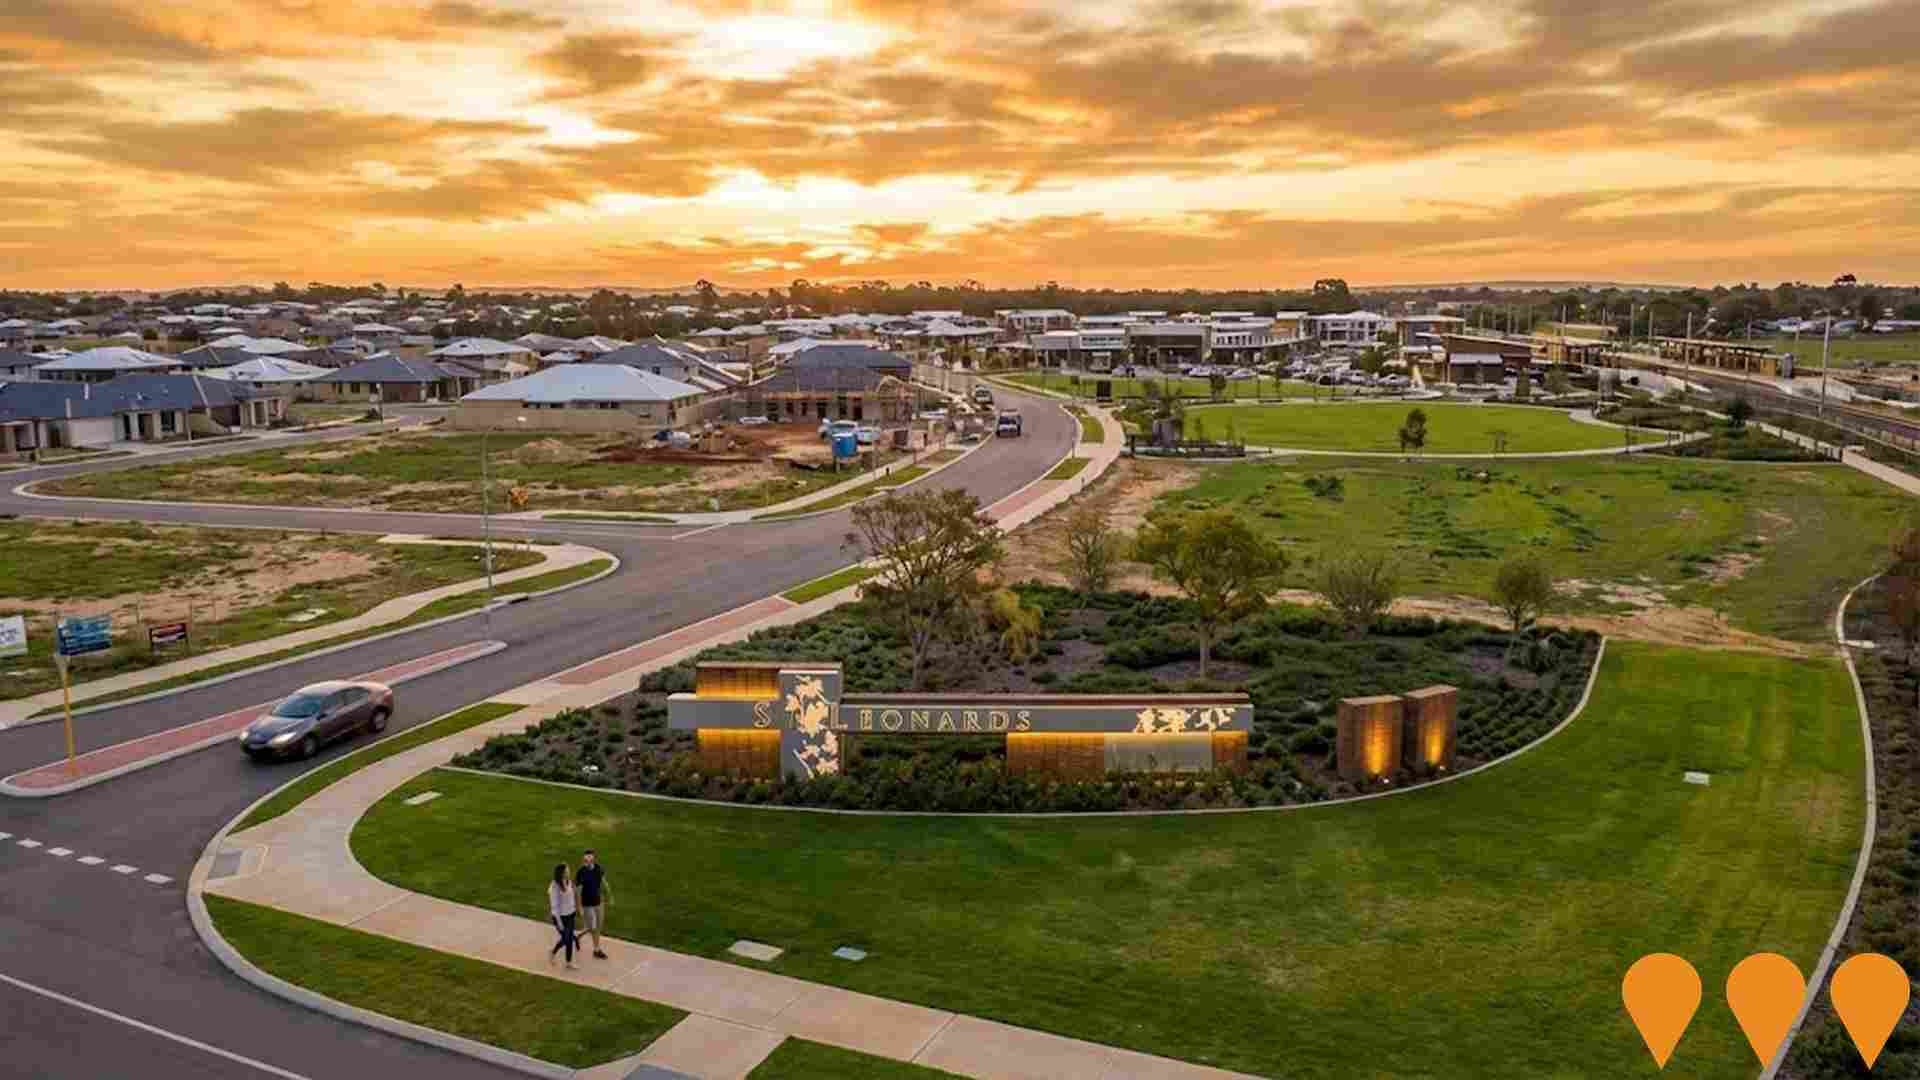
St Leonards Private Estate - Dayton Release
Premium land release within the established St Leonards Private Estate in Dayton, offering large lots within walking distance of the future Dayton train station and town centre.
Employment
Employment conditions in Beechboro remain below the national average according to AreaSearch analysis
Beechboro's workforce is skilled with manufacturing and industrial sectors prominently represented. The unemployment rate was 4.6% in September 2025, with an estimated employment growth of 2.4% over the past year.
There are 14,110 residents employed, while the unemployment rate is 0.6% higher than Greater Perth's rate of 4.0%. Workforce participation is similar to Greater Perth's 65.2%. Employment is concentrated in health care & social assistance, retail trade, and construction. Notably, transport, postal & warehousing has employment levels at 1.6 times the regional average, while education & training has limited presence with 5.9% compared to the regional 9.2%.
The area may offer limited local employment opportunities based on Census data analysis. Between September 2024 and September 2025, employment levels increased by 2.4%, labour force grew by 2.6%, causing unemployment to rise by 0.2 percentage points. In contrast, Greater Perth saw employment rise by 2.9% and unemployment increase marginally. State-level data from 25-Nov-25 shows WA employment contracted by 0.27% (losing 5,520 jobs), with a state unemployment rate of 4.6%, compared to the national rate of 4.3%. National employment forecasts from May-25 indicate an expansion of 6.6% over five years and 13.7% over ten years. Applying these projections to Beechboro's employment mix suggests local employment should increase by 6.0% over five years and 12.8% over ten years.
Frequently Asked Questions - Employment
Income
Income levels align closely with national averages, indicating typical economic conditions for Australian communities according to AreaSearch analysis
The median income among taxpayers in Beechboro SA2 was $54,467 according to ATO data aggregated by AreaSearch for financial year 2022. The average income stood at $63,249 during the same period. These figures compare with Greater Perth's median of $58,380 and average of $78,020 respectively. By September 2025, estimates based on Wage Price Index growth suggest the median income would be approximately $62,201 and the average $72,230. Census data indicates household, family, and personal incomes rank modestly in Beechboro, between the 44th and 52nd percentiles. In terms of income distribution, 39.9% of the population (10,433 individuals) fall within the $1,500 - 2,999 range, consistent with surrounding regions at 32.0%. High housing costs consume 17.0% of income, but strong earnings place disposable income at the 52nd percentile. The area's SEIFA income ranking places it in the 4th decile.
Frequently Asked Questions - Income
Housing
Beechboro is characterized by a predominantly suburban housing profile, with ownership patterns similar to the broader region
Beechboro's dwelling structure, as per the latest Census, consisted of 93.3% houses and 6.7% other dwellings. This compares to Perth metro's 89.1% houses and 10.9% other dwellings. Home ownership in Beechboro was 22.2%, similar to Perth metro's level. Mortgaged dwellings were at 55.7% and rented ones at 22.1%. The median monthly mortgage repayment in Beechboro was $1,765, lower than Perth metro's $1,842. Median weekly rent in Beechboro was $350, slightly higher than Perth metro's $340. Nationally, Beechboro's mortgage repayments were below the Australian average of $1,863 and rents were less than the national figure of $375.
Frequently Asked Questions - Housing
Household Composition
Beechboro features high concentrations of family households, with a higher-than-average median household size
Family households constitute 77.9% of all households, including 41.8% couples with children, 21.8% couples without children, and 12.8% single parent families. Non-family households account for the remaining 22.1%, with lone person households at 19.1% and group households comprising 3.0%. The median household size is 2.9 people, which is larger than the Greater Perth average of 2.8.
Frequently Asked Questions - Households
Local Schools & Education
Beechboro shows below-average educational performance compared to national benchmarks, though pockets of achievement exist
In Beechboro Trail, as of a recent report, 20.7% of residents aged 15 and above hold university degrees, compared to Australia's 30.4%. Bachelor degrees are the most common at 15.2%, followed by postgraduate qualifications (3.9%) and graduate diplomas (1.6%). Vocational credentials are held by 35.6% of residents aged 15 and above, with advanced diplomas at 10.4% and certificates at 25.2%. Educational participation is high, with 32.1% currently enrolled in formal education.
This includes 11.7% in primary education, 8.3% in secondary education, and 5.0% pursuing tertiary education.
Frequently Asked Questions - Education
Schools Detail
Nearby Services & Amenities
Transport
Transport servicing is moderate compared to other areas nationally based on assessment of service frequency, route connectivity and accessibility
The analysis of public transport in Beechboro shows that there are currently 132 active transport stops operating. These include both train and bus services. There are 15 individual routes servicing these stops, which collectively provide a total of 3,099 weekly passenger trips.
The accessibility of the transport network is rated as good, with residents typically located an average of 232 meters from their nearest transport stop. On average, there are approximately 442 trips per day across all routes, equating to around 23 weekly trips per individual stop.
Frequently Asked Questions - Transport
Transport Stops Detail
Health
Beechboro's residents boast exceedingly positive health performance metrics with both young and old age cohorts seeing low prevalence of common health conditions
Beechboro demonstrates favourable health outcomes across various age groups. Both younger and older residents show low prevalence of common health conditions.
Private health cover stands at approximately 51% of Beechboro's total population (~13,388 people), slightly lower than Greater Perth's average of 54.1%. The most prevalent medical conditions are asthma (6.7%) and mental health issues (6.2%). A significant majority, 76.1%, report no medical ailments, compared to 72.6% in Greater Perth. Beechboro has a lower proportion of residents aged 65 and over at 10.7% (2,792 people), compared to Greater Perth's 12.6%. Despite this, health outcomes among seniors align with the general population's health profile.
Frequently Asked Questions - Health
Cultural Diversity
Beechboro is among the most culturally diverse areas in the country based on AreaSearch assessment of a range of language and cultural background related metrics
Beechboro has a high level of cultural diversity, with 41.9% of its population speaking a language other than English at home and 44.4% born overseas. Christianity is the main religion in Beechboro, making up 41.9% of people there, compared to the Greater Perth average of 38.5%. The most notable overrepresentation is in the 'Other' religious category, comprising 4.0% of Beechboro's population, higher than the regional average of 2.4%.
In terms of ancestry, the top three groups are Other (20.6%), English (19.5%), and Australian (18.3%). Filipino, Vietnamese, and Indian ethnic groups are notably overrepresented in Beechboro compared to Greater Perth: Filipino at 4.0% vs 2.4%, Vietnamese at 3.7% vs 1.6%, and Indian at 6.7% vs 3.5%.
Frequently Asked Questions - Diversity
Age
Beechboro hosts a young demographic, positioning it in the bottom quartile nationwide
Beechboro's median age is 34 years, which is lower than Greater Perth's average of 37 and Australia's average of 38 years. Compared to Greater Perth, Beechboro has a higher percentage of residents aged 35-44 (17.3%) but fewer residents aged 75-84 (2.9%). Between the 2021 Census and the present day, the 35-44 age group has increased from 16.3% to 17.3%, while the 25-34 age group has decreased from 16.8% to 16.0%. By 2041, population forecasts indicate significant demographic changes in Beechboro. The 45-54 age cohort is projected to grow by 50%, adding 1,525 residents to reach a total of 4,606. Meanwhile, the 0-4 age cohort is expected to grow by only 7%, an increase of 121 people.
