Chart Color Schemes
This analysis uses ABS Statistical Areas Level 2 (SA2) boundaries, which can materially differ from Suburbs and Localities (SAL) even when sharing similar names.
SA2 boundaries are defined by the Australian Bureau of Statistics and are designed to represent communities for statistical reporting (e.g., census and ERP).
Suburbs and Localities (SAL) represent commonly-used suburb/locality names (postal-style areas) and may use different geographic boundaries. For comprehensive analysis, consider reviewing both boundary types if available.
est. as @ -- *
ABS ERP | -- people | --
2021 Census | -- people
Sales Activity
Curious about local property values? Filter the chart to assess the volume and appreciation (including resales) trends and regional comparisons, or scroll to the map below view this information at an individual property level.
Find a Recent Sale
Sales Detail
Population
Population growth drivers in Morley are slightly above average based on AreaSearch's ranking of recent, and medium term trends
As of November 2025, Morley's population is approximately 25,038, indicating a growth of 2,324 people since the 2021 Census. The 2021 Census recorded a population of 22,714 in Morley. This increase is inferred from the estimated resident population of 24,986 as of June 2024 and an additional 97 validated new addresses since the Census date. This results in a population density ratio of 2,373 persons per square kilometer, placing Morley in the upper quartile relative to national locations assessed by AreaSearch. Morley's growth rate of 10.2% since the 2021 census exceeds the national average of 8.9%. Overseas migration contributed approximately 77.9% of overall population gains during recent periods, driving primary growth in the area.
AreaSearch is adopting ABS/Geoscience Australia projections for each SA2 area, released in 2024 with a base year of 2022. For areas not covered by this data and to estimate post-2032 growth, AreaSearch utilises growth rates by age cohort provided by the ABS in its latest Greater Capital Region projections (released in 2023, based on 2022 data). Future population projections indicate an above median growth for statistical areas across the nation. Morley is expected to increase by 3,872 persons to 2041, reflecting a total gain of 15.2% over the 17-year period.
Frequently Asked Questions - Population
Development
AreaSearch assessment of residential development activity positions Morley among the top 25% of areas assessed nationwide
Morley has averaged approximately 126 new dwelling approvals annually. Over the past five financial years, from FY-21 to FY-25, a total of 633 homes were approved, with an additional 44 approved so far in FY-26. On average, each dwelling constructed over these five years has resulted in three new residents arriving per year.
This high demand coupled with limited supply typically leads to price growth and increased buyer competition. The average development value of new dwellings in Morley is $223,000, which is below the regional average, indicating more affordable housing options for buyers. In FY-26 alone, there have been $62.7 million in commercial approvals, reflecting robust local commercial activity.
Compared to Greater Perth, Morley has a slightly higher level of development, with 32.0% above the regional average per person over the five-year period, maintaining good buyer choice while supporting existing property values. Recent construction comprises 75.0% detached dwellings and 25.0% townhouses or apartments, preserving the area's traditional suburban character with a focus on family homes. With approximately 216 people per approval, Morley reflects a transitioning market. By 2041, it is projected that Morley will grow by 3,815 residents, according to the latest AreaSearch quarterly estimate. Current development appears well-aligned with future needs, suggesting steady market conditions without excessive price pressure.
Frequently Asked Questions - Development
Infrastructure
Morley has emerging levels of nearby infrastructure activity, ranking in the 20thth percentile nationally
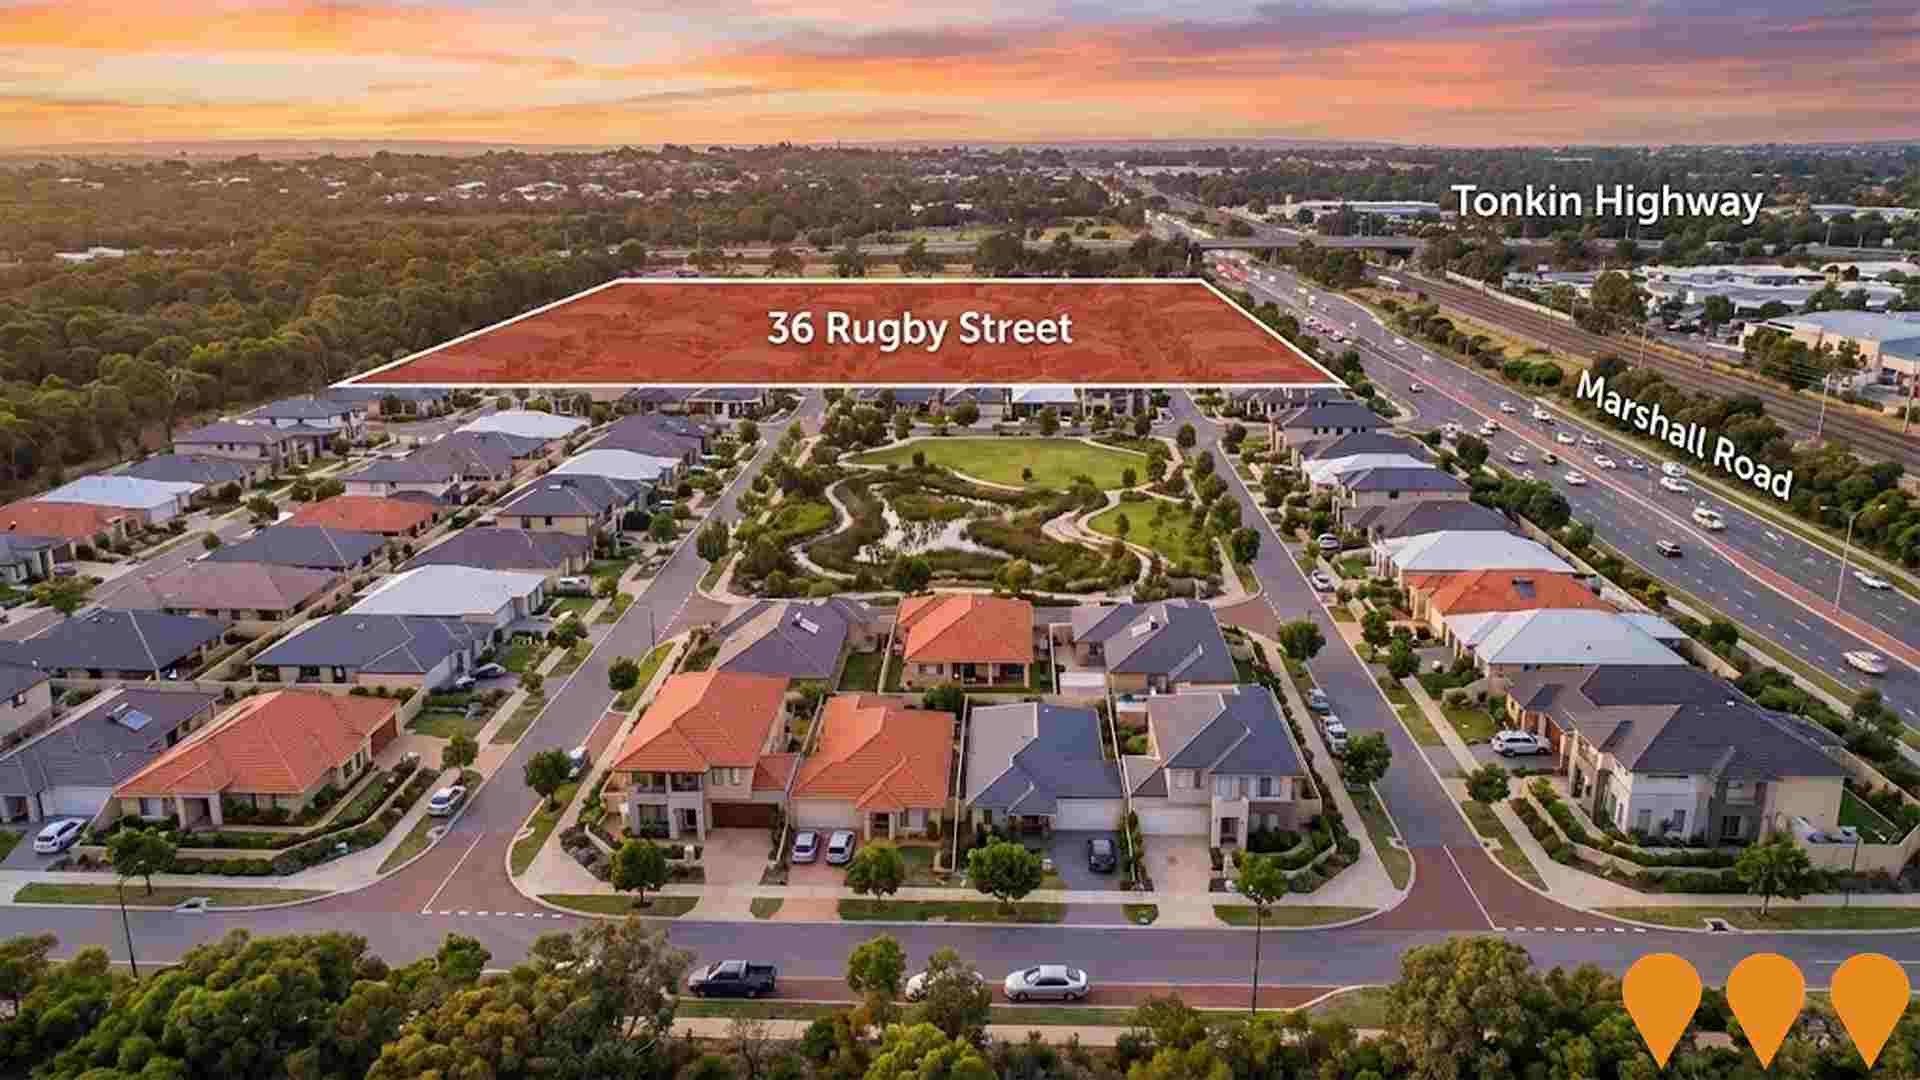
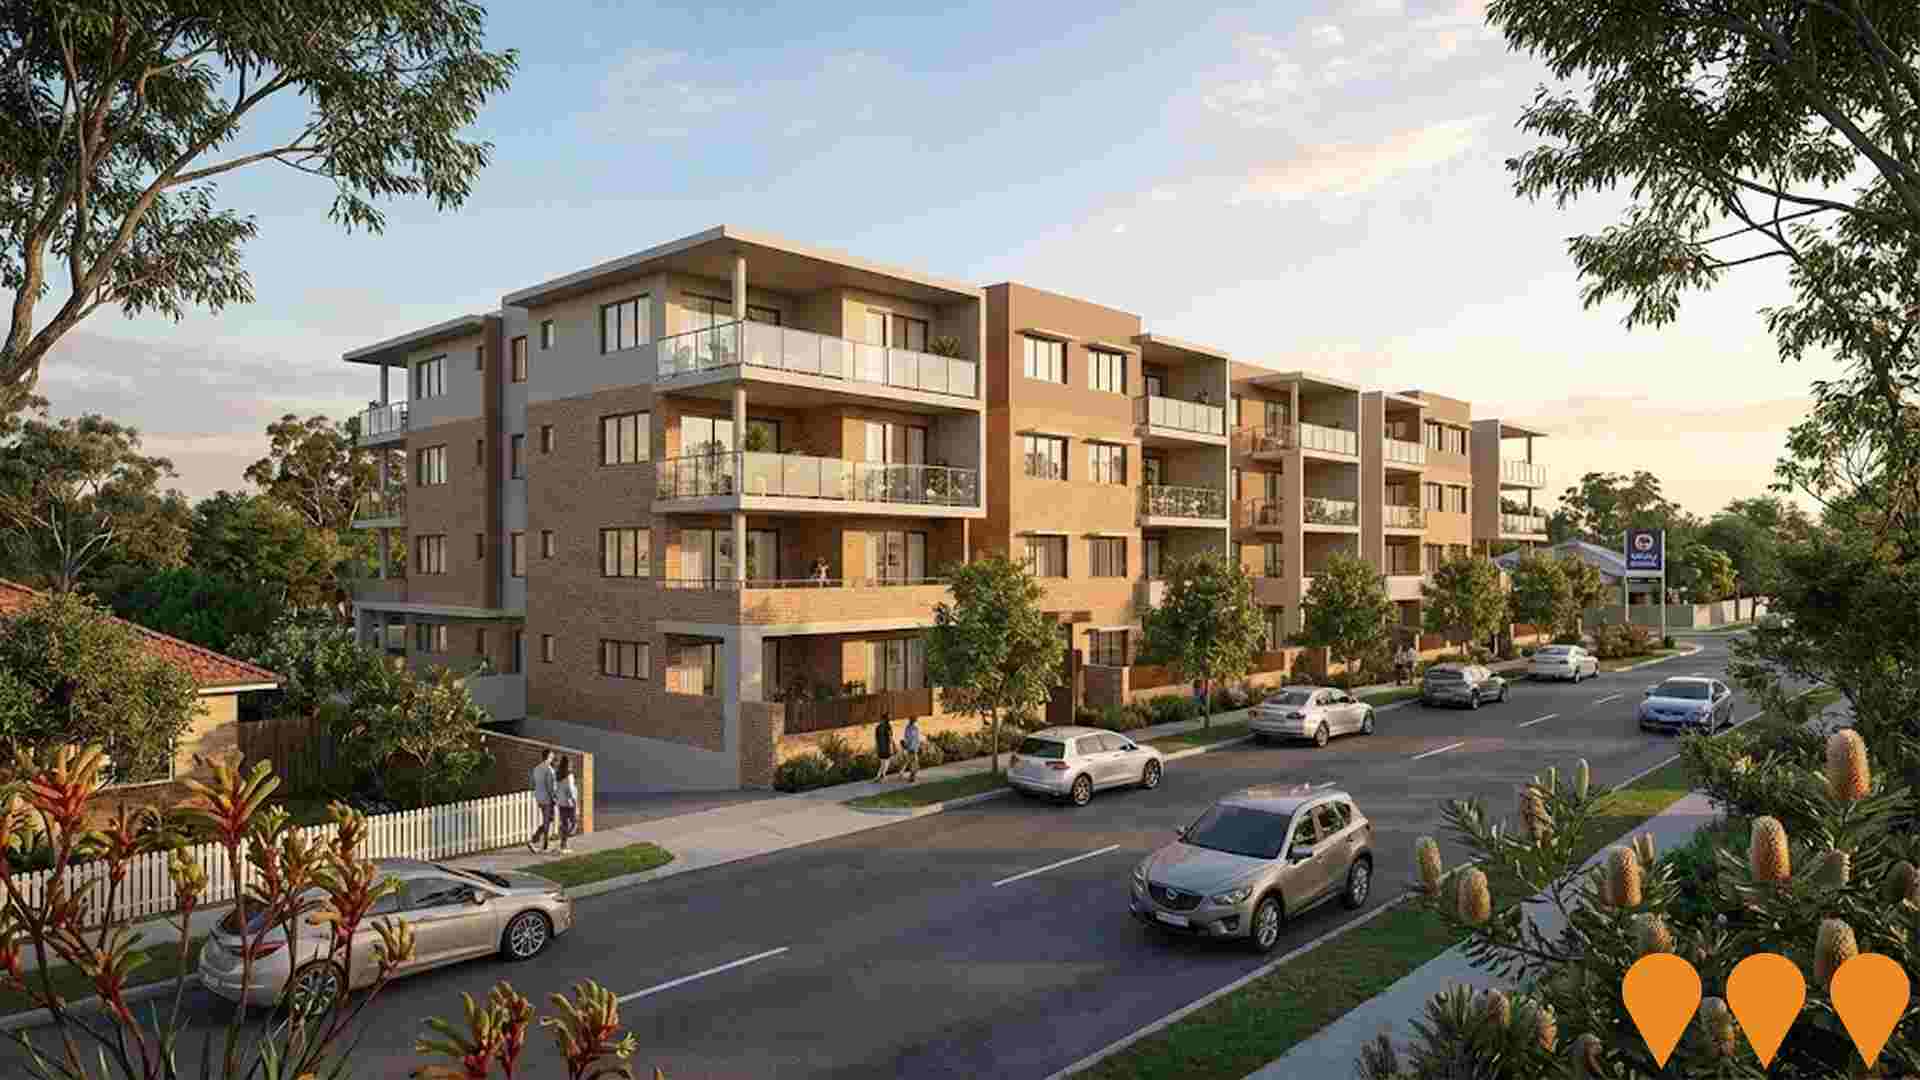
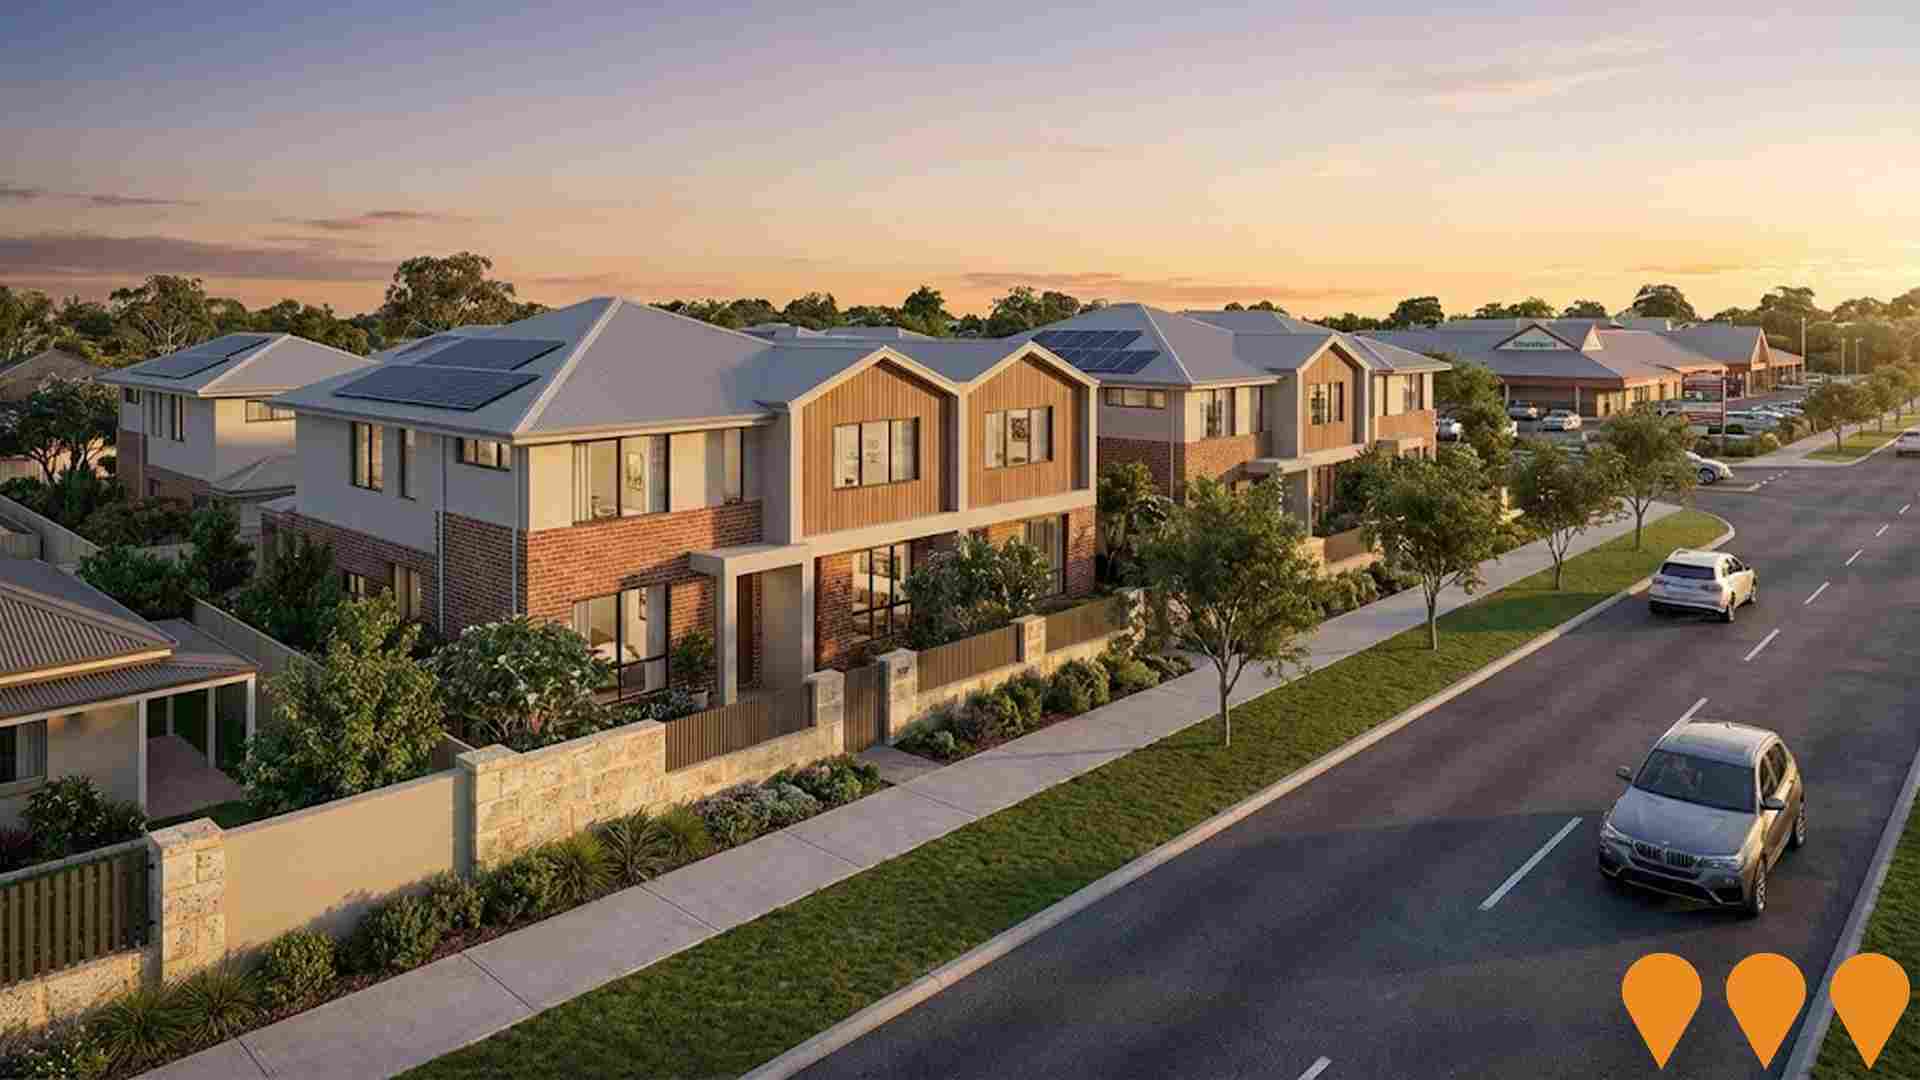
The performance of an area can be significantly influenced by changes to local infrastructure, major projects, and planning initiatives. AreaSearch has identified a total of 23 such projects that are likely to impact the area. Notable among these are the Morley Galleria Shopping Centre Redevelopment, Beechboro Road South Mixed Use Development, Les Hansman Community Centre Redevelopment, and the 55 Vera Street Morley Apartments. The following list details those projects considered most relevant.
Professional plan users can use the search below to filter and access additional projects.
INFRASTRUCTURE SEARCH
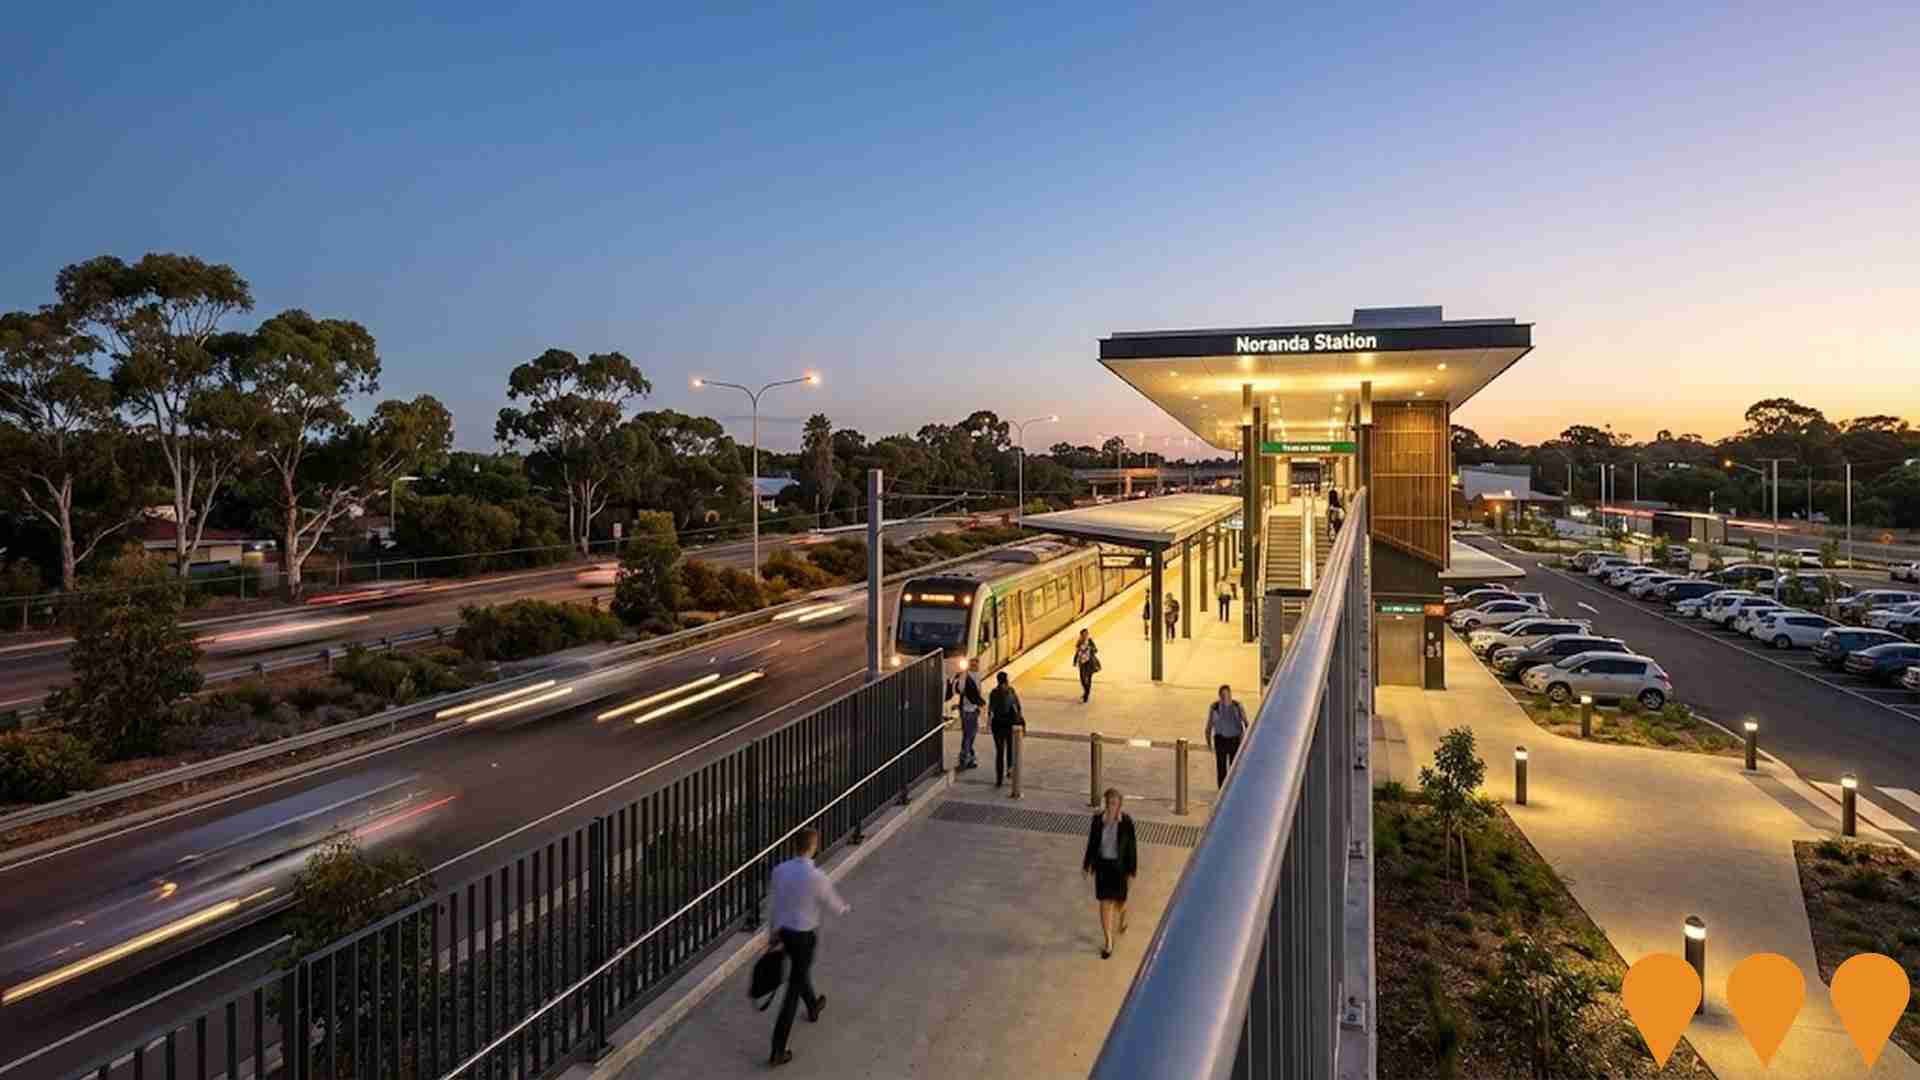
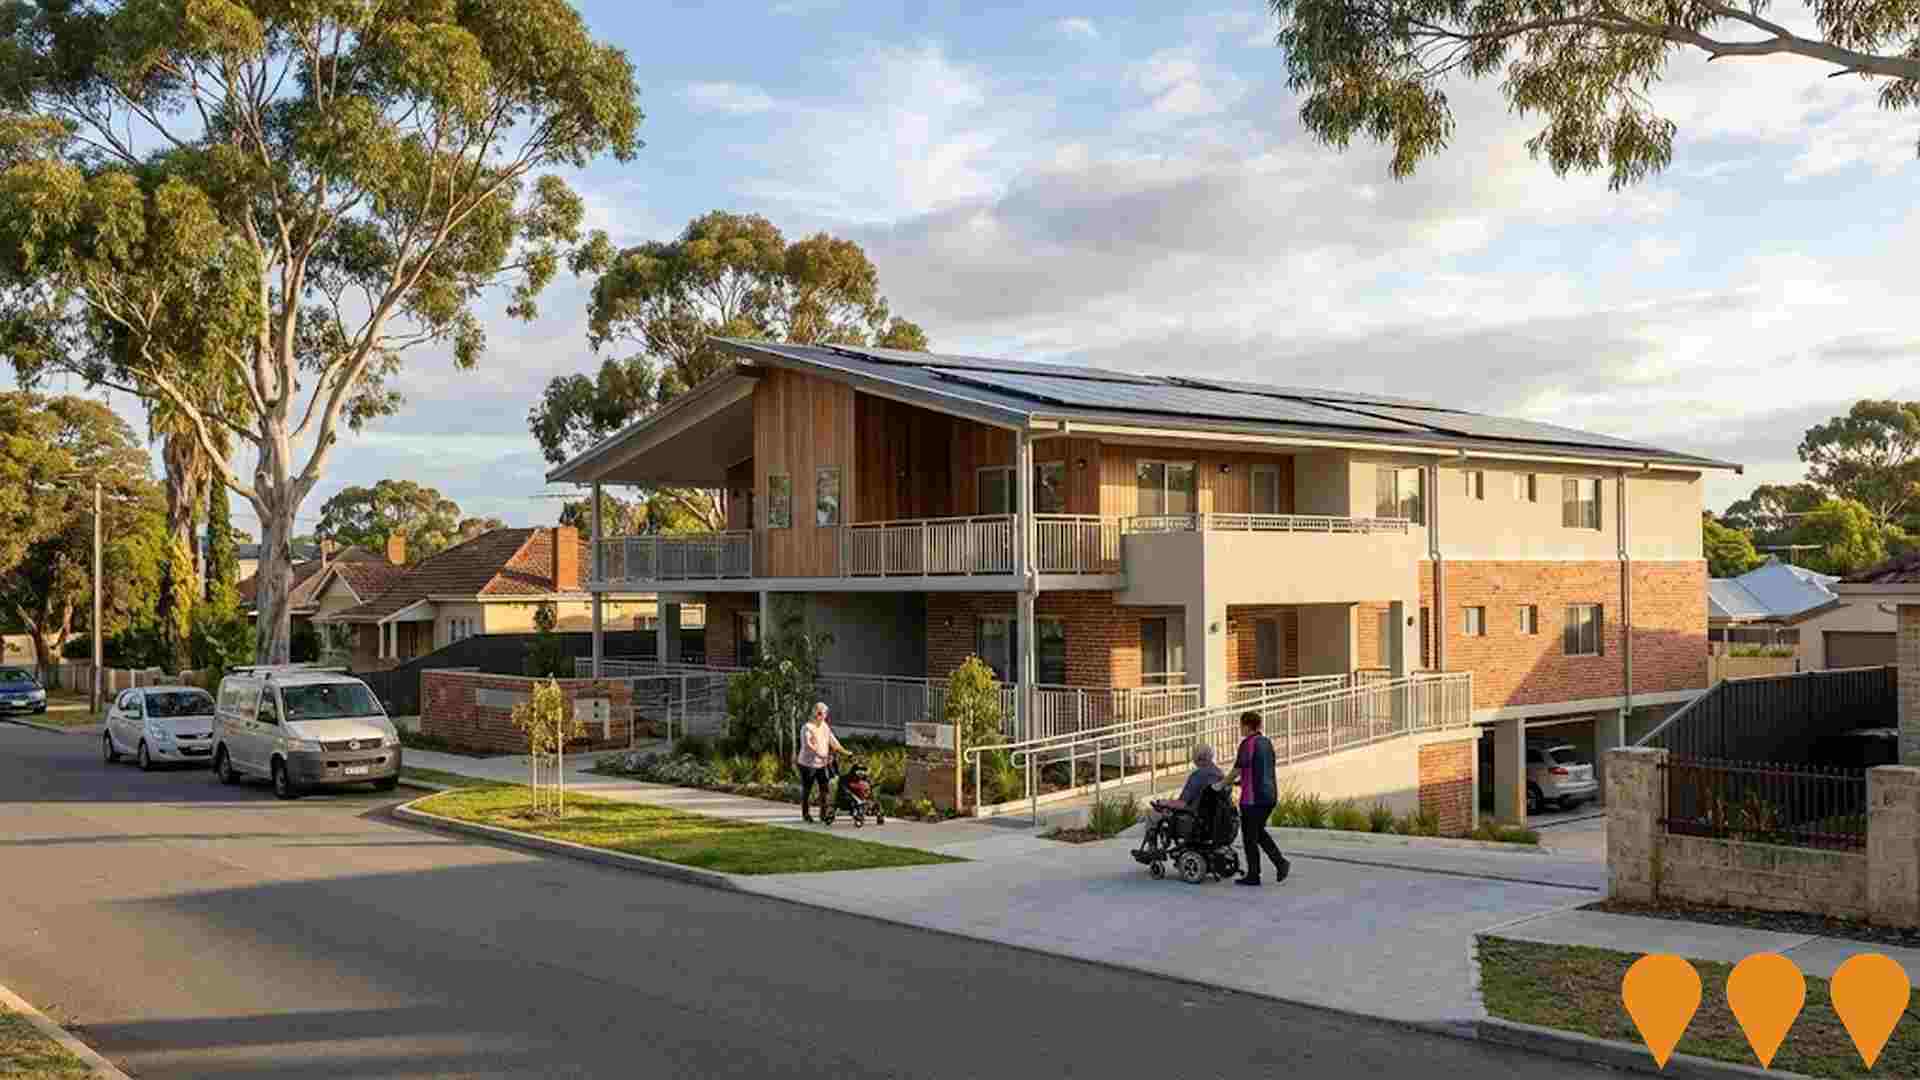
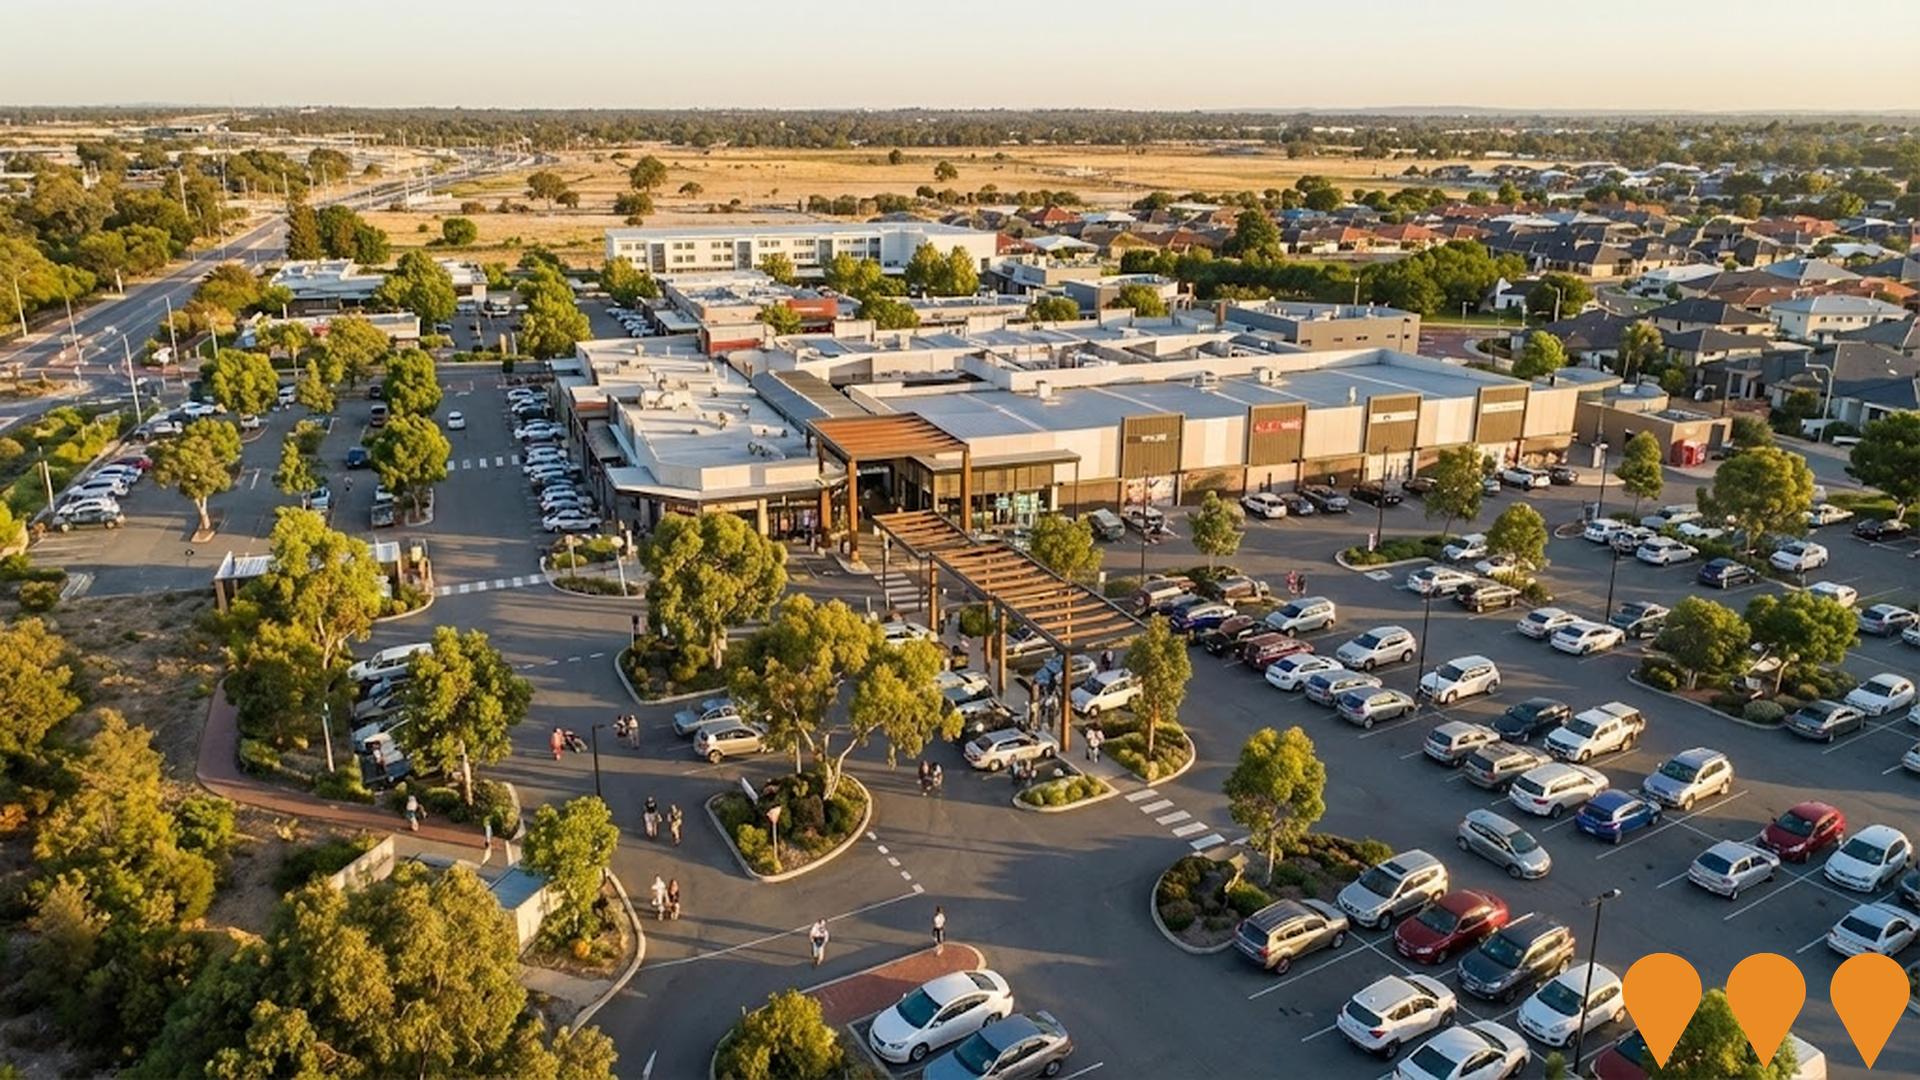
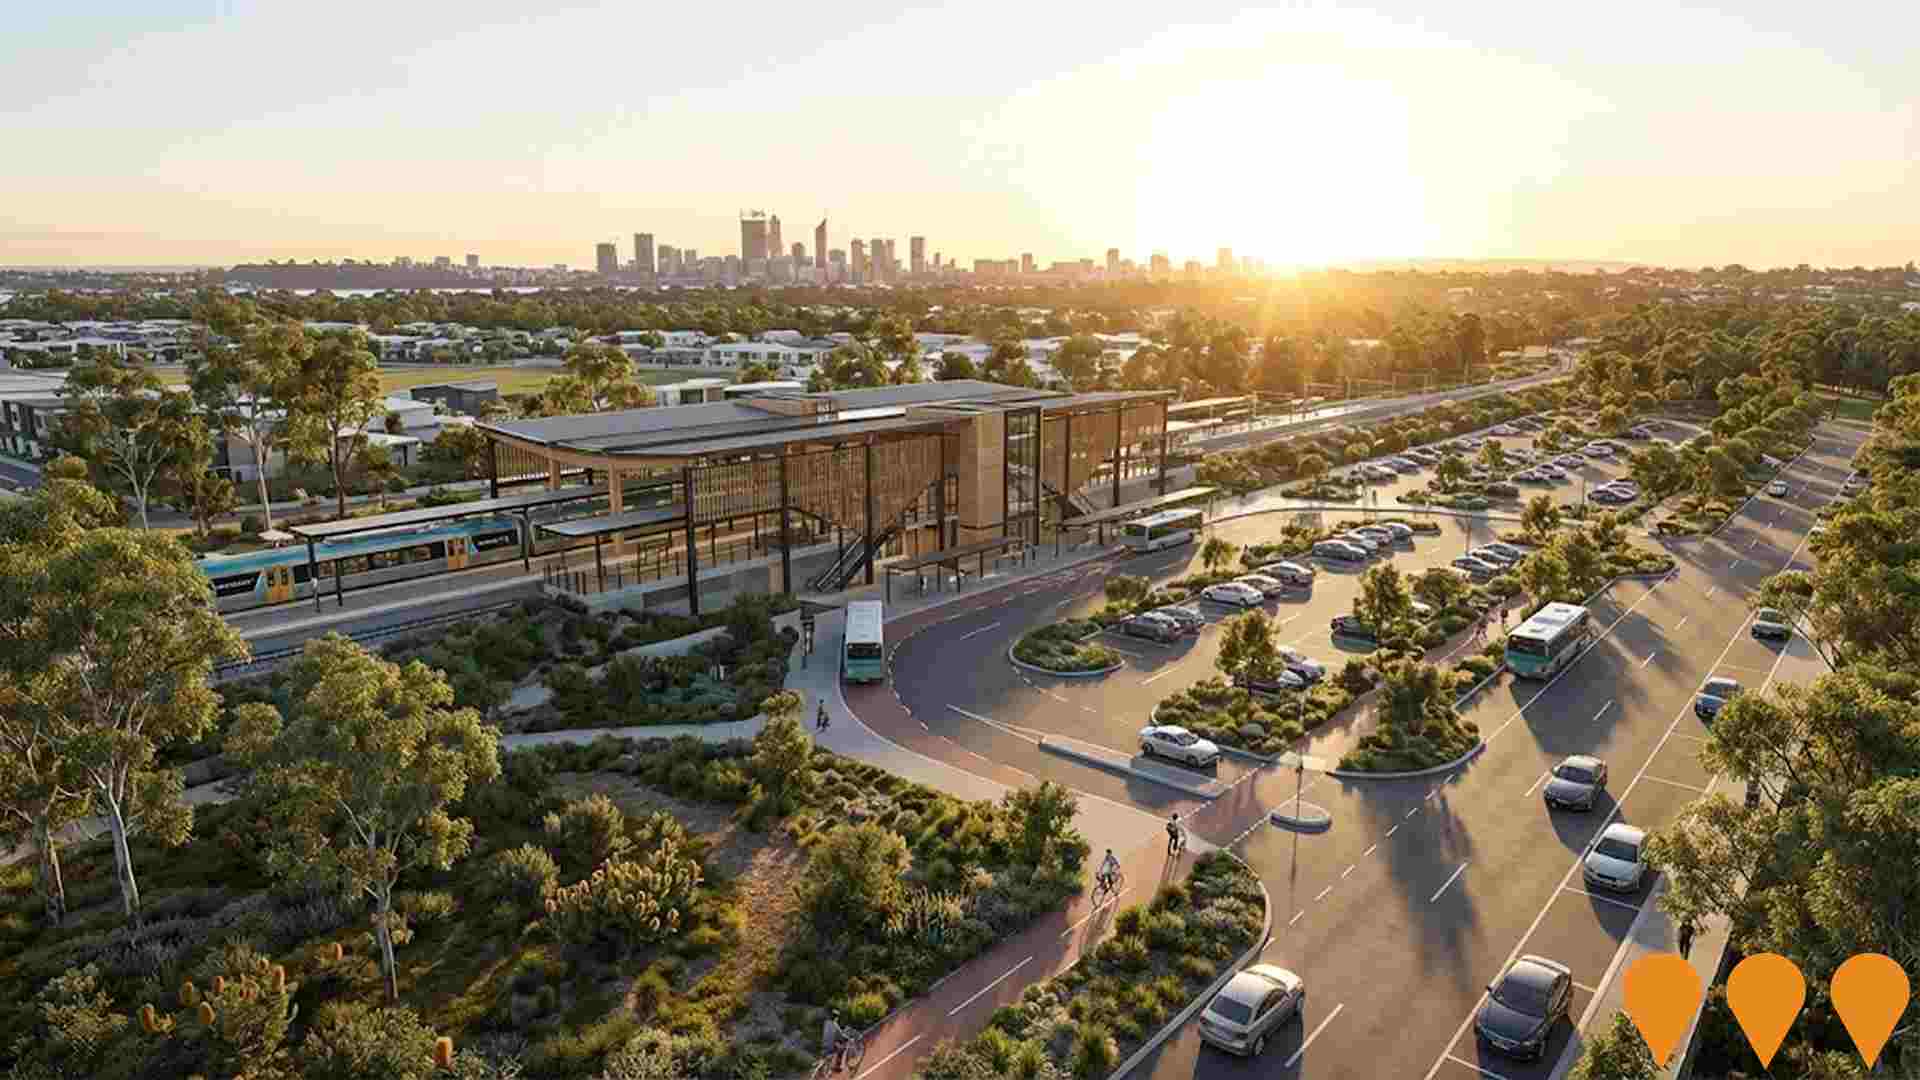
 Denotes AI-based impression for illustrative purposes only, not to be taken as definitive under any circumstances. Please follow links and conduct other investigations from the project's source for actual imagery. Developers and project owners wishing us to use original imagery please Contact Us and we will do so.
Frequently Asked Questions - Infrastructure
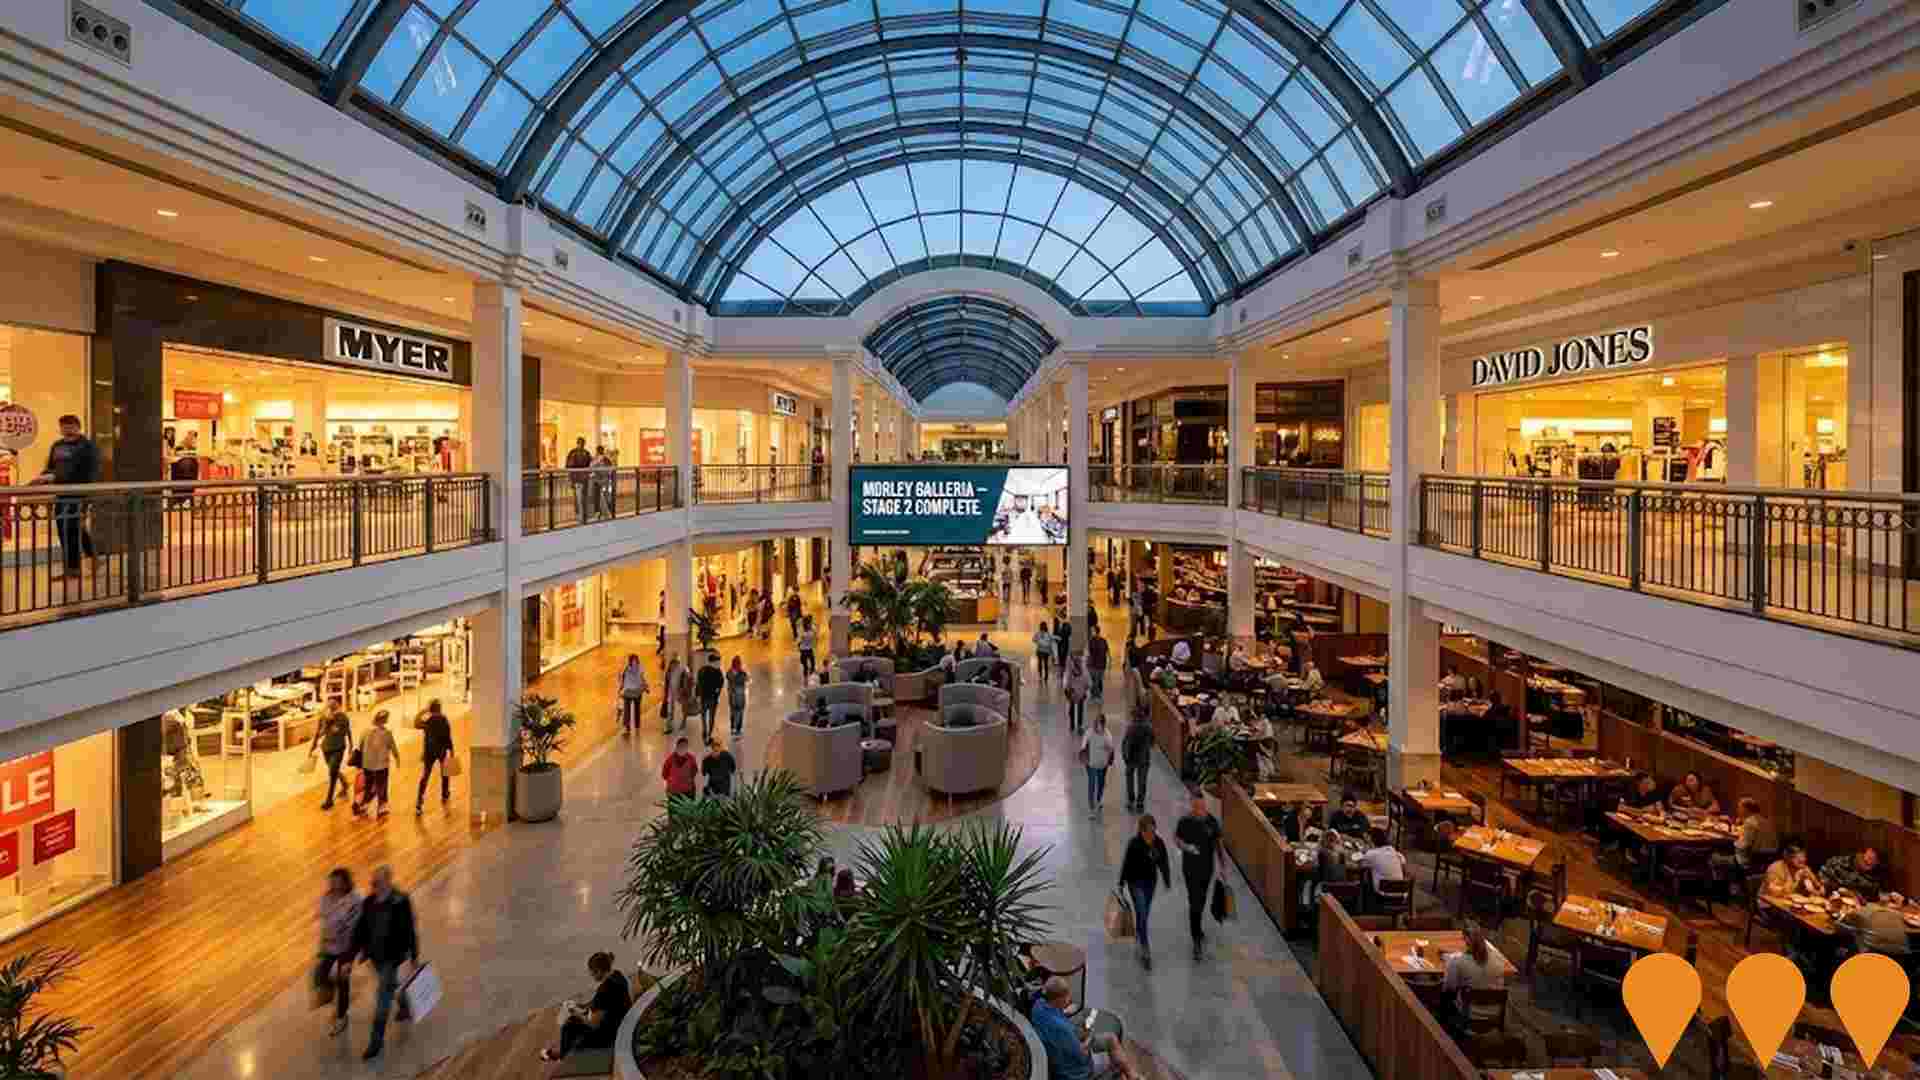
Morley Galleria Shopping Centre Redevelopment
Major $350-400 million redevelopment of Morley Galleria by Vicinity Centres and Perron Group. Stage 1 (fresh food, dining and entertainment precinct) opened October 2024. Stage 2 works continue with new retail, expanded fashion mall, additional cinema screens, HOYTS Lux, new facades, improved amenities and 2,500 extra car bays. Full completion expected 2027.
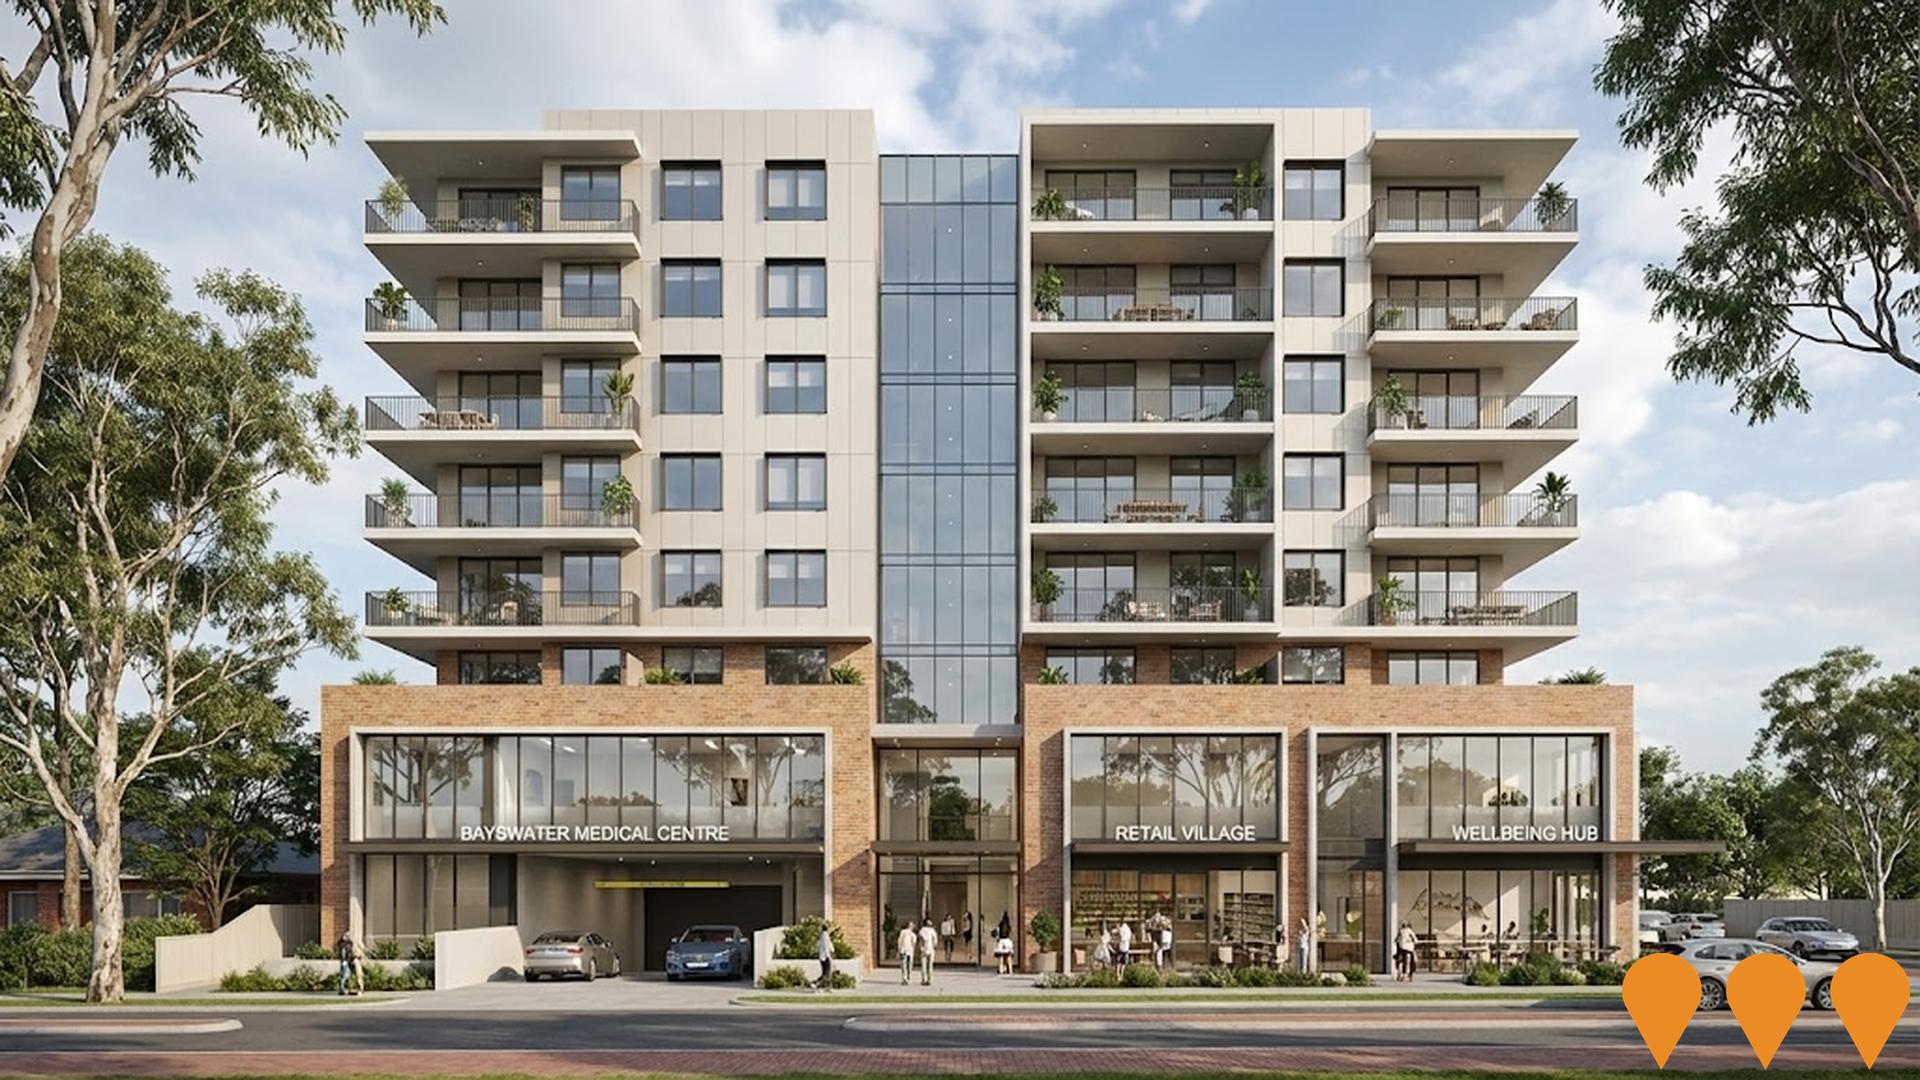
Beechboro Road South Mixed Use Development
A nine-storey mixed-use precinct comprising a comprehensive medical centre, retail and wellbeing amenities on the ground and first floors, and 73 oversized residential apartments above. The facility will consolidate essential health services like GPs, specialists, pathology, and diagnostic imaging. The development received Development Approval from DevelopmentWA and is located near Bayswater Station for transit-oriented development.
Morley Station Precinct Structure Plan
Precinct structure plan for the area around the new METRONET Morley Station in the City of Bayswater. The draft plan, prepared by Hames Sharley for the City of Bayswater and the Western Australian Government, proposes higher density housing close to the station with 5 to 6 storey mixed-use and apartment buildings, medium density residential in surrounding streets, new mixed-use zoning at key intersections, and the transition of nearby light industrial land to residential and mixed use. It is supported by Town Planning Scheme Amendment 100, which will rezone the area to an Urban Development zone. Council endorsed the draft structure plan and scheme amendment in July 2025 and they have been submitted to the Western Australian Planning Commission for final assessment. The broader station precinct concept master plan indicates the area can accommodate around 5,700 additional dwellings over a development horizon of up to 30 years.

Noranda District Centre Redevelopment
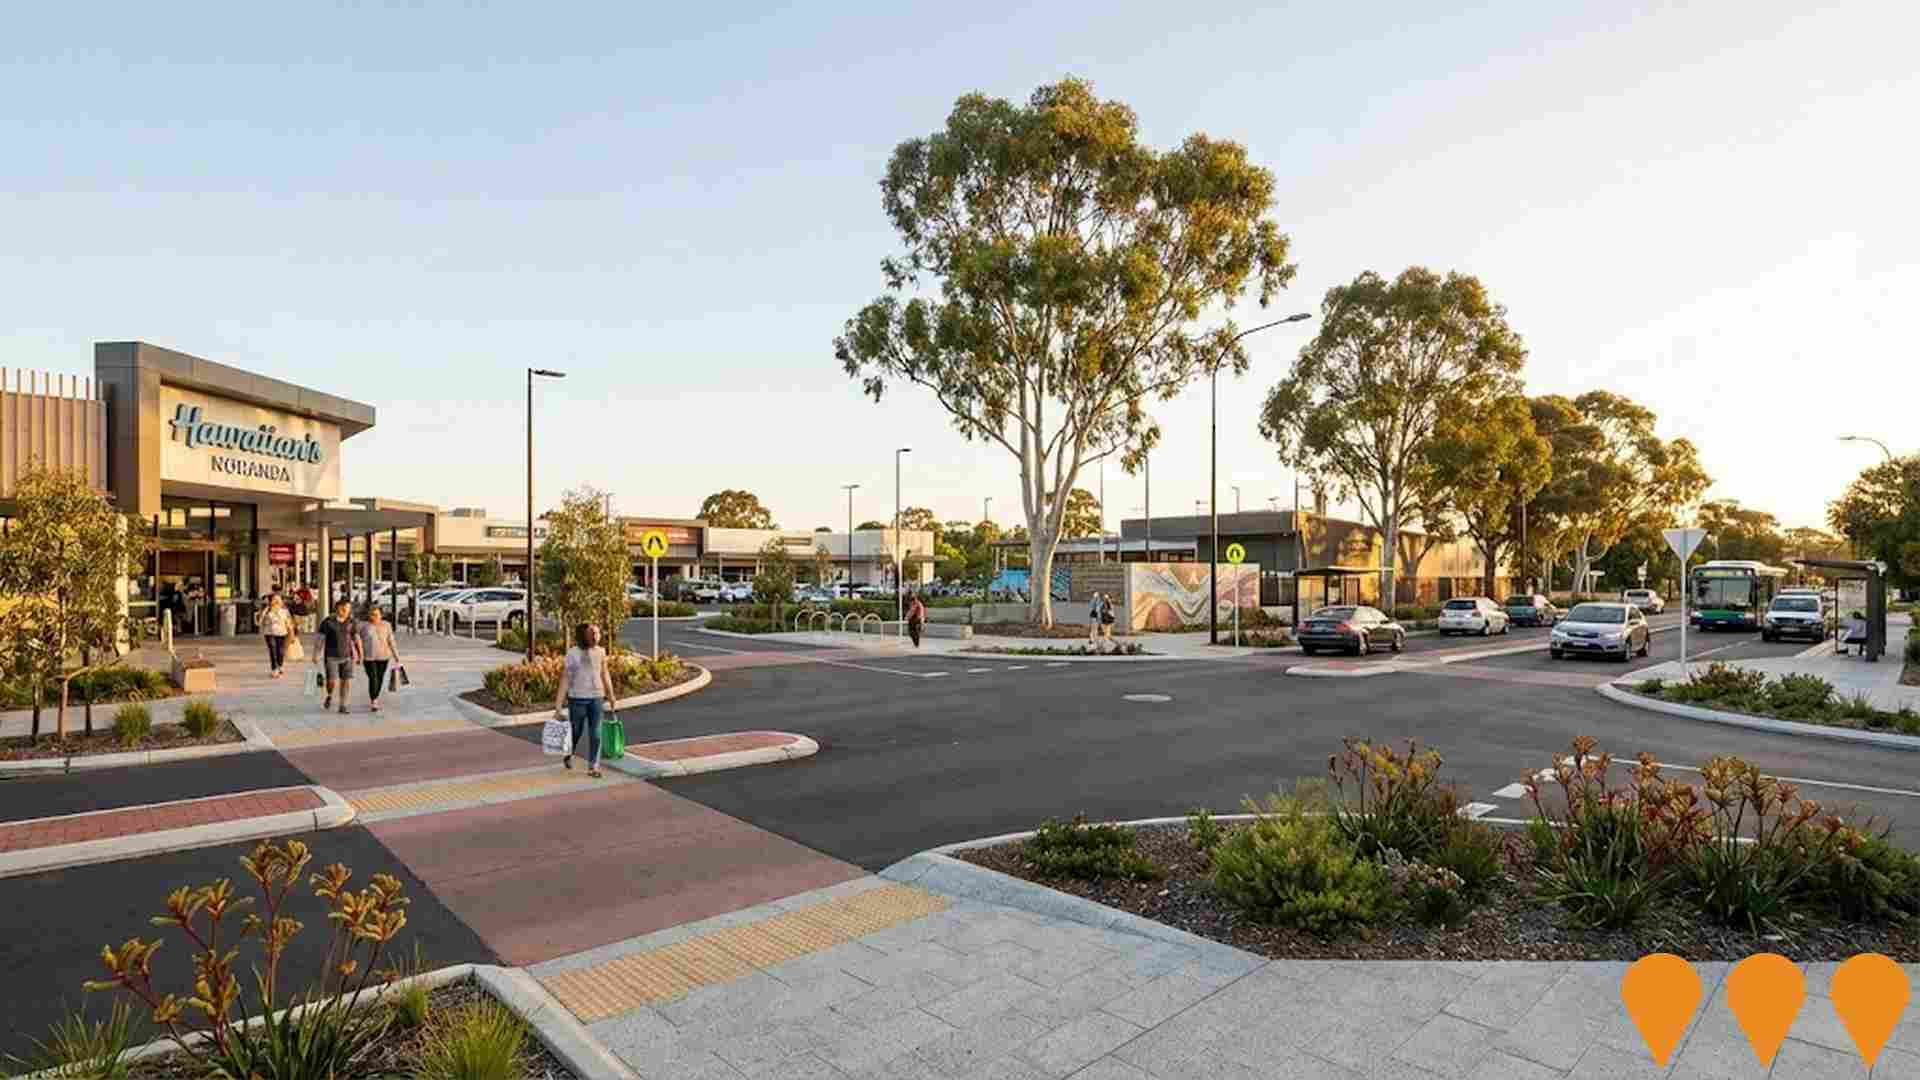
Public realm and streetscape upgrades around Hawaiian's Noranda shopping centre and the adjoining recreational hub on Benara Road and McGilvray Avenue, led by the City of Bayswater with centre owner Hawaiian. Works focus on pedestrian and traffic safety, new crossings and footpaths, greening and place activation to strengthen the district centre.
Les Hansman Community Centre Redevelopment
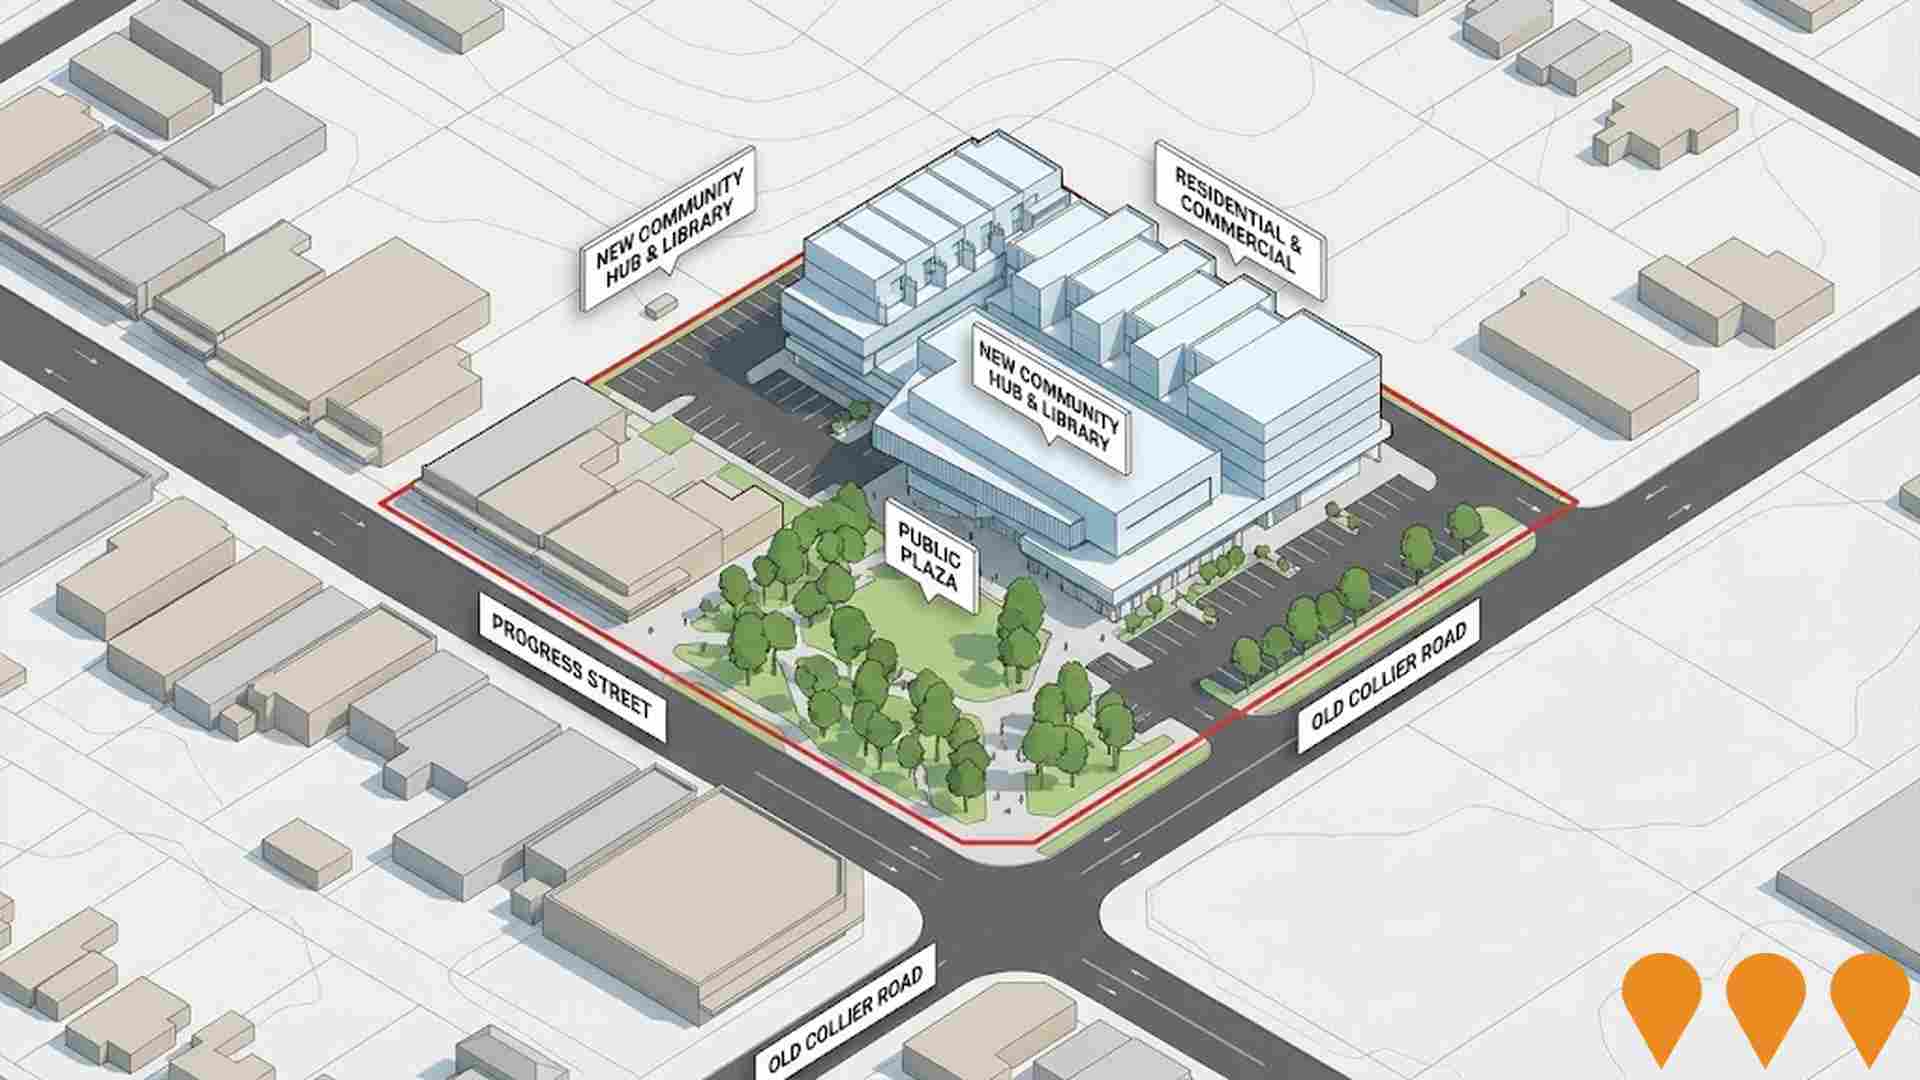
Major redevelopment of the Les Hansman Community Centre site into a modern mixed-use hub featuring a new multi-level library, up to 88 dwellings, landscaped public space, 220 parking bays, ground-floor commercial and community facilities. The City has consolidated a 6,300sqm site and approved concept plans, now seeking funding and delivery partners.
Galleria Shopping Centre Redevelopment
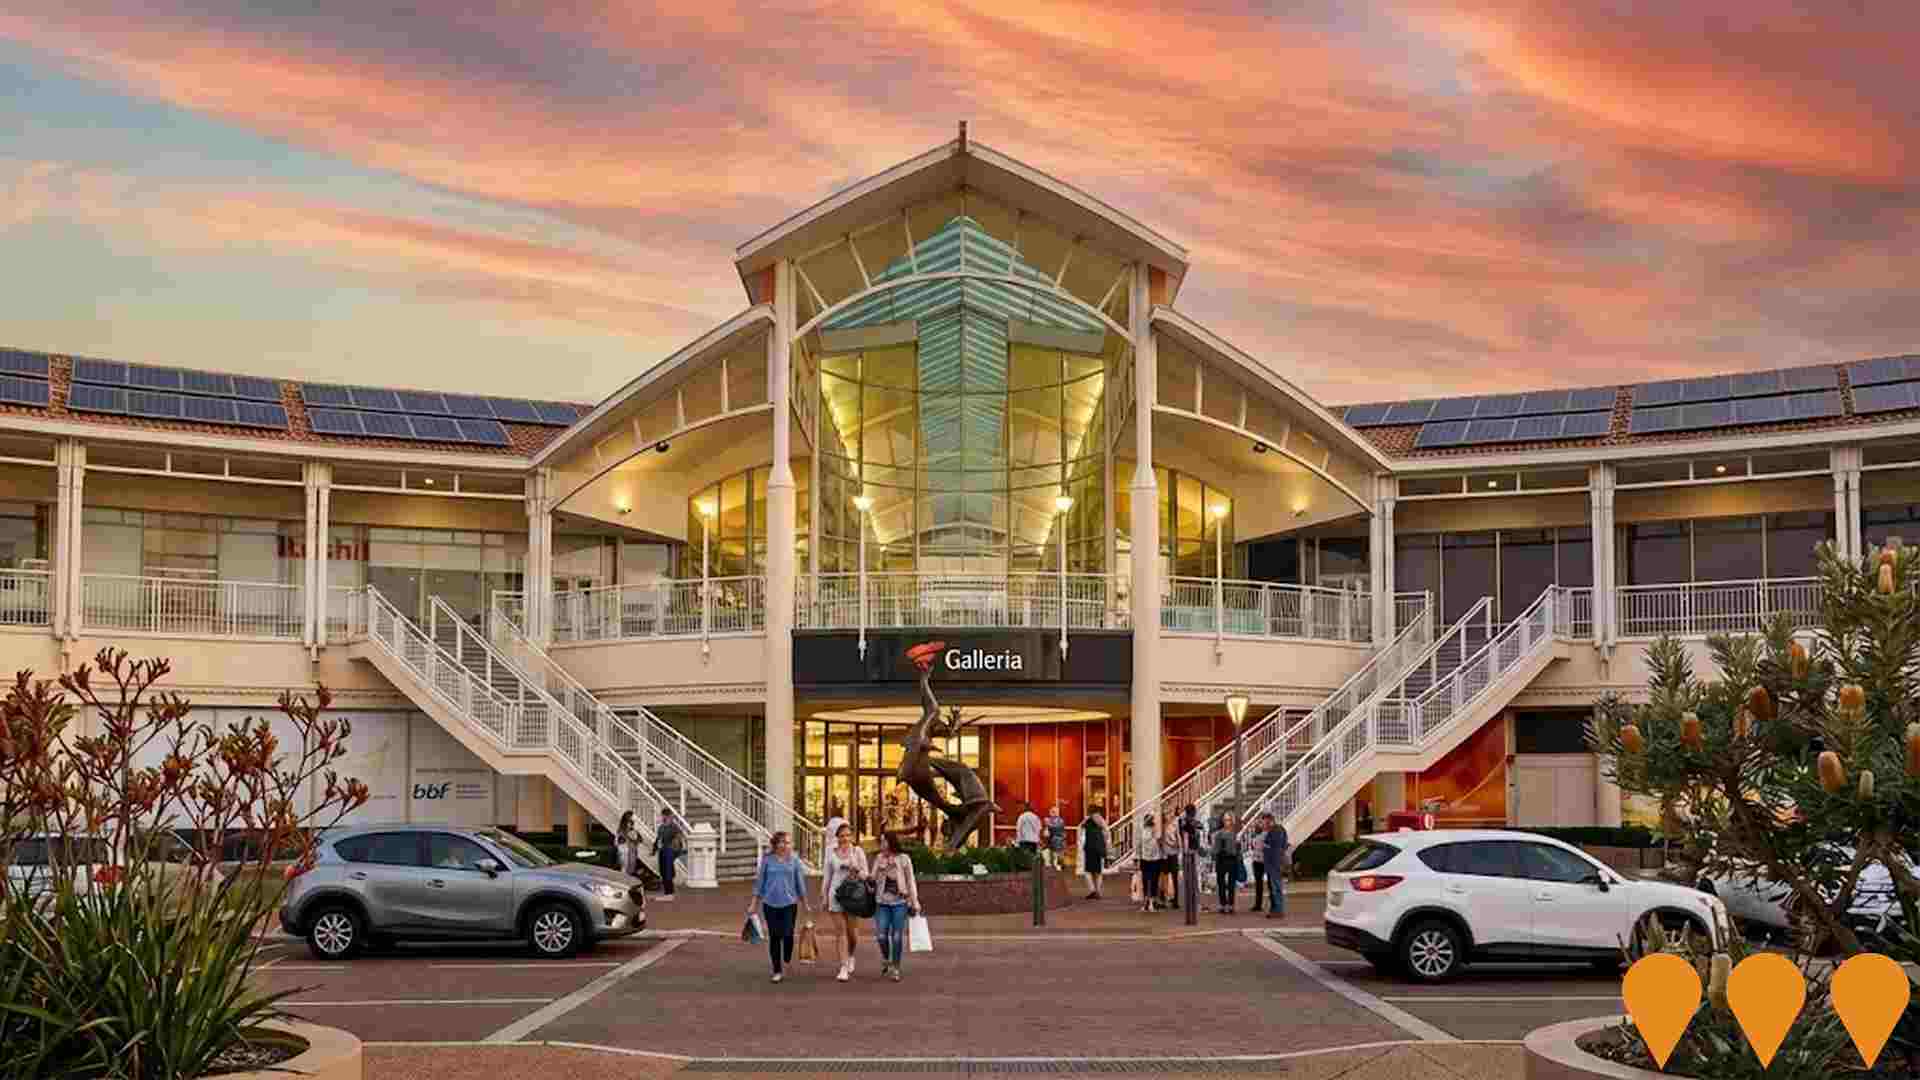
$350 million redevelopment expanding from 73,365 to 180,235 square metres. Will increase car bays from 4,086 to 7,200. Major expansion planned through to 2031 with new retail, dining and entertainment facilities. Includes 5MW solar photovoltaic roof installation.
Eden Hill Local Centre Redevelopment
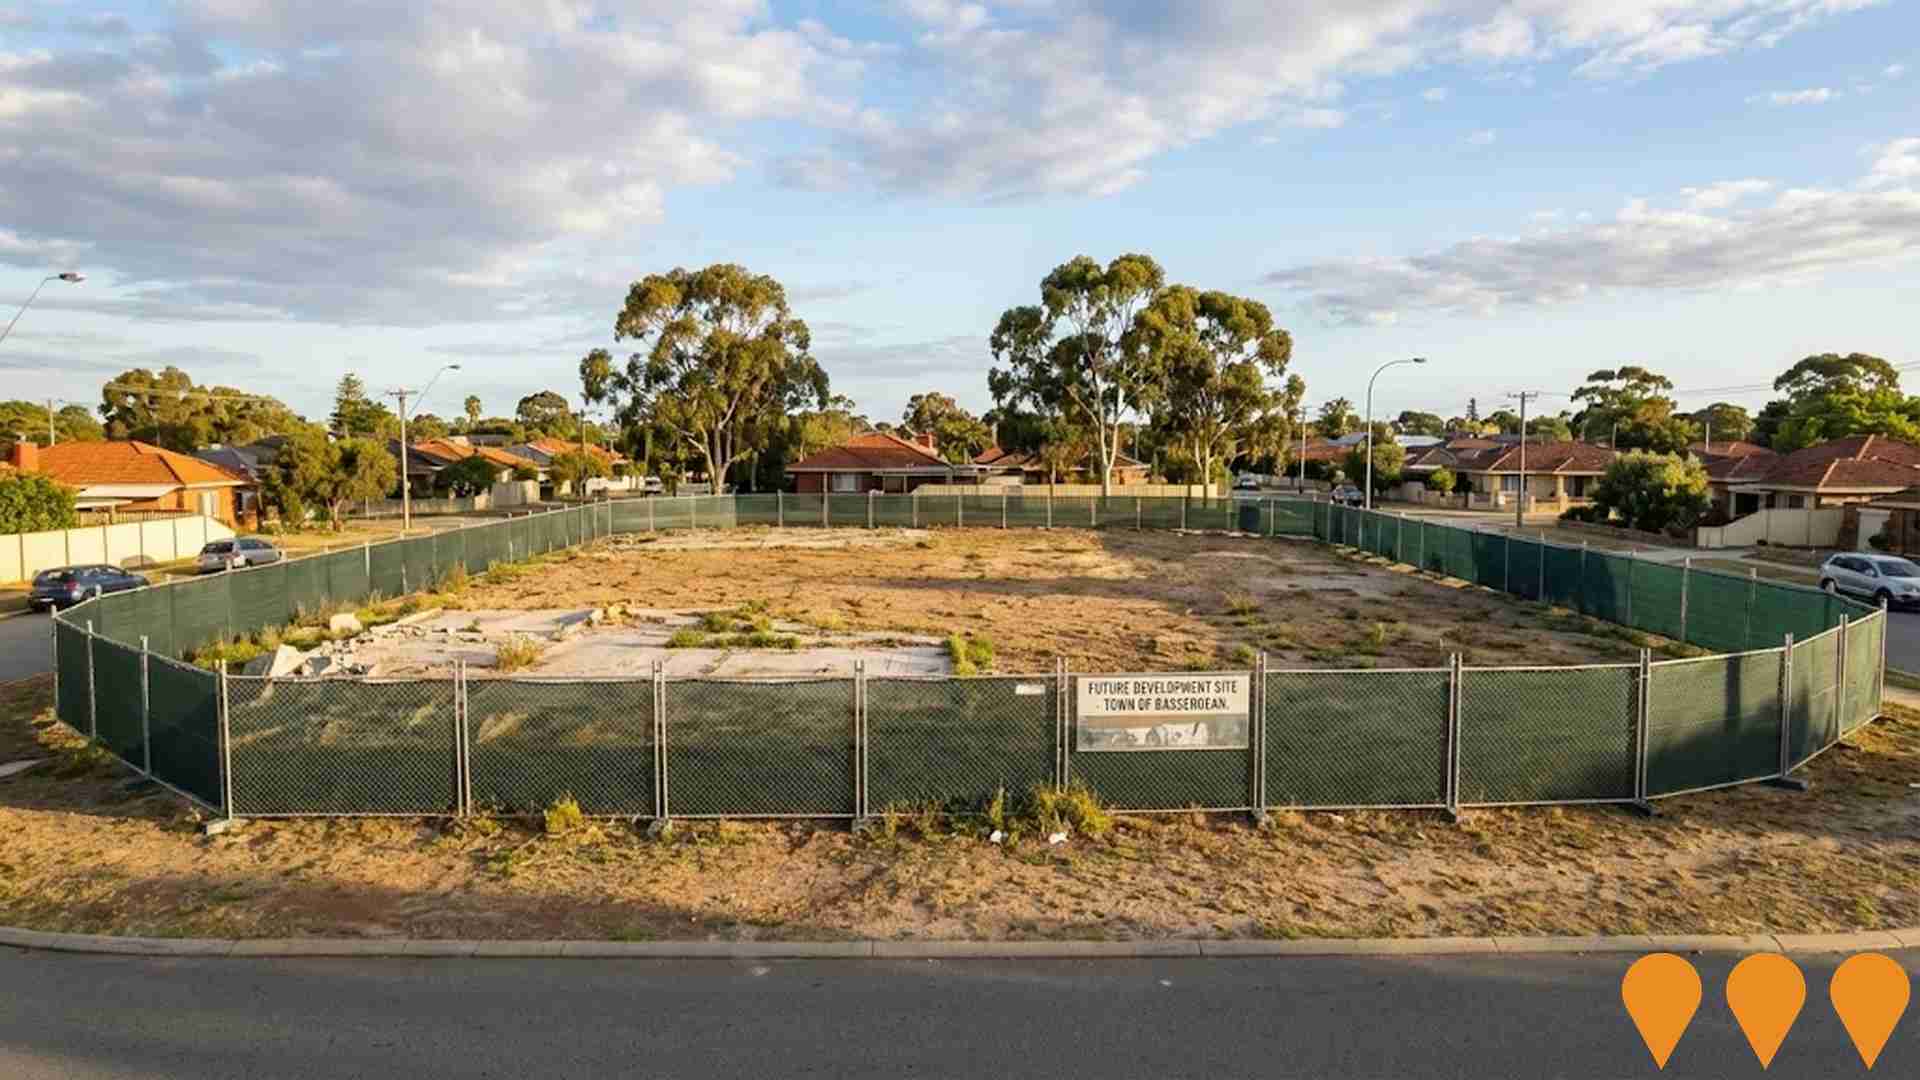
Redevelopment of the former Eden Hill Shopping Centre site into a renewed local retail and community services hub. Demolition of the existing dilapidated buildings was approved by the Town of Bassendean in July 2025 and has since been completed. As of December 2025, no development application has been lodged with the Town of Bassendean or the Metro Inner JDAP. The site remains vacant and fenced. Timing and final scope are dependent on the private landowner submitting plans for approval.
Bennett Springs East Station (Future)
Future railway station planned for Bennett Springs East as part of METRONET expansion. Will provide direct access to Perth CBD and major employment centres.
Employment
AreaSearch analysis indicates Morley maintains employment conditions that align with national benchmarks
Morley has a skilled workforce with manufacturing and industrial sectors well-represented. Its unemployment rate was 3.7% in September 2024, with an estimated employment growth of 1.9% over the past year.
As of September 2025, 14,136 residents are employed, with an unemployment rate of 3.8%, compared to Greater Perth's 4.0%. Workforce participation is lower at 62.7% versus Greater Perth's 65.2%. Key employment sectors include health care & social assistance, retail trade, and construction. Morley shows strong specialization in accommodation & food services with an employment share of 1.2 times the regional level, but mining has lower representation at 5.1% compared to the regional average of 7.0%.
Over the year to September 2025, employment increased by 1.9%, while labour force grew by 2.1%, raising the unemployment rate by 0.2 percentage points. By contrast, Greater Perth recorded employment growth of 2.9% and a marginal rise in unemployment. State-level data from 25-Nov-25 shows WA employment contracted by 0.27%, with an unemployment rate of 4.6%. National forecasts project total employment to expand by 6.6% over five years and 13.7% over ten years, but growth rates vary significantly between sectors. Applying these projections to Morley's employment mix suggests local employment should increase by 6.2% over five years and 13.1% over ten years.
Frequently Asked Questions - Employment
Income
Income levels align closely with national averages, indicating typical economic conditions for Australian communities according to AreaSearch analysis
The median taxpayer income in Morley SA2 was $52,887 according to postcode level ATO data aggregated by AreaSearch for the financial year 2022. The average income was $63,500 during this period. Compared nationally, these figures are slightly lower than average. In Greater Perth, the median income was $58,380 and the average was $78,020 in the same year. Based on Wage Price Index growth of 14.2% since financial year 2022, estimated median and average incomes as of September 2025 would be approximately $60,397 and $72,517 respectively. Census data indicates that household, family, and personal incomes in Morley rank modestly, between the 35th and 40th percentiles. The income band of $1,500 - 2,999 captures 33.2% of the community (8,312 individuals), which is consistent with broader regional trends showing 32.0% in the same category. Housing affordability pressures are severe in Morley, with only 84.4% of income remaining after housing costs, ranking at the 41st percentile. The area's SEIFA income ranking places it in the 5th decile.
Frequently Asked Questions - Income
Housing
Morley is characterized by a predominantly suburban housing profile, with above-average rates of outright home ownership
The latest Census evaluation of Morley's dwelling structure showed 83.6% houses and 16.3% other dwellings (semi-detached, apartments, 'other' dwellings). This compares to Perth metro's 72.7% houses and 27.3% other dwellings. Home ownership in Morley was at 35.3%, with mortgaged dwellings at 36.0% and rented dwellings at 28.7%. The median monthly mortgage repayment in the area was $1,733, below Perth metro's average of $1,855. The median weekly rent figure for Morley was $360, compared to Perth metro's $340. Nationally, Morley's mortgage repayments were lower than the Australian average of $1,863, while rents were less than the national figure of $375.
Frequently Asked Questions - Housing
Household Composition
Morley features high concentrations of group households, with a higher-than-average median household size
Family households account for 70.0% of all households, including 29.5% couples with children, 27.0% couples without children, and 11.8% single parent families. Non-family households make up the remaining 30.0%, consisting of 25.5% lone person households and 4.4% group households. The median household size is 2.5 people, larger than the Greater Perth average of 2.3.
Frequently Asked Questions - Households
Local Schools & Education
Educational attainment in Morley aligns closely with national averages, showing typical qualification patterns and performance metrics
Morley's educational qualifications trail regional benchmarks; 25.5% of residents aged 15+ hold university degrees compared to the SA3 area's 33.0%. This gap indicates potential for educational development and skill enhancement. Bachelor degrees are most common at 18.0%, followed by postgraduate qualifications (5.5%) and graduate diplomas (2.0%). Trade and technical skills are prominent, with 33.6% of residents aged 15+ holding vocational credentials – advanced diplomas at 10.9% and certificates at 22.7%.
Educational participation is high; 26.5% of residents are currently enrolled in formal education. This includes primary (8.0%), secondary (6.6%), and tertiary (5.4%) education.
Frequently Asked Questions - Education
Schools Detail
Nearby Services & Amenities
Transport
Transport servicing is high compared to other areas nationally based on assessment of service frequency, route connectivity and accessibility
Morley has 162 active public transport stops. These include both train and bus services. There are 28 different routes operating in total, providing 6,197 weekly passenger trips combined.
The average distance residents live from the nearest stop is 194 meters. On average, there are 885 trips per day across all routes, which equals approximately 38 weekly trips per individual stop.
Frequently Asked Questions - Transport
Transport Stops Detail
Health
Morley's residents are healthier than average in comparison to broader Australia with prevalence of common health conditions quite low across both younger and older age cohorts
Morley residents show positive health outcomes, with low prevalence of common conditions across all ages. Private health cover stands at approximately 51%, slightly lower than the SA2 average of 55.2%.
The most prevalent medical conditions are arthritis (7.1%) and mental health issues (7.0%), while 71.6% report no medical ailments, compared to 70.2% in Greater Perth. Morley has a higher proportion of seniors aged 65 and over at 19.6%, or 4,919 people, compared to 18.1% in Greater Perth. Senior health outcomes are above average, mirroring the general population's profile.
Frequently Asked Questions - Health
Cultural Diversity
Morley is among the most culturally diverse areas in the country based on AreaSearch assessment of a range of language and cultural background related metrics
Morley's population is culturally diverse, with 37.3% speaking a language other than English at home and 44.4% born overseas. Christianity is the predominant religion in Morley, making up 49.4% of its population. Notably, Judaism is overrepresented compared to Greater Perth, comprising 0.6% versus 0.7%.
The top three ancestry groups are English (19.8%), Australian (16.7%), and Other (14.6%). Some ethnic groups have notable divergences in representation: Vietnamese at 4.0% (versus regional 2.4%), Serbian at 1.0% (versus 0.7%), and Italian at 8.4% (versus 6.6%).
Frequently Asked Questions - Diversity
Age
Morley's population aligns closely with national norms in age terms
The median age in Morley is 39 years, which is higher than Greater Perth's average of 37 years and close to the national average of 38 years. Compared to Greater Perth, Morley has a notably higher percentage of people aged 75-84 (7.2% locally) and a lower percentage of people aged 5-14 (10.4%). Post-2021 Census data shows that the 35 to 44 age group has increased from 14.2% to 15.2%, while the 0 to 4 cohort has decreased from 5.9% to 5.2%. By 2041, population forecasts indicate significant demographic changes in Morley. The 85+ group is expected to grow by 135% (an increase of 1,086 people), reaching a total of 1,893 from the initial 806. This growth will be led by residents aged 65 and older, who are expected to represent 60% of the population growth. Conversely, the 0 to 4 and 5 to 14 cohorts are anticipated to experience population declines.
