Chart Color Schemes
This analysis uses ABS Statistical Areas Level 2 (SA2) boundaries, which can materially differ from Suburbs and Localities (SAL) even when sharing similar names.
SA2 boundaries are defined by the Australian Bureau of Statistics and are designed to represent communities for statistical reporting (e.g., census and ERP).
Suburbs and Localities (SAL) represent commonly-used suburb/locality names (postal-style areas) and may use different geographic boundaries. For comprehensive analysis, consider reviewing both boundary types if available.
est. as @ -- *
ABS ERP | -- people | --
2021 Census | -- people
Sales Activity
Curious about local property values? Filter the chart to assess the volume and appreciation (including resales) trends and regional comparisons, or scroll to the map below view this information at an individual property level.
Find a Recent Sale
Sales Detail
Population
Population growth drivers in Beckenham - Kenwick - Langford are above average based on AreaSearch's ranking of recent, and medium to long-term trends
Beckenham-Kenwick-Langford's population, as per AreaSearch's analysis, is approximately 23,013 by November 2025. This figure represents a rise of 2,733 people (13.5%) since the 2021 Census, which recorded a population of 20,280. The increase was inferred from the ABS's estimated resident population of 22,803 in June 2024 and an additional 200 validated new addresses since the Census date. This results in a density ratio of 1,213 persons per square kilometer, higher than the average across national locations assessed by AreaSearch. The area's growth of 13.5% since the 2021 census surpassed the national average (8.9%), positioning it as a growth leader regionally. Overseas migration contributed approximately 70.2% of overall population gains during recent periods, driving this growth.
AreaSearch is adopting ABS/Geoscience Australia projections for each SA2 area, released in 2024 with a base year of 2022. For areas not covered by this data and to estimate post-2032 growth, AreaSearch uses growth rates by age cohort provided by the ABS in its latest Greater Capital Region projections (released in 2023, based on 2022 data). Considering these projections, an above median population growth is expected for statistical areas nationally, with Beckenham-Kenwick-Langford projected to increase by 3,302 persons to 2041, reflecting a total increase of 13.4% over the 17 years.
Frequently Asked Questions - Population
Development
The level of residential development activity in Beckenham - Kenwick - Langford was found to be higher than 90% of real estate markets across the country
Beckenham-Kenwick-Langford recorded approximately 111 residential property approvals annually over the past five financial years, totalling 555 homes. As of FY26, 83 approvals have been granted. On average, 4.6 people moved to the area per dwelling built between FY21 and FY25, indicating high demand outpacing supply, which typically influences prices positively and intensifies competition among buyers. The average construction cost for new homes was $219,000 during this period, below the regional average, suggesting more affordable housing options.
This financial year has seen $89.9 million in commercial approvals, reflecting robust local commercial activity. Compared to Greater Perth, Beckenham-Kenwick-Langford exhibits elevated construction levels (14.0% above the regional average per person over five years), balancing buyer choice while supporting current property values. New building activity comprises 73.0% standalone homes and 27.0% townhouses or apartments, preserving the area's traditional suburban character focused on family homes.
With around 240 people per approval, Beckenham-Kenwick-Langford reflects a transitioning market. According to AreaSearch's latest quarterly estimate, the area is projected to grow by 3,092 residents by 2041, indicating that current development aligns well with future needs and supports stable market conditions without excessive price pressure.
Frequently Asked Questions - Development
Infrastructure
Beckenham - Kenwick - Langford has emerging levels of nearby infrastructure activity, ranking in the 34thth percentile nationally
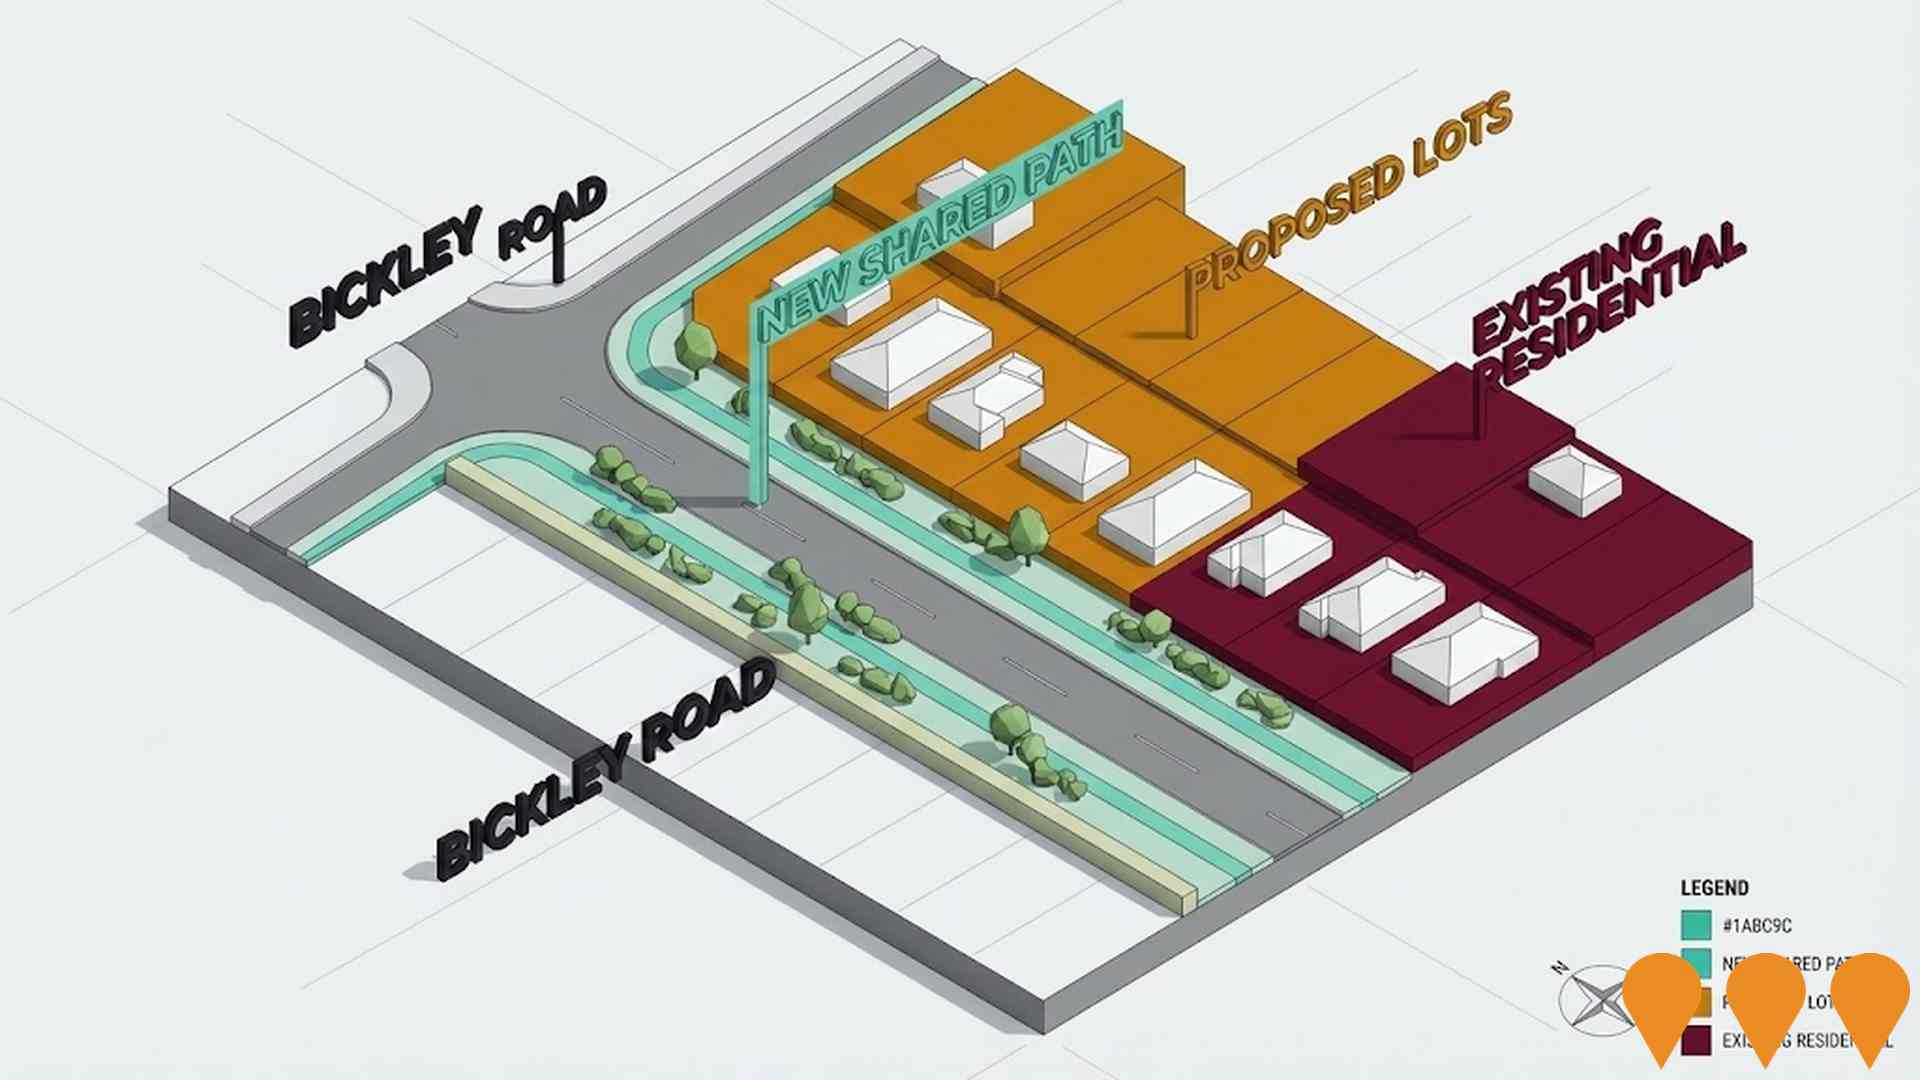
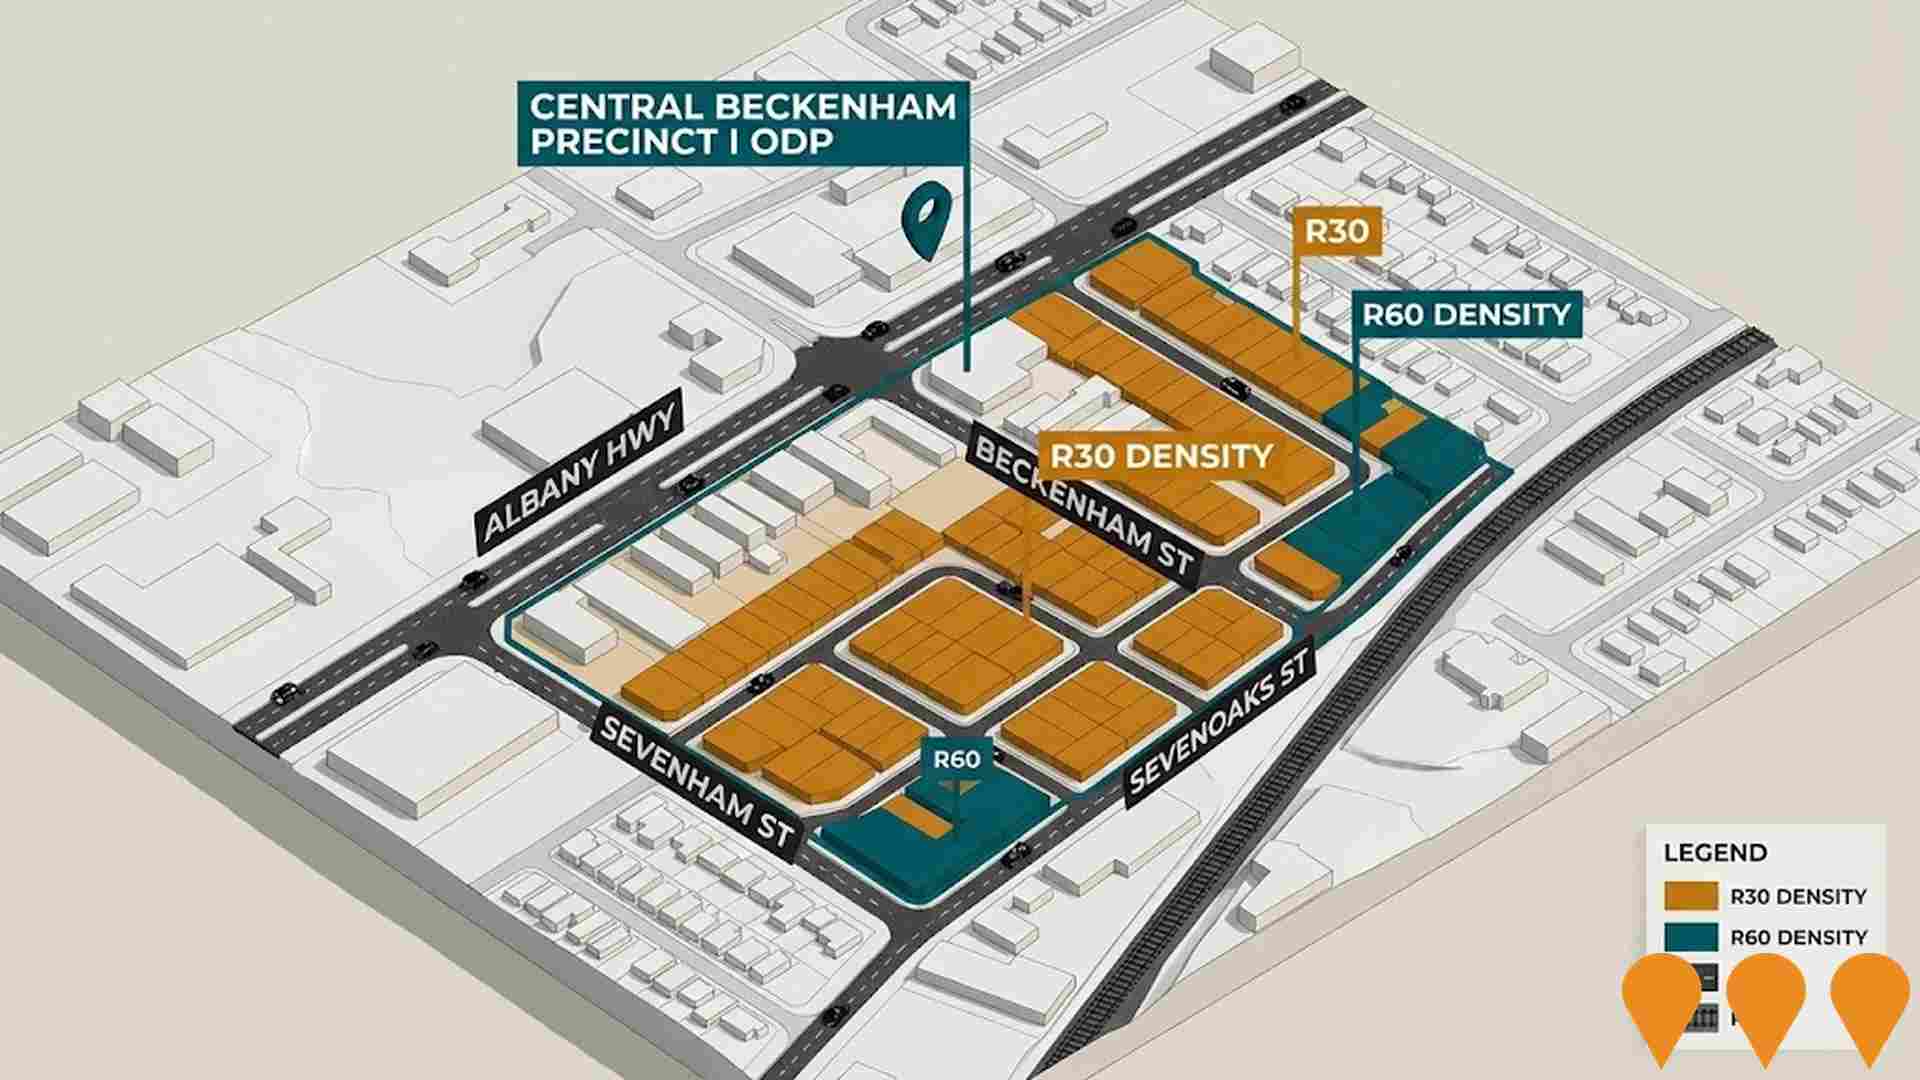
Changes to local infrastructure significantly impact an area's performance. AreaSearch identified 44 projects likely to affect the area. Notable ones are Principal Shared Paths - Bickley Road, CDC Maddington Data Centre Campus, Central Beckenham Precinct I ODP, and Mills Park Sporting Precinct Development. The following list details those most relevant.
Professional plan users can use the search below to filter and access additional projects.
INFRASTRUCTURE SEARCH
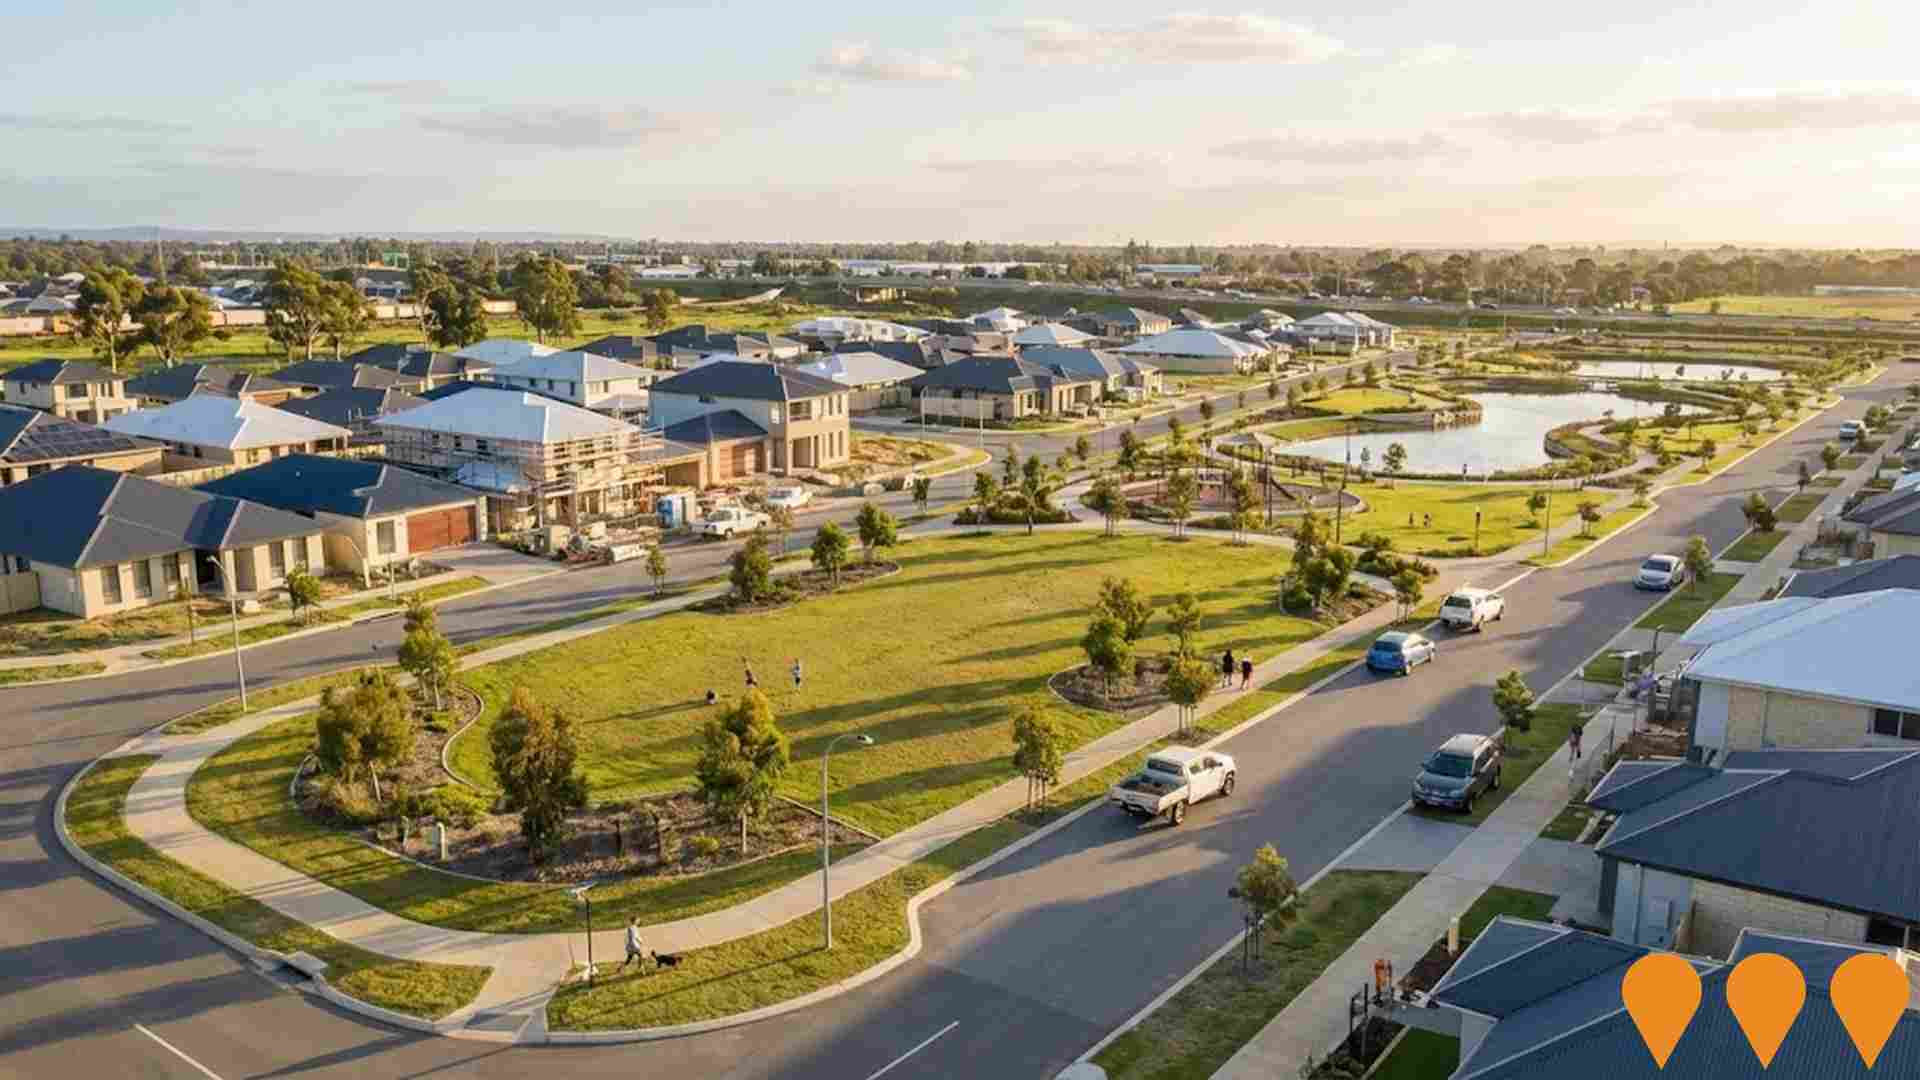
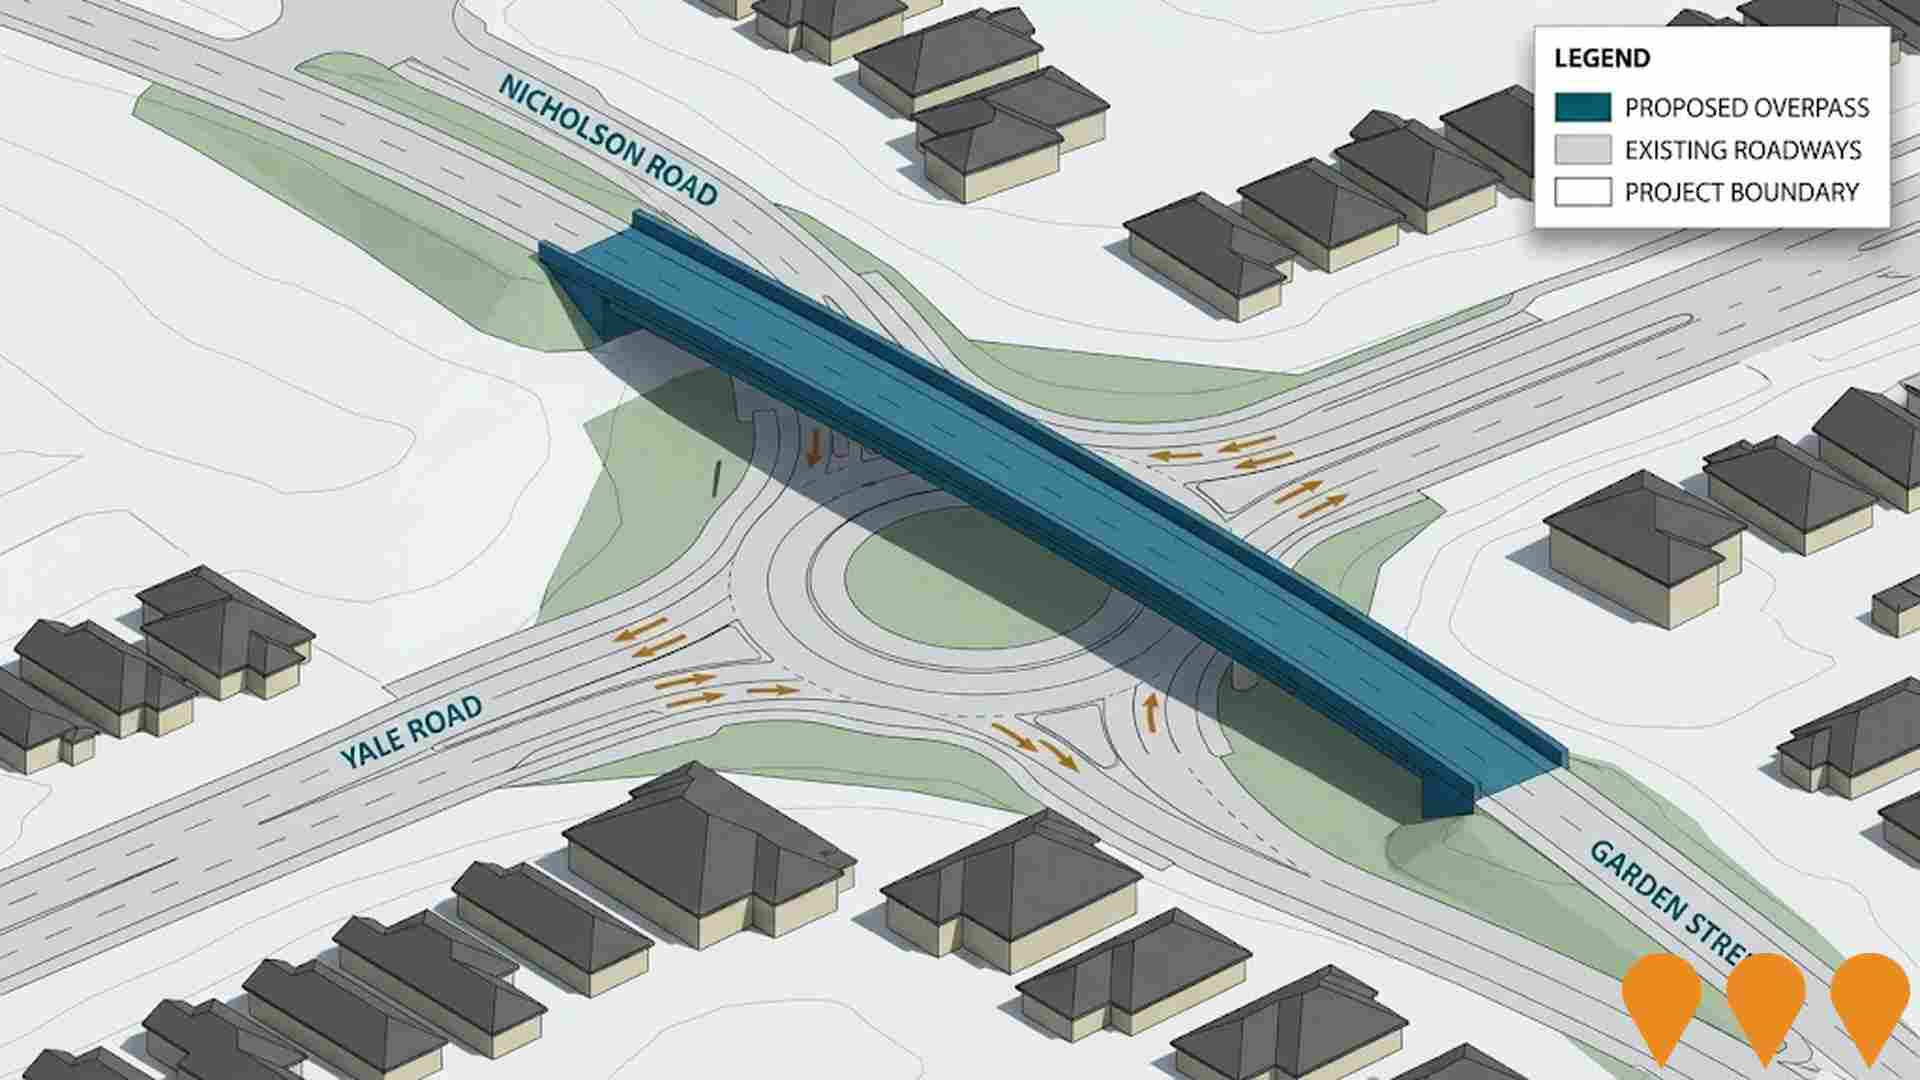
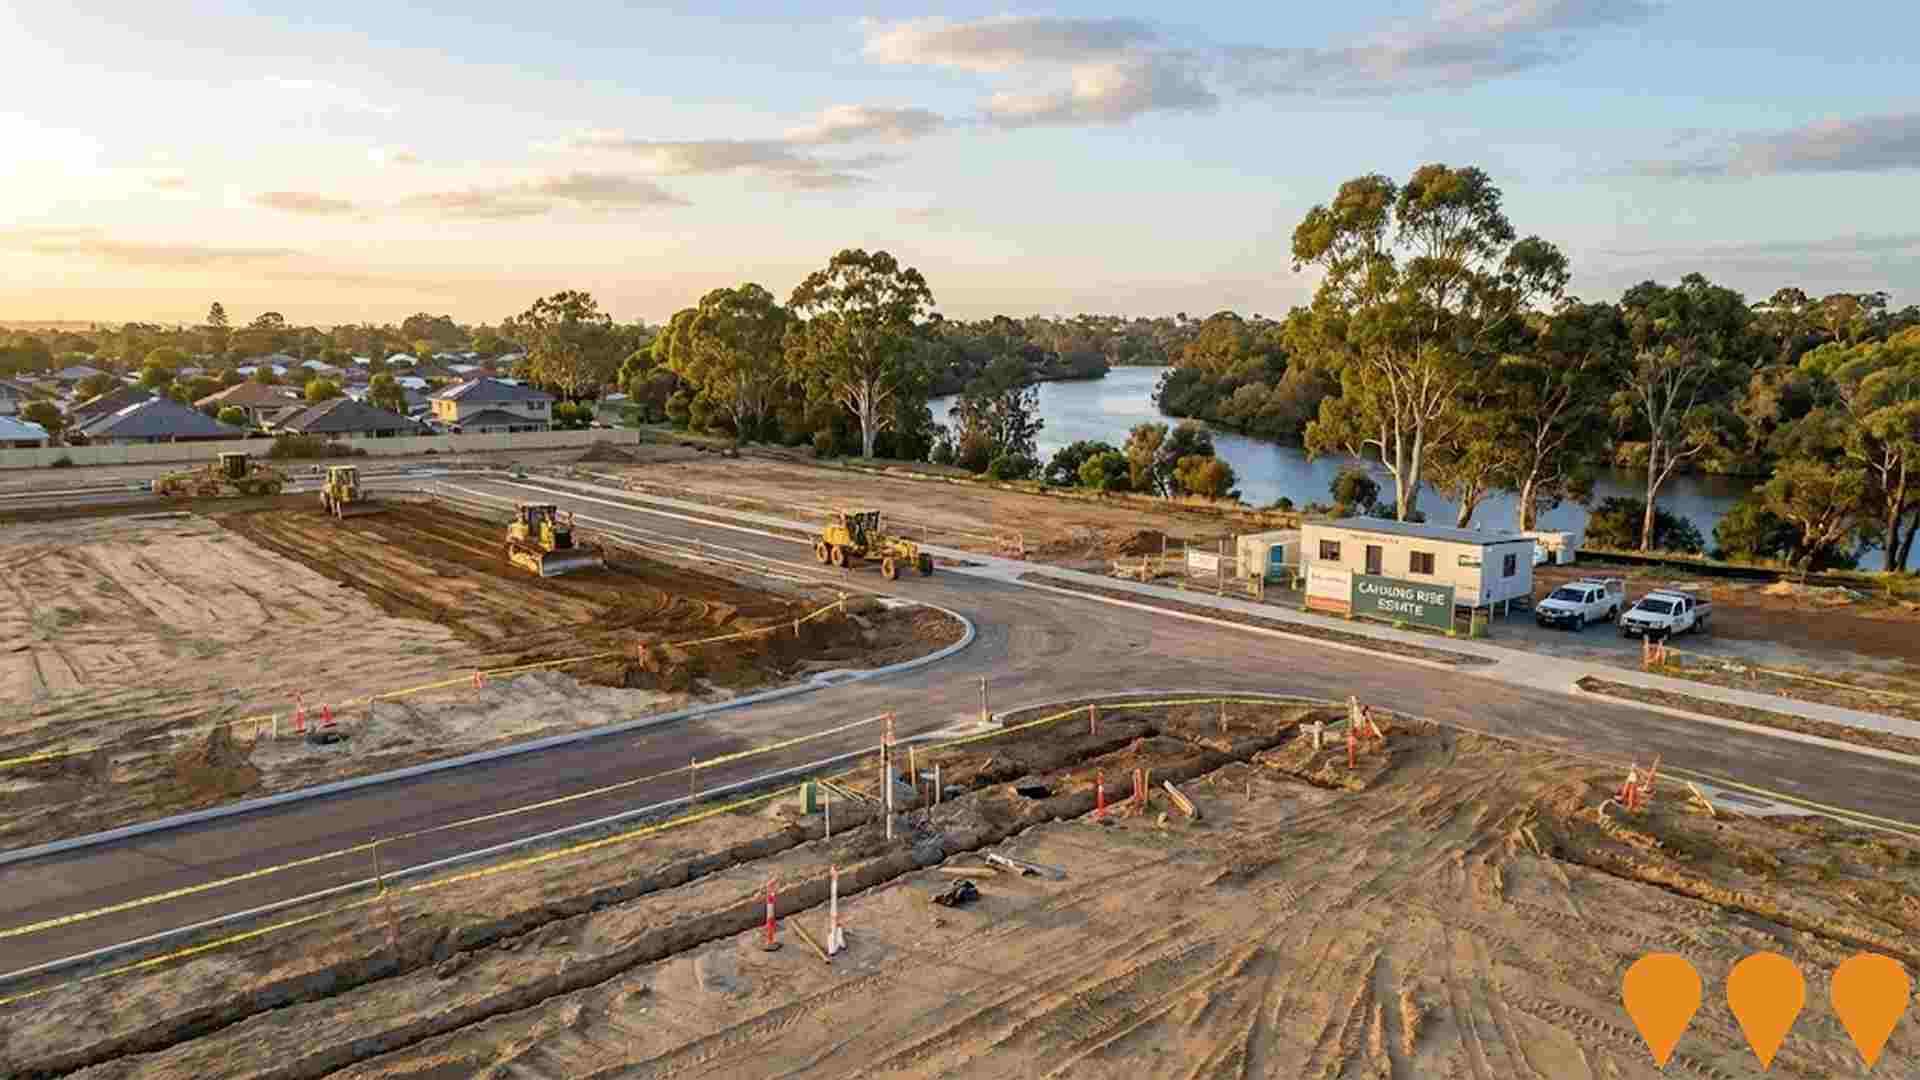
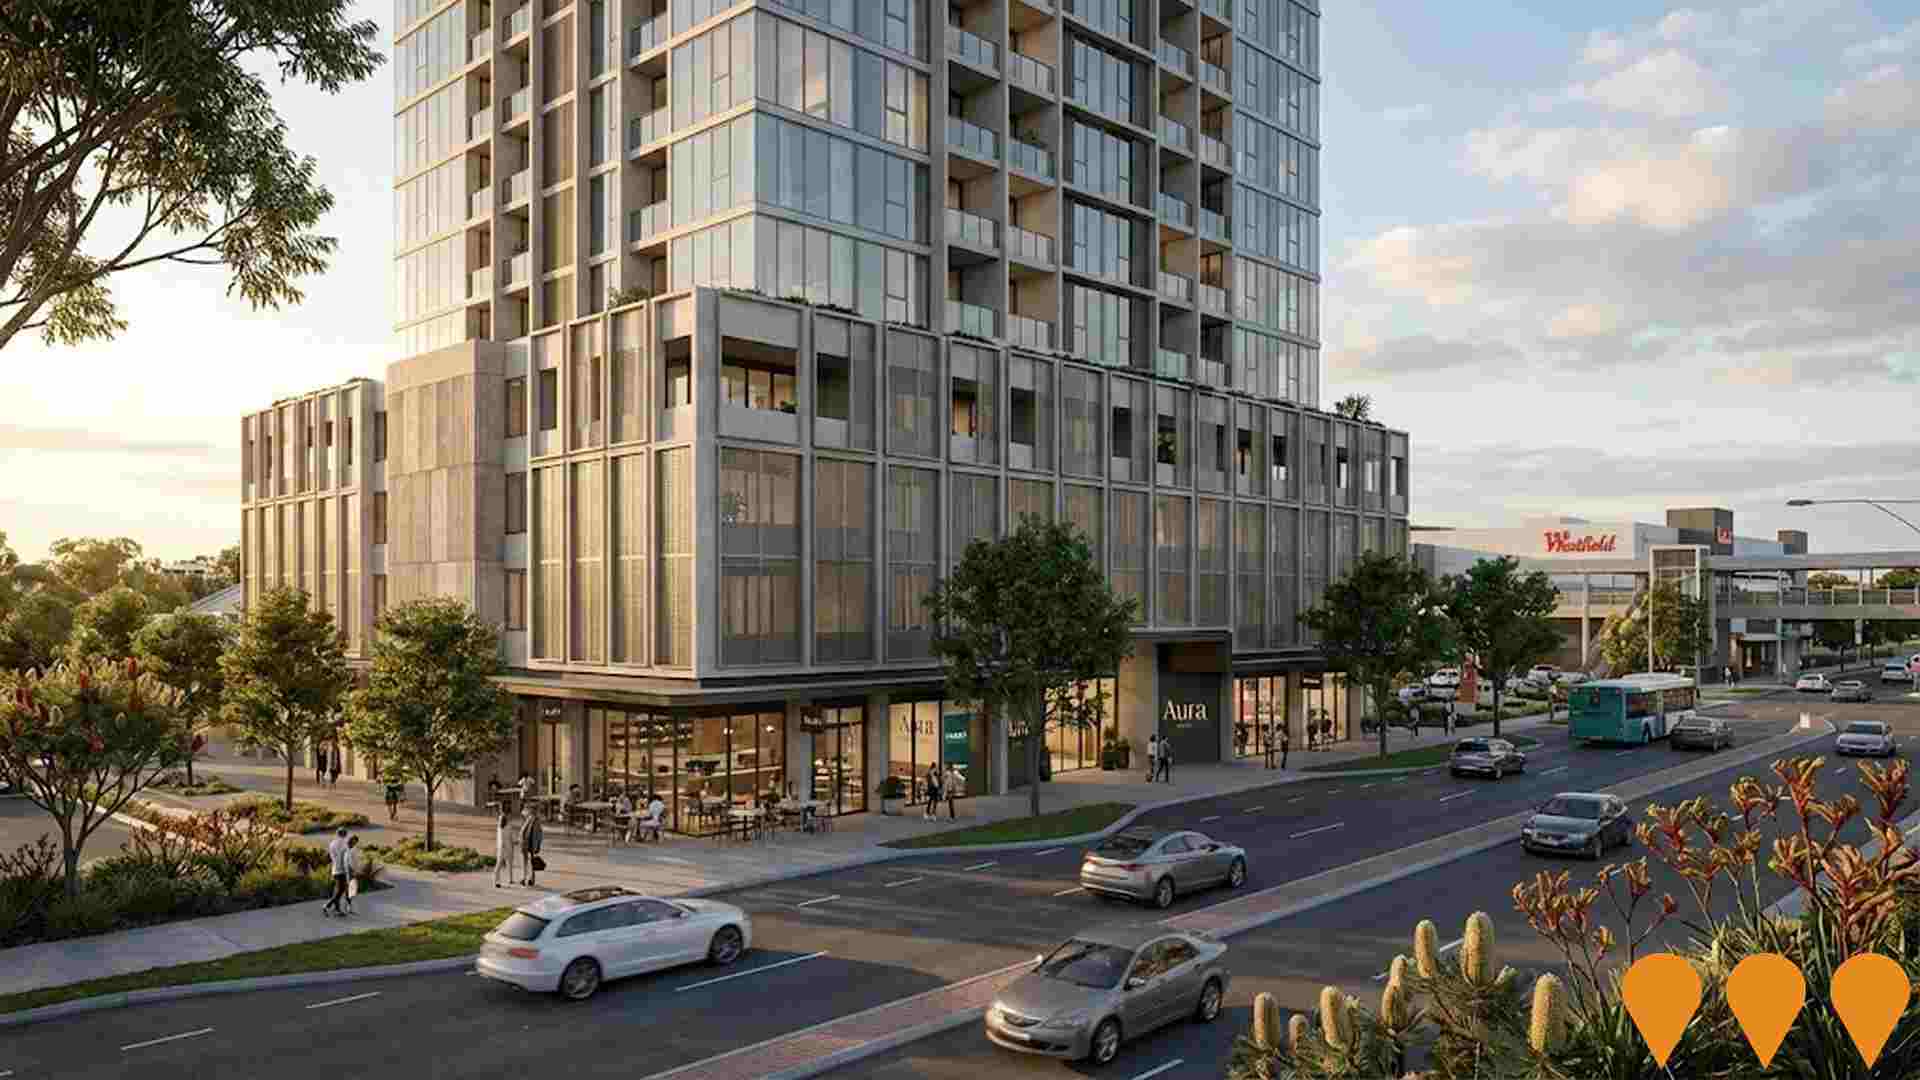
 Denotes AI-based impression for illustrative purposes only, not to be taken as definitive under any circumstances. Please follow links and conduct other investigations from the project's source for actual imagery. Developers and project owners wishing us to use original imagery please Contact Us and we will do so.
Frequently Asked Questions - Infrastructure
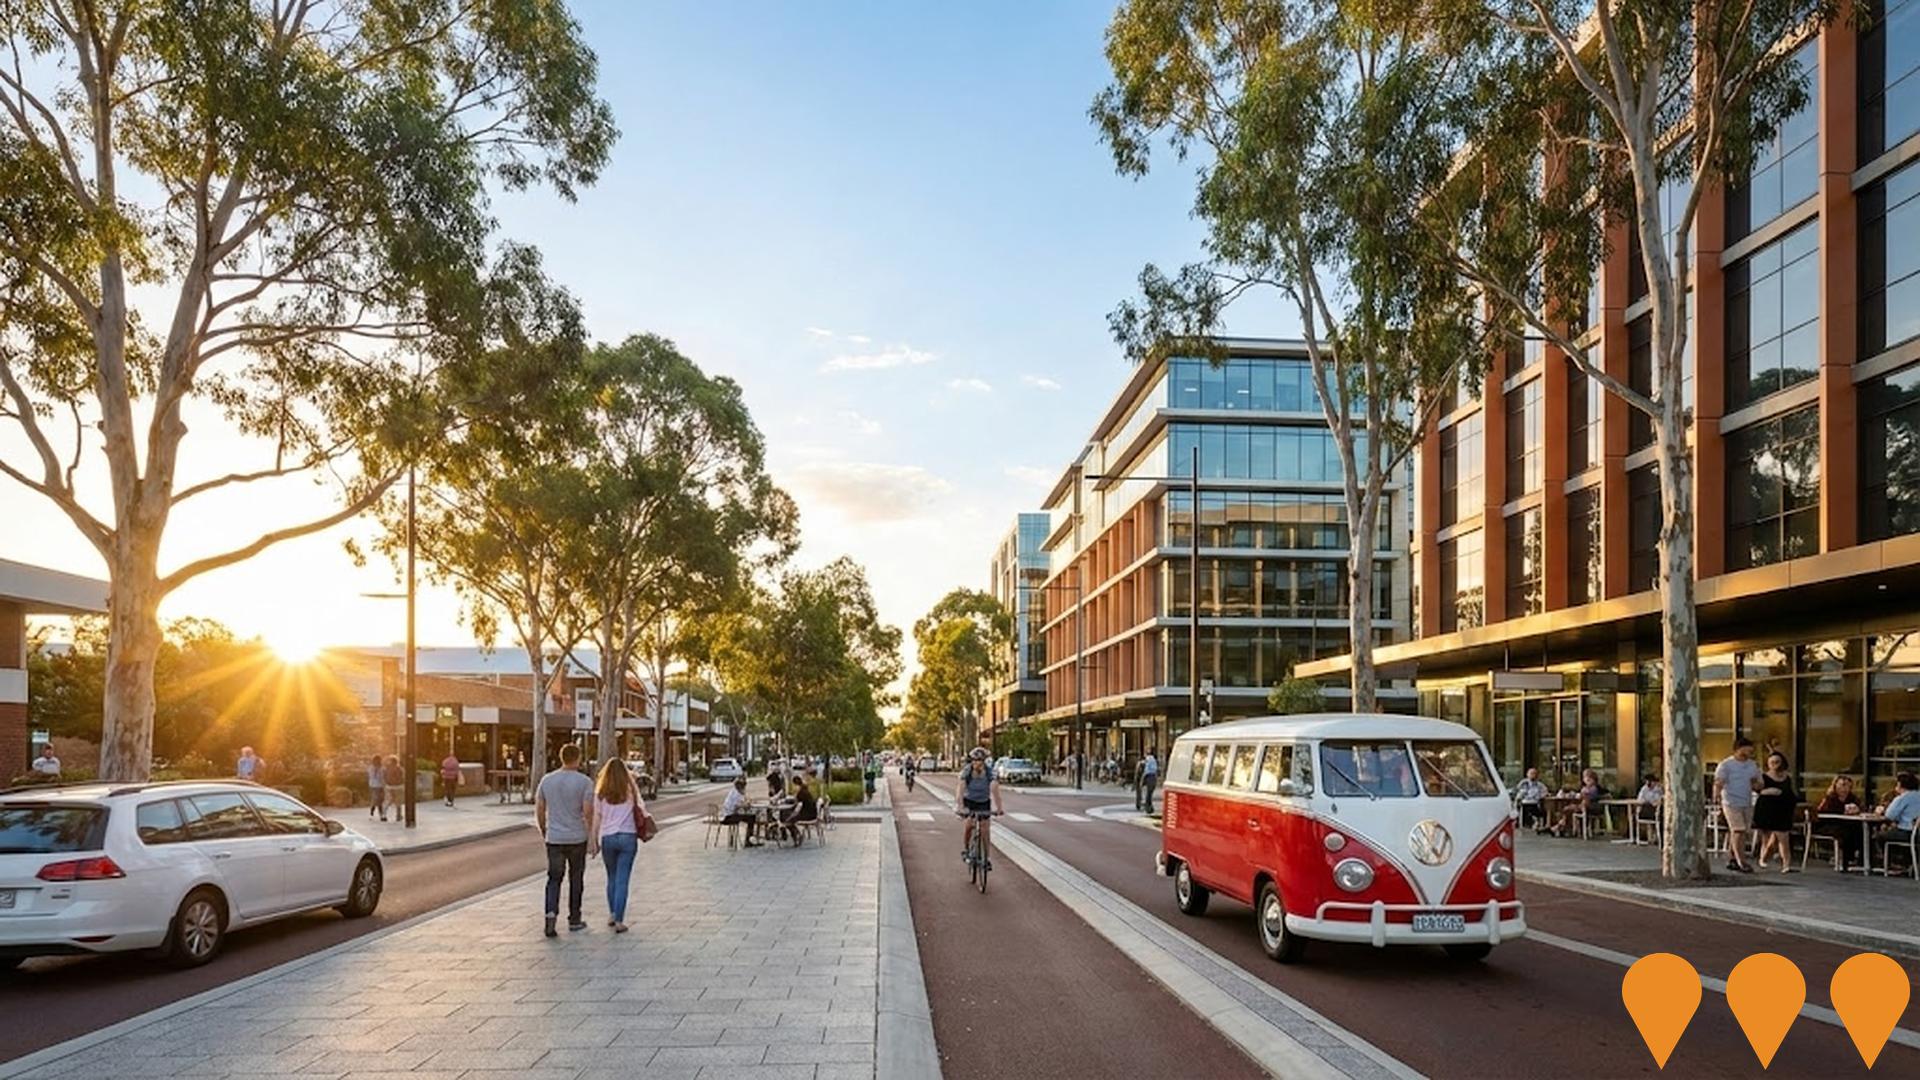
Canning City Centre Regeneration Program
A 10-year, $76 million regeneration program transforming the Canning City Centre into Perth's 'Southern CBD'. The project focuses on creating a high-density, mixed-use strategic centre connecting the Cannington Train Station to Westfield Carousel. Key completed works include the Cecil Avenue West and East upgrades (now open), which delivered dedicated bus lanes, smart infrastructure, and improved pedestrian access. Future stages include the 'Cecil Avenue Central' upgrade, currently in concept design. The program aims to support 10,000 new homes for 25,000 residents and generate $2.2 billion in economic value.
Canning City Centre Regeneration Program
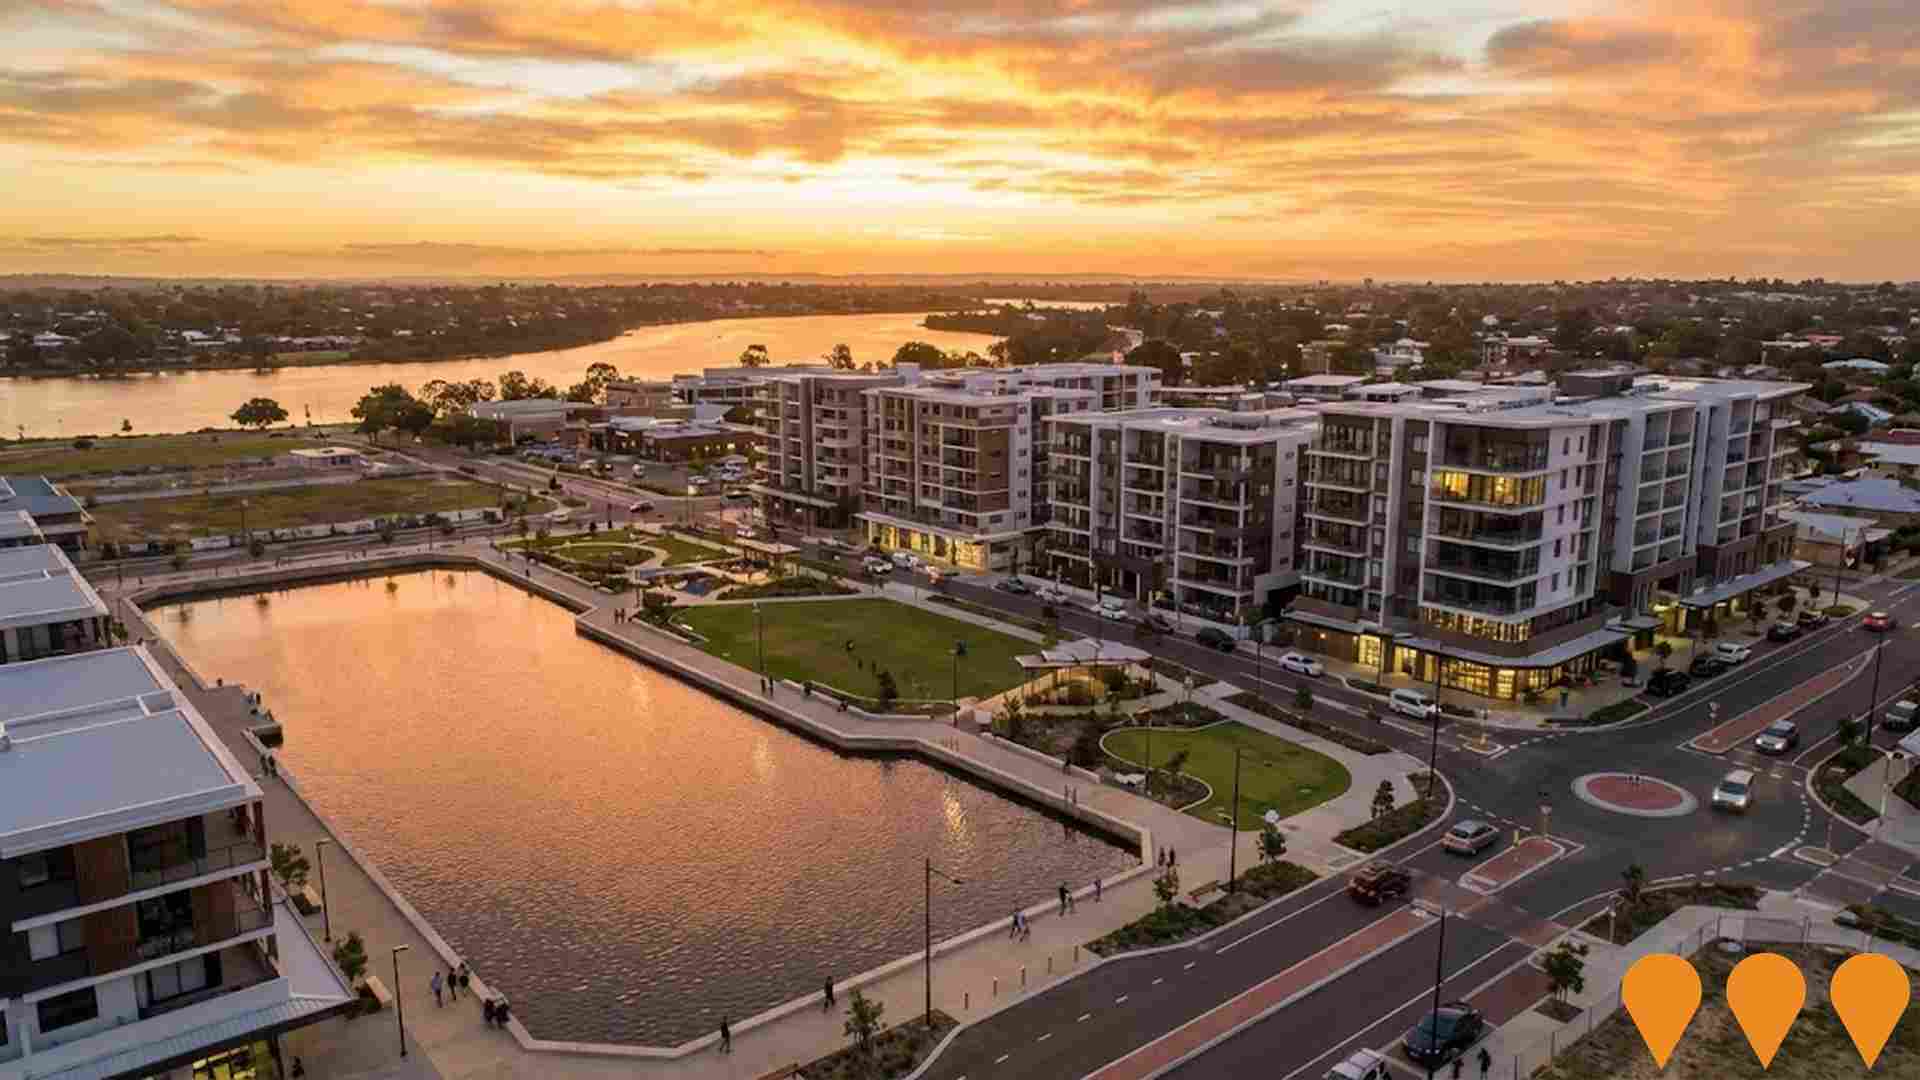
A long term regeneration initiative led by the City of Canning to transform the Canning City Centre around Cecil Avenue and the Canning River into Perth's southern CBD. The program is delivering upgraded streetscapes, smart public realm and water sensitive infrastructure, with completed Phase 1 projects including Cecil Avenue West and East, Wharf Street Basin Next Generation Community Park, the Lake Street Urban Stream and the Lake Street Extension. Over the life of the four phase, 20 year program the City Centre is planned to accommodate around 10,000 new homes and up to 25,000 residents through higher density housing, transit oriented development, town squares and mixed use precincts.
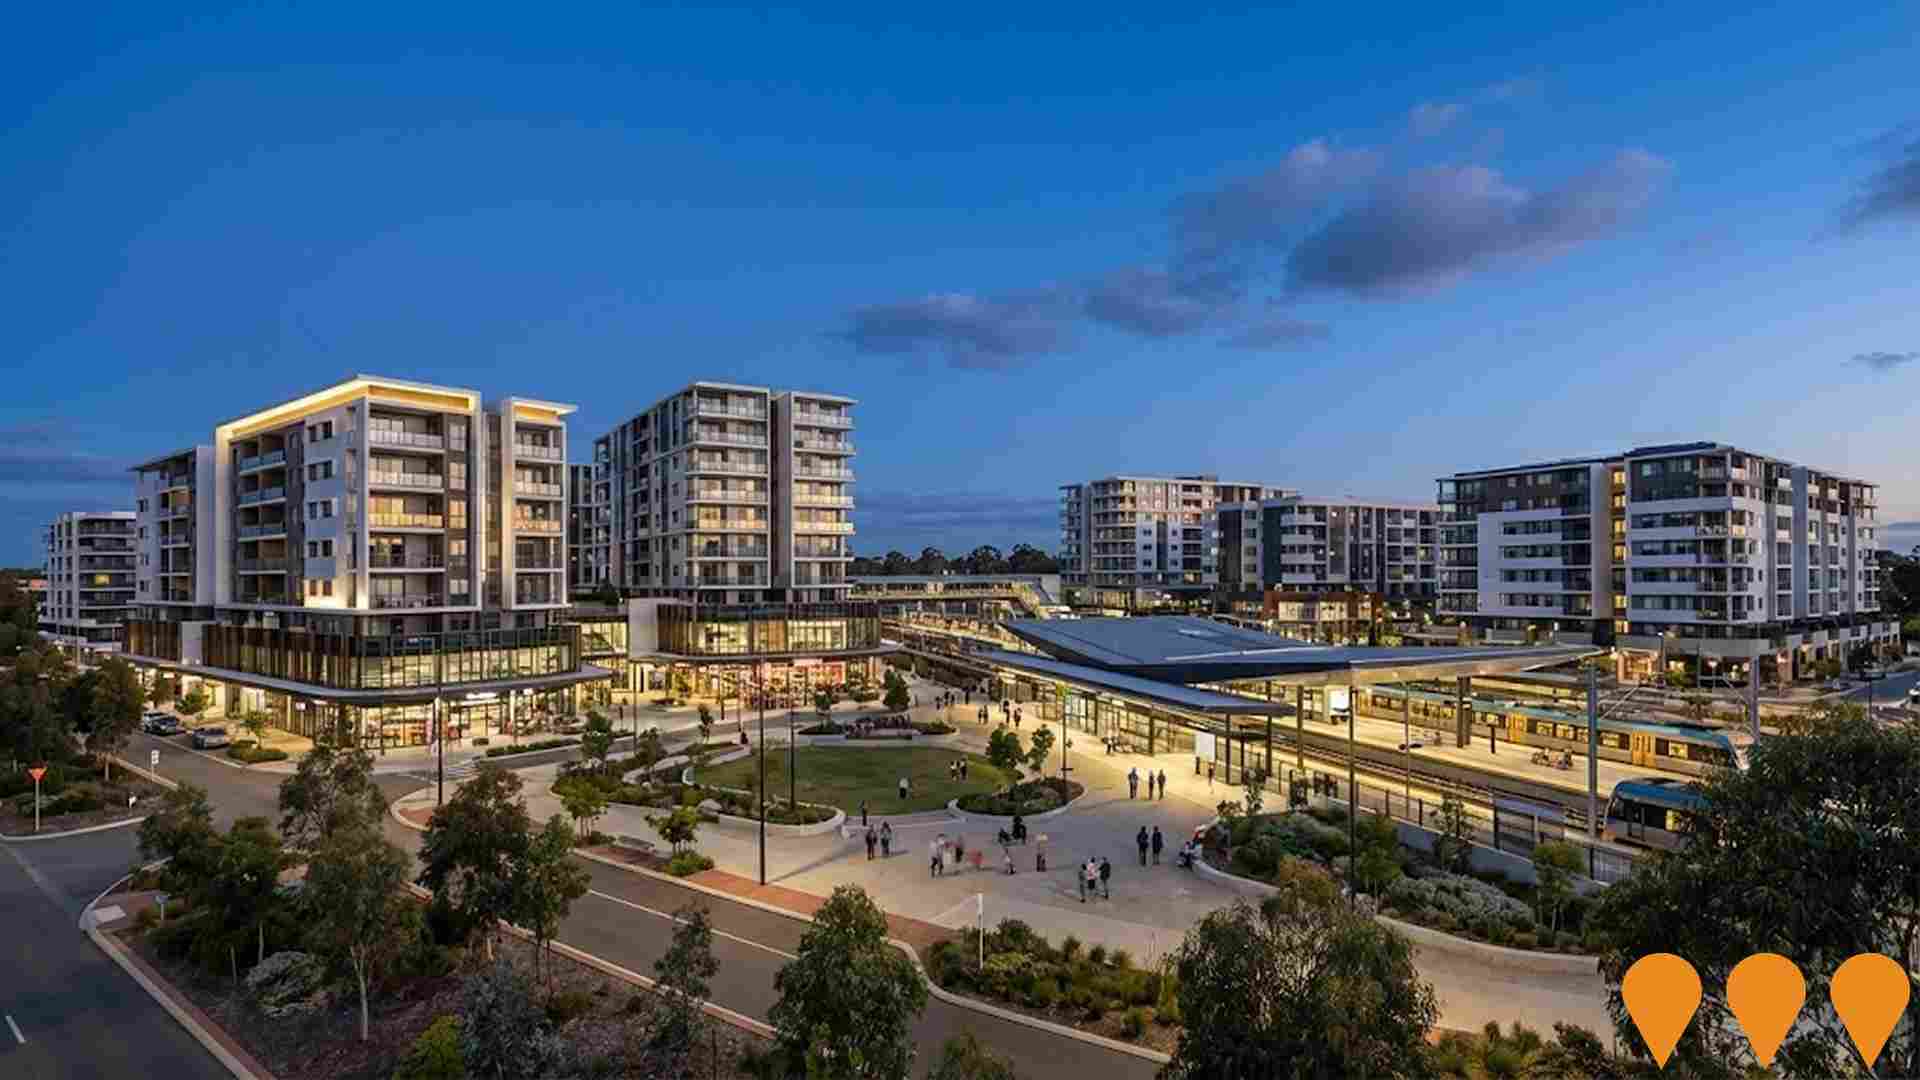
Maddington Central Redevelopment
Major urban renewal project led by Sirona Urban following Realside Property's $107 million acquisition of Maddington Central in 2024. The masterplan for the 13-hectare site envisions a vibrant mixed-use town centre integrated with the upgraded METRONET station, featuring retail, commercial, and significant new residential precincts to support a projected population of over 7,000.
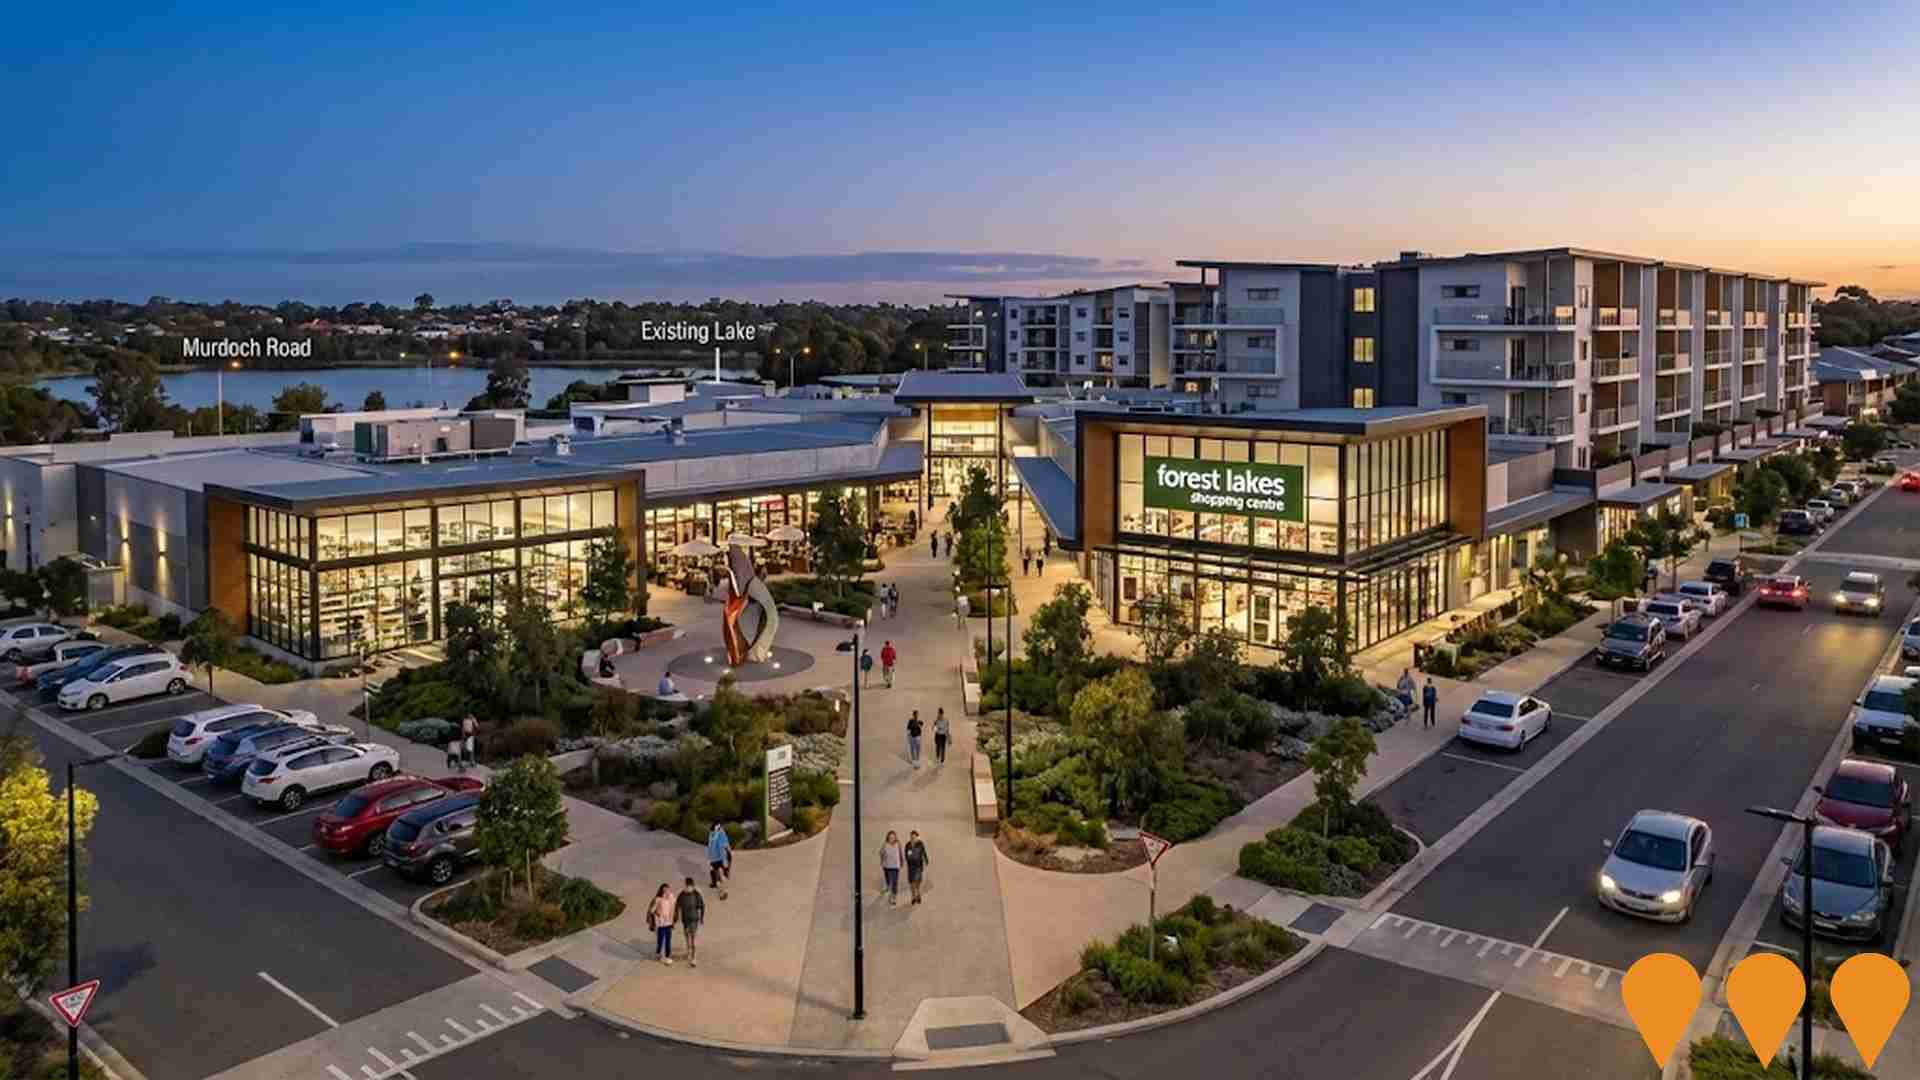
Forest Lakes District Centre Precinct Structure Plan
The Forest Lakes District Centre Precinct Centre Precinct Structure Plan was approved by the Western Australian Planning Commission on 12 November 2024. It provides the planning framework to expand the existing neighbourhood centre into a larger district centre with up to 21,314 mý of shop/retail net lettable area by 2033, improved pedestrian connectivity, mixed-use opportunities and enhanced public realm. The structure plan area covers approximately 7.76 ha in Thornlie, City of Gosnells.
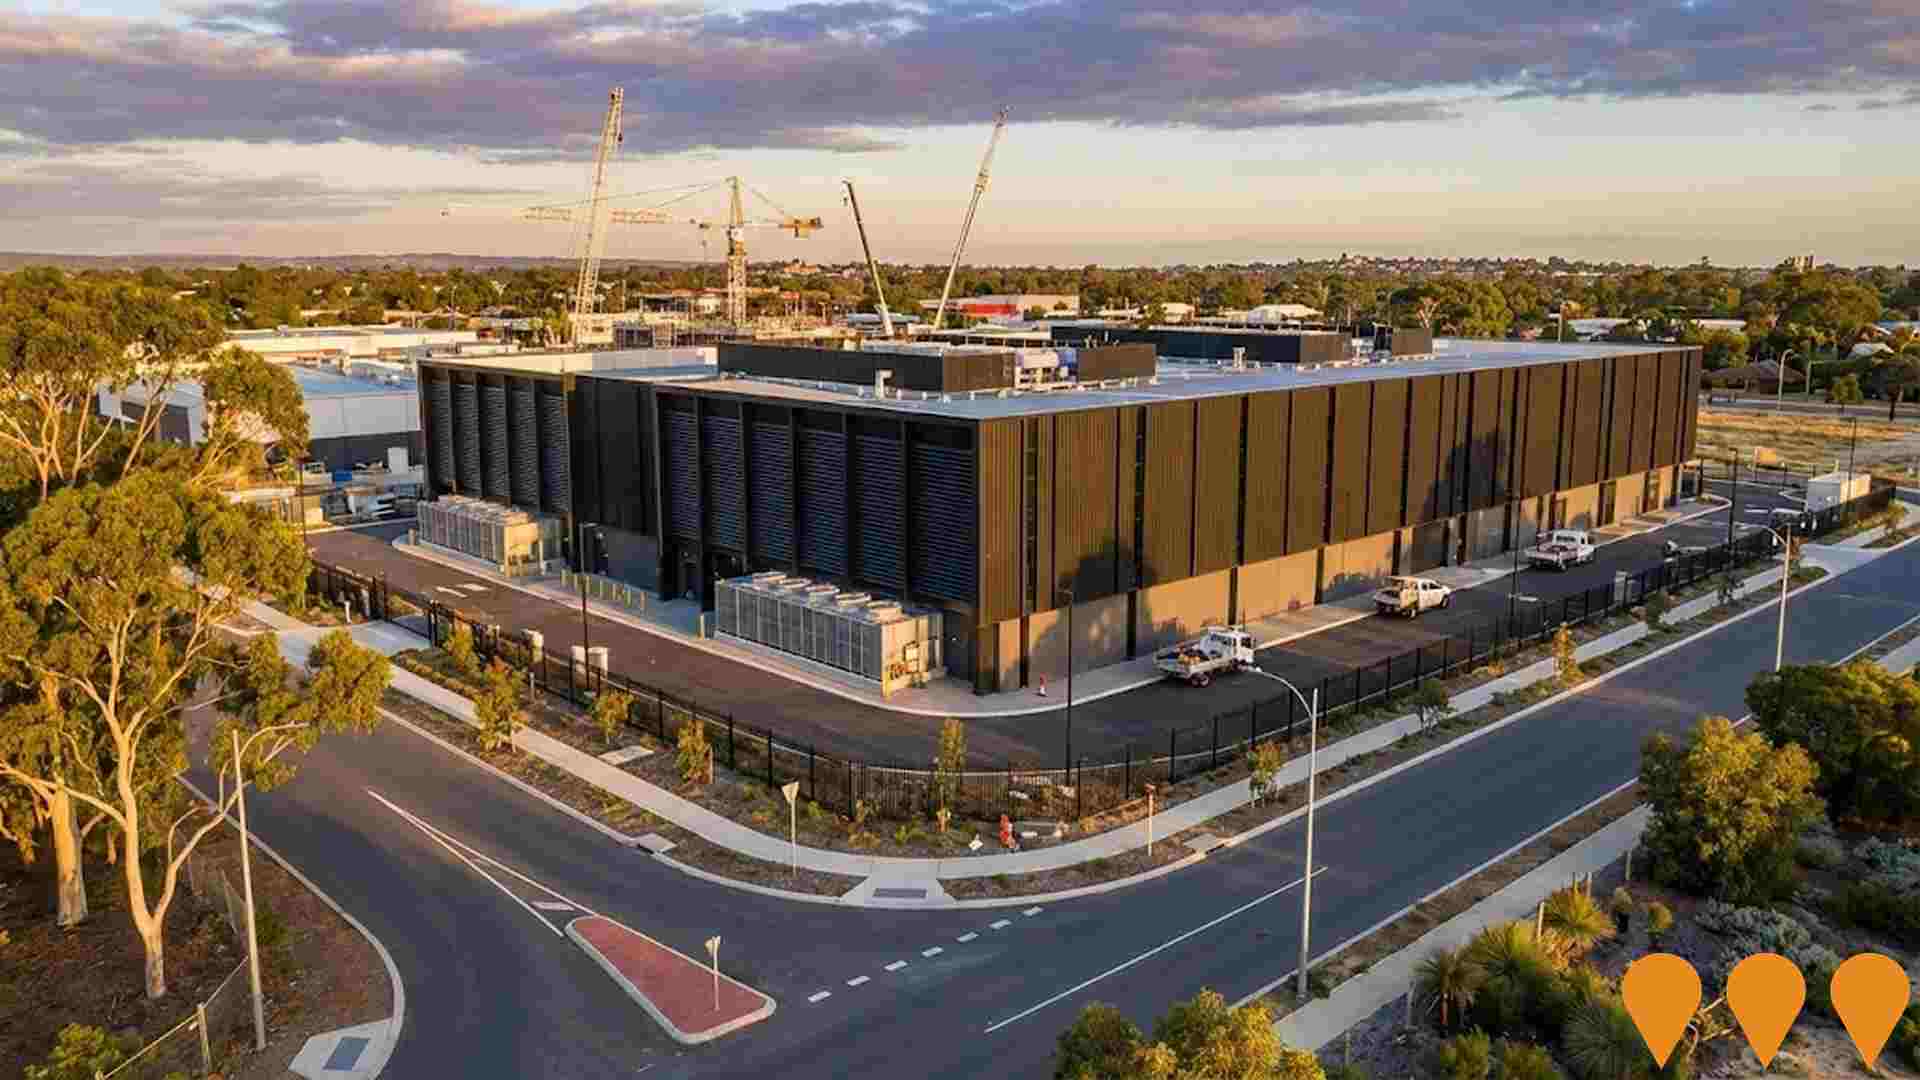
CDC Maddington Data Centre Campus
CDC Data Centres plans a 200MW high-density data centre campus in Maddington within the MKSEA area. The first stage is valued at about AUD 415 million, with initial operations targeted for 2026. The project has secured Development Assessment Panel approval and will support AI, cloud and secure government workloads, using advanced liquid cooling and closed-loop water systems.
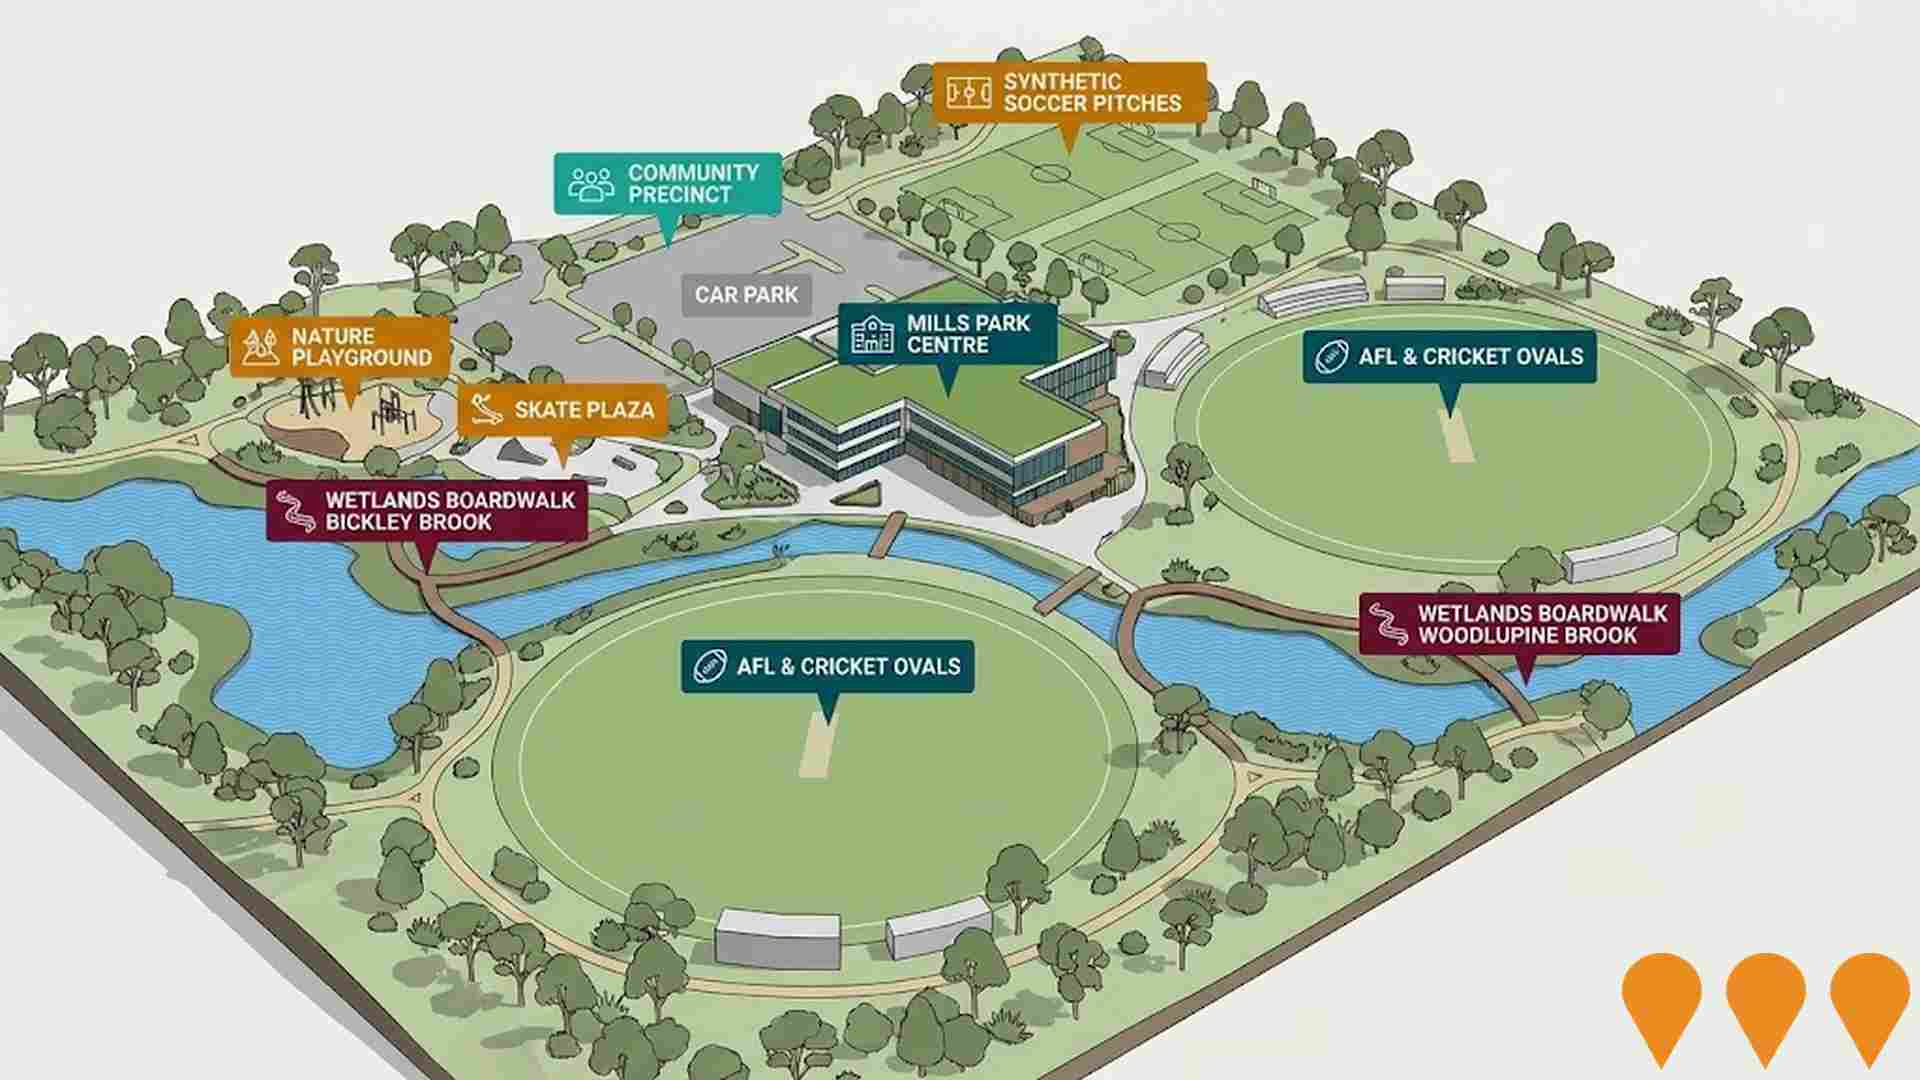
Mills Park Sporting Precinct Development
A comprehensive $47 million redevelopment of a 24-hectare recreational precinct featuring two sporting facilities (AFL and cricket), Mills Park Centre community complex with 6-star Green Star rating, nature playground, skate plaza, wetlands boardwalk, library, cafe, function halls, and extensive recreational amenities including BBQ facilities, picnic areas, and walking trails connecting Woodlupine and Bickley Brooks.
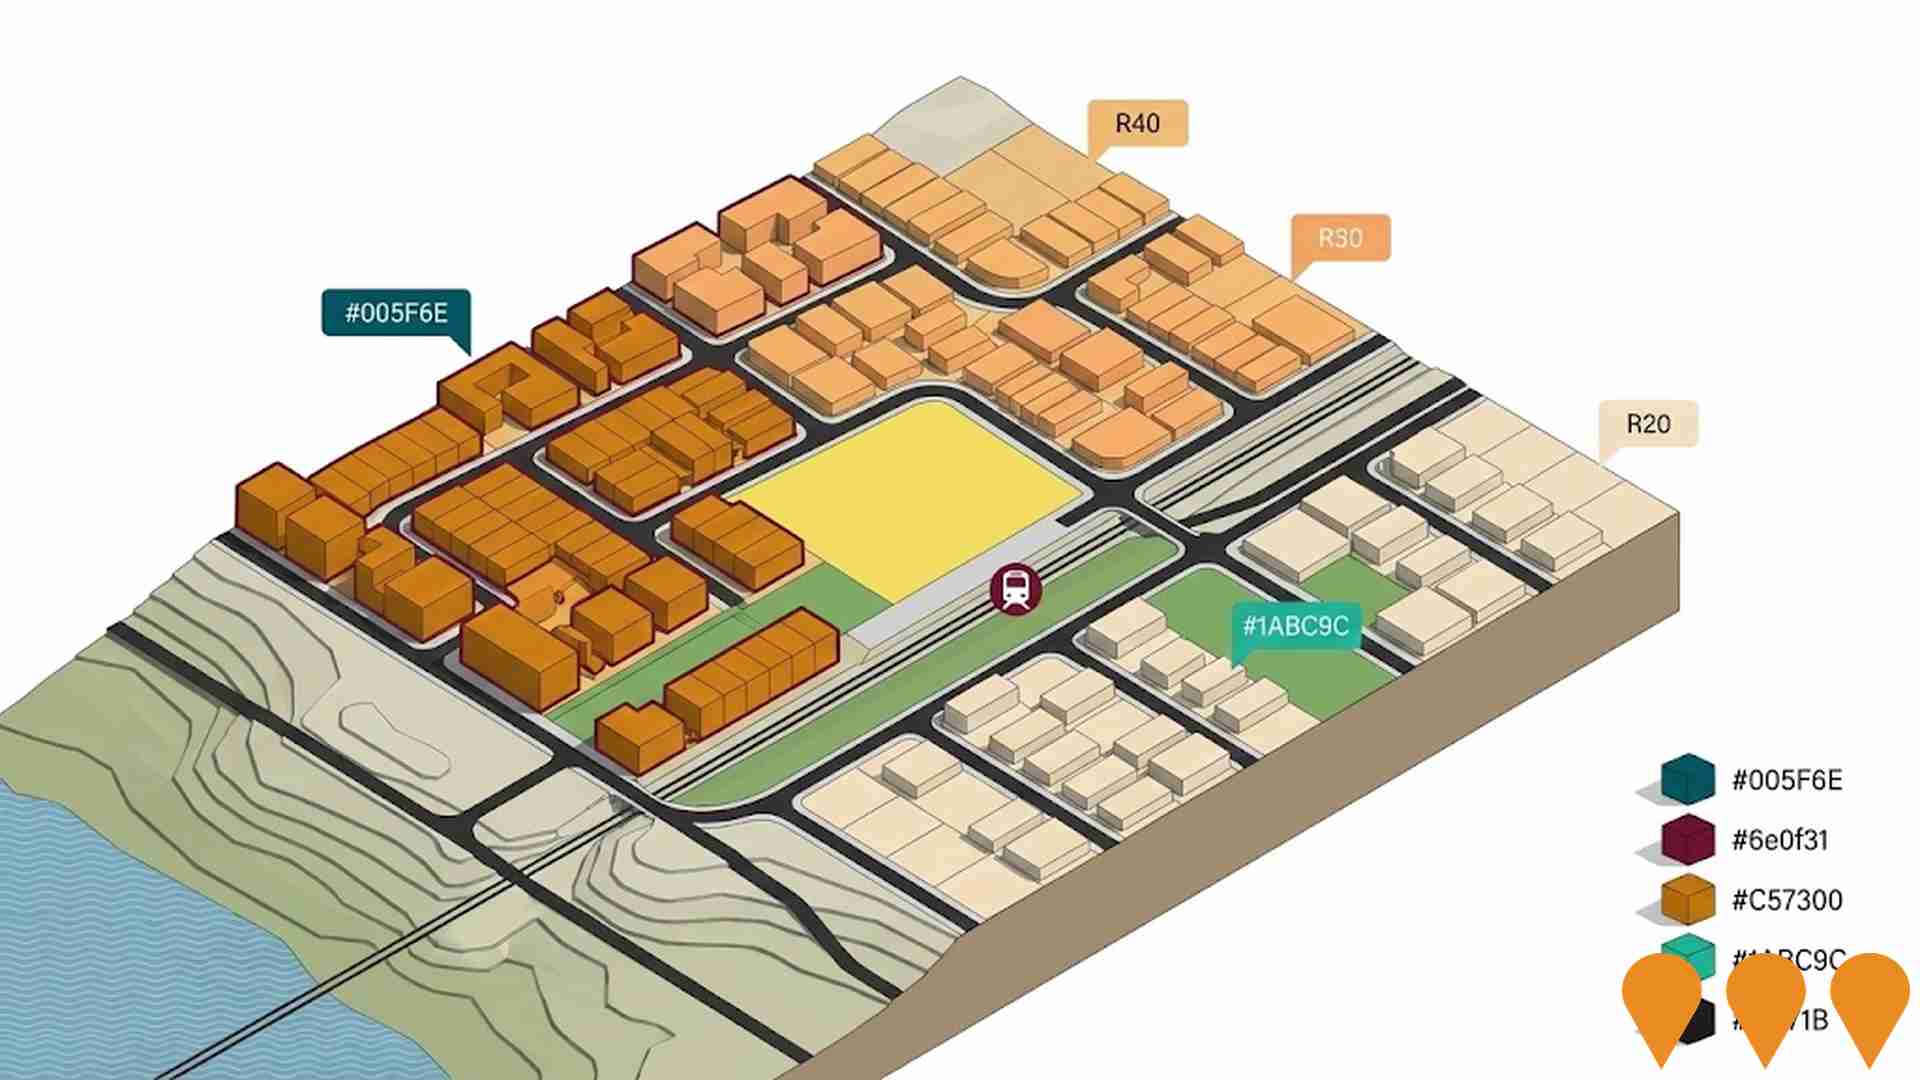
Central Maddington Outline Development Plan
Outline development plan for 90 hectares of central Maddington providing framework for increased residential density, new roads and public open space to facilitate coordinated redevelopment around the railway station.
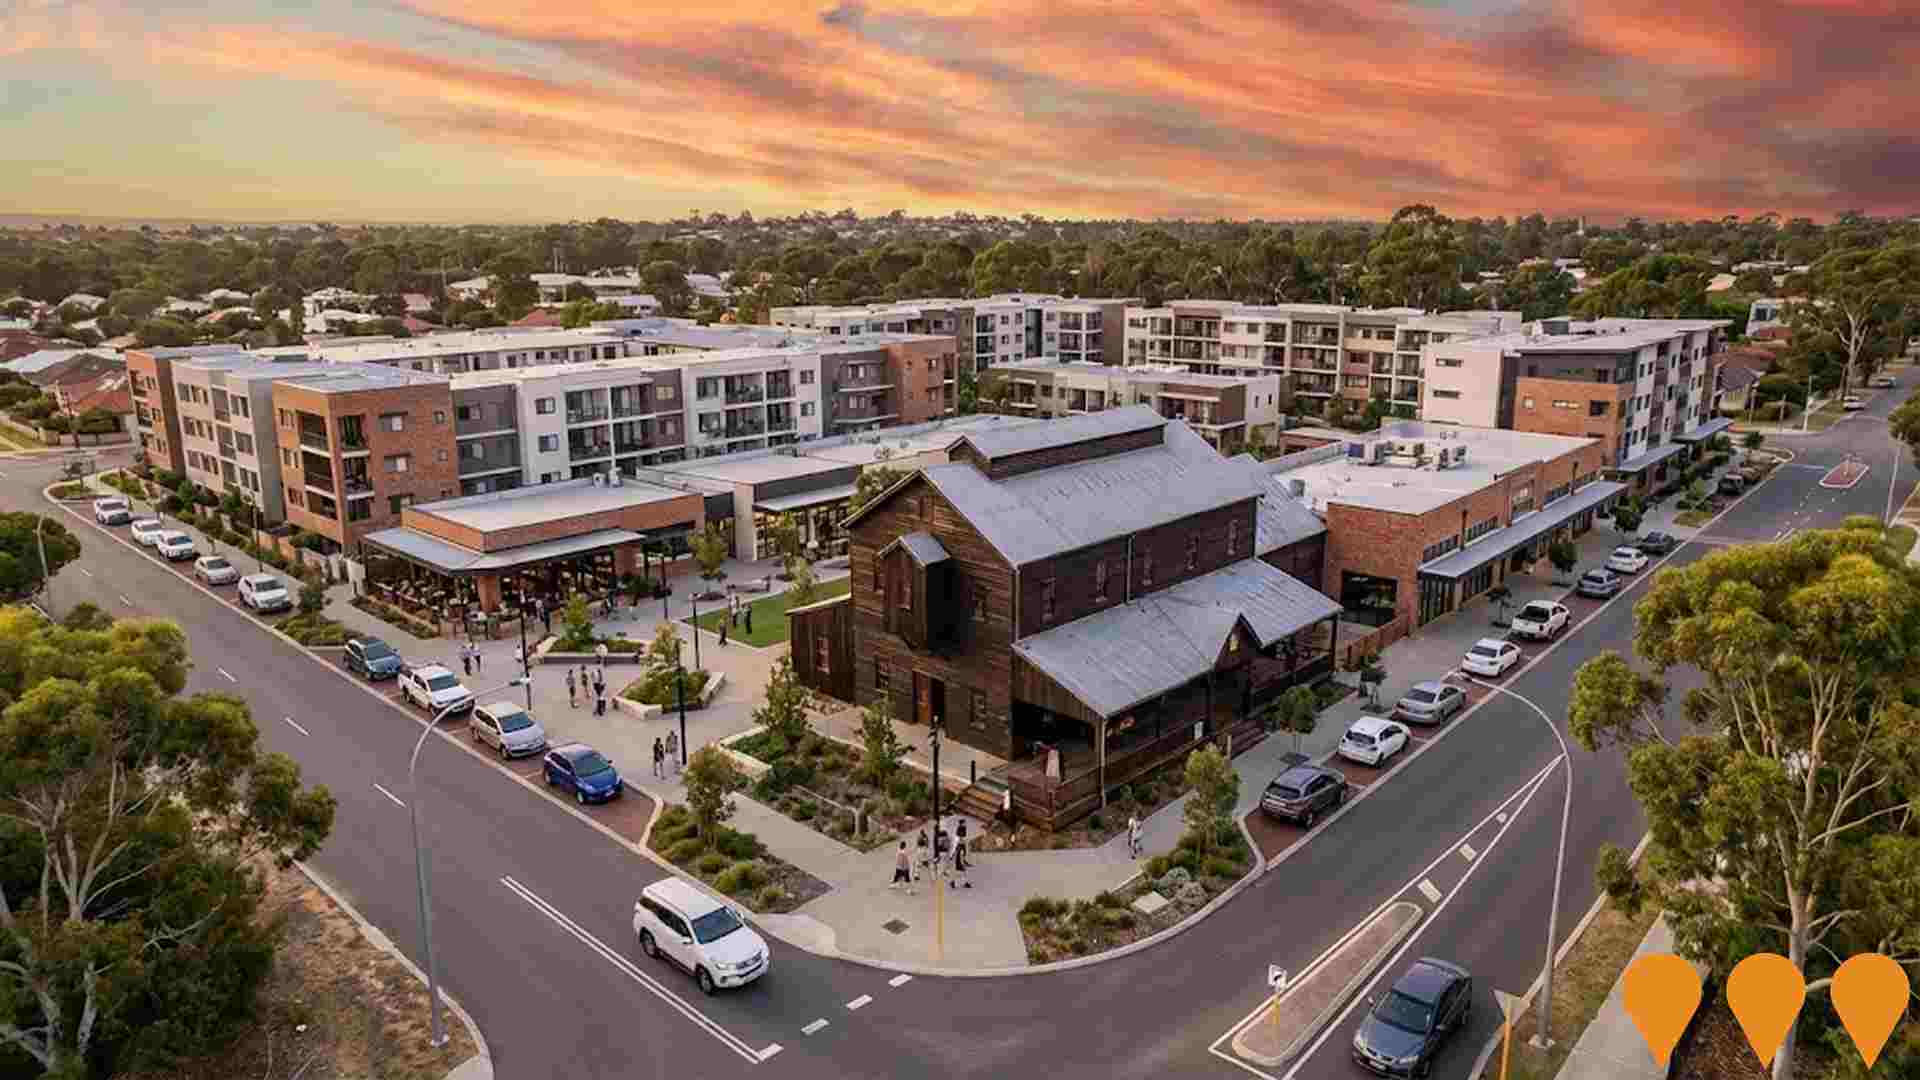
Mason & Bird Heritage Precinct Redevelopment
Mixed-use heritage precinct redevelopment featuring residential apartments, commercial spaces, and preservation of the historic Mason & Bird timber mill site in the heart of East Cannington.
Employment
Employment performance in Beckenham - Kenwick - Langford has been below expectations when compared to most other areas nationally
Beckenham-Kenwick-Langford has a skilled workforce with strong representation in manufacturing and industrial sectors. As of September 2025, the unemployment rate is 6.9% and employment growth over the past year is estimated at 2.4%.
There are 11,752 residents employed while the unemployment rate is 3.0% higher than Greater Perth's rate of 4.0%. Workforce participation stands at 62.1%, below Greater Perth's 65.2%. Key industries include health care & social assistance, retail trade, and construction. Transport, postal & warehousing shows notable concentration with employment levels at 1.8 times the regional average.
However, education & training is under-represented at 6.0% compared to Greater Perth's 9.2%. Limited local employment opportunities are indicated by Census working population vs resident population data. Over the year to September 2025, employment increased by 2.4%, labour force by 2.4%, with unemployment remaining unchanged. In contrast, Greater Perth saw employment growth of 2.9% and labour force growth of 3.0%. State-level data to 25-Nov-25 shows WA employment contracted by 0.27%, with state unemployment at 4.6% compared to the national rate of 4.3%. National employment forecasts from May-25 suggest Beckenham-Kenwick-Langford's employment should increase by 6.1% over five years and 12.9% over ten years, based on industry-specific projections.
Frequently Asked Questions - Employment
Income
Income levels sit below national averages according to AreaSearch assessment
The Beckenham-Kenwick-Langford SA2's median income among taxpayers was $50,820 and average income stood at $59,481 in financial year 2022. This compares to Greater Perth's figures of $58,380 and $78,020 respectively. Based on Wage Price Index growth of 14.2% since financial year 2022, current estimates would be approximately $58,036 (median) and $67,927 (average) as of September 2025. Census data reveals household, family and personal incomes all rank modestly in Beckenham-Kenwick-Langford, between the 30th and 35th percentiles. Income analysis shows that 35.0% of the population (8,054 individuals) fall within the $1,500 - $2,999 income range, consistent with broader trends across the surrounding region showing 32.0% in the same category. Housing affordability pressures are severe, with only 82.7% of income remaining, ranking at the 34th percentile.
Frequently Asked Questions - Income
Housing
Beckenham - Kenwick - Langford is characterized by a predominantly suburban housing profile, with a higher proportion of rental properties than the broader region
The dwelling structure in Beckenham-Kenwick-Langford, as per the latest Census, consisted of 86.3% houses and 13.8% other dwellings (including semi-detached homes, apartments, and 'other' dwellings). This compares to Perth metro's 88.9% houses and 11.1% other dwellings. Home ownership in Beckenham-Kenwick-Langford stood at 25.1%, with mortgaged properties at 41.0% and rented dwellings at 33.9%. The median monthly mortgage repayment in the area was $1,591, below Perth metro's average of $1,733. The median weekly rent figure was recorded at $320, compared to Perth metro's $330. Nationally, Beckenham-Kenwick-Langford's mortgage repayments were significantly lower than the Australian average of $1,863, while rents were substantially below the national figure of $375.
Frequently Asked Questions - Housing
Household Composition
Beckenham - Kenwick - Langford features high concentrations of group households, with a lower-than-average median household size
Family households constitute 69.9% of all households, including 33.8% couples with children, 21.6% couples without children, and 12.5% single parent families. Non-family households account for 30.1%, with lone person households at 25.1% and group households comprising 5.0%. The median household size is 2.7 people, which is smaller than the Greater Perth average of 2.8.
Frequently Asked Questions - Households
Local Schools & Education
Educational attainment in Beckenham - Kenwick - Langford aligns closely with national averages, showing typical qualification patterns and performance metrics
In Beckenham-Kenwick-Langford trail region, 24.9% of residents aged 15 and above hold university degrees, compared to Australia's 30.4%. Bachelor degrees are the most common at 17.3%, followed by postgraduate qualifications at 6.1% and graduate diplomas at 1.5%. Vocational credentials are held by 34.0% of residents aged 15 and above, with advanced diplomas at 10.6% and certificates at 23.4%. Educational participation is high, with 31.8% of residents currently enrolled in formal education.
This includes 10.3% in primary education, 7.5% in secondary education, and 5.8% pursuing tertiary education.
Frequently Asked Questions - Education
Schools Detail
Nearby Services & Amenities
Transport
Transport servicing is good compared to other areas nationally based on assessment of service frequency, route connectivity and accessibility
The analysis shows that there are currently 119 active public transport stops operating in the Beckenham-Kenwick-Langford area. These stops offer a mix of train and bus services. The report indicates that these stops are serviced by 34 individual routes, collectively providing 7,984 weekly passenger trips.
The accessibility of transport is rated as good, with residents typically located approximately 241 meters from the nearest transport stop. It is noted that service frequency averages around 1,140 trips per day across all routes, equating to roughly 67 weekly trips per individual stop.
Frequently Asked Questions - Transport
Transport Stops Detail
Health
The level of general health in Beckenham - Kenwick - Langford is notably higher than the national average with prevalence of common health conditions low among the general population though higher than the nation's average across older, at risk cohorts
Beckenham-Kenwick-Langford demonstrates above-average health outcomes with a low prevalence of common health conditions among its general population compared to national averages. However, older, at-risk cohorts have higher rates of these conditions.
Approximately 50% of the total population (~11,391 people) has private health cover, lower than the national average of 55.3%. The most prevalent medical conditions in the area are mental health issues and arthritis, affecting 6.6% and 6.2% of residents respectively. 74.6% of residents declare themselves completely clear of medical ailments, slightly higher than Greater Perth's 73.3%. The area has a population of 3,240 people aged 65 and over, representing 14.1% of its total population.
Frequently Asked Questions - Health
Cultural Diversity
Beckenham - Kenwick - Langford is among the most culturally diverse areas in the country based on AreaSearch assessment of a range of language and cultural background related metrics
Beckenham-Kenwick-Langford has a high level of cultural diversity, with 47.2% of its population speaking a language other than English at home and 50.8% born overseas. Christianity is the main religion in Beckenham-Kenwick-Langford, comprising 41.7% of people. However, Islam is overrepresented compared to Greater Perth, making up 12.7% of the population.
The top three ancestry groups are Other (25.9%), English (18.4%), and Australian (15.7%). Notably, Filipino (4.2%) and Korean (0.8%) ethnic groups are overrepresented in Beckenham-Kenwick-Langford compared to regional averages of 2.9% and 0.5%, respectively.
Frequently Asked Questions - Diversity
Age
Beckenham - Kenwick - Langford's population is younger than the national pattern
Beckenham-Kenwick-Langford's median age is 35 years, slightly younger than Greater Perth's 37 and the national average of 38 years. The 25-34 age group comprises 16.9%, higher than Greater Perth's percentage, while the 55-64 cohort makes up 9.3%. Between 2021 and present, the 75 to 84 age group has increased from 4.0% to 4.8% of the population. Conversely, the 0 to 4 age group has decreased from 7.2% to 6.3%. By 2041, projections show significant demographic shifts: the 75 to 84 cohort is expected to rise by 797 people (72%), reaching 1,907 from its current total of 1,109. Conversely, population declines are forecast for the 0 to 4 and 5 to 14 age groups.
