Chart Color Schemes
This analysis uses ABS Statistical Areas Level 2 (SA2) boundaries, which can materially differ from Suburbs and Localities (SAL) even when sharing similar names.
SA2 boundaries are defined by the Australian Bureau of Statistics and are designed to represent communities for statistical reporting (e.g., census and ERP).
Suburbs and Localities (SAL) represent commonly-used suburb/locality names (postal-style areas) and may use different geographic boundaries. For comprehensive analysis, consider reviewing both boundary types if available.
est. as @ -- *
ABS ERP | -- people | --
2021 Census | -- people







Curious about local property values? Filter the chart to assess the volume and appreciation (including resales) trends and regional comparisons, or scroll to the map below view this information at an individual property level.

Find a Recent Sale

Sales Detail
Shepparton - North has an estimated 20,510 residents, up from 19,928 at the 2021 Census — a change of 582 people, or 2.9%. 765 new addresses have been validated here since Census night. That puts 312 residents on each square kilometre. Population is estimated from ABS Estimated Resident Population releases and GNAF address data, re-based from the 2021 Census and updated annually.
Detail
According to research conducted by AreaSearch, the population residing in Shepparton - North stands at roughly 20,510 as of Aug 2026. This represents a gain of 582 people (2.9%) compared to the 19,928 people tallied in the 2021 Census. Such demographic movement is deduced using ABS estimated resident population figures of 20,315 as of June 2025 alongside 765 validated new addresses documented following the Census. With this population base, the local density stands at 312 persons per square kilometer, ensuring ample room per occupant and considerable scope for future development.
Outpacing both the SA3 area and the SA4 region (1.1%), the 2.9% expansion in Shepparton - North since the 2021 census positions it as a regional growth frontrunner. The principal catalyst for demographic expansion has been international migration, which generated roughly 82.6% of recent net population additions. Projections generated by ABS/Geoscience Australia released in 2024 (anchored to a 2022 baseline) are applied by AreaSearch across SA2 locations. In instances where SA2 boundaries lack this coverage, AreaSearch incorporates the 2023 VIC State Government Regional/LGA projections via a weighted aggregation model that scales LGA growth figures down to SA2 zones. Age cohort growth rates derived from these aggregated models are likewise projected across all territories for the years 2032 to 2041. Looking ahead, the district is slated for notable demographic gains that place it among the top 10 percent of regional areas across the nation, with forecasts pointing to an increase of 11,173 persons to 2041 relative to latest annual ERP population benchmarks, equating to an aggregate rise of 53.5% over the 16 years.
Frequently Asked Questions - Population
723 new dwellings have been approved in Shepparton - North over the past five years, an average of 144 a year. That places the area in the 72nd percentile for residential development activity nationally, about 7 approvals per 1,000 residents a year. Of the 145 dwellings approved in the latest reporting year, 79% were detached houses and the rest townhouses or apartments. Figures come from ABS building approvals aggregated to this SA2 boundary and are updated monthly as the ABS releases them.
Detail
Around 144 dwellings secure building approvals each year in Shepparton - North, culminating in 723 homes approved throughout the past 5 financial years (between FY-22 and FY-26). Over this identical timeframe spanning the past 5 financial years (between FY-22 and FY-26), an average of just 0.3 people per year arrived in the locality for every newly constructed residence. Consequently, local supply matches or outstrips demand, broadening options for purchasers while establishing conditions capable of sustaining growth beyond projected levels, with newly built residences averaging a construction cost of $471,000. Furthermore, commercial building approvals have reached $186.8 million this financial year, underscoring substantial commercial development activity.
When evaluated on a per-capita basis against Rest of Vic., Shepparton - North records an equivalent degree of building activity, preserving an overall market equilibrium in line with regional trends. Of the dwellings recently constructed, standalone homes account for 79.0% while medium and high-density housing represents 21.0%, reinforcing the neighborhood's established low-density profile centered on spacious family dwellings. Featuring roughly 92 people per dwelling approval, Shepparton - North continues to exhibit classic low-density suburban traits. According to the most recent quarterly calculation from AreaSearch, Shepparton - North is projected to welcome 10,975 residents by 2041. In the event that building activity remains at its current pace, the delivery of new dwellings could fail to keep up with demographic expansion, potentially driving heightened buyer competition and bolstering property values.
Frequently Asked Questions - Development
Development applications around Shepparton - North
SOURCE: Planning portals and council registers, compiled by AreaSearch. Distance & bearing measured from the suburb midpoint.
AreaSearch tracks 18 current infrastructure and development projects inside Shepparton - North, worth an estimated $951 million. A further 52 sit in the immediately surrounding suburbs, taking the tracked pipeline within reach of the area to $4.8 billion. 22 are already under construction and 26 are due for completion within three years. The pipeline spans residential development, sports & recreation and communities, precincts & urban renewal. Records are compiled from Infrastructure Australia, state agencies, council planning portals and public announcements, reviewed and updated daily, then ranked by proximity, construction stage, completion horizon and project scale.
Detail
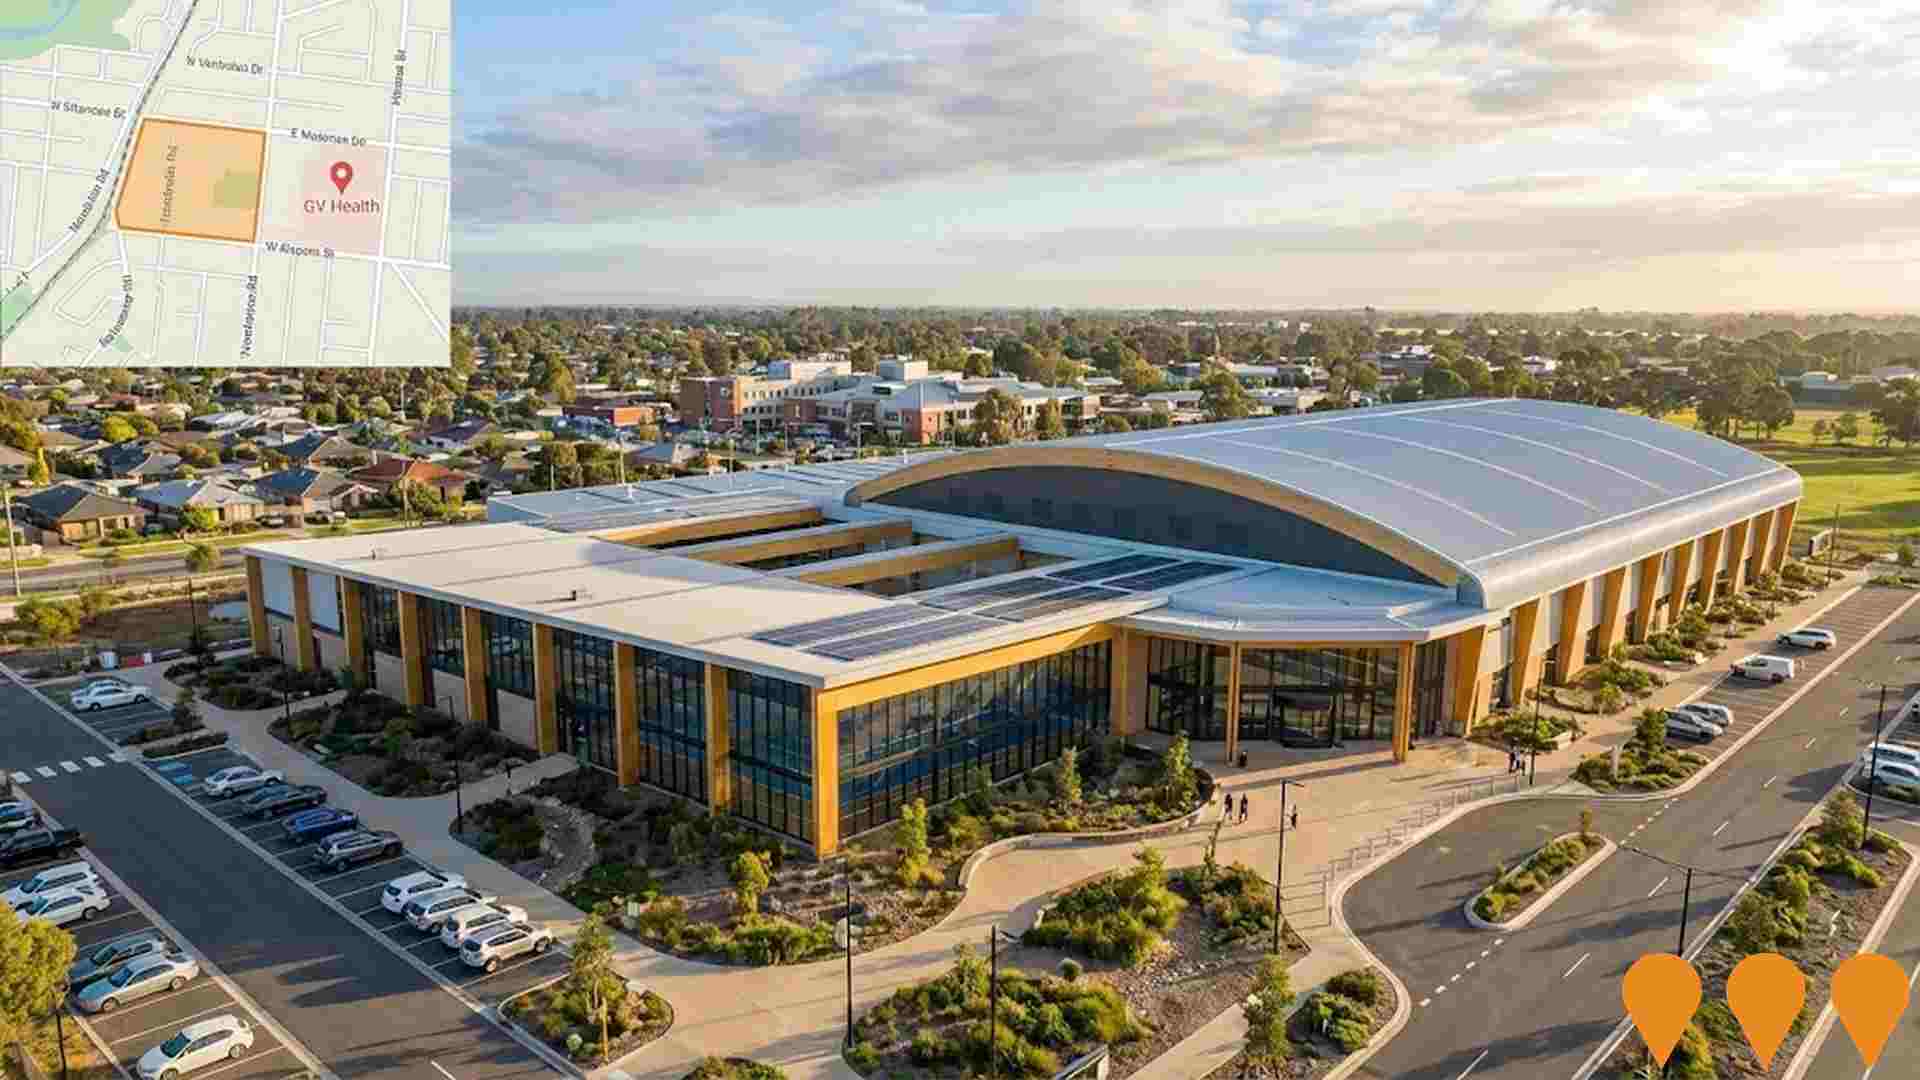
Infrastructure upgrades, major developments, and strategic planning initiatives play a crucial role in shaping a district's evolution. AreaSearch has pinpointed 17 projects expected to influence the locality. Notable developments include the GV Health Staff Accommodation Development, Shepparton Sports & Events Centre Redevelopment, The North Quarter Estate, and the Goulburn Valley Integrated Cancer Centre, with details on the most significant initiatives presented below.
Professional plan users can use the search below to filter and access additional projects.
INFRASTRUCTURE SEARCH
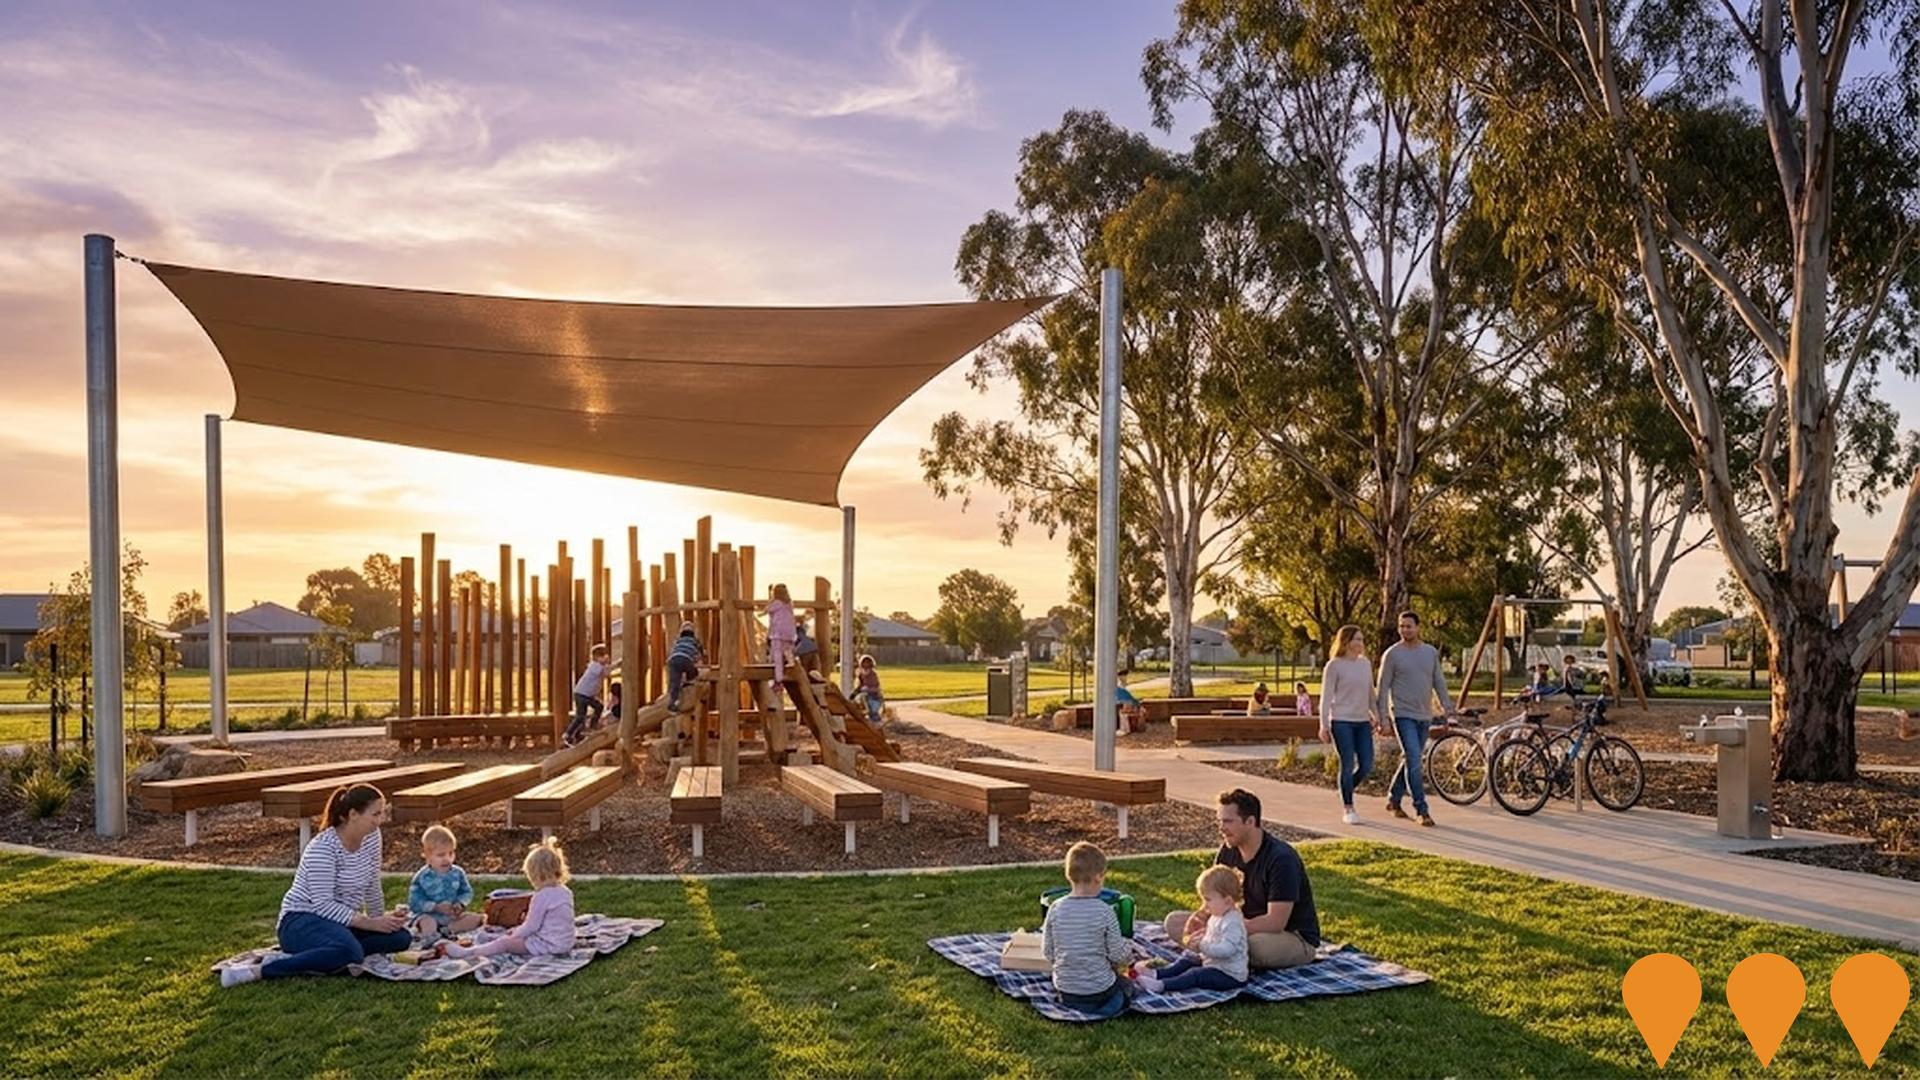
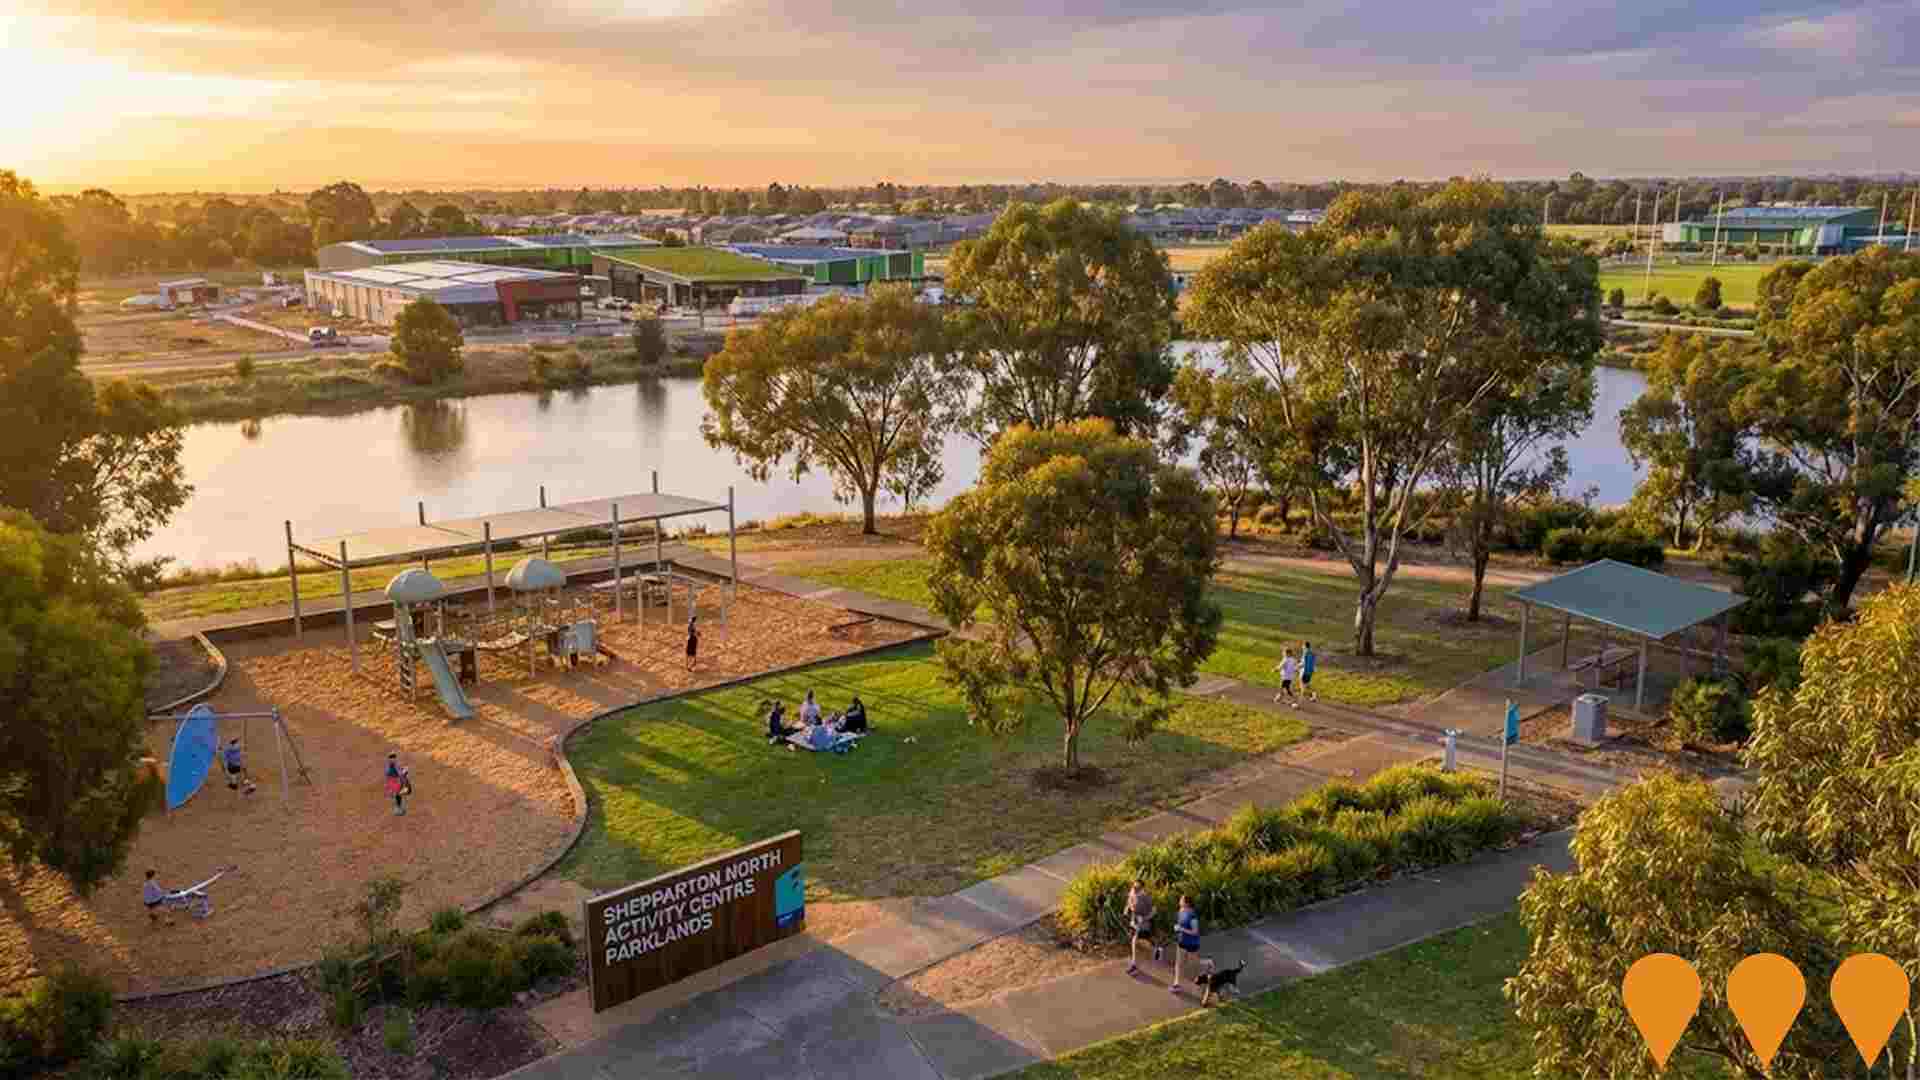
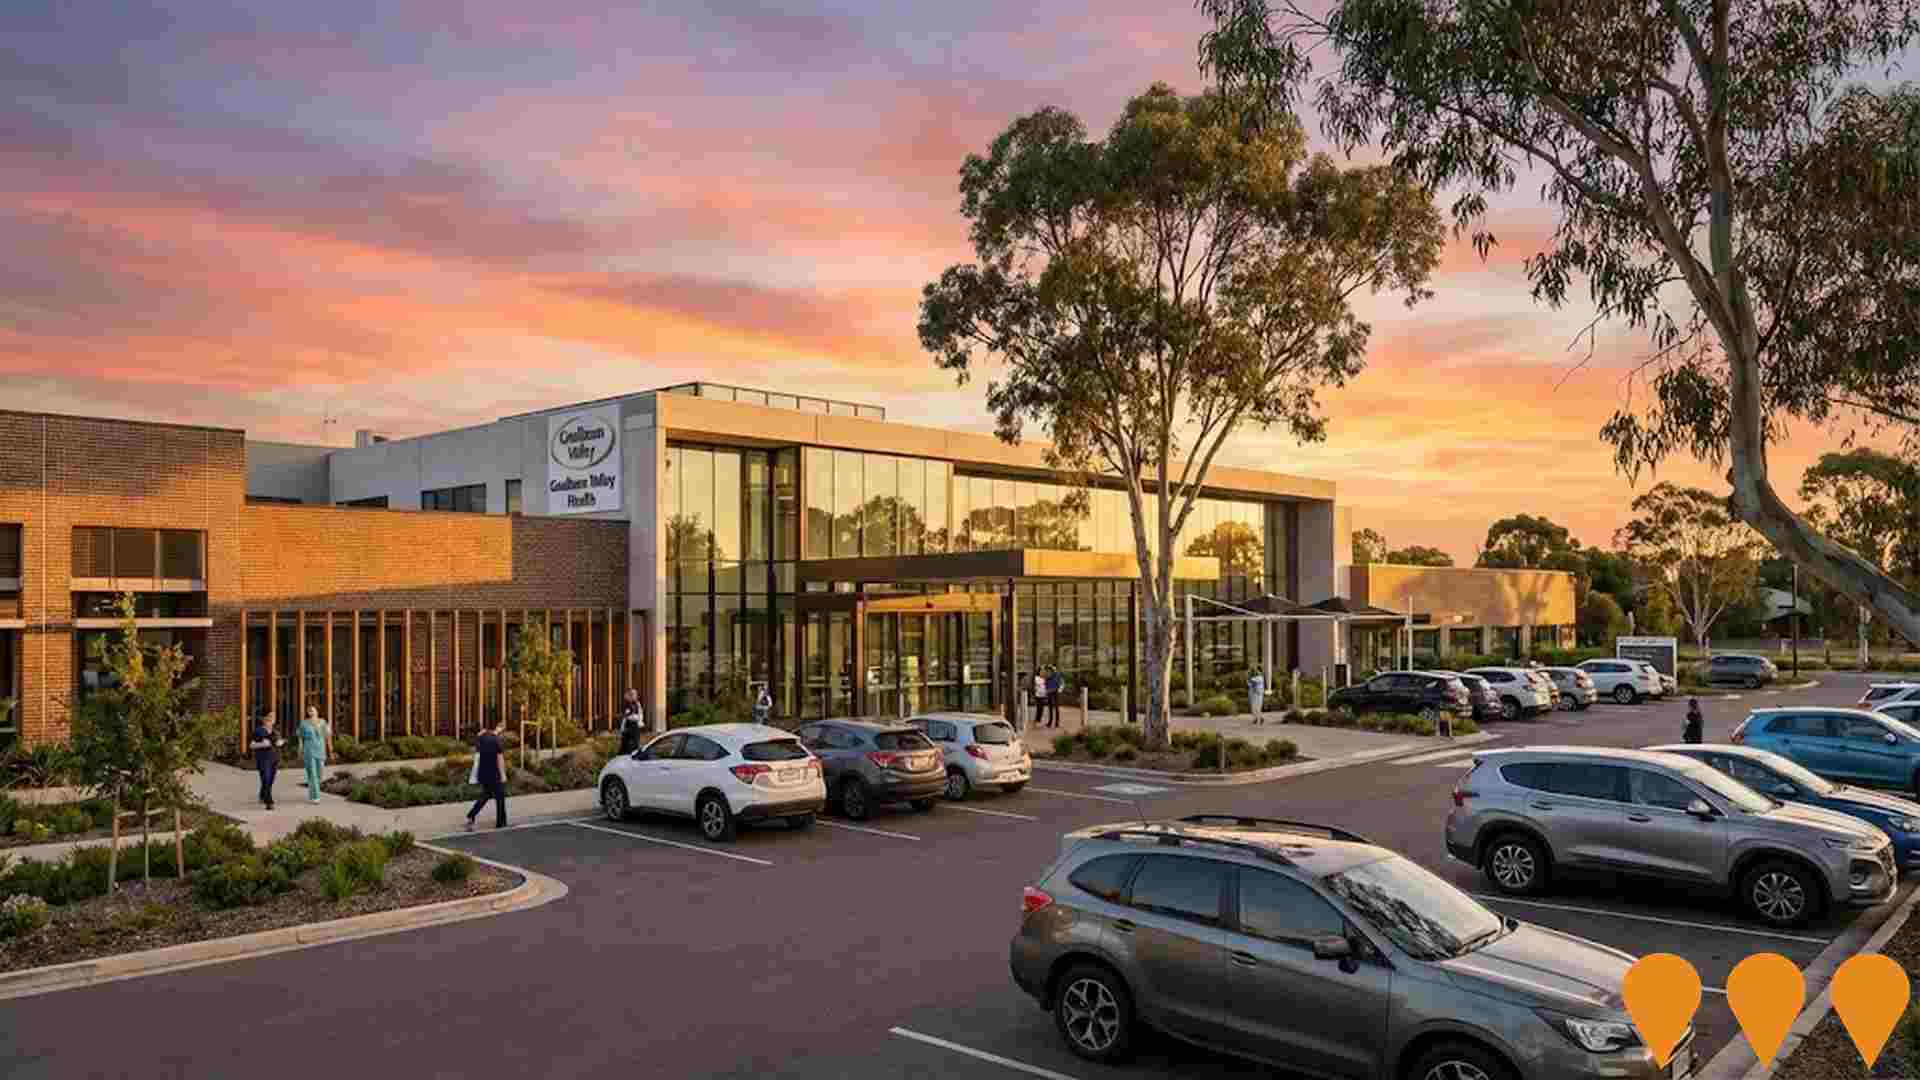
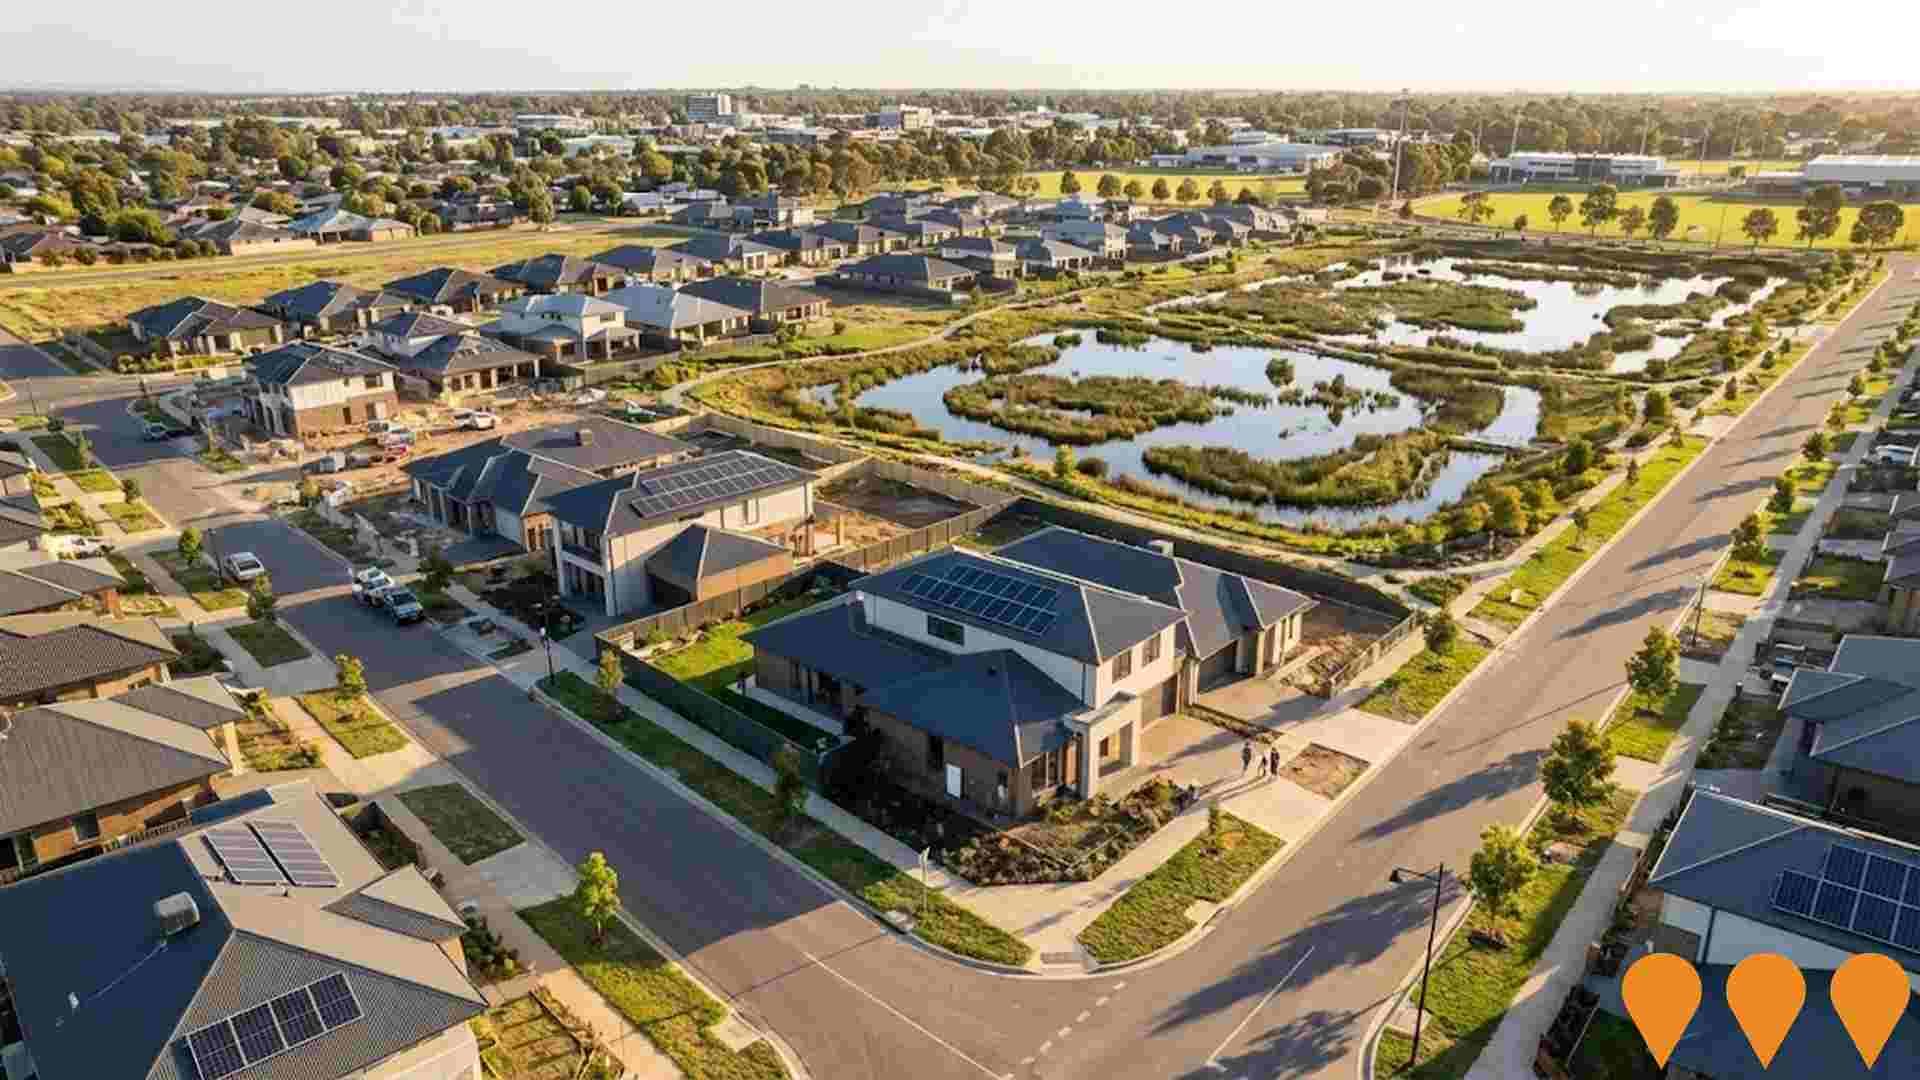
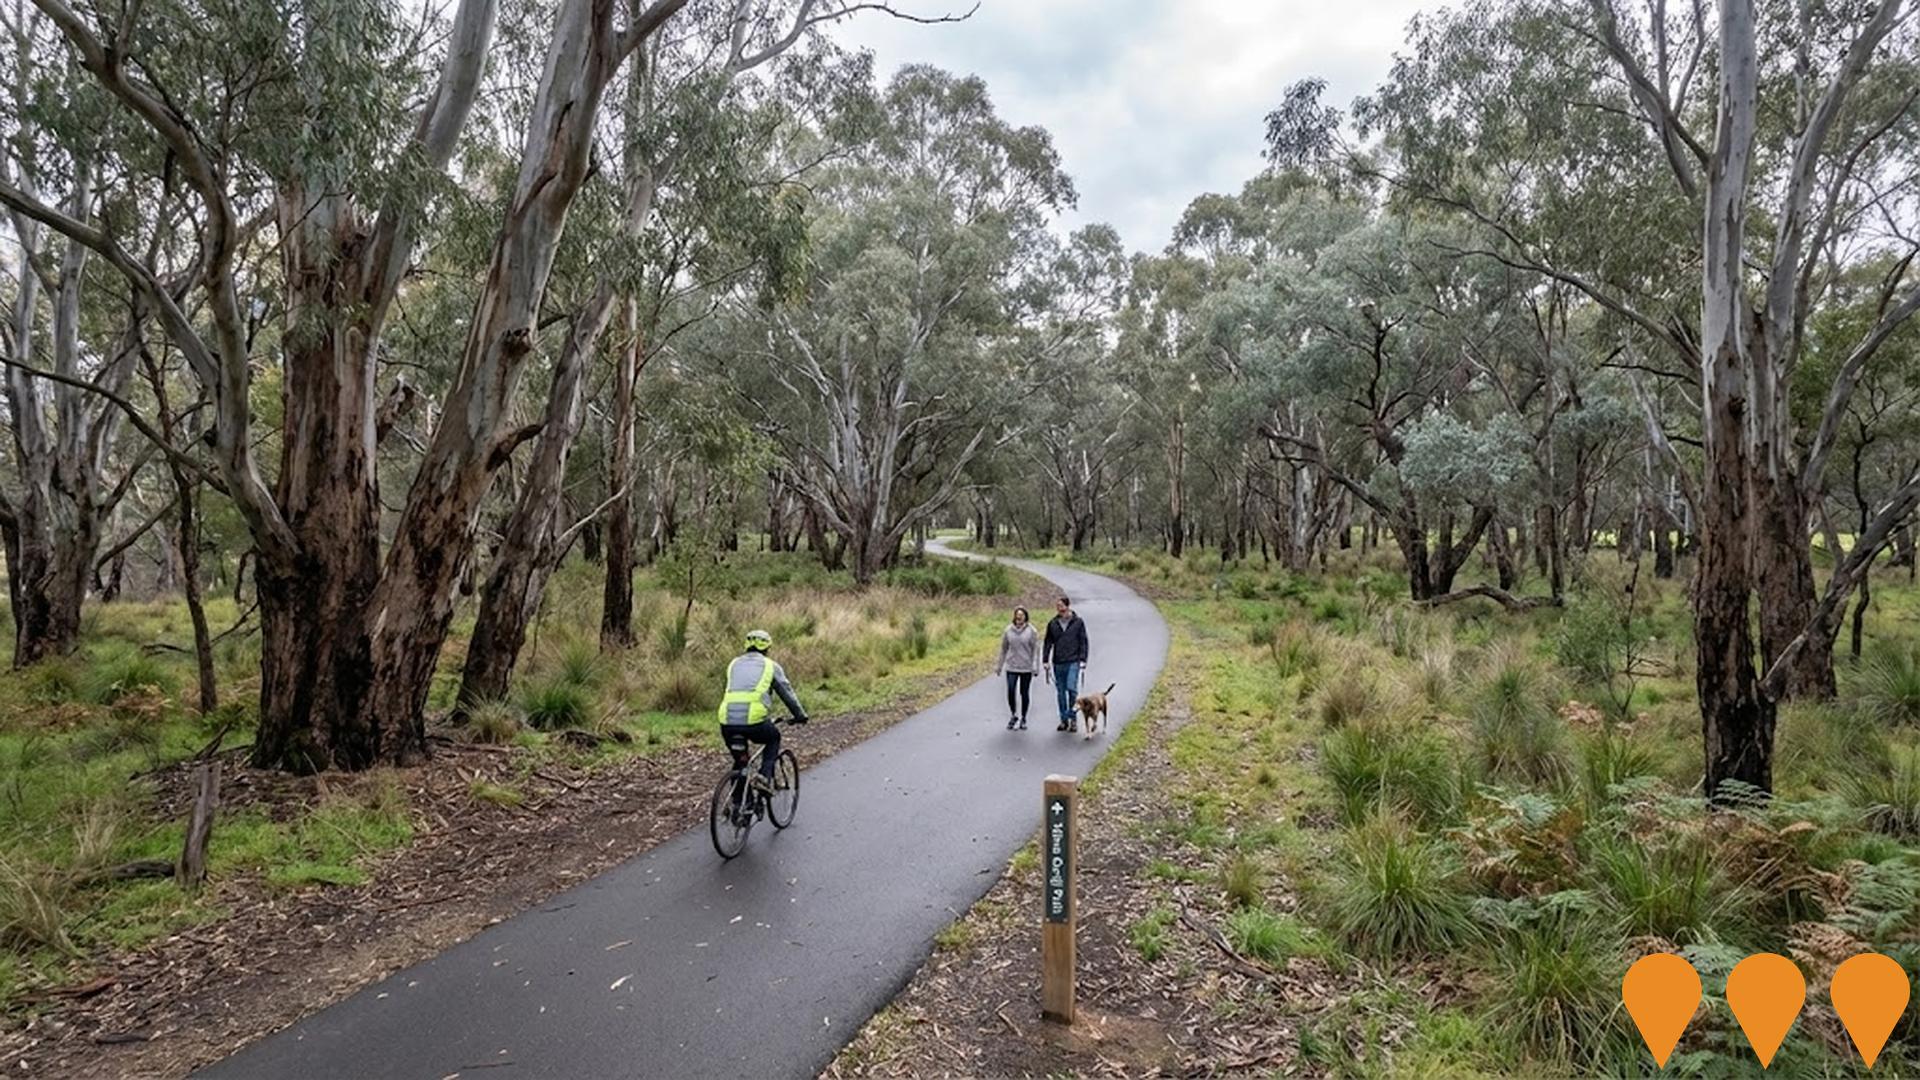
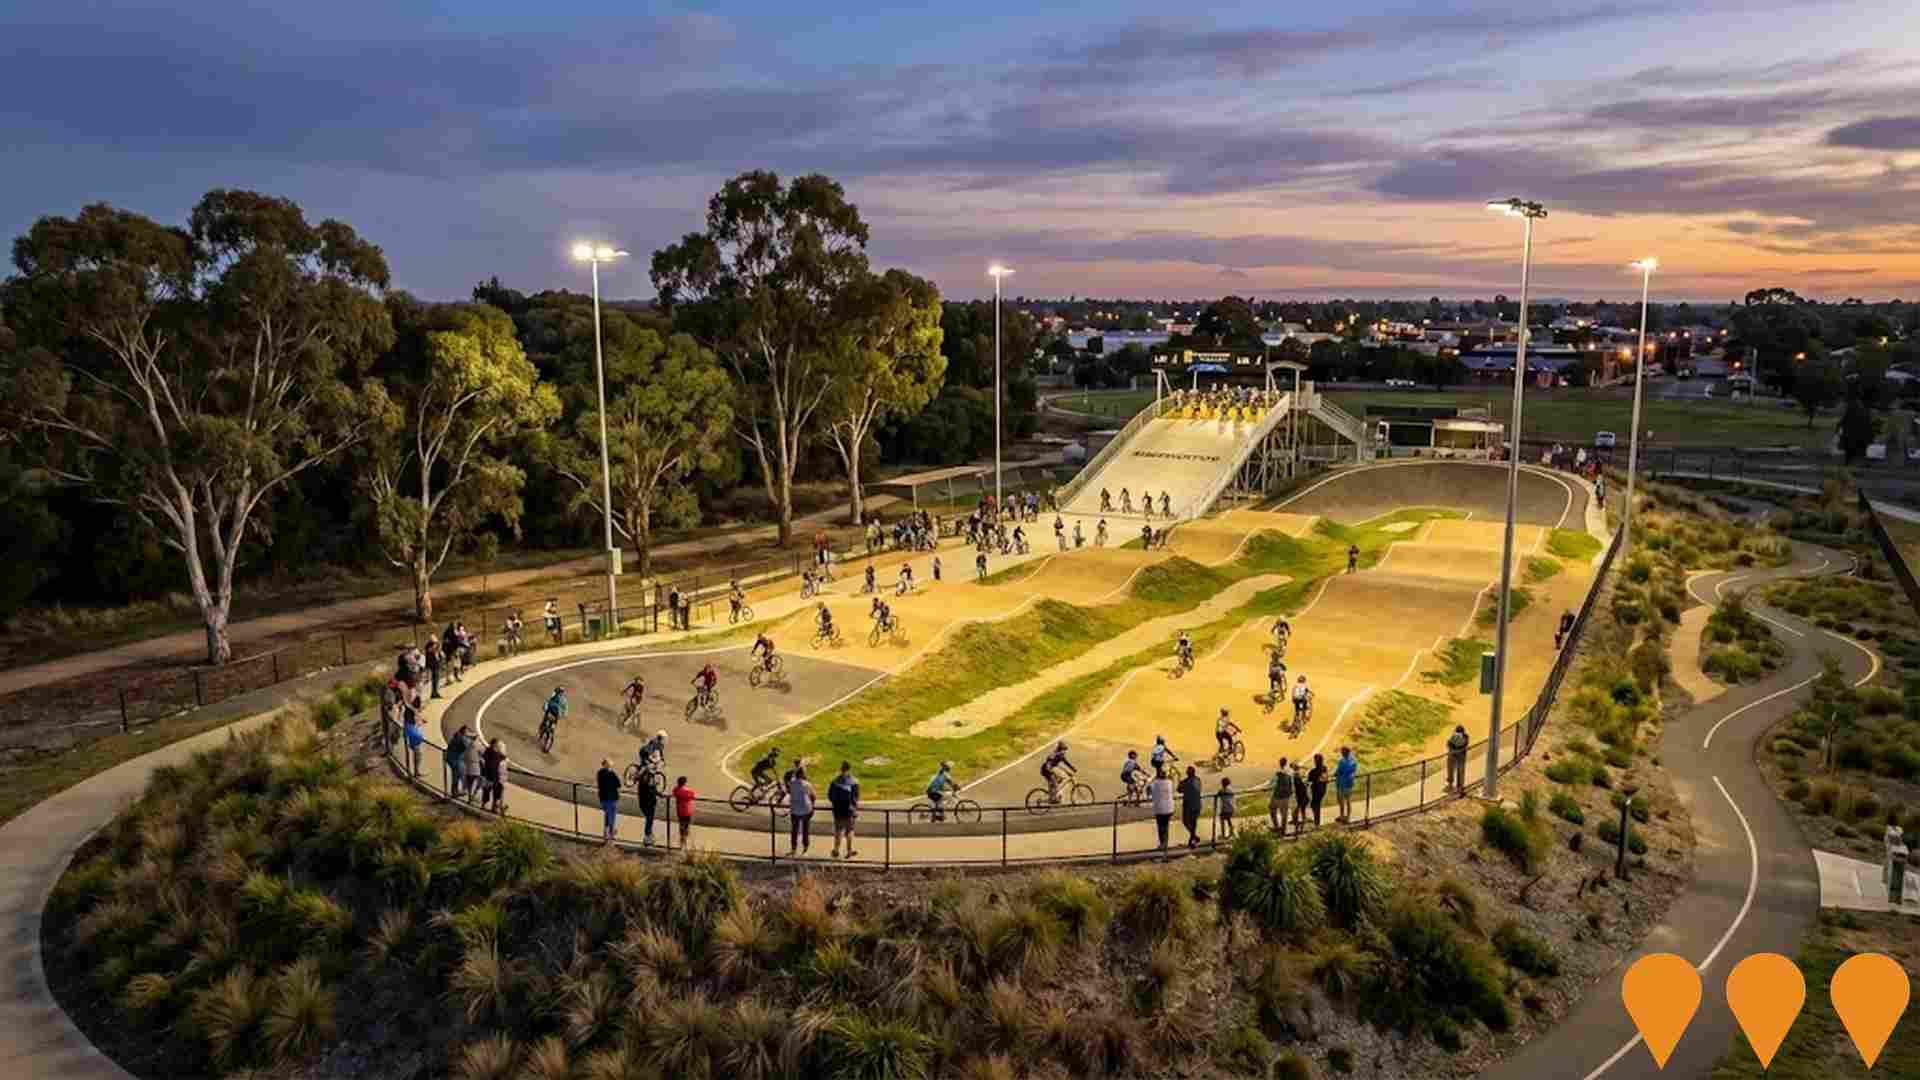
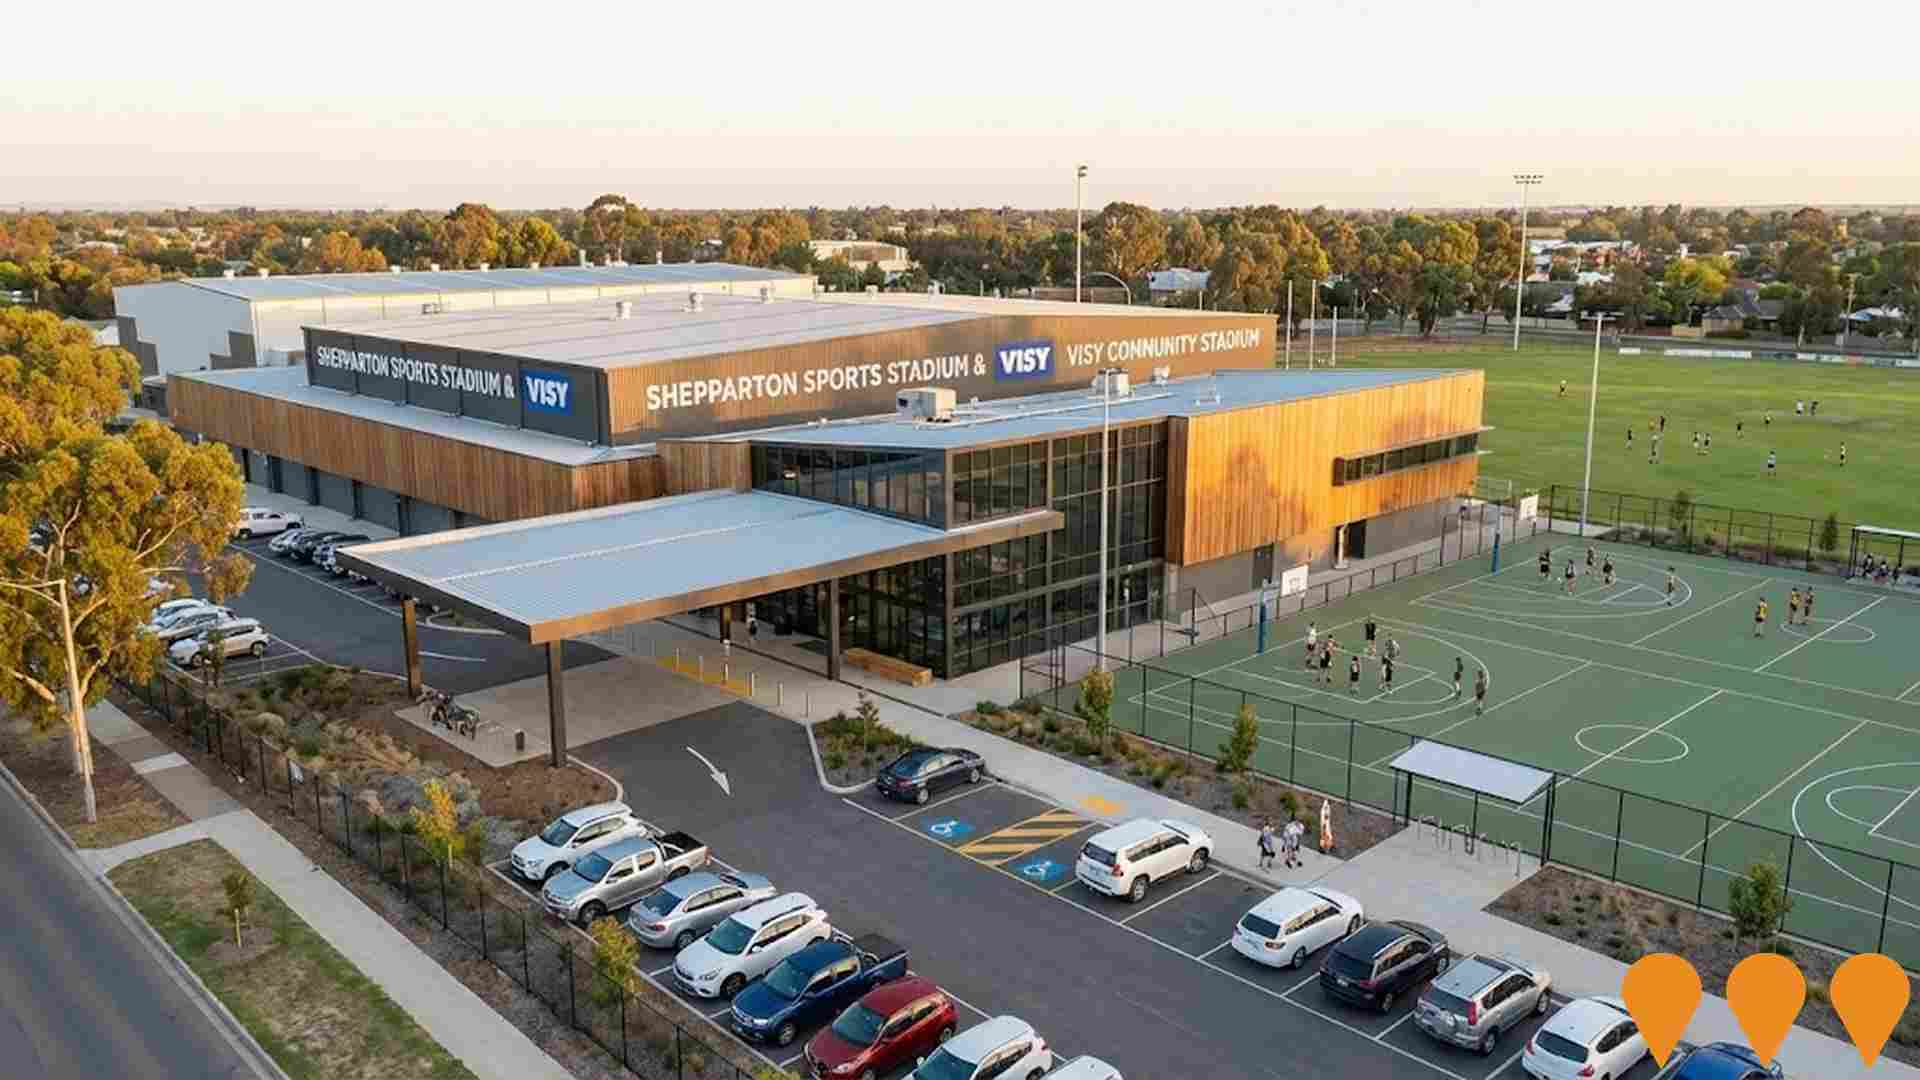
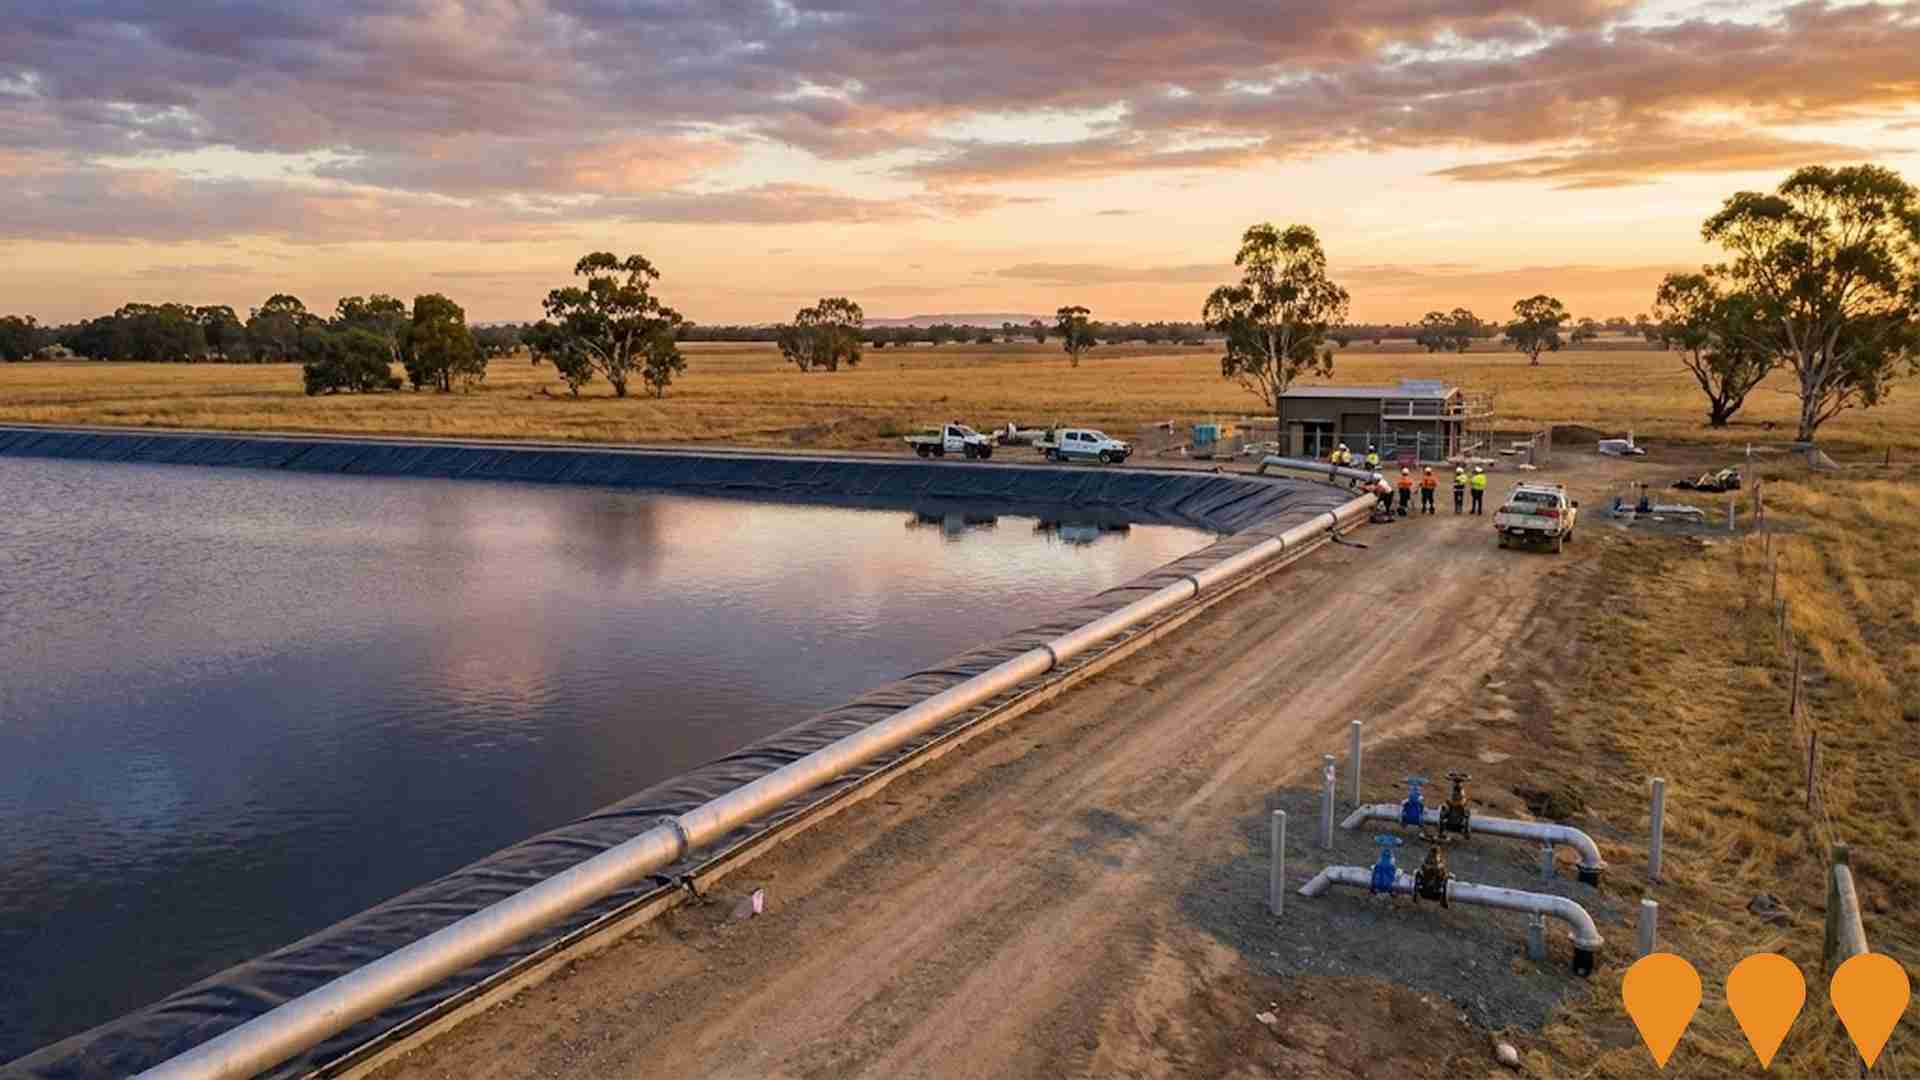
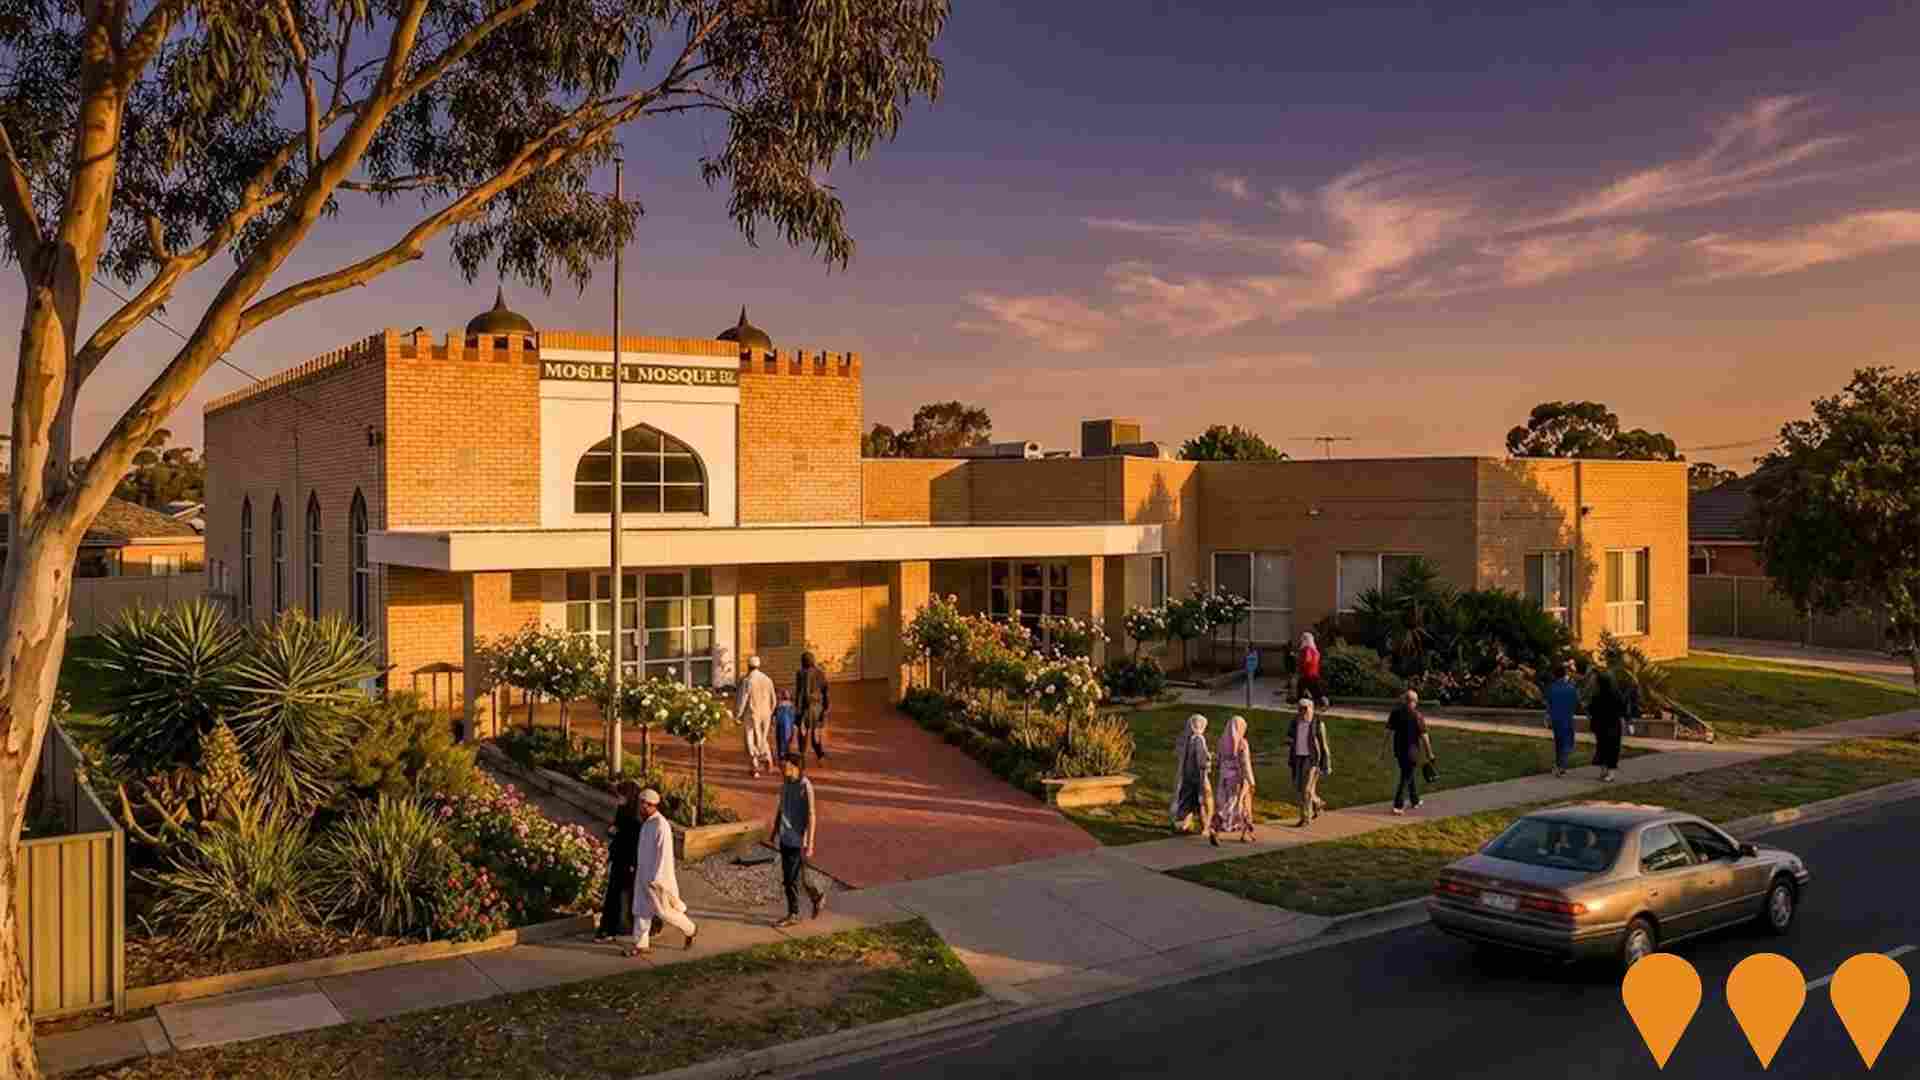
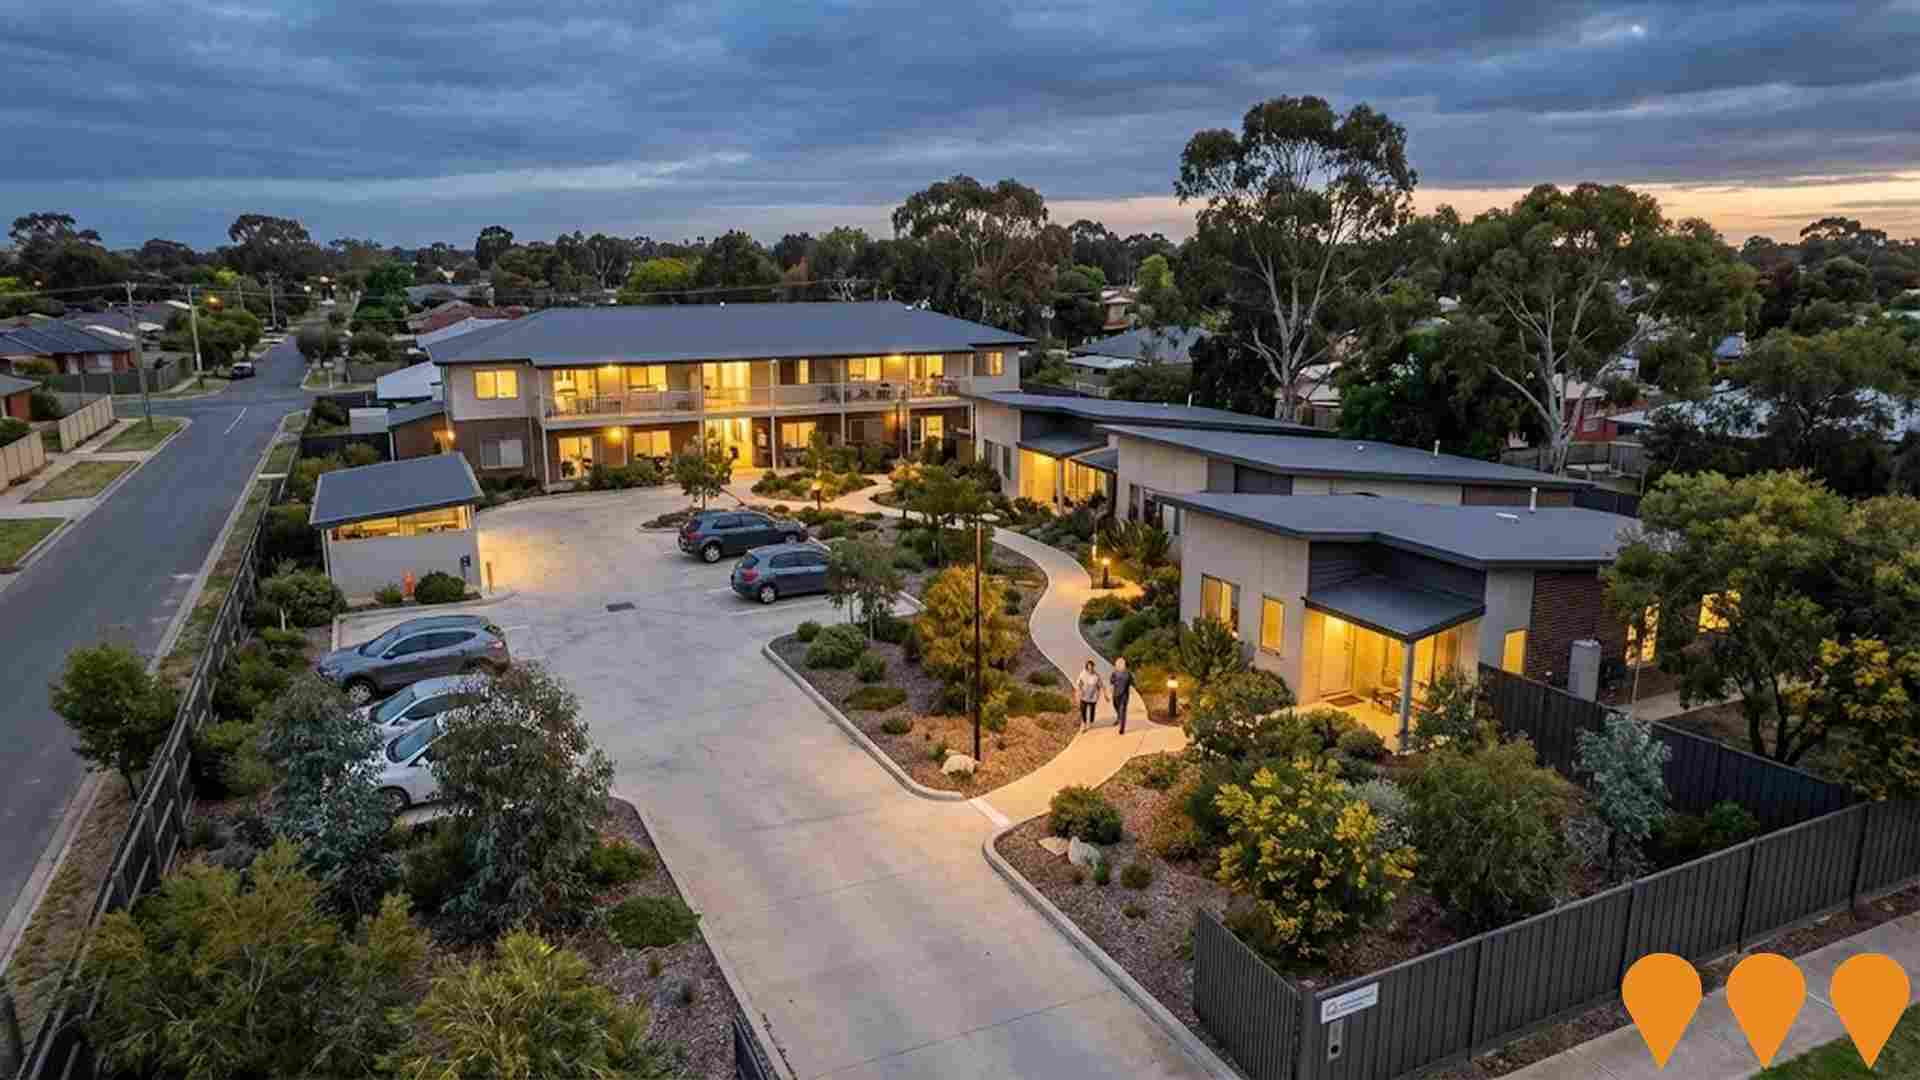
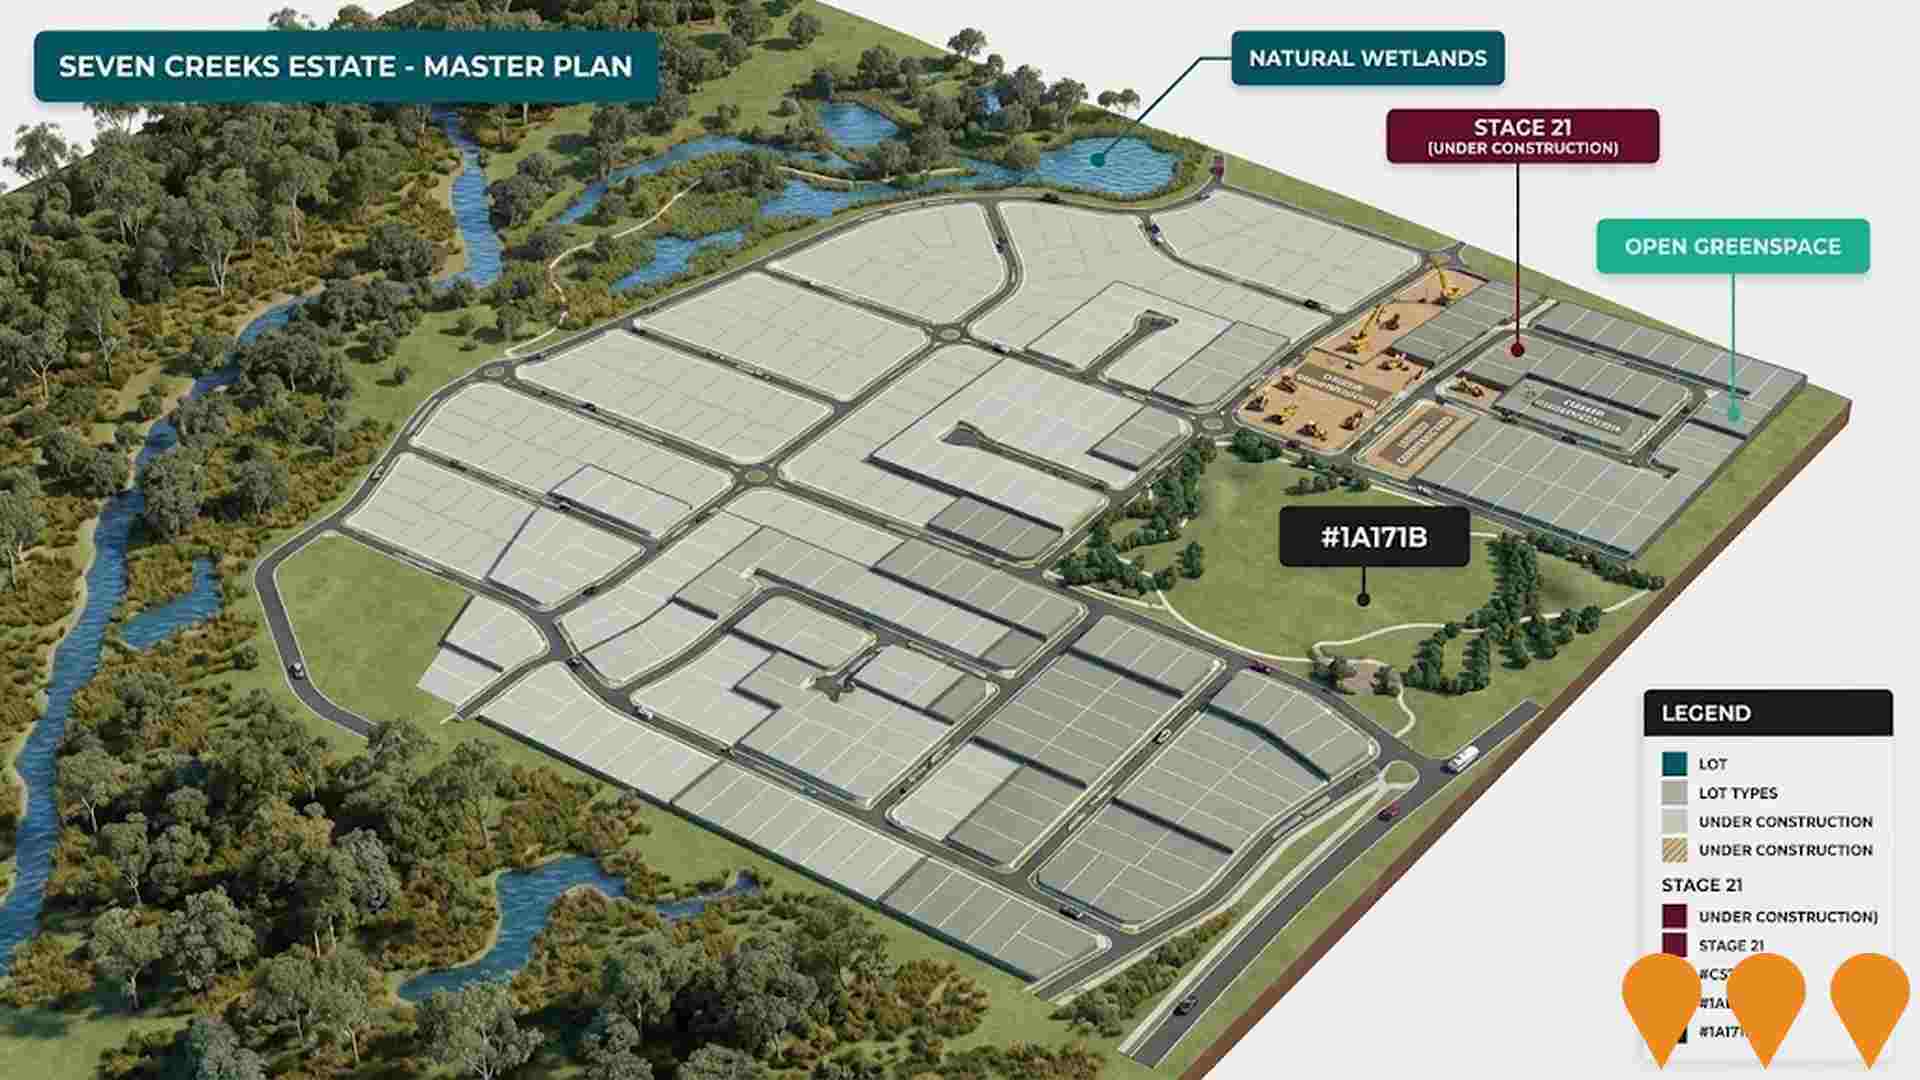
 Denotes AI-based impression for illustrative purposes only, not to be taken as definitive under any circumstances. Please follow links and conduct other investigations from the project's source for actual imagery. Developers and project owners wishing us to use original imagery please Contact Us and we will do so.
Frequently Asked Questions - Infrastructure
Goulburn Valley Integrated Cancer Centre
The Goulburn Valley Integrated Cancer Centre at Shepparton Hospital is a multi-stage initiative by GV Health to centralise regional cancer services. Stage 1 is backed by $30 million in Federal funding with construction scheduled to start in 2027, while Stage 2 seeks further investment to unite chemotherapy, wellness programs, and radiation oncology under one roof. Additionally, a new PET scanner suite has been developed with $7.1 million in operational funding confirmed in the 2026/27 State Budget to commence local imaging services.
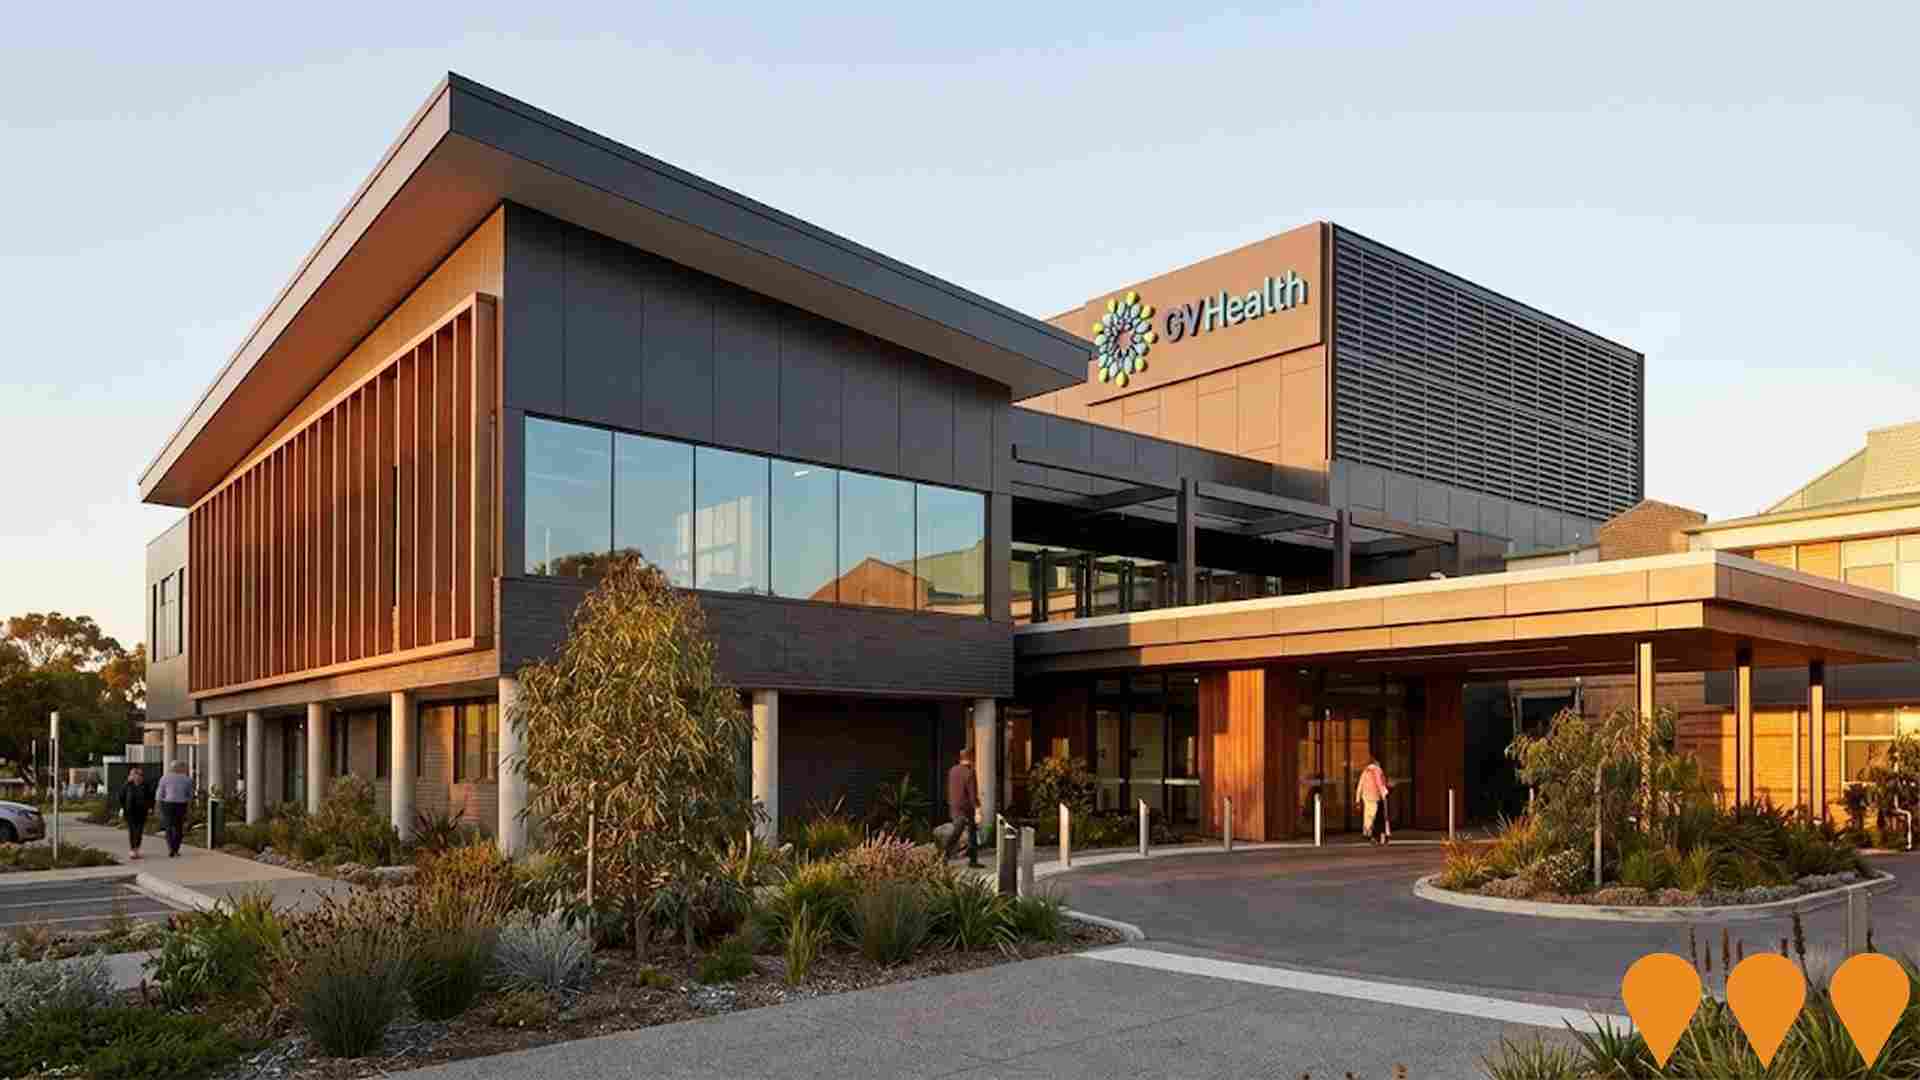
Princess Park WB Hunter Pavilion
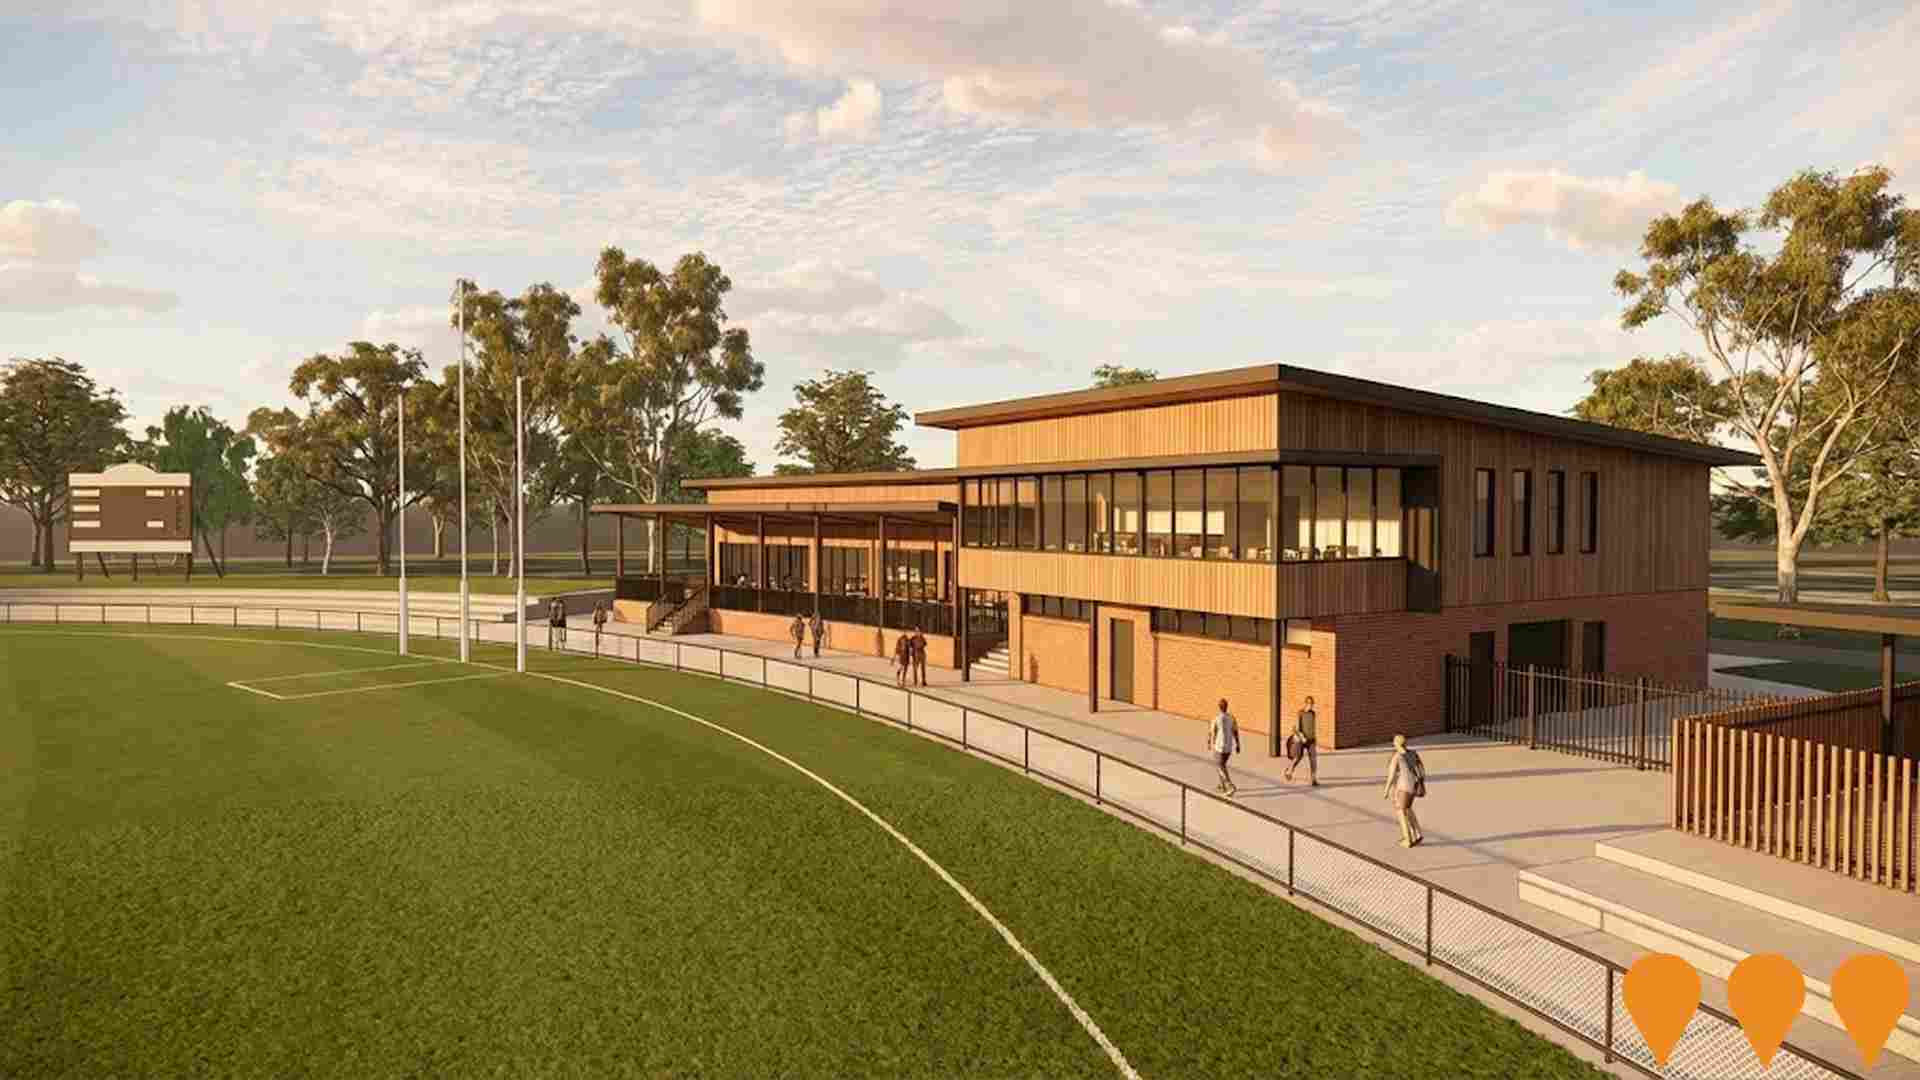
Greater Shepparton City Council is replacing the flood-damaged former Princess Park clubrooms with the new Princess Park WB Hunter Pavilion. The elevated, flood-resilient community sport pavilion will provide AFL, netball and cricket compliant change rooms, trainers rooms, amenities, umpires facilities, a large social room with commercial kitchen, glass frontage to the oval, a 3 m undercover veranda, tiered seating and a grassy spectator mound. Demolition was completed in August 2025, the first sod was turned on 2 February 2026, and construction is expected to be complete by the end of 2026.
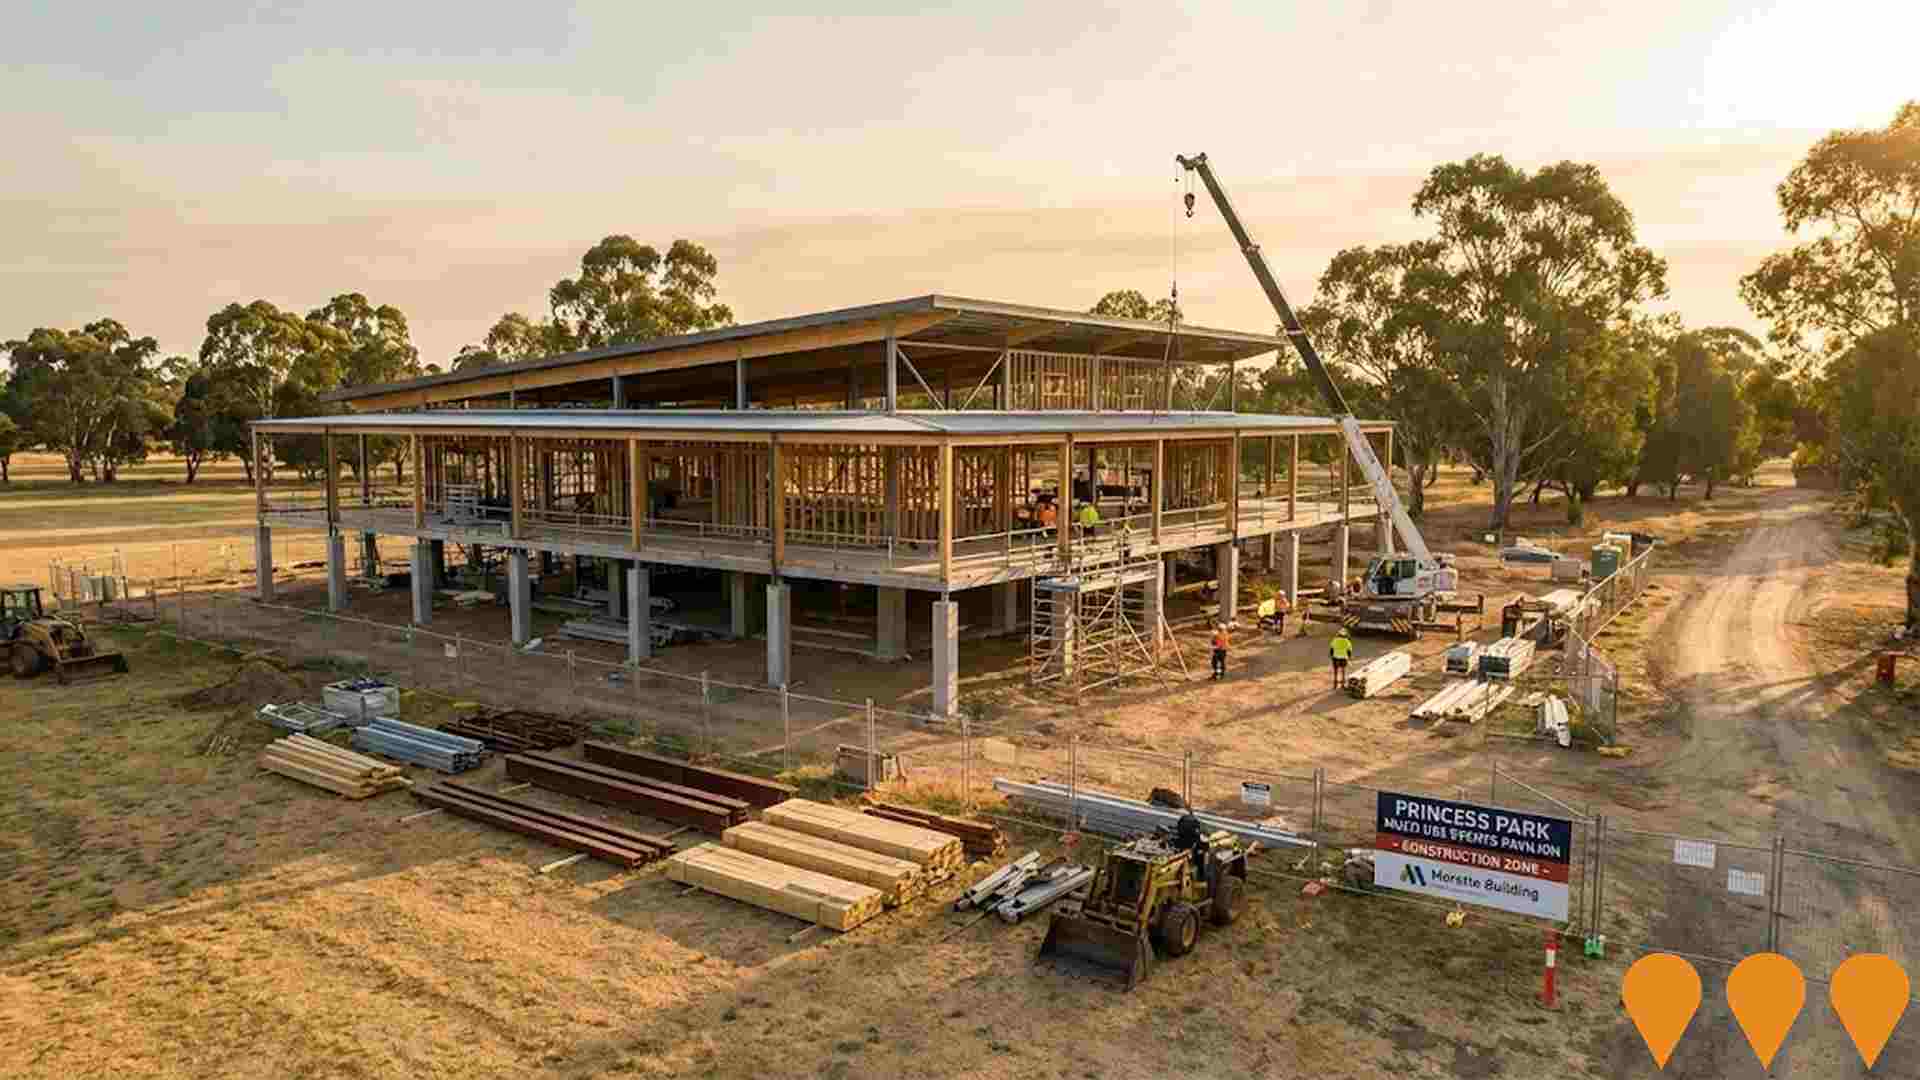
GV Health Staff Accommodation Development
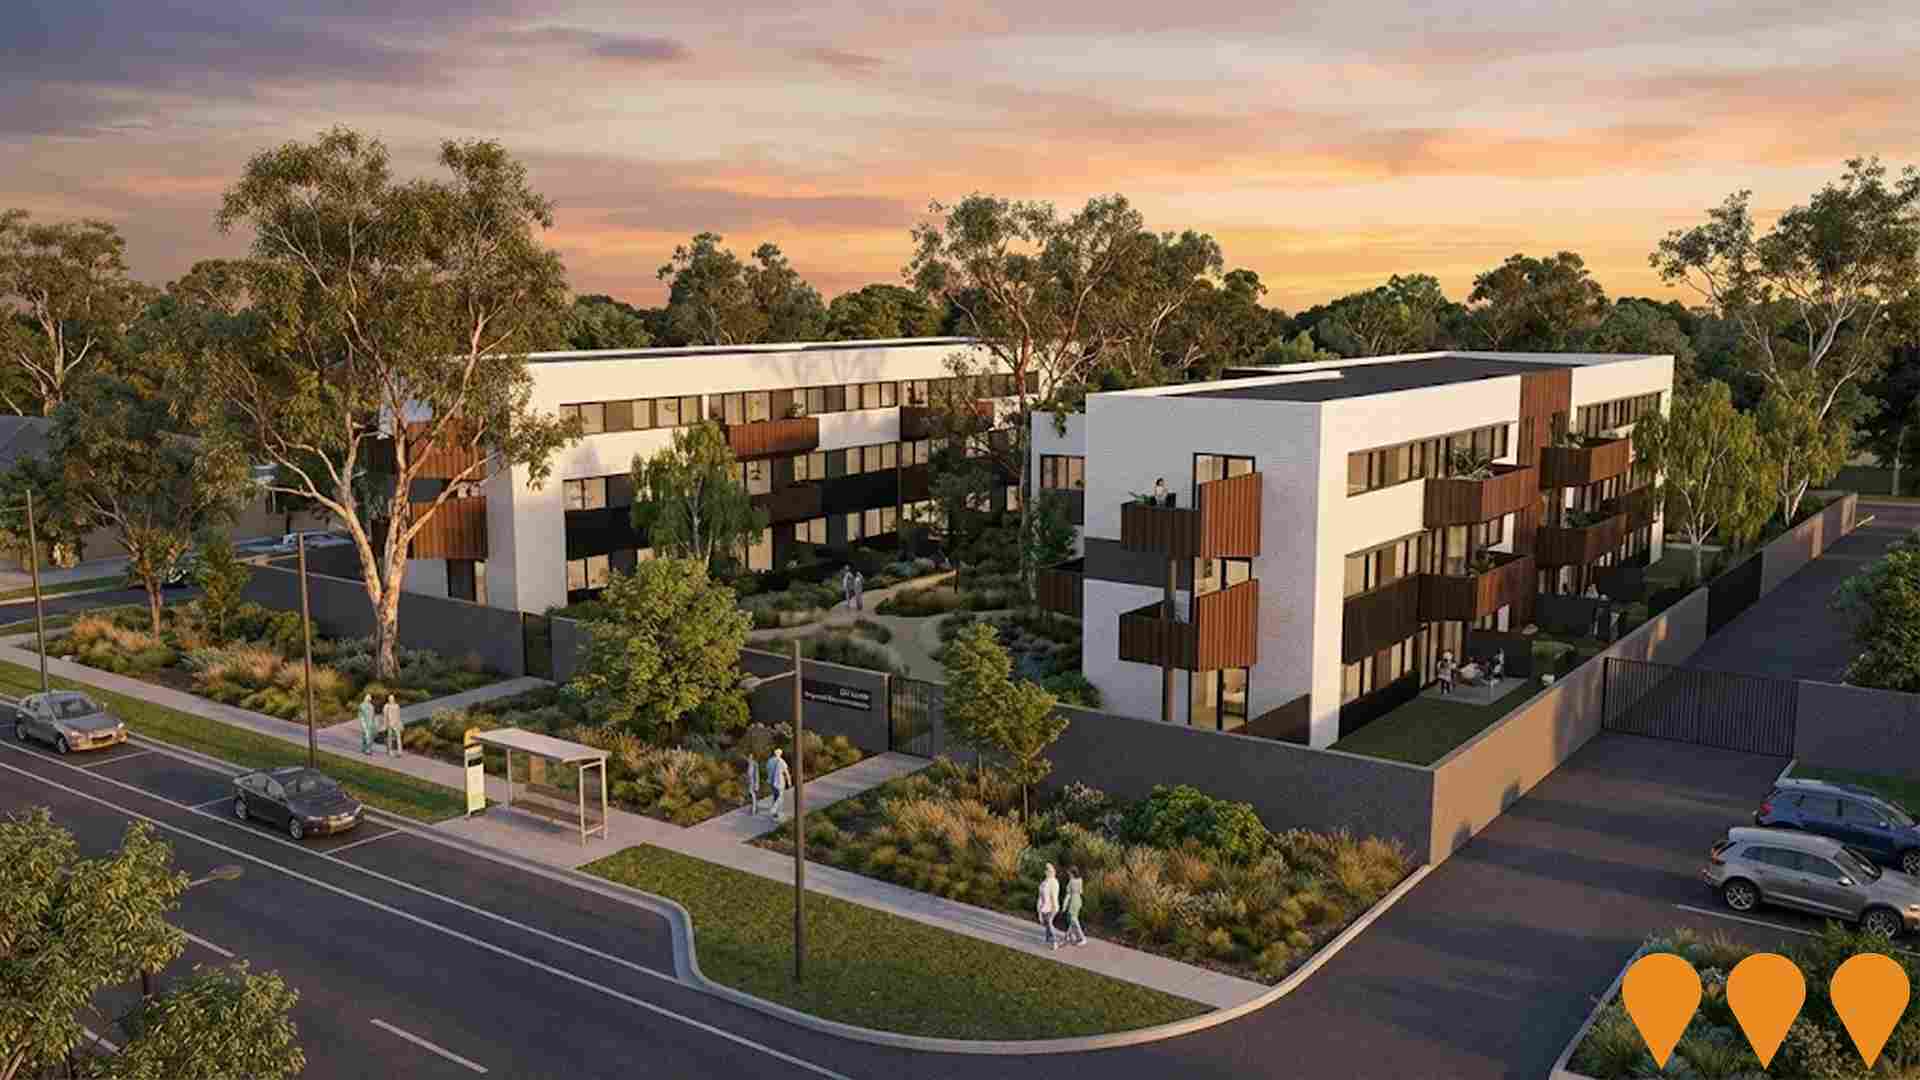
Construction of a new three-storey staff accommodation building at GV Health's Graham Street campus in Shepparton, featuring 18 self-contained units comprising 15 single-room flats and 3 double flats, with secure direct access to the hospital for staff on-call after hours. The energy efficient development includes solar power, heat pump hot water systems, LED lighting, double glazed windows, recycled glass and sustainably sourced timber. Funded through a $10.2 million grant under the Victorian Government's Regional Health Infrastructure Fund and delivered by the Victorian Health Building Authority in partnership with GV Health and builder Hansen Yuncken, the project aims to attract and retain healthcare professionals in the Goulburn Valley region.It is being delivered alongside a separate, adjoining 15-apartment (18-bedroom) development funded under the Regional Worker Accommodation Fund, bringing the combined total to 33 new apartments on the site.
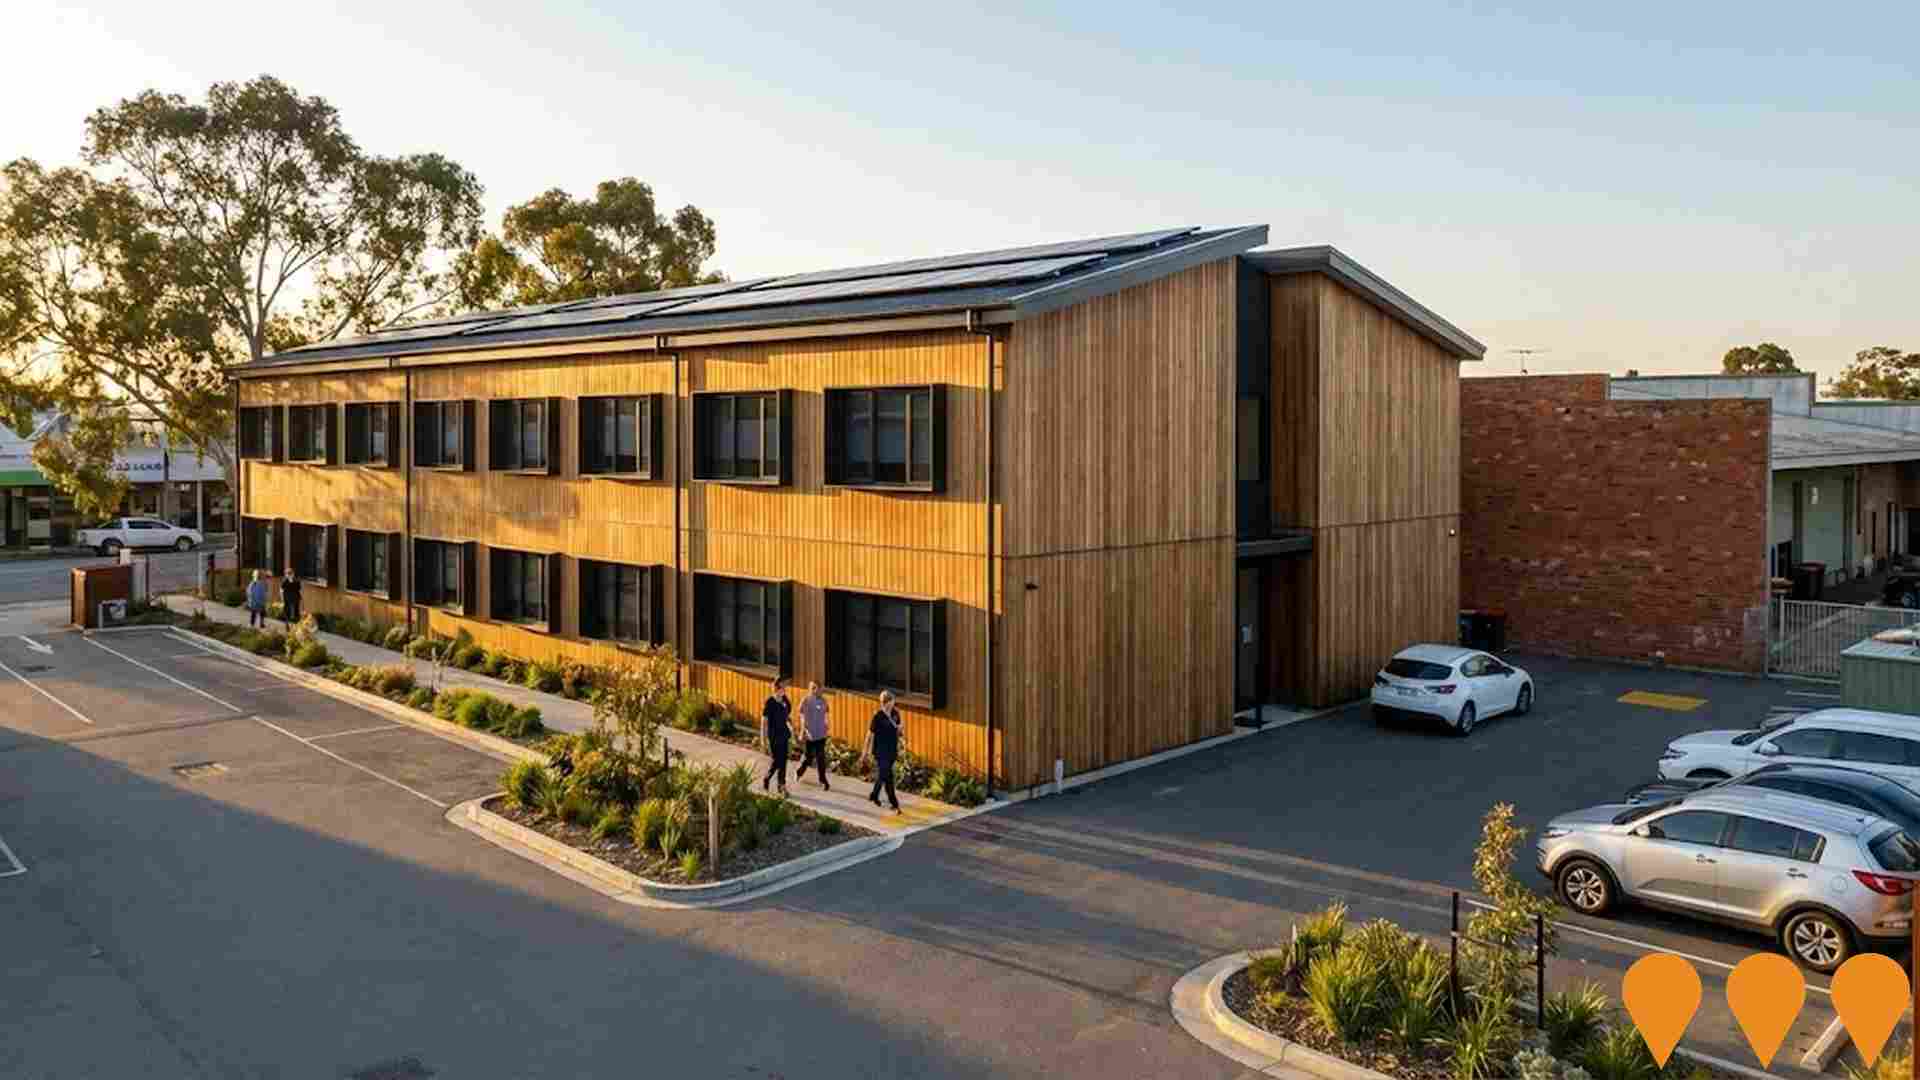
The North Quarter Estate
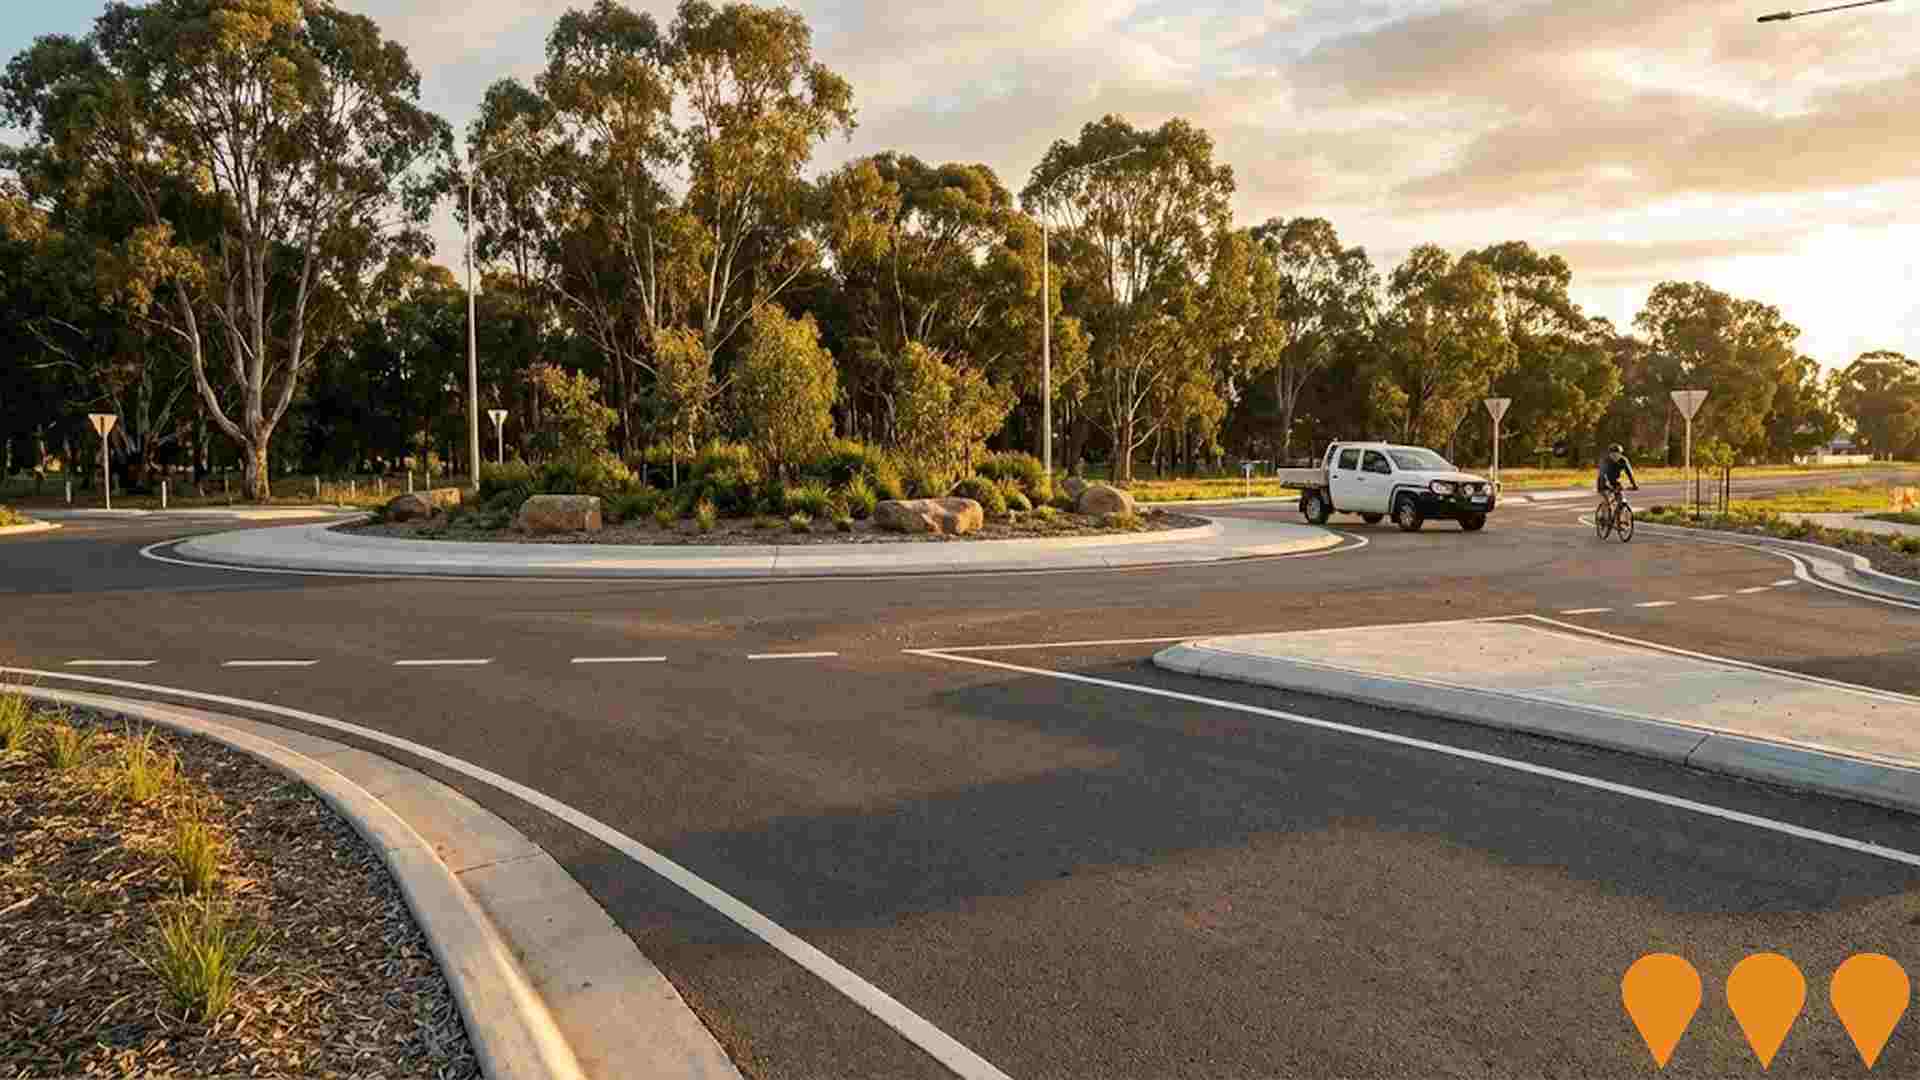
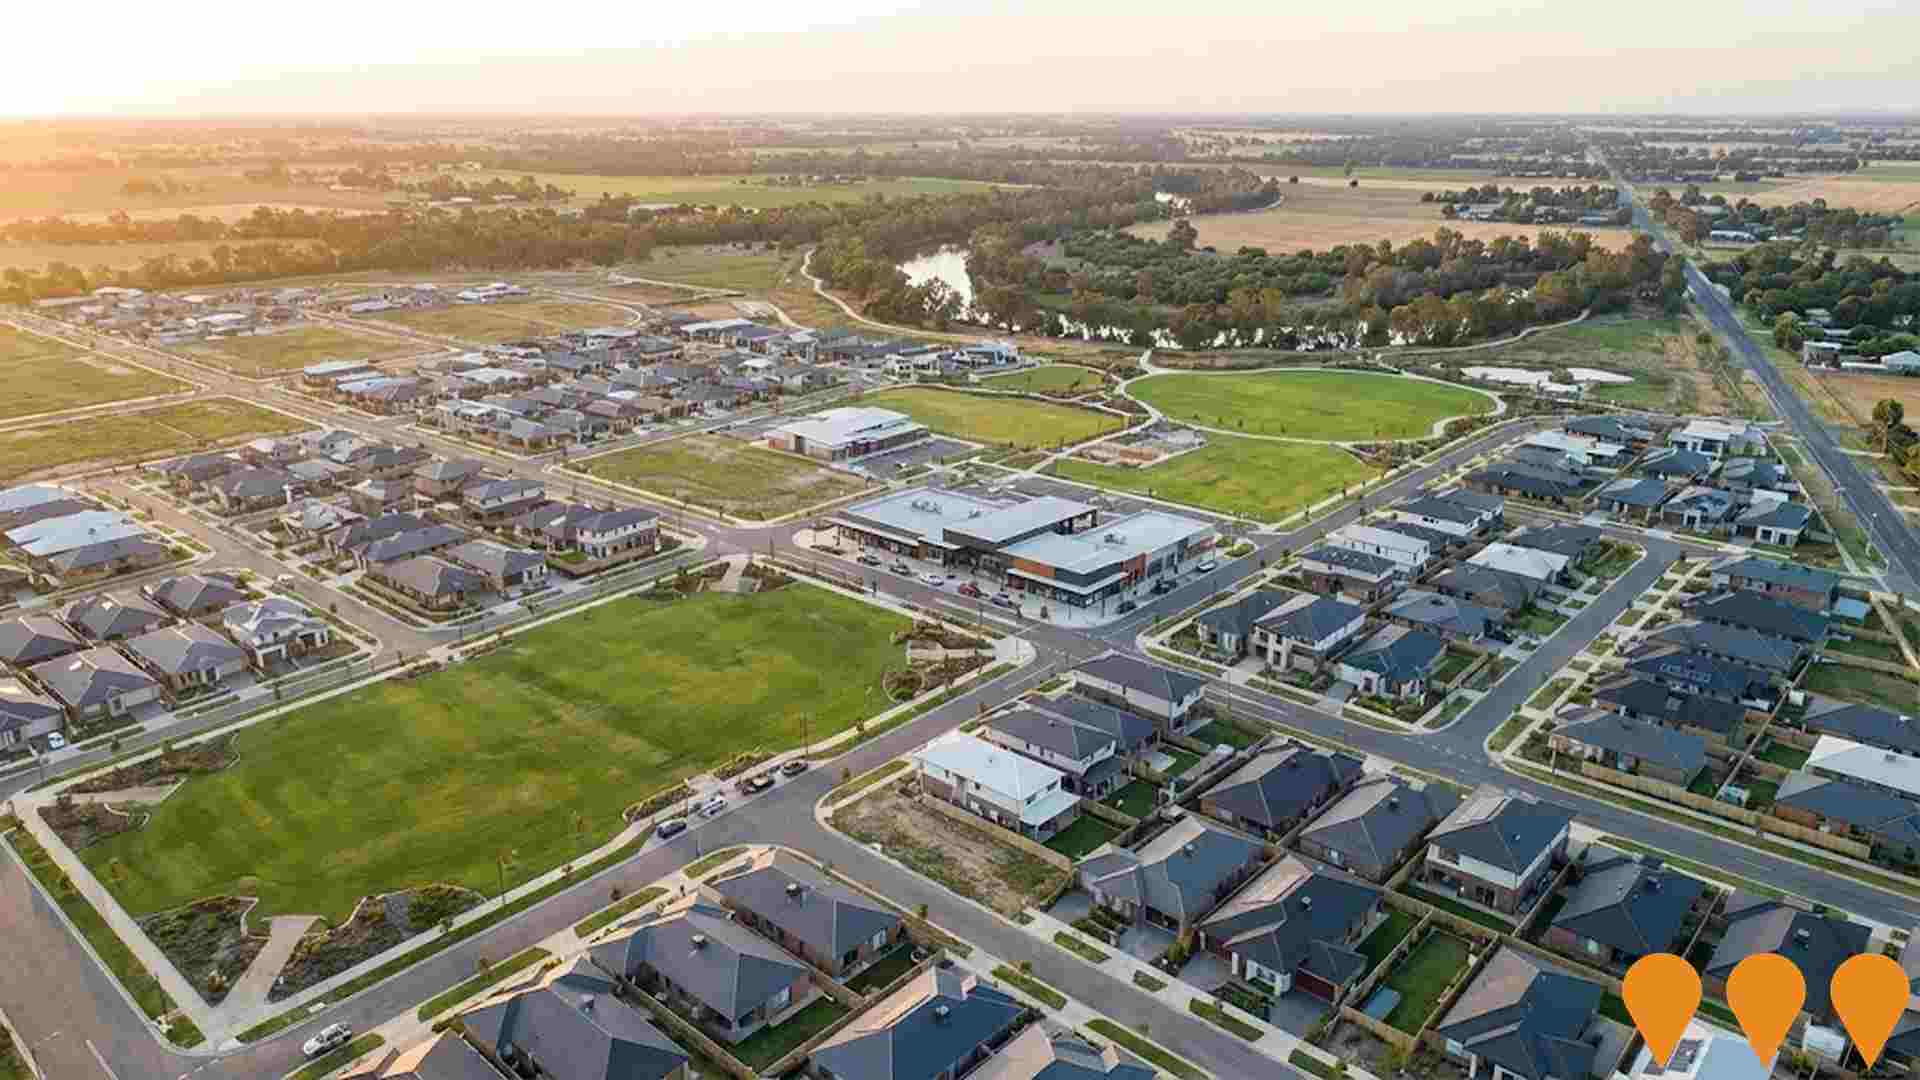
Premium master-planned residential estate developed by URBAN Land Projects on a former orchard site in northern Shepparton. The estate spans multiple stages delivering generous lots (from approximately 348m2 to over 800m2), with Stage 1 (73 lots) and Stages 2, 3A and 4 now progressed. Stage 4 is actively selling with most lots sold. Key features include signalised estate entry off Verney Road, public open space, playground, wetlands, walking and cycling paths, and a Tesla Powerwall sustainability offer for purchasers.Located minutes from GV Health, Grahamvale Primary School, Shepparton Sports City precinct and the CBD.
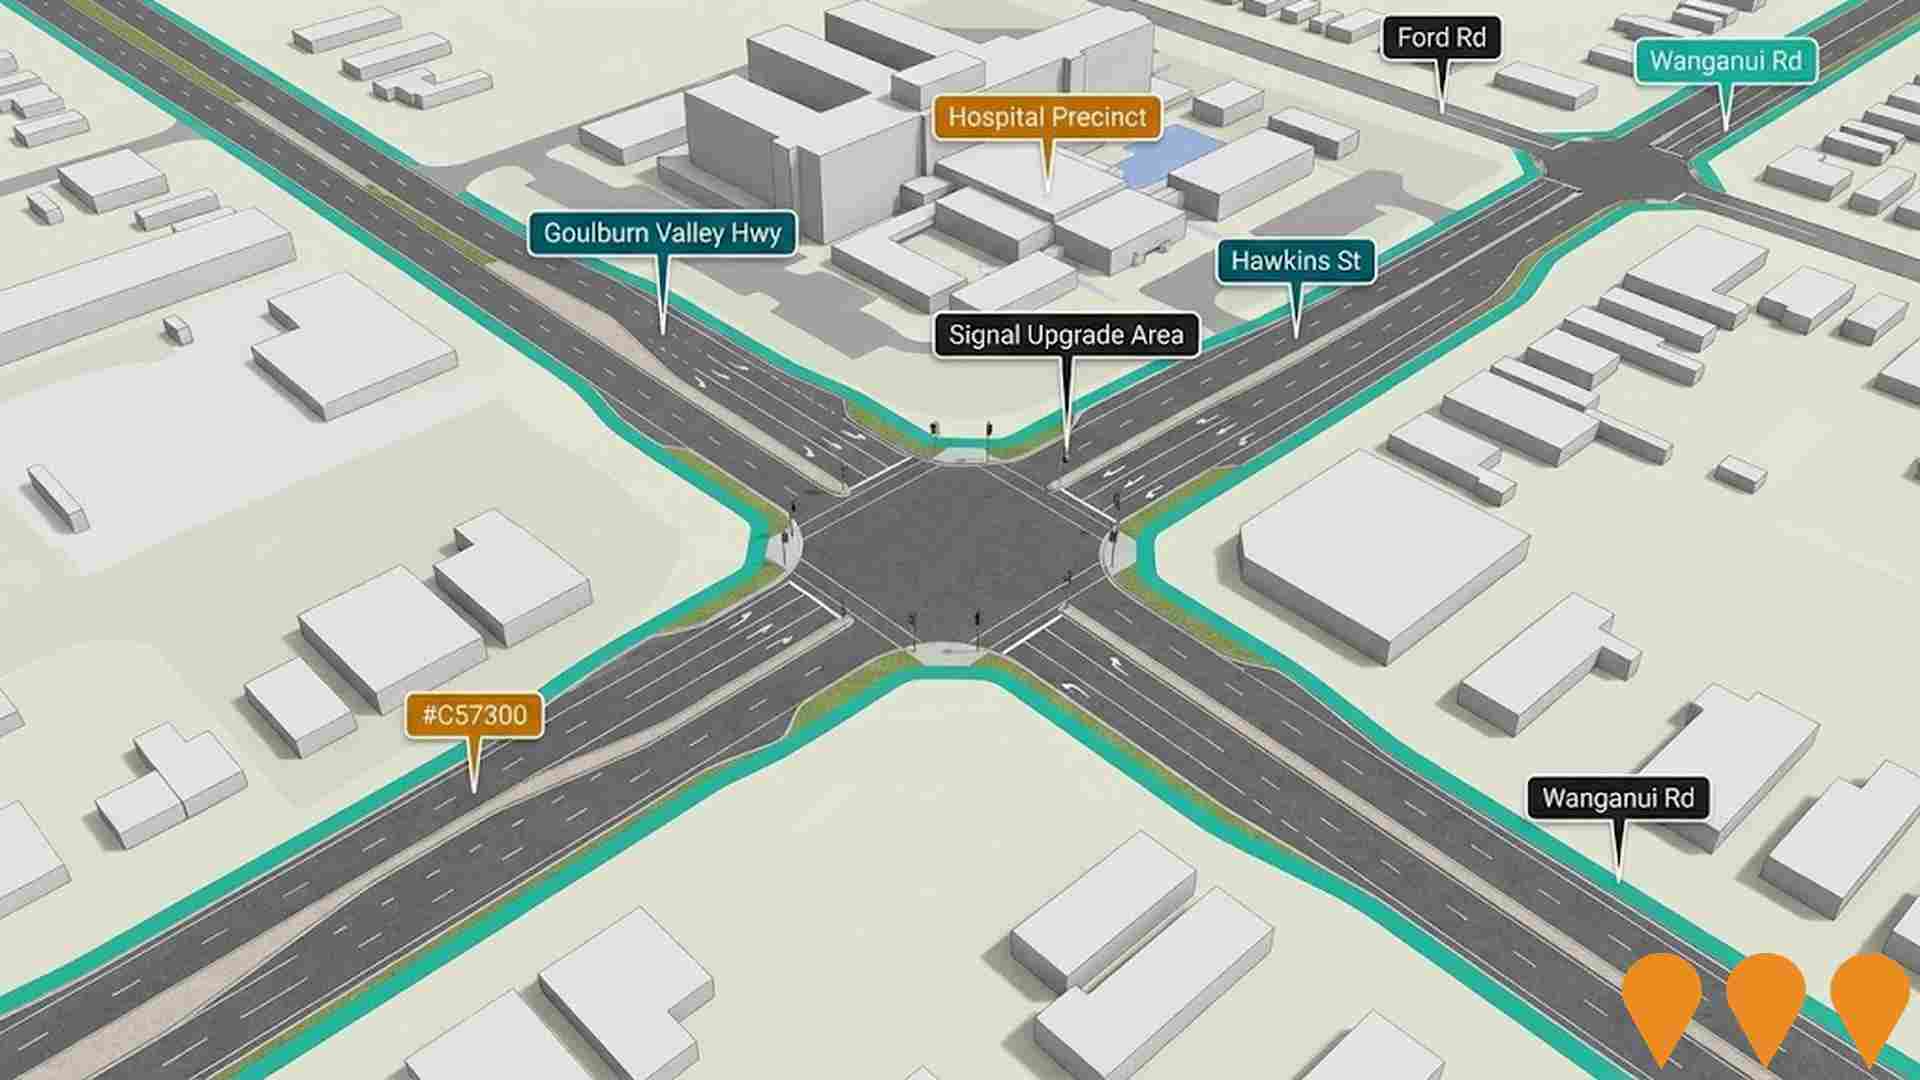
Goulburn Valley Highway and Hawkins Street Intersection Upgrade
Signalised intersection upgrade at Goulburn Valley Highway and Hawkins Street including new traffic signals, dedicated turning lanes, road widening, pavement upgrades, improved pedestrian crossings, cycling access and safer U-turn movements. Design work is underway following funding commitments, with construction currently expected to commence in early 2027.
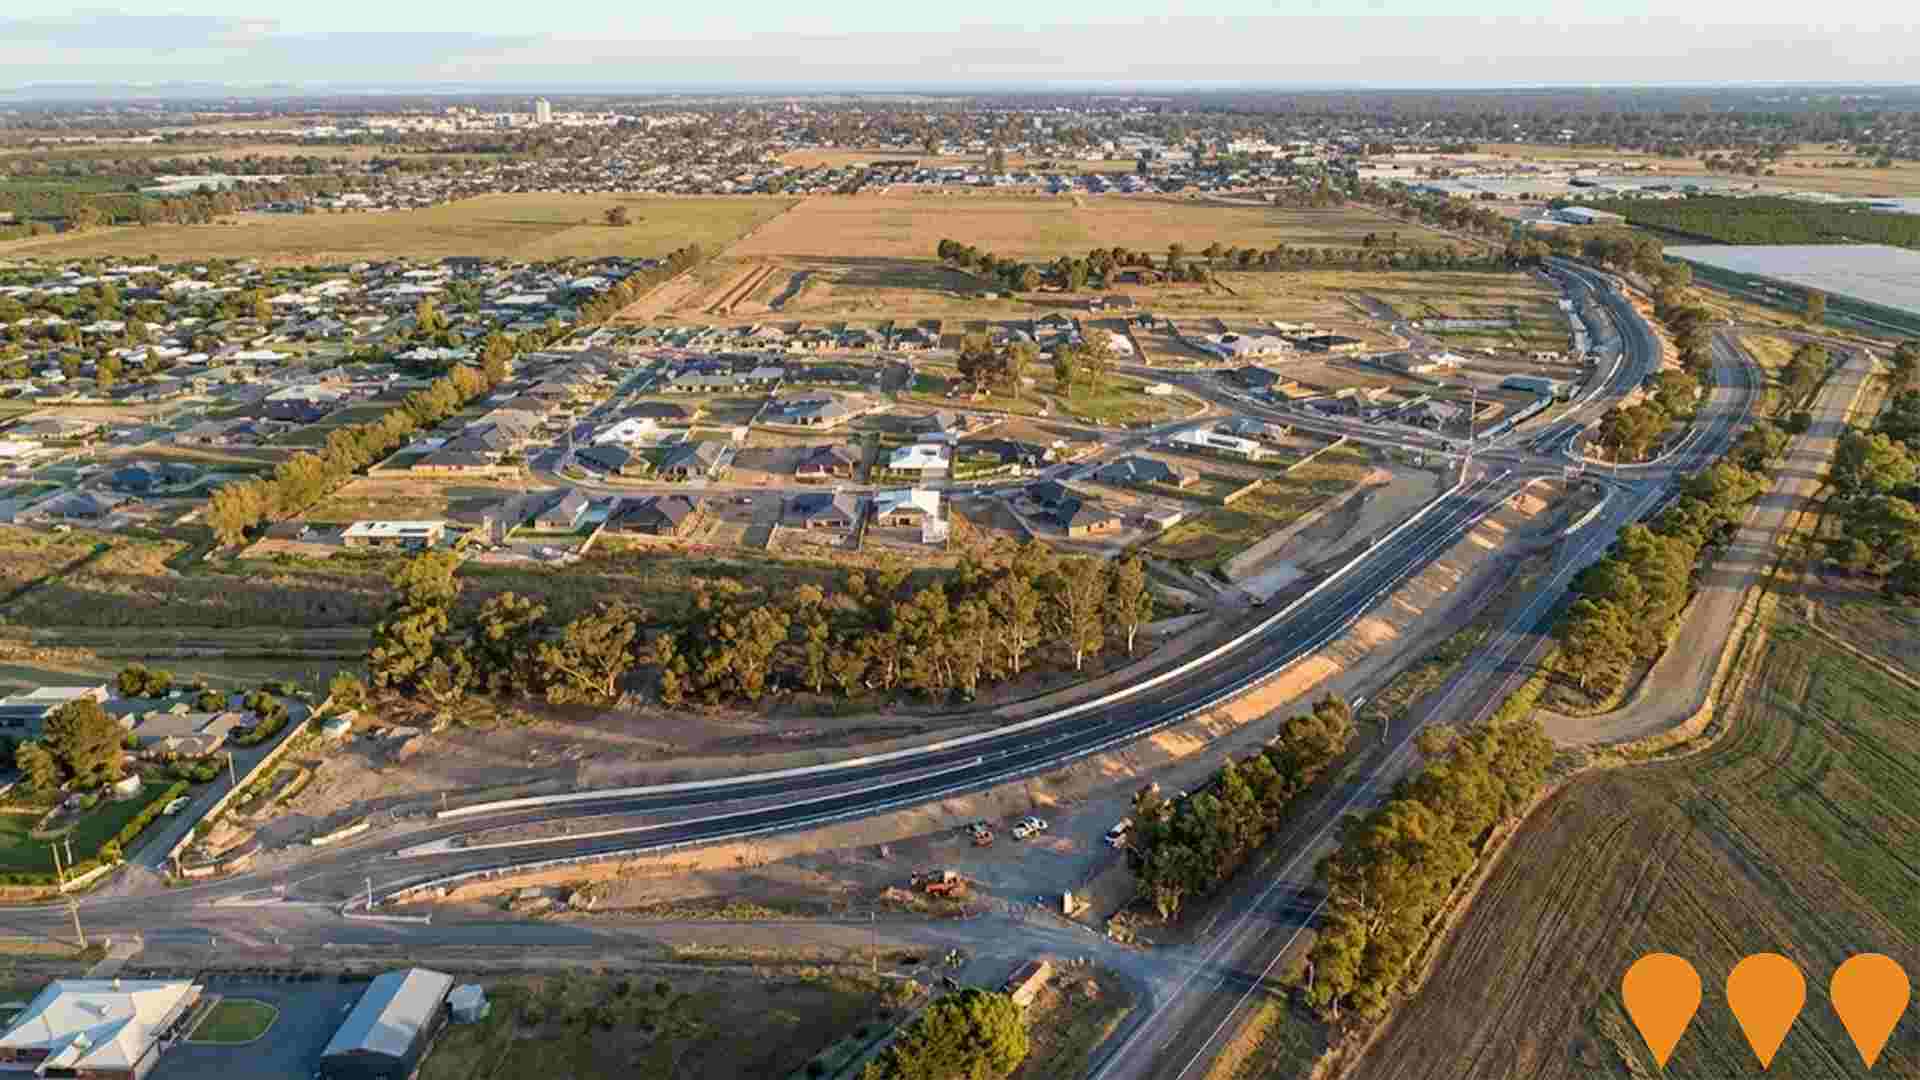
Shepparton Bypass Stage 1
Planning has been undertaken for Shepparton Bypass Stage 1, a future road link from the Midland Highway in Mooroopna to the Goulburn Valley Highway in Shepparton North, including a second Goulburn River crossing between Shepparton and Mooroopna. The Big Build project page remains marked Planning and states the 2020 business case was provided to the Commonwealth. A Victorian Government Gazette notice in October 2025 varied the designated project area for the Shepparton Corridor Upgrade, helping protect land for the corridor.Greater Shepparton continues to advocate for road network resilience works after the loss of previous Commonwealth bypass funding.
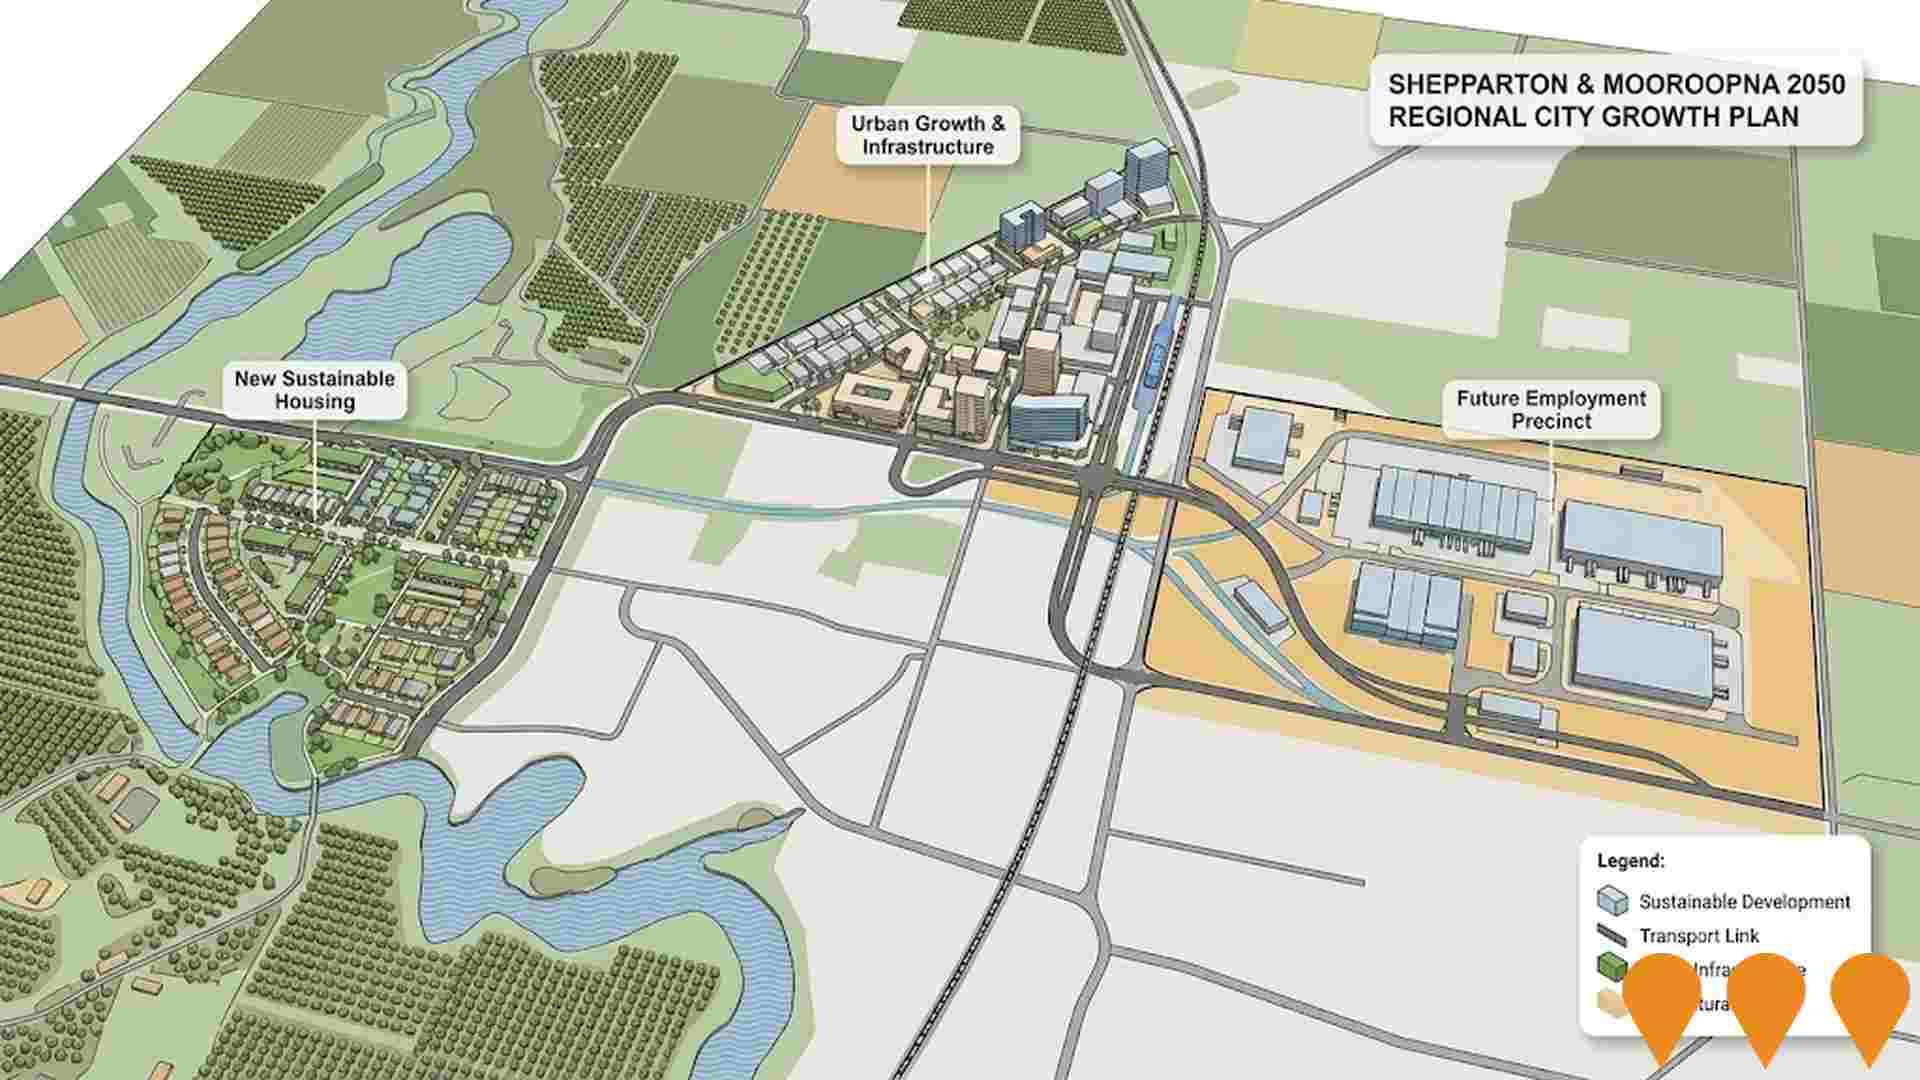
Shepparton and Mooroopna 2050 Regional City Growth Plan
Comprehensive 30-year strategic growth plan adopted in March 2021 to guide sustainable development, housing, employment, infrastructure and land use in Shepparton, Mooroopna and Kialla urban areas until 2050. The plan addresses liveability, land supply, urban renewal, infrastructure, transport and water consumption, with implementation through planning scheme amendments.
Shepparton North Sub-Regional Activity Centre Structure Plan
Council-led structure plan and planning scheme amendment for the Shepparton North Activity Centre. The plan guides long-term redevelopment of land on both sides of Numurkah Road / Goulburn Valley Highway into an integrated sub-regional activity centre with two retail nodes, new commercial and mixed-use opportunities, improved pedestrian and vehicle connections, open space and parking. Council adopted the structure plan in March 2023 and adopted Amendment C245gshe in April 2024, but the amendment remains subject to Ministerial approval and related High Court proceedings as at May 2026.
10,208 residents of Shepparton - North are employed, from a labour force of 10,641. Unemployment sits at 4.1%, with participation at 65.7%. Weighted for its industry mix, the area's sectors are forecast to grow about 6.7% nationally over five years. That reflects industry composition only and makes no allowance for local population growth. The working-day population is estimated at 22,821, about 111% of the resident population, so the area draws in more workers than it sends out. Unemployment and labour force come from ABS Small Area Labour Markets, updated quarterly; the industry and occupation profile is from the 2021 Census.
Detail
Featuring an unemployment rate of 4.1% and recorded annual employment growth of 1.9%, Shepparton - North maintains a capable local workforce underpinned by significant representation across key service sectors. Employment figures for March 2026 show 10,208 residents engaged in work, with local joblessness sitting 0.4% higher than the Regional Vic. benchmark of 3.7%, while the participation rate remains solid at 65.7% (exceeding the 61.1% recorded for Regional Vic.). Census findings showed only 9.4% of employed residents working remotely from home, though figures may reflect the influence of Covid-19 lockdown restrictions at the time.
The primary sectors providing jobs to local residents are health care & social assistance, retail trade, and education & training. The community exhibits a strong industry concentration in health care & social assistance, where its employment proportion reaches 1.4 times the broader regional benchmark. Conversely, agriculture, forestry & fishing accounts for a smaller footprint, engaging 4.2% of workers versus 7.5% regionally. As documented in the Census, a ratio of 0.7 workers for each resident points to an above-average supply of employment opportunities locally. AreaSearch's evaluation of ABS and SALM figures indicates that in the twelve months to March 2026, local employment grew by 1.9% while the labor pool expanded by 3.5%, resulting in a 1.5 percentage points uptick in the unemployment rate. Over the same timeframe across Regional Vic., total employment slipped by 0.1%, the workforce reduced by 0.3%, and the jobless rate contracted by 0.2 percentage points. Longer-term employment expectations from Jobs and Skills Australia (dated Mar-26) offer additional context regarding prospective labor demand in Shepparton - North. These five and ten-year projections have been aligned with the area's industry profile to project future employment trajectories. Nationally, total employment is expected to rise by 6.6% across five years and 13.7% over ten years, although performance varies widely by sector. When mapped against Shepparton - North's industry distribution, these benchmarks suggest local jobs will grow by 6.7% across five years and 14.1% over ten years (note that this reflects an illustrative weighted projection and excludes specific local population forecasts).
Frequently Asked Questions - Employment
Median household income in Shepparton - North is $1,560 a week (about $81,000 a year), with median personal income at $784 a week. ATO records put median taxable income at $48,587 a year against an average of $58,485. Household income is from the 2021 Census; taxable income is from ATO Taxation Statistics for the latest financial year available, indexed forward using the ABS Wage Price Index.
Detail
Taxpayer income metrics compiled by AreaSearch from the latest ATO dataset for financial year 2023 place the Shepparton - North SA2 beneath the national benchmark. Median taxable income within the Shepparton - North SA2 is $48,587 alongside an average of $58,485, compared to Regional Vic. benchmarks of $50,954 and $62,728 respectively. Factoring in a 9.62% rise in the Wage Price Index since financial year 2023, updated estimates as of March 2026 reach approximately $53,261 for the median and $64,111 for the average. Census records show personal, family, and household earnings all falling within a moderate band between the 38th and 45th percentiles.
In terms of earnings brackets, 33.7% of local earners (6,911 individuals) receive between $1,500 - 2,999, mirroring the metropolitan proportion of 30.3% in this bracket. Housing affordability remains reasonable with households keeping 87.1% of their income, though disposable earnings sit below average at the 43rd percentile and the SEIFA index places the community in the 4th decile.
Frequently Asked Questions - Income
Shepparton - North had 7,285 occupied dwellings at the 2021 Census, 86% detached houses and 0% apartments. 33% are owned with a mortgage, 36% rented and 31% owned outright. At that Census the median rent was $270 a week and the median mortgage repayment $1,369 a month. Rent absorbs 17.3% of household income here and mortgage repayments 20.3%. Dwelling stock, tenure and housing costs are 2021 Census measures — the only source that counts dwellings at this boundary size.
Detail
According to the most recent Census, the housing landscape in Shepparton - North was made up of 85.6% detached houses and 14.3% other dwellings (incorporating apartments, semi-detached properties, and 'other' dwellings), whereas Regional Vic. recorded 90.1% houses and 9.9% other dwellings. Outright property ownership in Shepparton - North was lower than the regional rate, sitting at 31.4%, with mortgaged properties comprising 33.0% and rental accommodation making up 35.6%. Typical monthly mortgage costs were $1,369 (below the Regional Vic. median of $1,430), while weekly rent payments stood at $270 (compared to $285 regionally).
Relative to countrywide metrics, mortgage repayments in Shepparton - North sit well below the nationwide median of $1,863, and weekly rents are markedly lower than the Australian figure of $375.
Frequently Asked Questions - Housing
Shepparton - North counted 7,285 households at the 2021 Census, averaging 2.5 people each. 30% are couples with children, against 25% couples without children. 29% of households are people living alone, and families average 1.8 children. Household and family composition is measured only by the Census, so these are 2021 figures.
Detail
Families constitute the vast majority of local households at 67.7%, consisting of couples with children at 29.6%, couples without children at 24.8%, and single parent families at 12.3%. Non-family living arrangements account for the remaining 32.3%, comprising single-person households at 28.9% and group households at 3.4%. Average household occupancy sits at 2.5 people, exceeding the Regional Vic. figure of 2.4.
Frequently Asked Questions - Households
23.8% of adults in Shepparton - North hold a university qualification, including 15.3% with a bachelor degree and 5.2% with postgraduate qualifications. A further 23.4% hold a vocational qualification. 17 schools serve the area, with 6,951 enrolment places and an average ICSEA of 993 against a national benchmark of 1,000. Qualifications come from the 2021 Census; school enrolments, ICSEA and results come from ACARA's current release.
Detail
Attainment of higher education credentials in Shepparton - North is lower than the broader state environment, with 23.8% of individuals aged 15+ holding tertiary degrees compared to 33.4% across VIC, indicating opportunities for educational advancement and workforce upskilling. Bachelor degrees represent the most common tertiary credential at 15.3%, followed by postgraduate qualifications at 5.2% and graduate diplomas at 3.3%. Technical and vocational training is widely held, with 34.1% of residents aged 15+ possessing vocational qualifications, consisting of 23.4% with certificates and 10.7% with advanced diplomas. A substantial 31.2% of the local population is actively undertaking formal education.
Broken down by level, 10.8% attend primary education, 9.4% are in secondary education, and 3.5% are engaged in tertiary education.
Frequently Asked Questions - Education
Schools Detail
Public transport in Shepparton - North reaches 159 stops on 10 routes, timetabled for about 520 services a week. The typical home sits about 250 m from its nearest stop. Buses carry the largest share of public transport commuters. Households keep an average of 1.4 vehicles. Stop and service counts are built from operators' published GTFS timetables and refresh with each timetable release; vehicle ownership is from the 2021 Census.
Detail
An evaluation of local public transport identifies 159 active transport stops across Shepparton - North, serviced by 10 individual routes providing an aggregate of 516 weekly passenger trips. Transit access is favorable, with residents situated an average of 248 meters from their closest stop. Being a largely residential district, outbound commuting is typical, with private vehicle travel serving as the dominant mode at 92% and walking accounting for 5%. Dwellings maintain an average of 1.4 vehicles each. A modest 9.4% of workers operated from home at the 2021 Census, a figure that may reflect prevailing COVID-19 circumstances.
Transit schedules deliver an average of 73 trips per day across all routes, translating to roughly 3 weekly trips per individual stop. The accompanying mapping highlights the 100 nearest stops relative to the area's central coordinates.
Frequently Asked Questions - Transport
Transport Stops Detail
65.7% of residents in Shepparton - North report no long-term health condition, a less healthy profile than 87% of areas nationally. 7.7% need daily assistance with core activities, and 48.2% hold private health cover. The standardised death rate runs at 7.1 per 1,000 residents. Health conditions, assistance needs and insurance are 2021 Census measures; the death rate comes from current ABS releases.
Detail
AreaSearch analysis of mortality statistics and chronic disease rates highlights notable healthcare hurdles within Shepparton - North, with common medical issues evident among older and younger demographics alike. Meanwhile, private health insurance coverage is notably restrained, held by roughly 48% of the total population (~9,885 people), compared to 50.5% in Regional Vic. and 55.7% across Australia. Arthritis and mental health conditions are the most prevalent ailments in the community, diagnosed in 9.4 and 9.1% of residents respectively, whereas 65.7% reported suffering from no medical ailments whatsoever (compared to 63.4% across Regional Vic.).
Chronic illness rates among working-age individuals are higher than typical benchmarks. Seniors aged 65 and over constitute 17.7% of the locality (3,628 people), sitting below the 24.0% regional proportion. Health metrics among elderly residents present various hurdles, with overall standings tracking close to general population levels.
Frequently Asked Questions - Health
Shepparton - North is largely Australian-born, at 79.7% of residents, with 20.6% speaking a language other than English at home. The largest reported ancestries are English (26.4%) and Australian (25.1%). Ancestry, language and country of birth are counted only by the Census, so these are 2021 figures.
Detail
Cultural diversity in Shepparton - North tracks above typical levels, with 20.3% of the community born abroad and 20.6% speaking a language other than English in their households. Christianity represents the predominant faith, practiced by 51.6% of residents. The most noticeable variation is found in the Other category, which accounts for 2.8% locally compared to 0.8% across Regional Vic.. Regarding ancestral heritage based on parental birthplace, the primary ancestries in Shepparton - North are English (26.4%), Australian (25.1%), and Other (10.3%, considerably higher than the 4.7% regional mark). Notable representation is also seen across several specific backgrounds: Italian heritage stands at 5.5% (compared to 2.9% across the region), Macedonian at 0.4% (vs 0.2%), and Samoan at 0.4% (vs 0.1%).
Frequently Asked Questions - Diversity
The median resident of Shepparton - North is 38. 25.8% of residents are aged 15 to 34. Age cohorts are not raw Census counts: the Census split is re-based to the latest ABS population estimates and state projections.
Detail
The age distribution of Shepparton - North is younger than Regional Vic. overall. Updated estimates to August 2026 show that children and young adults (0 - 24) represent 32.8% of the populace, compared to 28.5% regionally, while retirees and senior residents (65+) account for 17.7% versus 24.0% across Regional Vic.. Consequently, the estimated median age remains at 38 (unchanged since the 2021 Census), sitting 5 years below the regional median of 43 recorded at the 2021 Census. By age bracket, mature adults and young retirees (45 - 64) have decreased from 24.4% at the Census to an estimated 22.4%.
The most substantial demographic increase through to 2041 is forecast for young to middle aged adults (25 - 44), projected to expand by 4,274 residents (77%) to 9,842.
Frequently Asked Questions - Age
Data & MethodBoundaries, Sources & Method for Shepparton - North
9 of 14 data sections on this page were updated within the last 12 months — the newest current to Sep 2026.
Everything is aggregated to the SA2 boundary shown above, on a 2021 Census baseline. Only 3 sections — housing, households and cultural diversity — still wait on the 2026 Census.
The ledger — source, cycle and currency by section
| Section | Source & update cycle | Currency |
|---|---|---|
| Updated within the last 12 months 9 sections | ||
| Population | ABS, GNAF, Geoscience Australia Annual (ABS ERP) | Aug 2026 2 months ago headline measures · 2021 Census baseline |
| Re-based to the ABS Estimated Resident Population (June 2025 release) and updated with new dwellings from GNAF address data. Current to Aug 2026, with the 2021 Census supplying the small-area baseline. | ||
| Age profile | ABS, Geoscience Australia, State governments Annual | Aug 2026 2 months ago headline measures · 2021 Census baseline |
| Age cohorts are re-based to the latest ABS population estimates and state projections, current to Aug 2026. Each cohort is held as a Census baseline and a current estimate. | ||
| Development & approvals | ABS, GNAF Monthly (ABS approvals) | Aug 2026 2 months ago headline measures · Jul 2026 baseline |
| Property sales & rents | Valuer General, Rental Board, ABS Weekly sales, quarterly rents | Sep 2026 last month all 21 measures |
| Sales from the state Valuer General register, refreshed weekly, and rents from quarterly rental bond lodgements. Both are read live each time this page loads, current to Sep 2026. | ||
| Infrastructure projects | Infrastructure Australia, State agencies, Local governments Daily | Aug 2026 2 months ago all 18 projects tracked here |
| Project pipeline maintained continuously from Infrastructure Australia, state agencies, local government and public announcements. Records are added and revised daily; this area was last updated Aug 2026. | ||
| Employment | ABS, DEWR, JSA Quarterly (ABS SALM) | Mar 2026 7 months ago headline measures · 2021 Census baseline |
| Unemployment and labour force from ABS Small Area Labour Markets, current to Mar 2026. The growth outlook applies Department of Employment (now Jobs and Skills Australia) forecasts for all 19 industry divisions to the local industry mix, so it measures sector composition rather than local expansion and makes no allowance for population growth. Job demand comes from the same agency via its Internet Vacancy Index; industry and occupation structure from the 2021 Census. | ||
| Education | ABS, ACARA Annual (ACARA) | Sep 2026 last month headline measures · 2021 Census baseline |
| Transport | ABS, State Transport Departments Each timetable release | Jul 2026 3 months ago headline measures · 2021 Census baseline |
| Services & amenities | Provider directories, ACECQA Continuous | Sep 2026 last month all 14 measures |
| Annual and financial-year sources 2 sections | ||
| Income | ABS, ATO Annual (ATO) | FY 2023 3 years ago headline measures · 2021 Census baseline |
| ATO taxable income statistics for FY 2023, indexed forward using the Wage Price Index. Census household income provides the distribution detail. | ||
| Health | ABS, ATO Annual | 2024 2 years ago headline measures · 2021 Census baseline |
| Census-measured — next update: 2026 Census 3 sections No more current small-area source exists for these, so they are labelled as Census-measured rather than implied to be current. | ||
| Housing | ABS 5-yearly (Census) | 2021 Census next update 2026 all 30 measures |
| Households | ABS 5-yearly (Census) | 2021 Census next update 2026 all 18 measures |
| Cultural diversity | ABS, Geoscience Australia 5-yearly (Census) | 2021 Census next update 2026 all 44 measures |
"Currency" is the most recent release feeding that section. Where the Census supplies the structural baseline underneath a current headline figure, the row says so.
How the numbers are built
Population
The Census provides the small-area baseline, aggregated from mesh blocks to this boundary. It is then re-based to the ABS Estimated Resident Population (June 2025 release), and new dwellings built since Census night are counted from address data — 765 validated new addresses here. The headline figure is therefore a current estimate for Aug 2026, not a 2021 count (19,928 at the 2021 Census → 20,510 now). Annual growth rates are compound (CAGR), not simple averages.
Age profile
Cohort shares are not raw Census counts. Every cohort is held as a pair — the Census baseline and a current estimate — and the split is re-based using ERP and state population projections, current to Aug 2026. Median age is the Census median plus modelled change since. Charts that show both are labelled "2021 Census vs Current Estimate".
Property sales
Sourced from the state valuation authority's sales register — current, not Census, and refreshed weekly. Medians are calculated from settled transactions in the period shown; periods with very low transaction counts are flagged or suppressed, because a handful of sales can move a median substantially.
Rents
Derived from state rental bond lodgement data, by dwelling type and bedroom count. Bonds are lodged at the start of a new tenancy, so this reflects new lettings, not the whole rented stock.
Development & infrastructure
Building approvals come from current ABS releases; development applications are collected from council and state planning portals; the infrastructure pipeline is compiled from Infrastructure Australia and local government sources. Applications are matched to this boundary by address or coordinates, so very recent lodgements may not yet appear.
Employment & income
Industry and occupation structure comes from the Census, but the headline labour-market indicators do not. Unemployment and labour force are derived from ABS Small Area Labour Markets (quarterly). The employment outlook applies Department of Employment forecasts for all 19 industry divisions to this area's own industry mix (the agency is now Jobs and Skills Australia), as does the Internet Vacancy Index used for job demand. Because it is weighted on industry composition alone, that outlook carries no allowance for local population growth — in fast-growing areas the real rise in local jobs will typically be higher. Income combines Census household income with ATO taxable-income statistics for FY 2023, indexed forward using the Wage Price Index.
Education, transport & amenities
School enrolments, ICSEA and performance come from ACARA's current release, not the Census. Public transport stops and service frequency are derived from GTFS timetable feeds published by state transport departments. Services and amenities are proximity and count scores built from provider directories, refreshed on their own cycle. The Census contributes only the travel-to-work and qualification measures.
Rankings and benchmarks. Where we rank this area, the comparison set is every area of the same boundary type — suburbs against suburbs, SA2s against SA2s. Benchmarks compare this area against its greater capital city region and the national figure for the same measure and period.
Limits worth knowing. Small areas carry larger error margins, and the ABS introduces small random adjustments to Census counts to protect confidentiality — so totals may not sum exactly. Estimates re-based from regional data describe the area's expected trajectory, not a direct count of it. Figures are indicative for research and are not financial, planning or valuation advice.
Cross-check us. The Census baseline for this boundary is at ABS 2021 Census QuickStats (216031416). QuickStats reports 2021 only — the figures on this page are more current wherever the ledger shows a later date.