Chart Color Schemes
est. as @ -- *
ABS ERP | -- people | --
2021 Census | -- people
Sales Activity
Curious about local property values? Filter the chart to assess the volume and appreciation (including resales) trends and regional comparisons, or scroll to the map below view this information at an individual property level.
Find a Recent Sale
Sales Detail
Population
Cranbourne South lies within the top 10% of areas nationally in terms of population growth performance according to AreaSearch analysis of short and medium-term trends
Cranbourne South's population is approximately 27,594 as of November 2025. This figure reflects a growth of 10,194 people since the 2021 Census, which reported a population of 17,400. The increase is inferred from the estimated resident population of 24,591 in June 2024 and an additional 3,643 validated new addresses since the Census date. This results in a population density ratio of 337 persons per square kilometer. Cranbourne South's growth rate of 58.6% since the 2021 census exceeds both national (8.9%) and state averages, positioning it as a growth leader in the region. Interstate migration contributed approximately 77.2% to overall population gains during recent periods, with natural growth and overseas migration also being positive factors.
AreaSearch uses ABS/Geoscience Australia projections for each SA2 area released in 2024 with a base year of 2022. For areas not covered by this data, AreaSearch employs the VIC State Government's Regional/LGA projections from 2023, adjusted using weighted aggregation methods to SA2 levels. Growth rates by age group are applied across all areas for years 2032 to 2041. Based on these trends, Cranbourne South is predicted to experience exceptional growth, placing it in the top 10 percent of national statistical areas. By 2041, the area is expected to expand by 32,213 persons, marking a total gain of 105.8% over the 17-year period.
Frequently Asked Questions - Population
Development
The level of residential development activity in Cranbourne South was found to be higher than 90% of real estate markets across the country
Cranbourne South has seen approximately 996 new homes approved annually on average over the past five financial years, totalling 4,983 homes. As of FY26351 approvals have been recorded. On average, around 2.4 people moved to the area per new home constructed each year between FY21 and FY25, indicating solid demand for housing. New homes are being built at an average expected construction cost value of $296,000, aligning with regional trends.
In FY26, $109.8 million in commercial development approvals have been recorded, suggesting strong commercial development momentum. Compared to Greater Melbourne, Cranbourne South records 273.0% more construction activity per person, offering greater choice for buyers and reflecting strong developer confidence in the area. New development consists of 93.0% standalone homes and 7.0% townhouses or apartments, maintaining the area's traditional low-density character with a focus on family homes. With around 21 people per dwelling approval, Cranbourne South exhibits characteristics of a growth area. Future projections indicate that Cranbourne South will add approximately 29,197 residents by 2041.
Given current construction levels, housing supply is expected to adequately meet demand, creating favourable conditions for buyers while potentially enabling population growth that exceeds current forecasts.
Frequently Asked Questions - Development
Infrastructure
Cranbourne South has emerging levels of nearby infrastructure activity, ranking in the 36thth percentile nationally
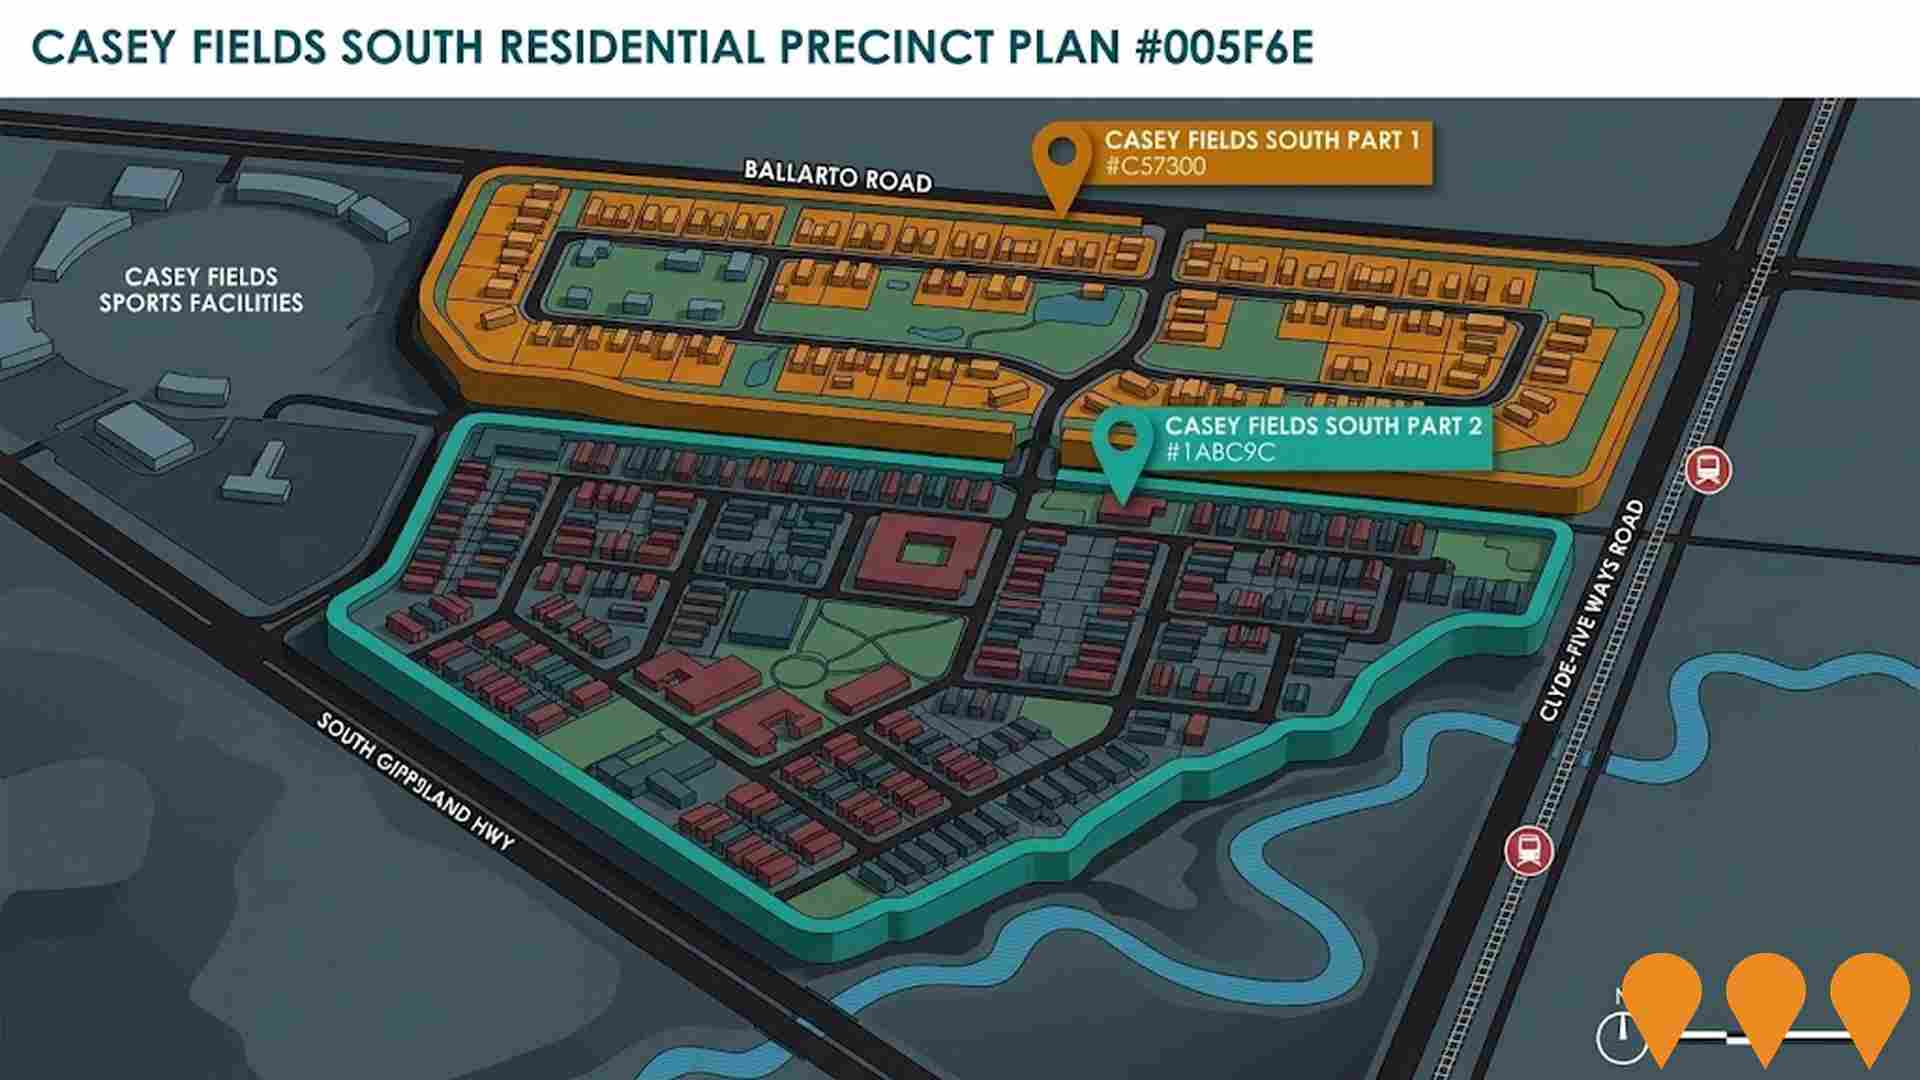
Changes to local infrastructure significantly influence an area's performance. AreaSearch has identified 72 projects likely impacting the area. Notable projects include Botanic Ridge Secondary College, Ortus, Casey Fields South Residential, and Casey Fields South Employment Precinct. The following details projects likely most relevant.
Professional plan users can use the search below to filter and access additional projects.
INFRASTRUCTURE SEARCH
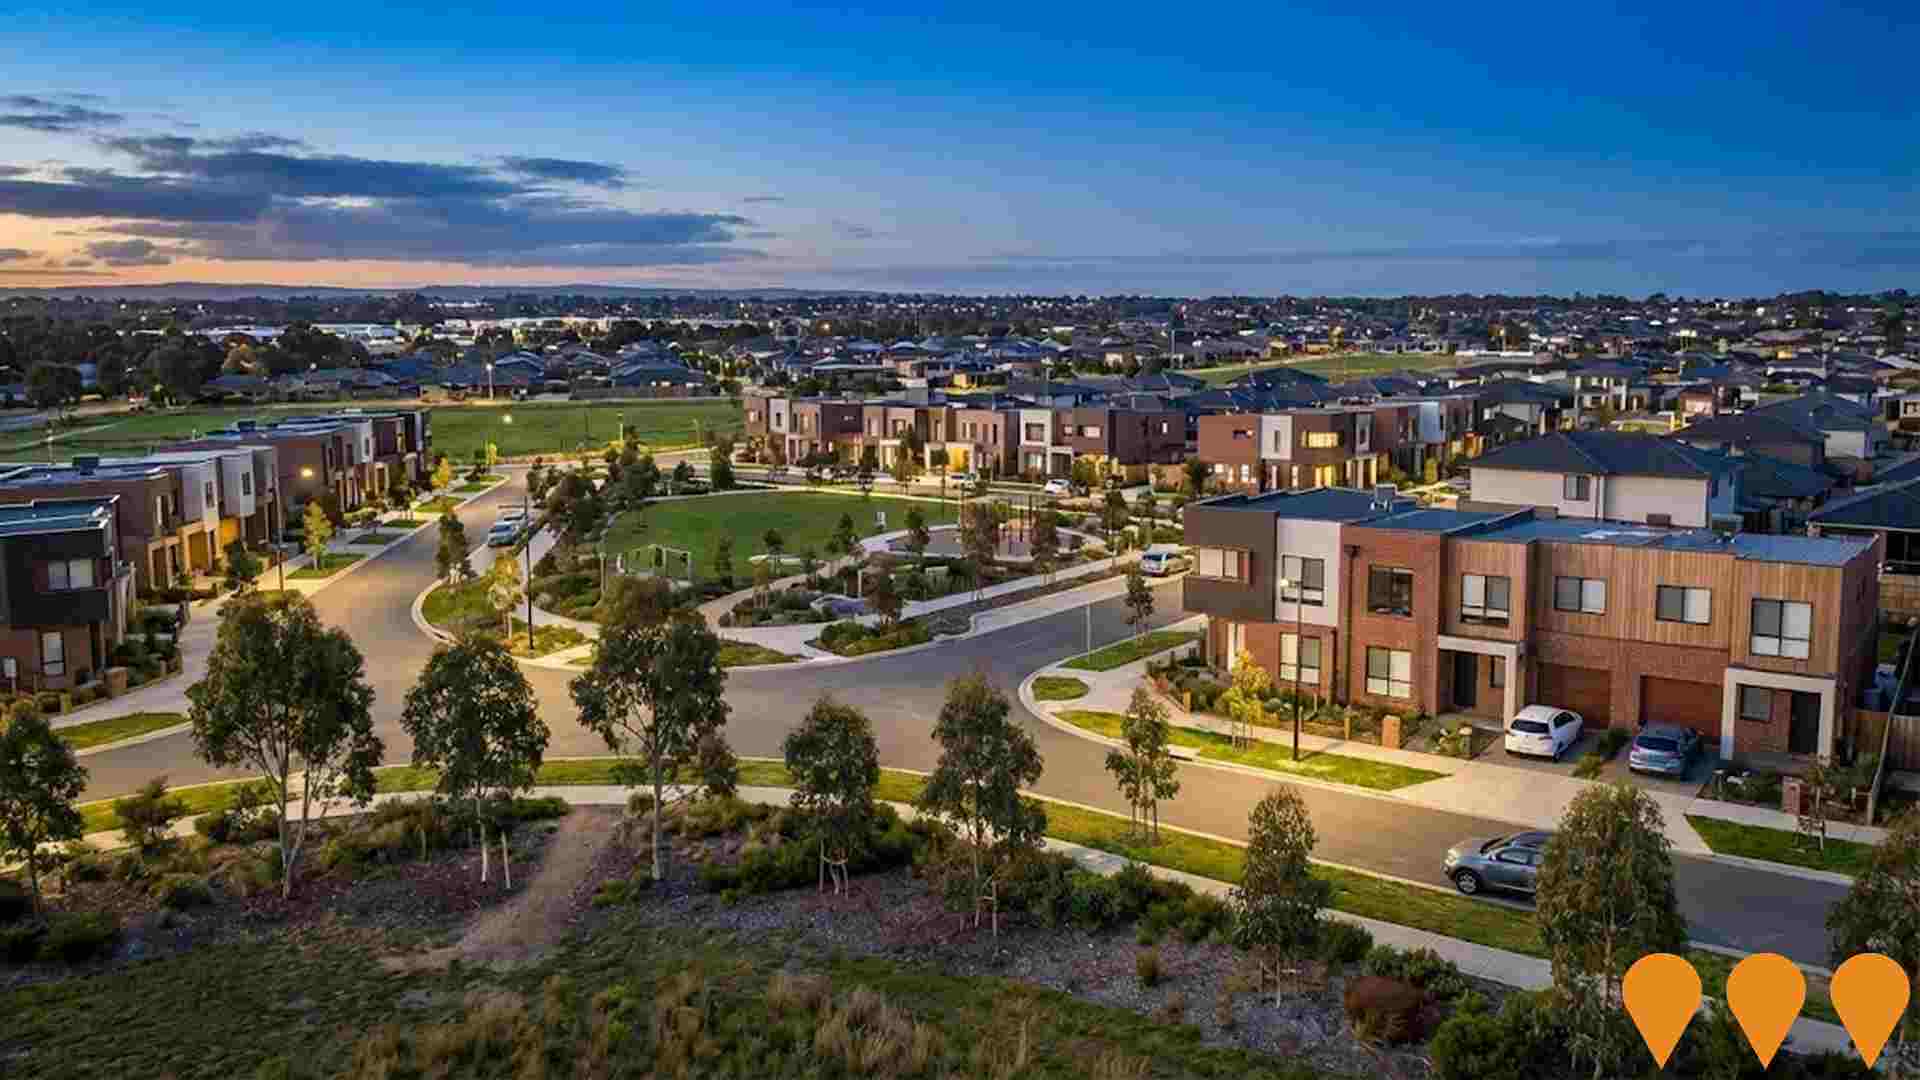
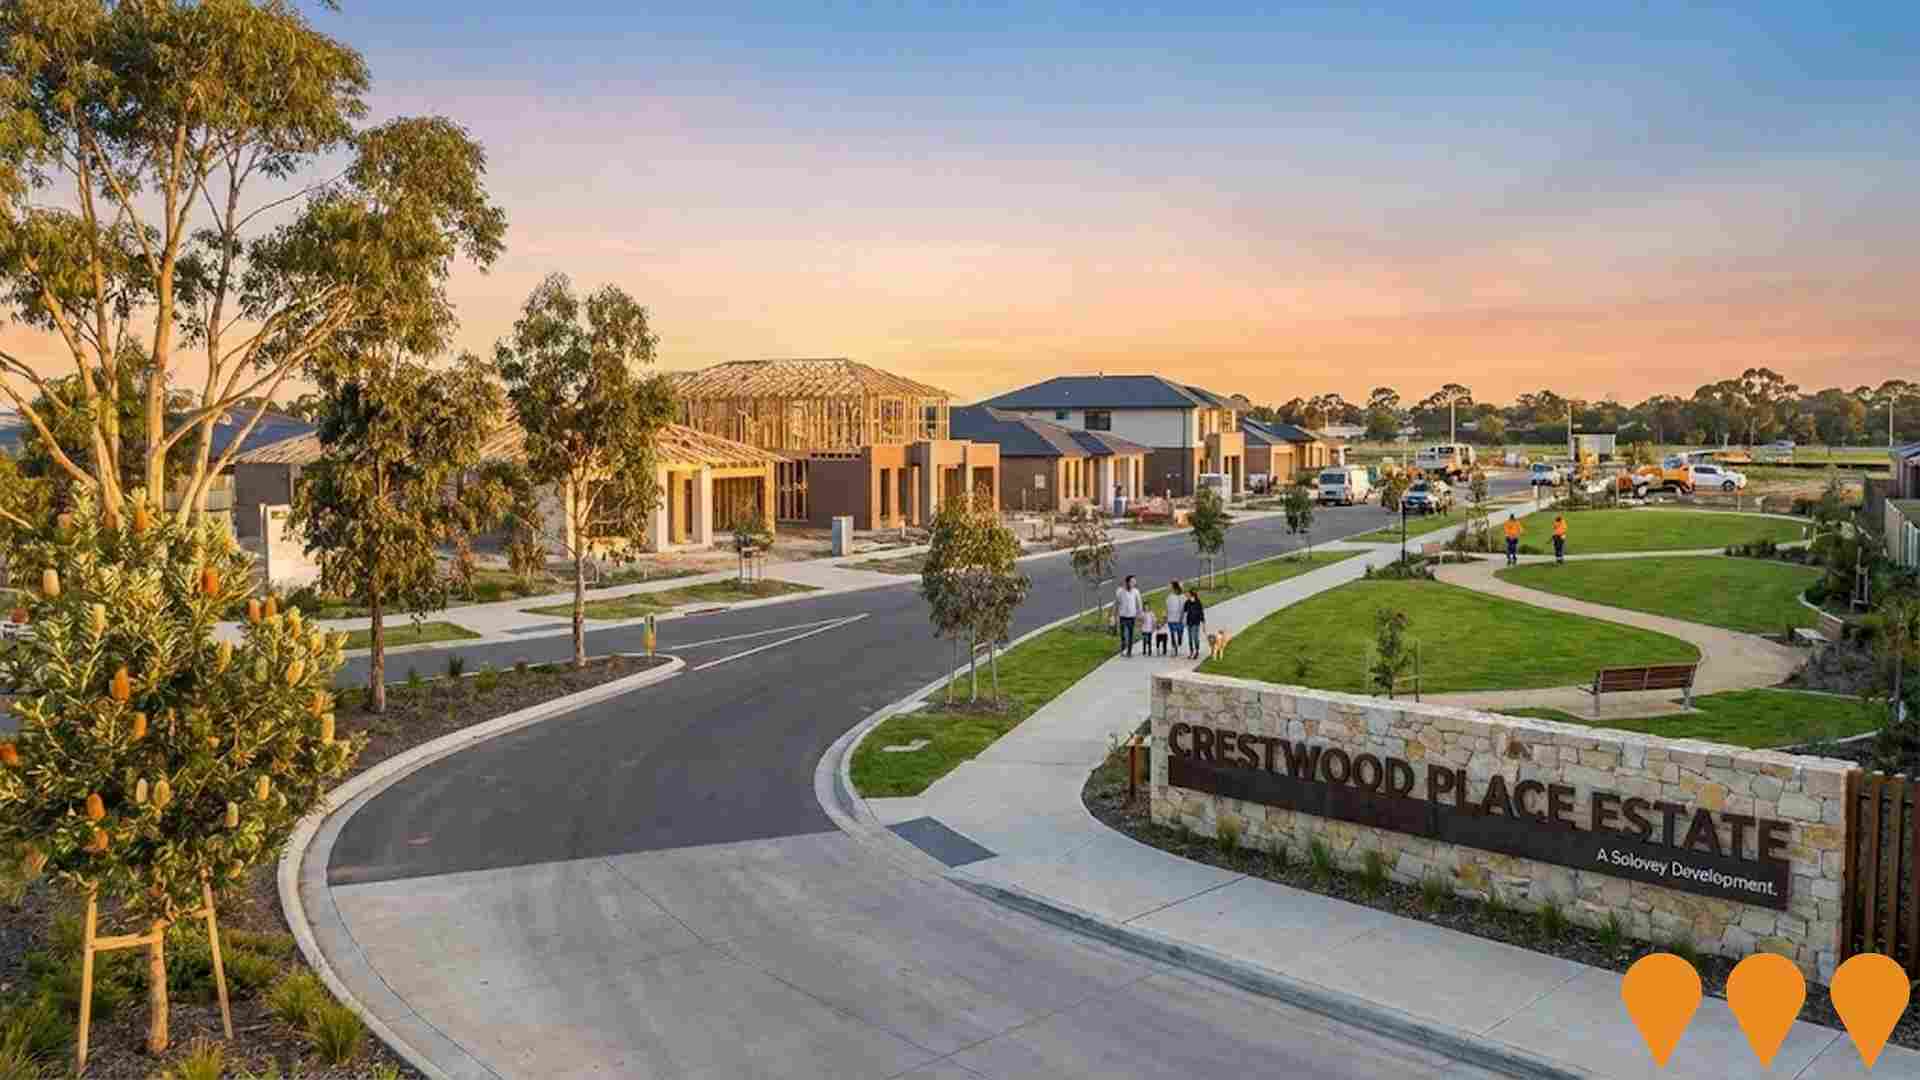
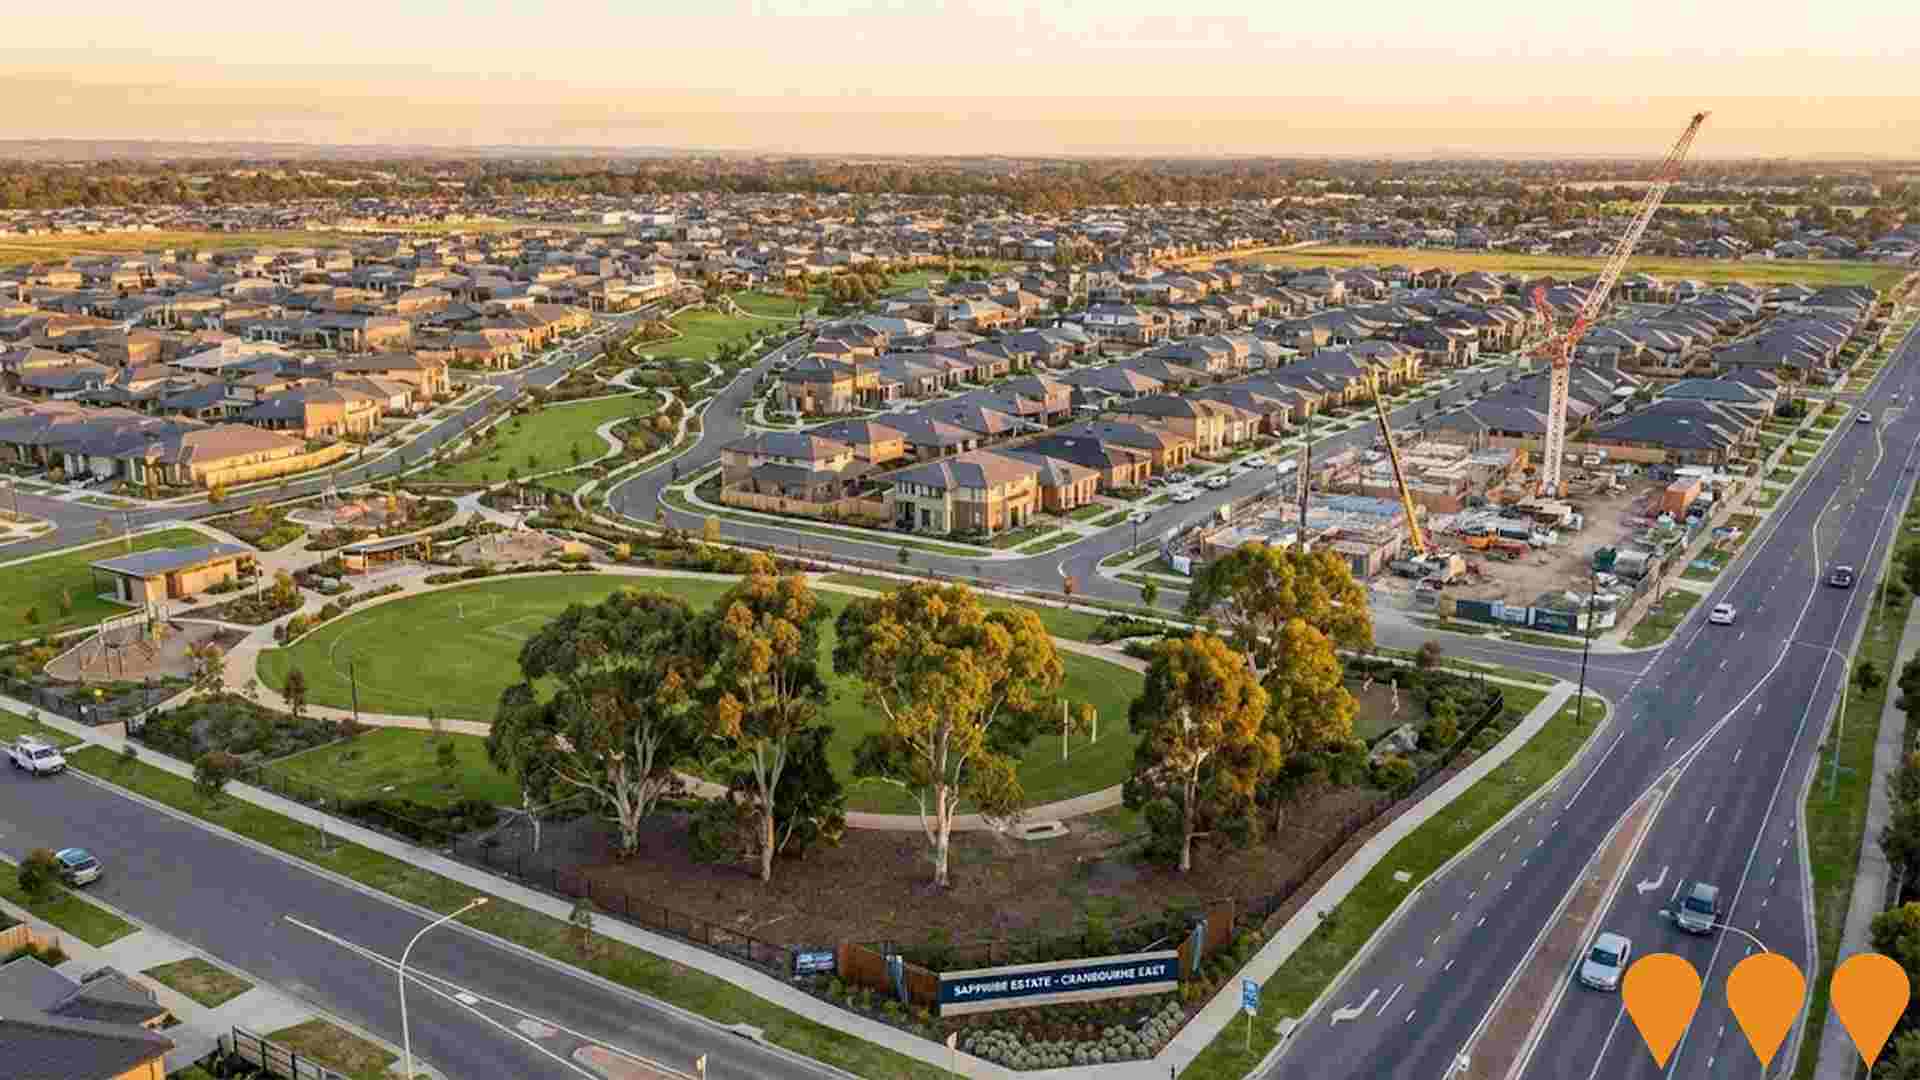
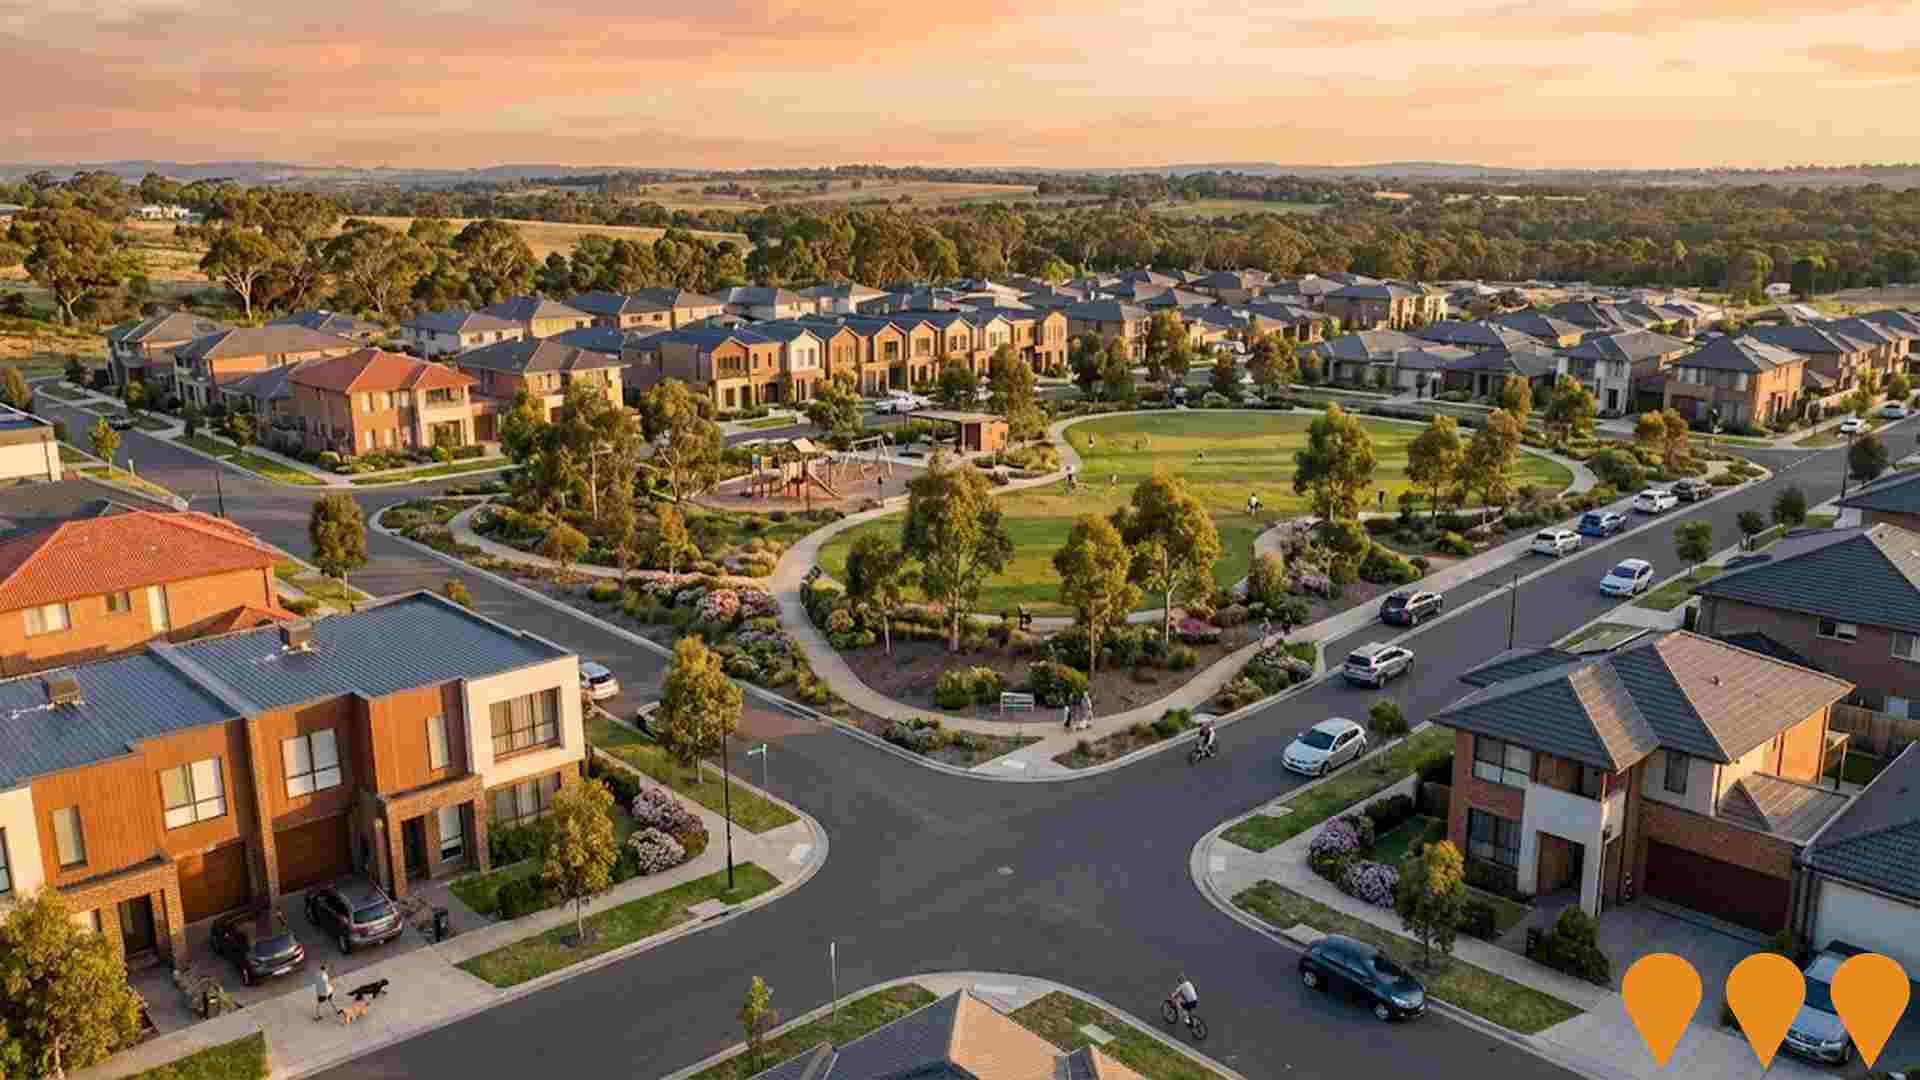
 Denotes AI-based impression for illustrative purposes only, not to be taken as definitive under any circumstances. Please follow links and conduct other investigations from the project's source for actual imagery. Developers and project owners wishing us to use original imagery please Contact Us and we will do so.
Frequently Asked Questions - Infrastructure
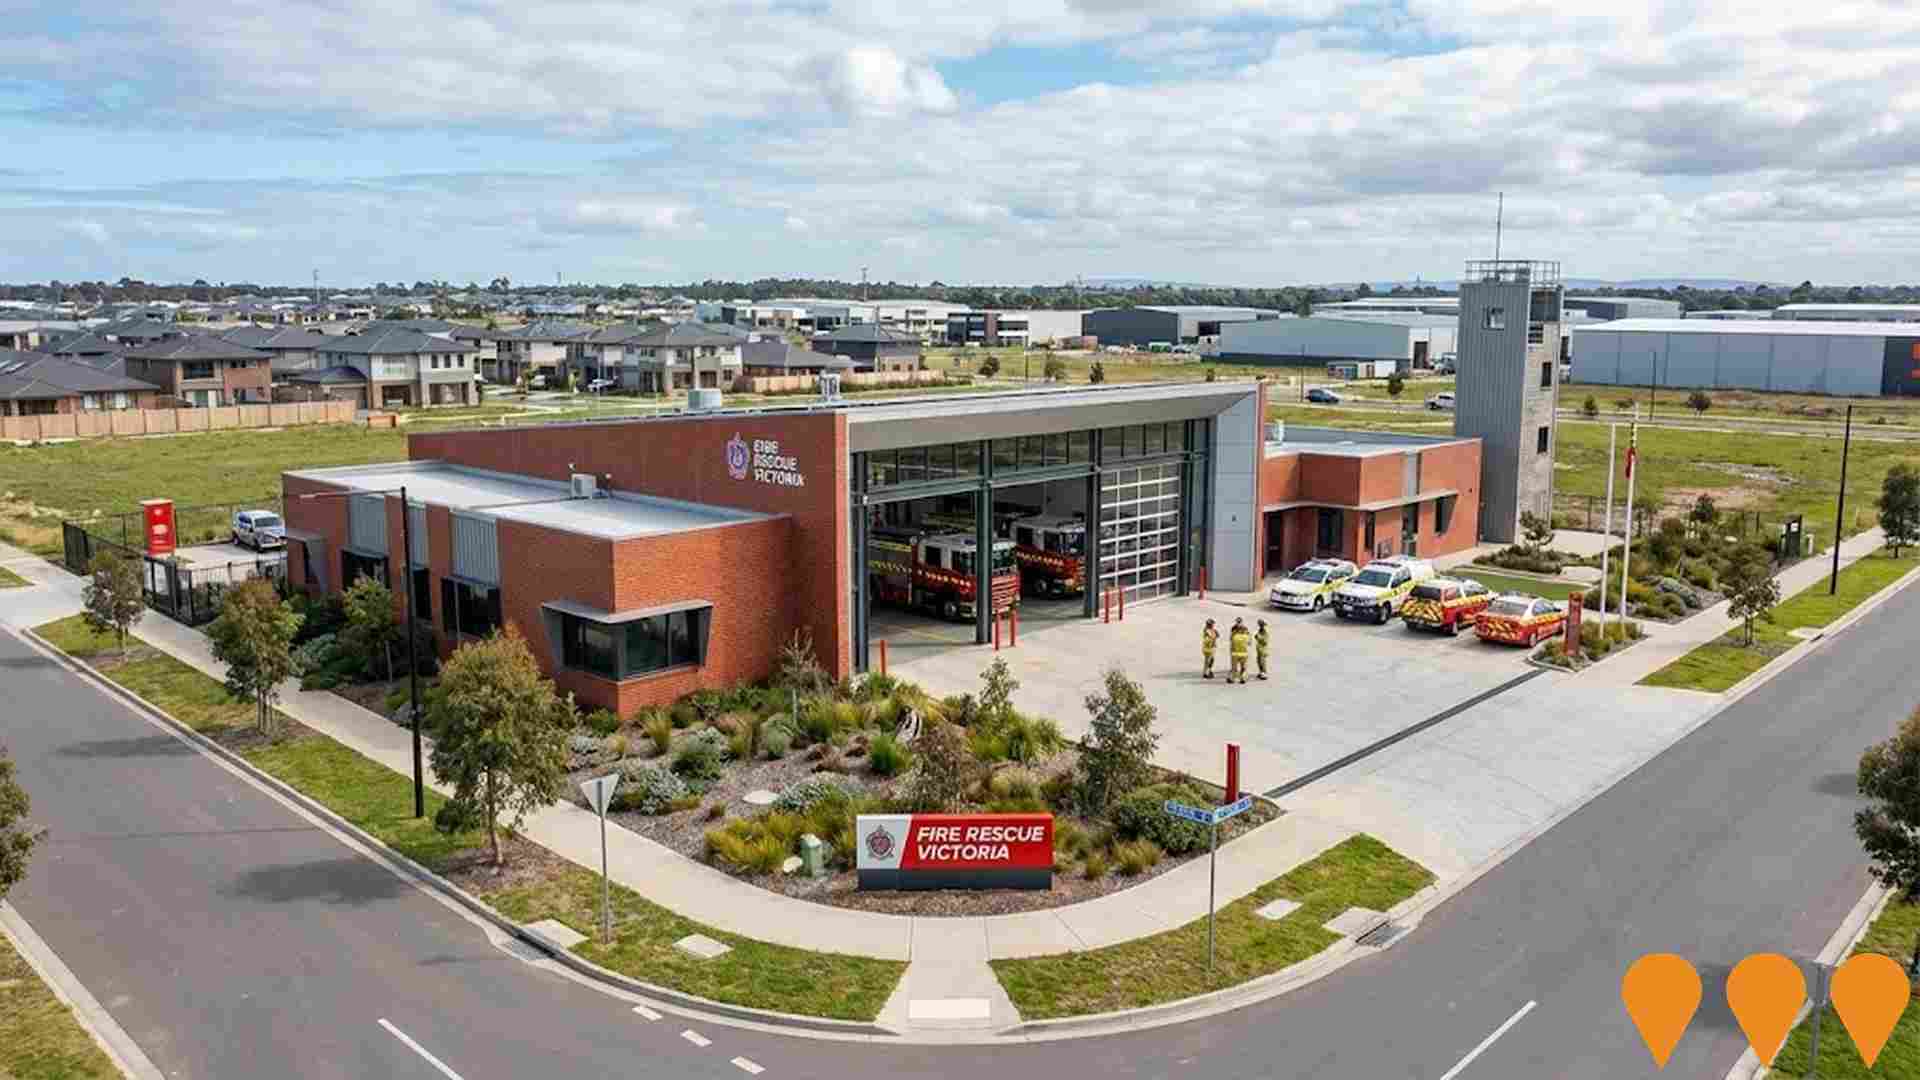
Clyde North Fire Station
New Fire Rescue Victoria station at 101 Matterhorn Drive, Clyde North, serving the rapidly growing south-east Melbourne corridor. The single-storey facility will accommodate up to 8 career firefighters per shift, modern fire appliances and specialist equipment to improve emergency response times and community safety.
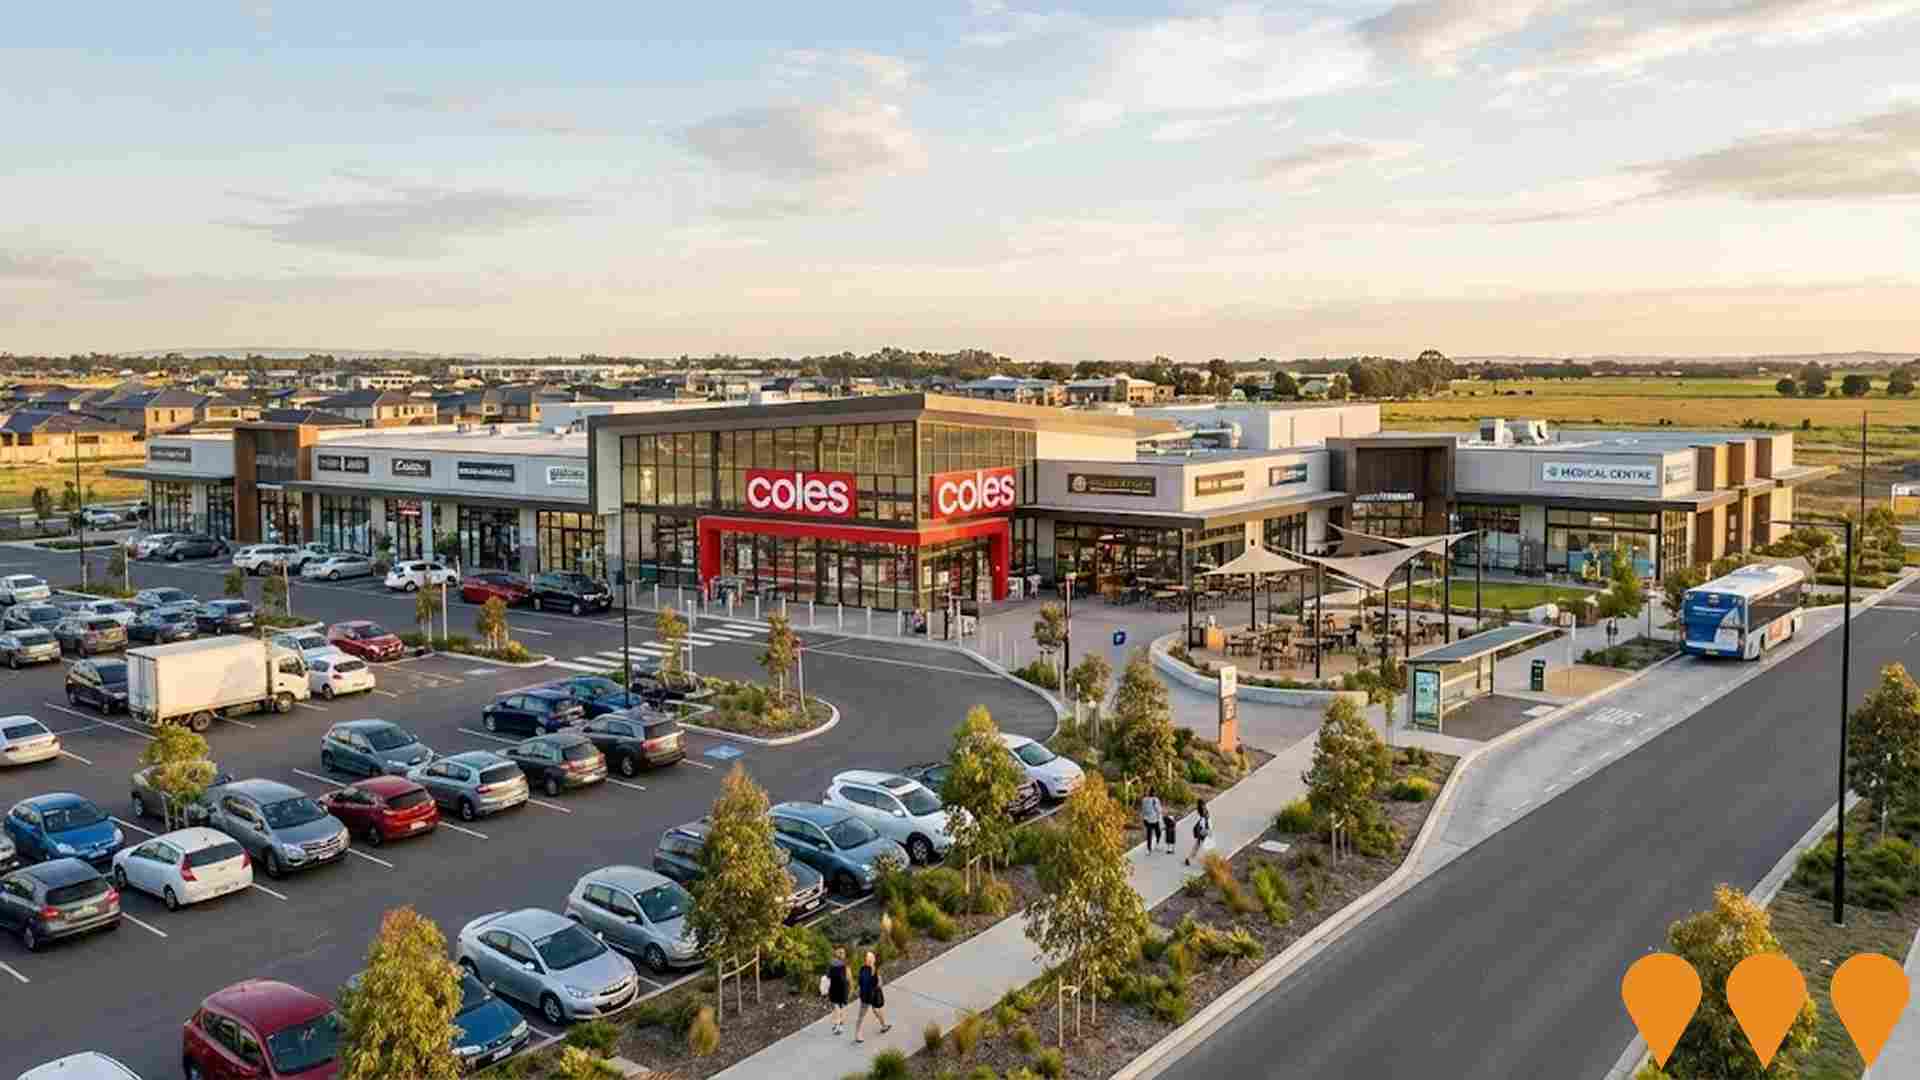
Orana Town Centre
New neighbourhood town centre within the Orana masterplanned community in Clyde North, anchored by a full-line Coles supermarket (3,582 sqm), specialty retail, medical centre, childcare centre, gym and dining options. Serves the daily needs of the growing Orana and surrounding Clyde North population.
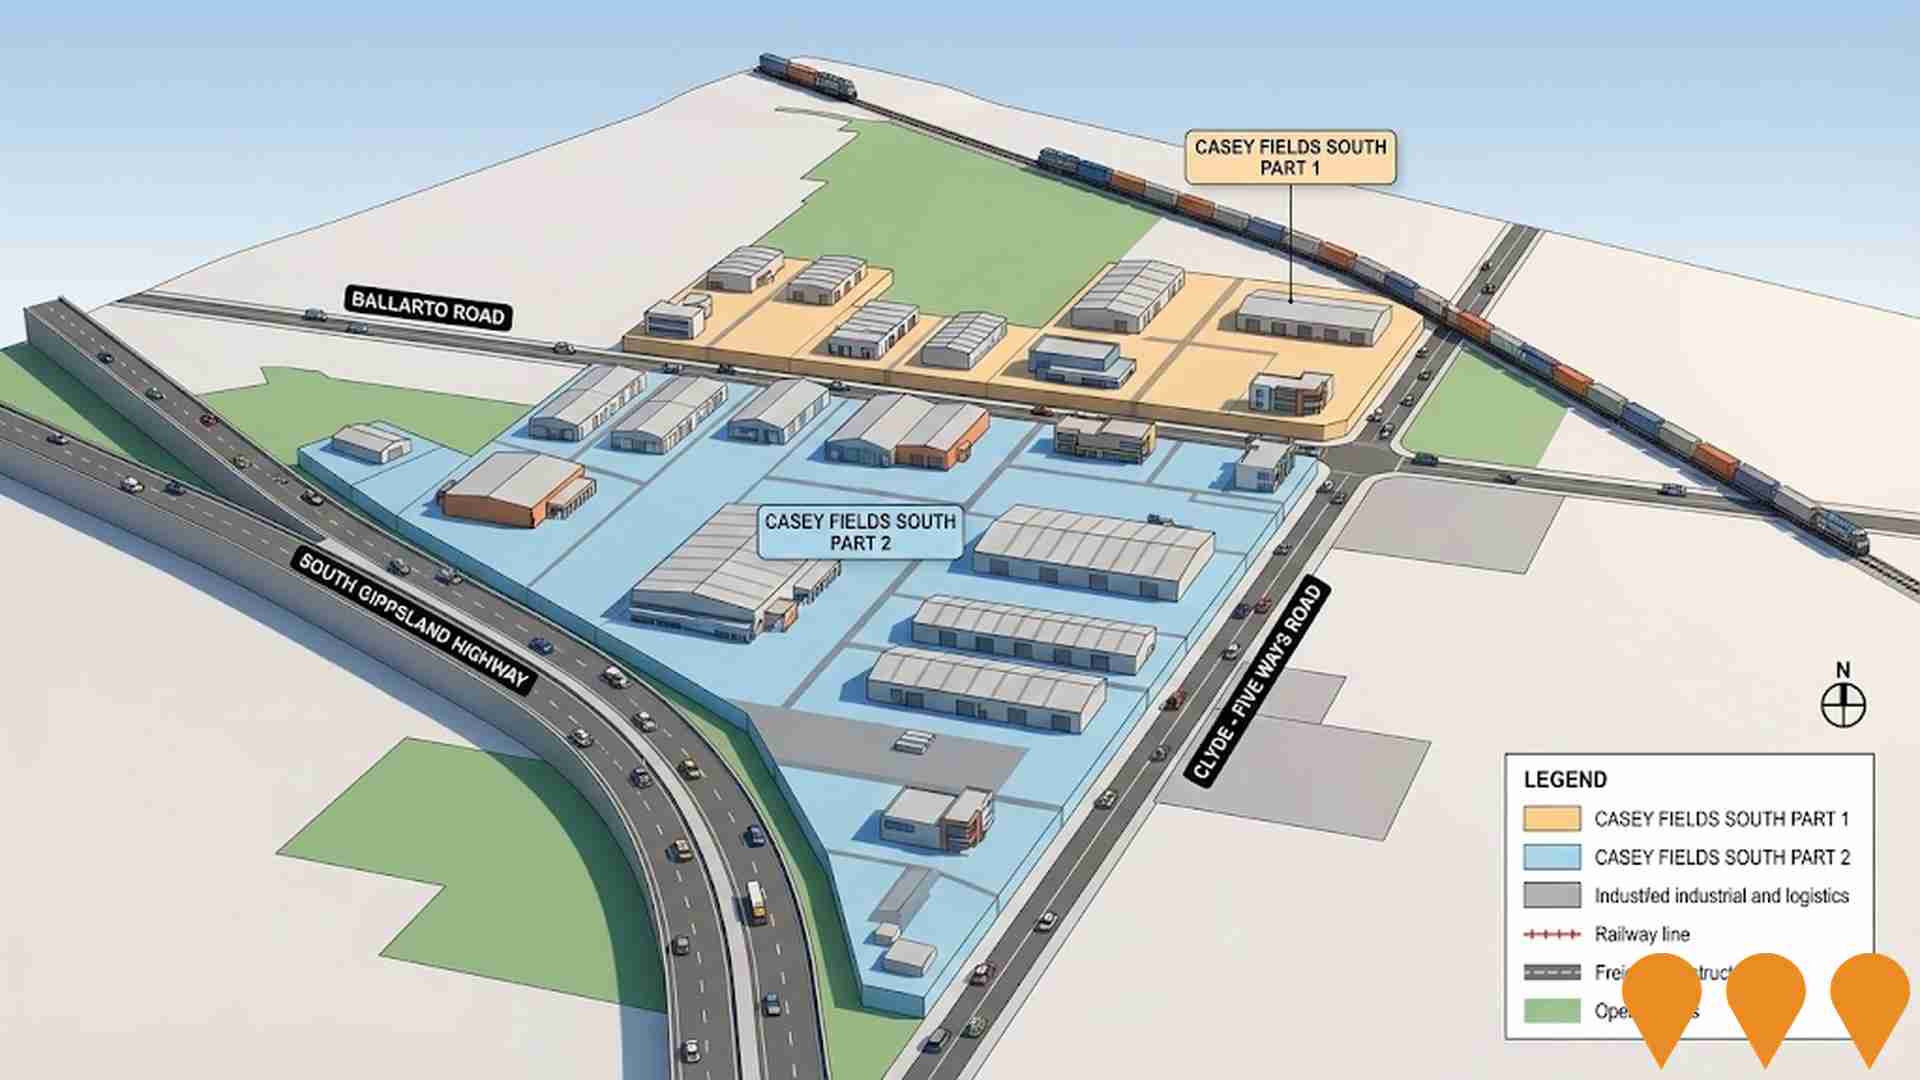
Casey Fields South Employment Precinct
A 275-hectare industrial precinct in Clyde North, designed for manufacturing, logistics, transport, and commercial operations. It offers excellent freight access to ports and airports, aiming to create approximately 42,000 jobs in business parks and technology hubs.
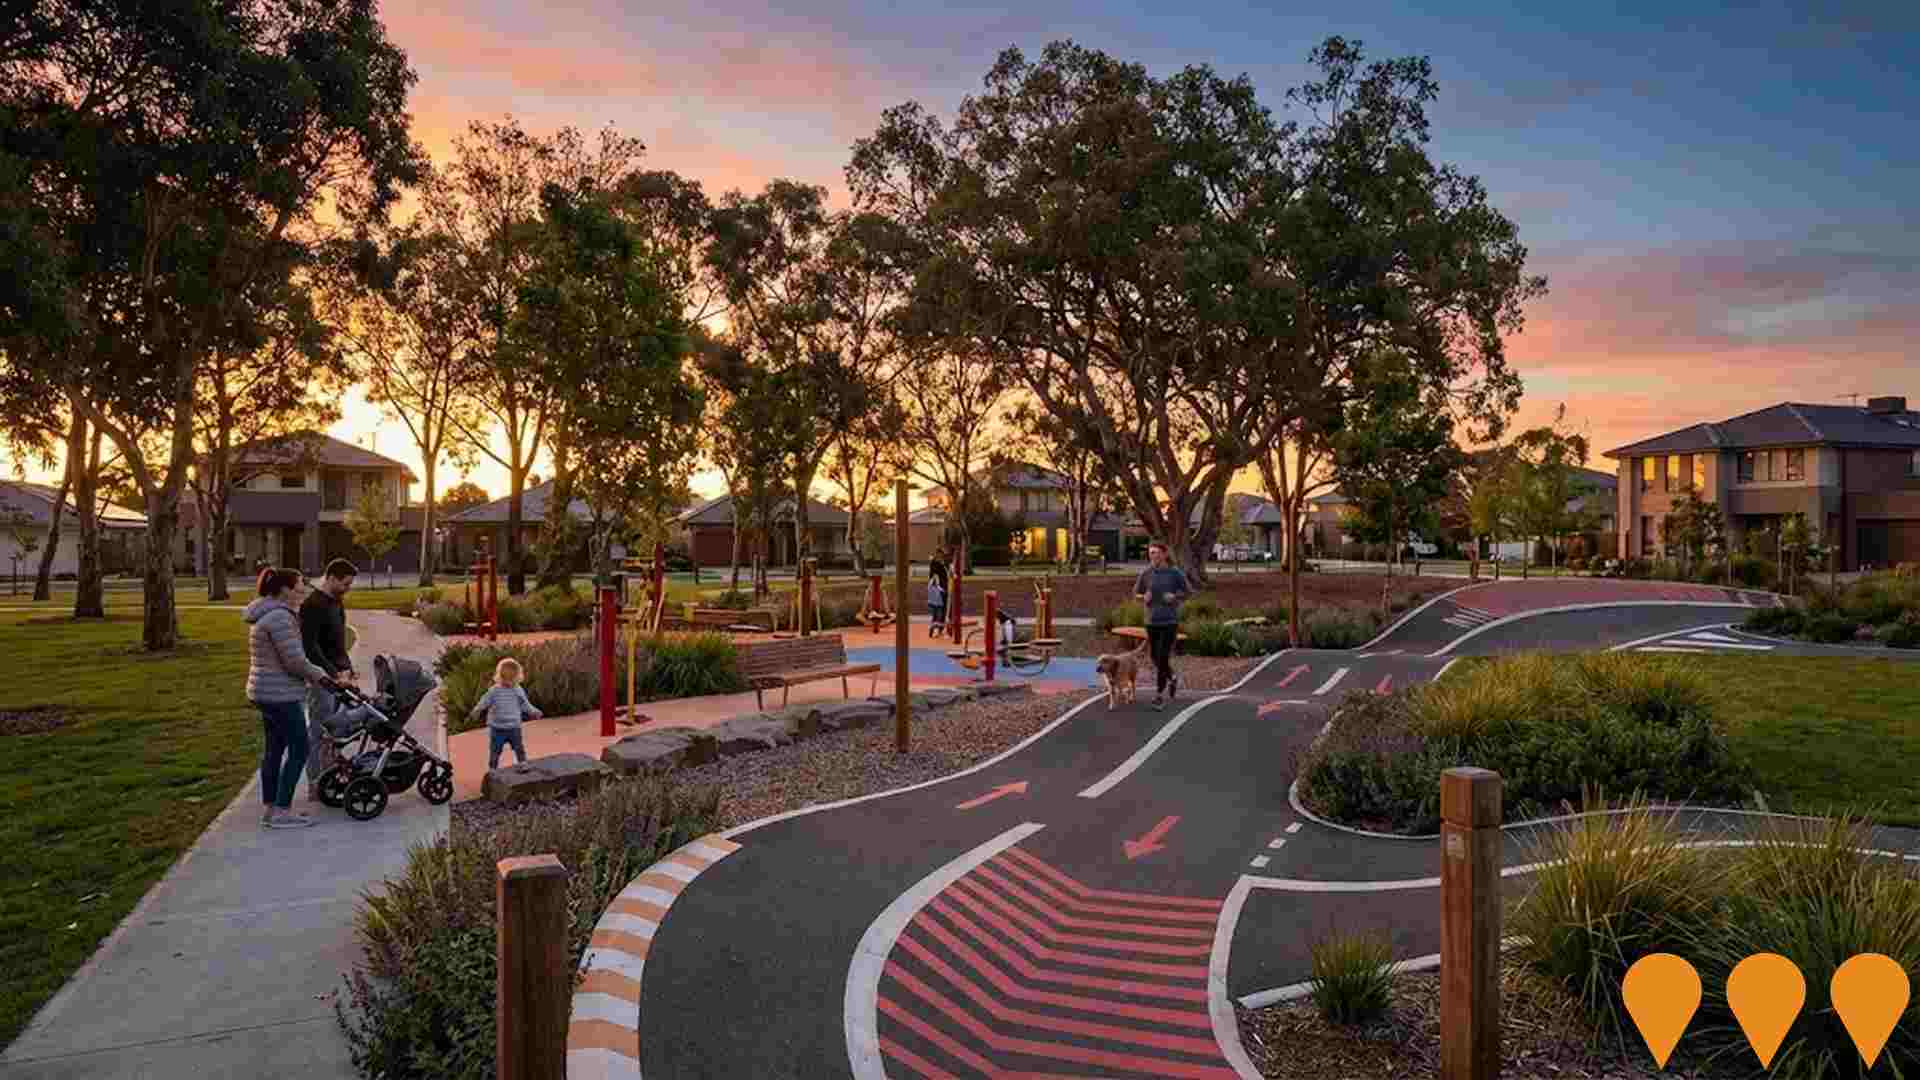
Oak Grove
Oak Grove is a 92-hectare masterplanned community in Clyde North, offering contemporary living with tree-lined boulevards, spacious blocks, over 14.5 hectares of parklands, proposed cafes, playgrounds, and designed for families. This future neighbourhood celebrates surrounding natural splendour and epitomises contemporary urban design.
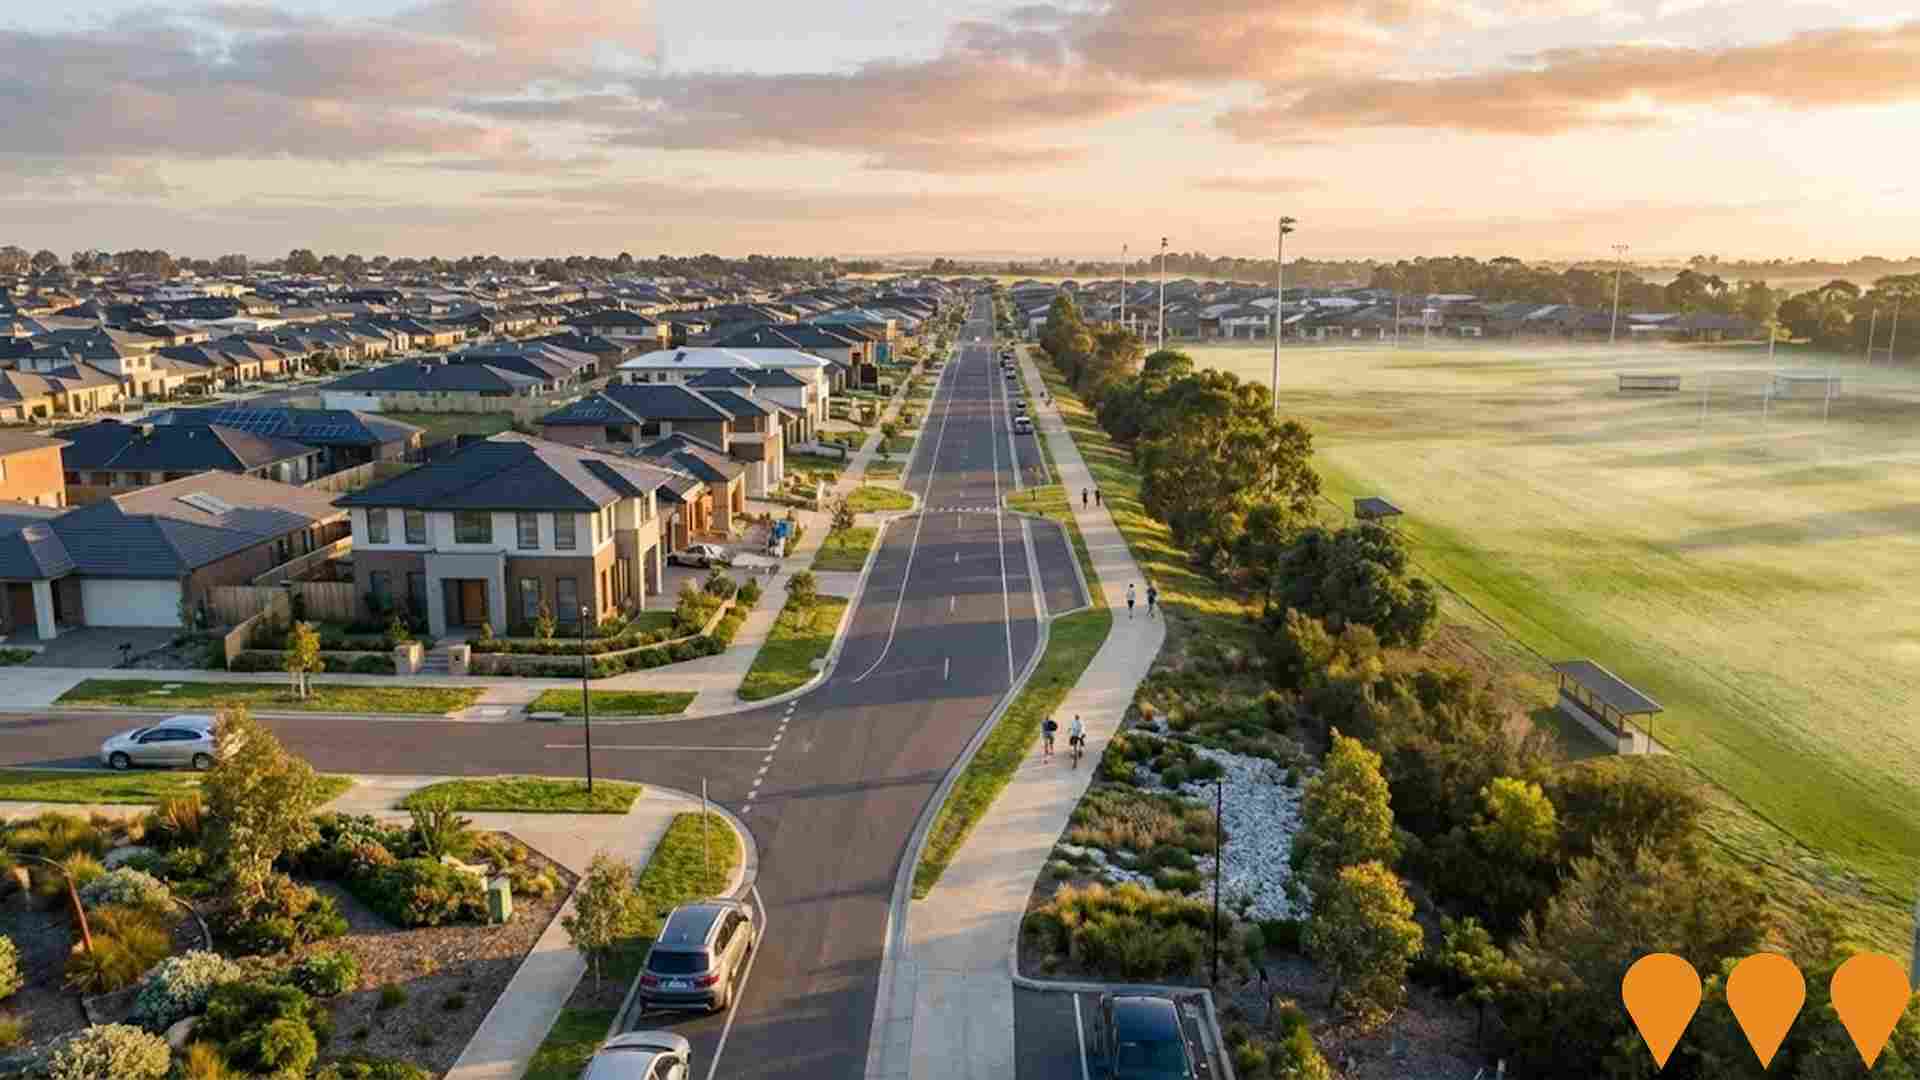
Pavilion Casey Fields
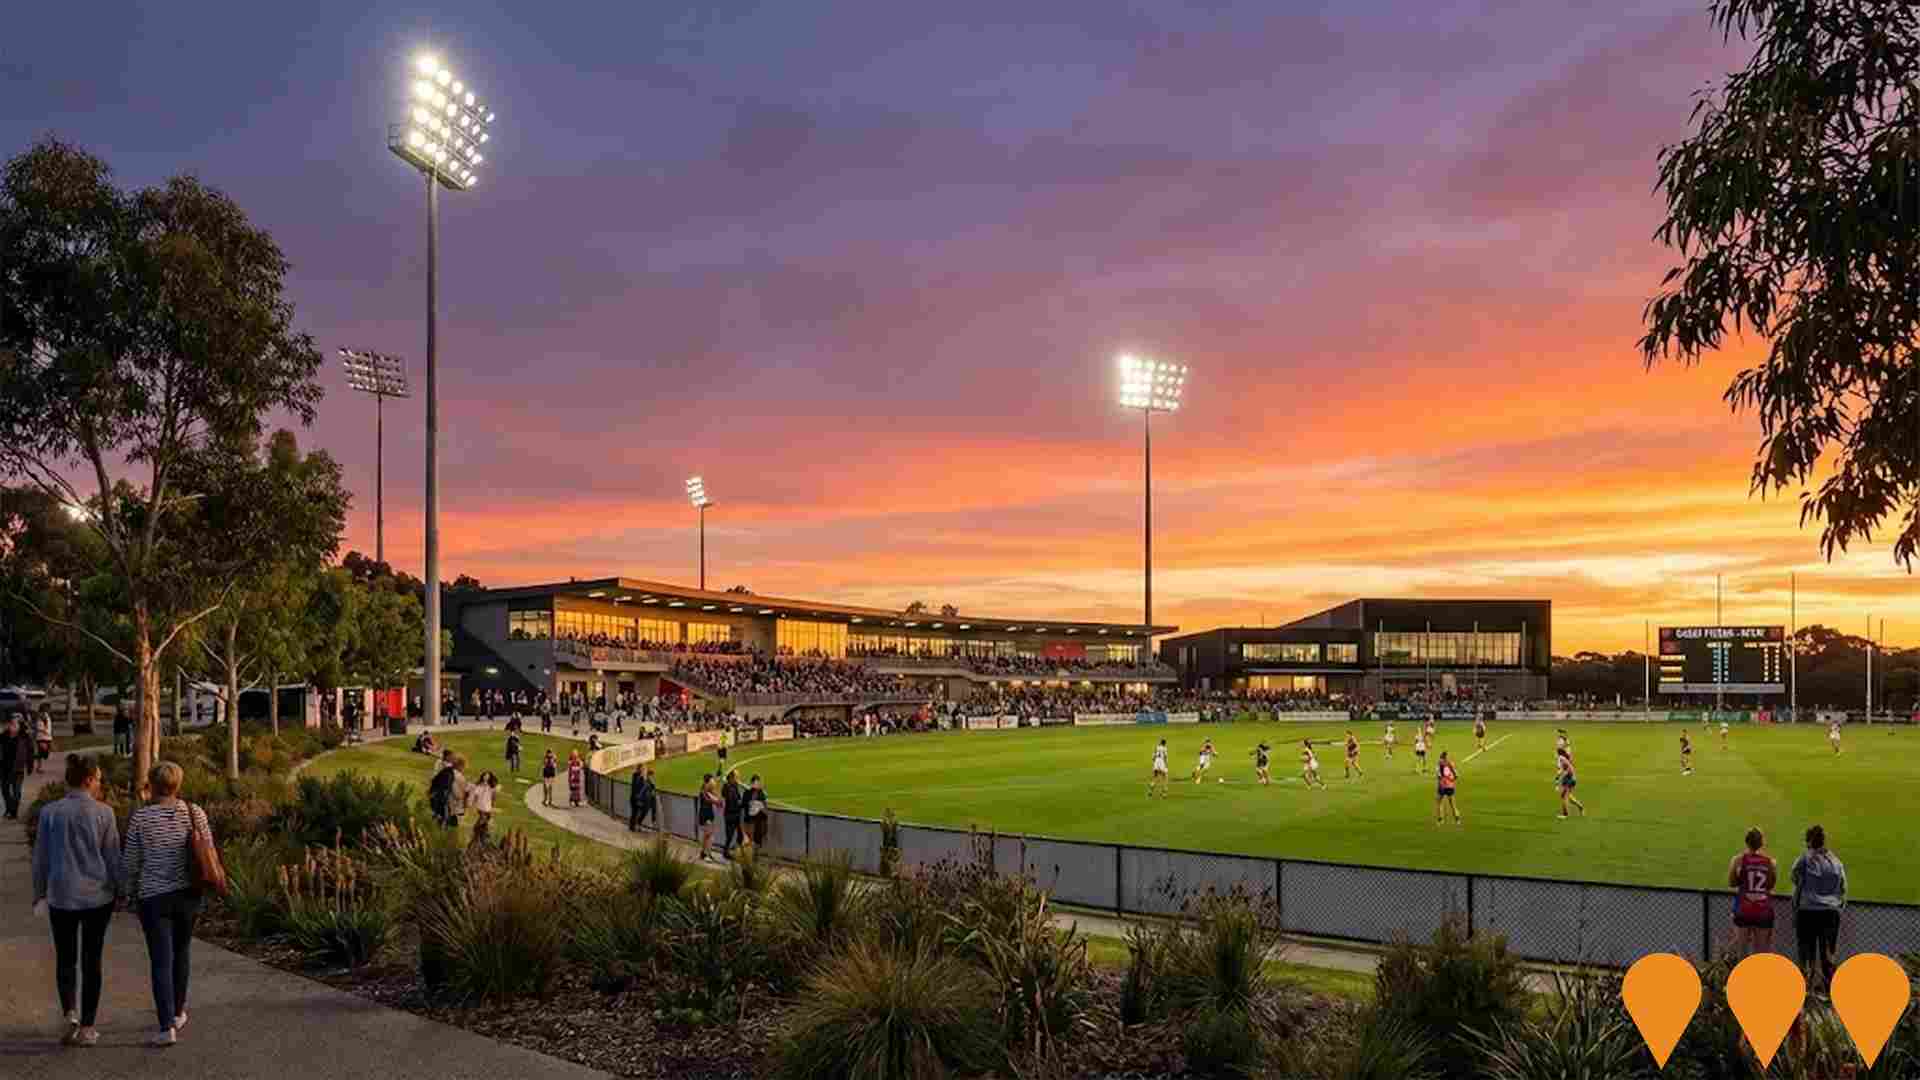
A master-planned community by Wolfdene and Blueways Group located next to the 70-hectare Casey Fields sporting precinct in Clyde. The 35-hectare development includes approximately 623 dwellings, comprising residential lots and townhomes. Key features include integrated wetlands, parks, and extensive walking and cycling paths connecting residents to the adjacent sporting facilities and local shopping centers.
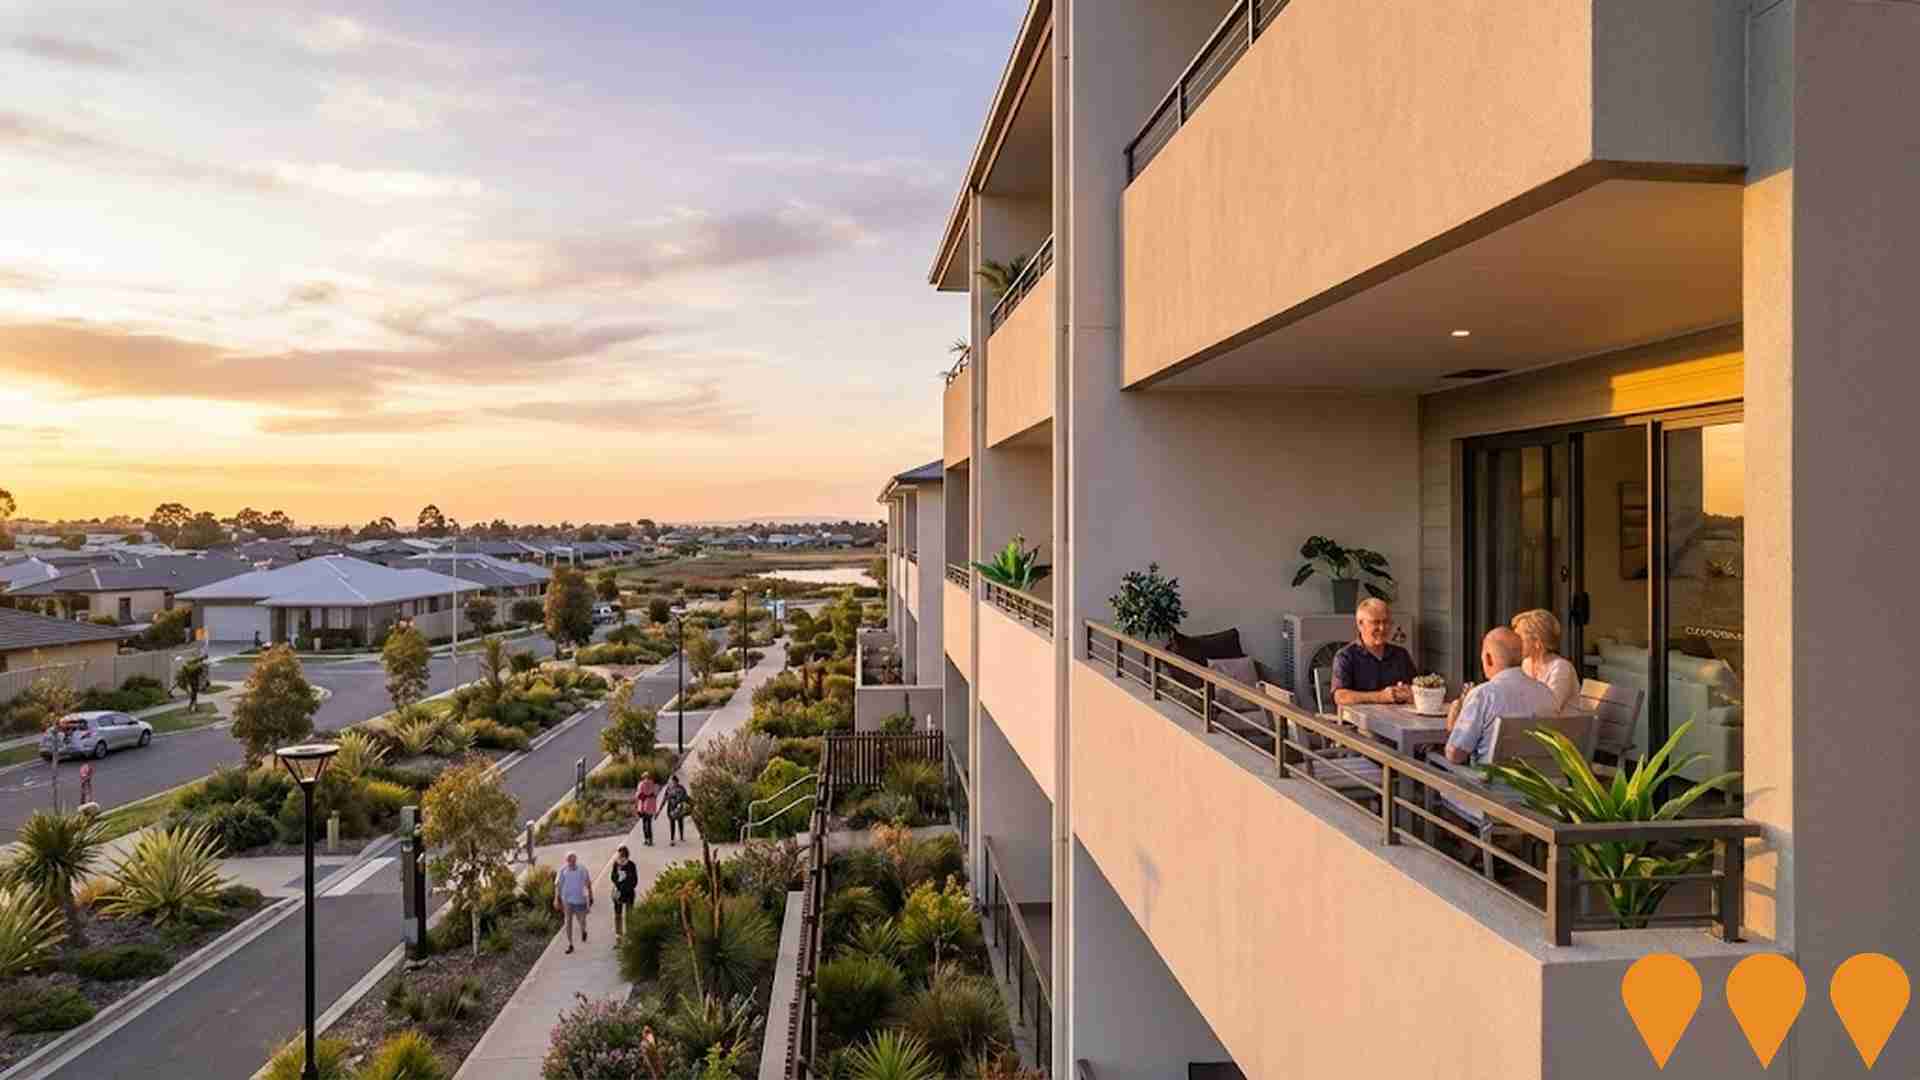
Levande Selandra Rise Retirement Village
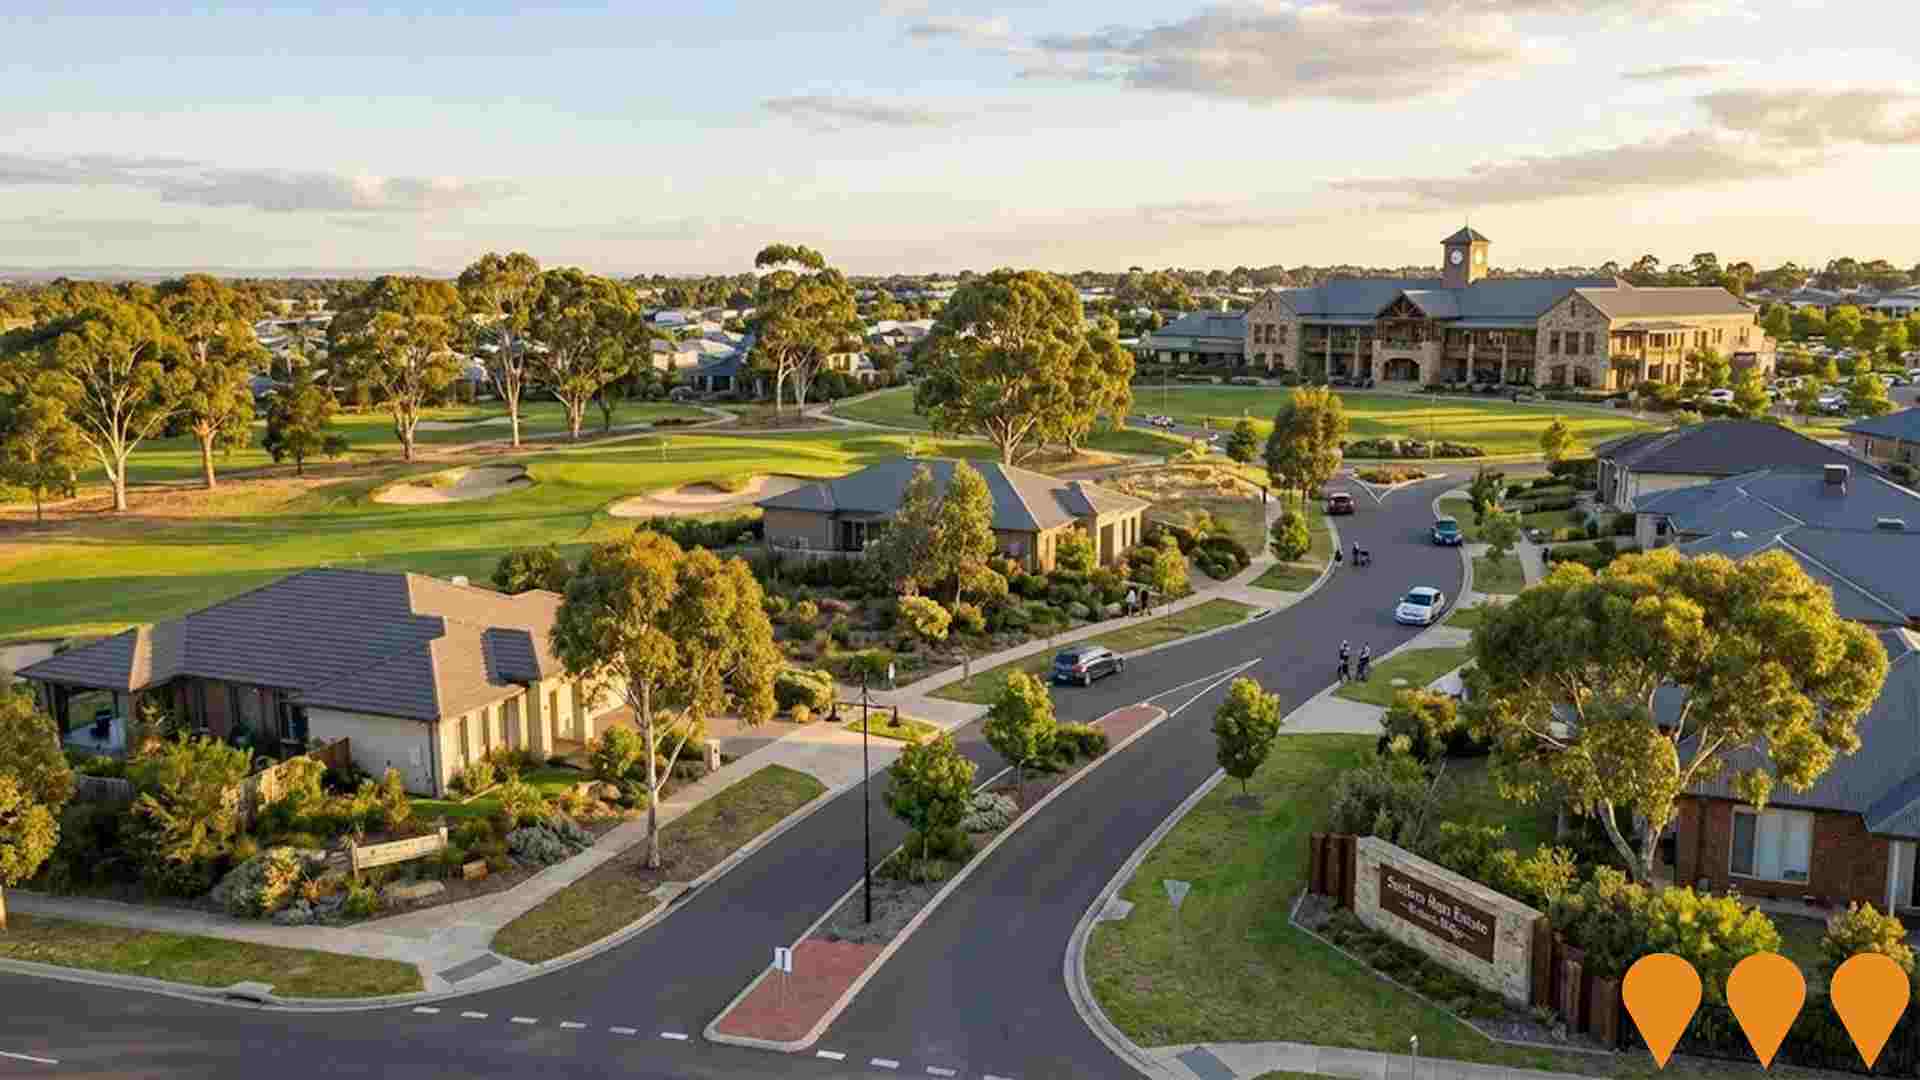
Vibrant retirement village offering independent living villas and apartments with modern, energy-efficient designs, integrated with a 120-bed aged care facility providing high care and dementia support. Features include a state-of-the-art clubhouse with gymnasium, indoor heated pool and spa, library, hair salon, movie theatre, cafe, bar, and town hall. Located in a secure, gated community adjacent to shopping centres, bus stops, and wetlands, promoting a sustainable and active lifestyle.
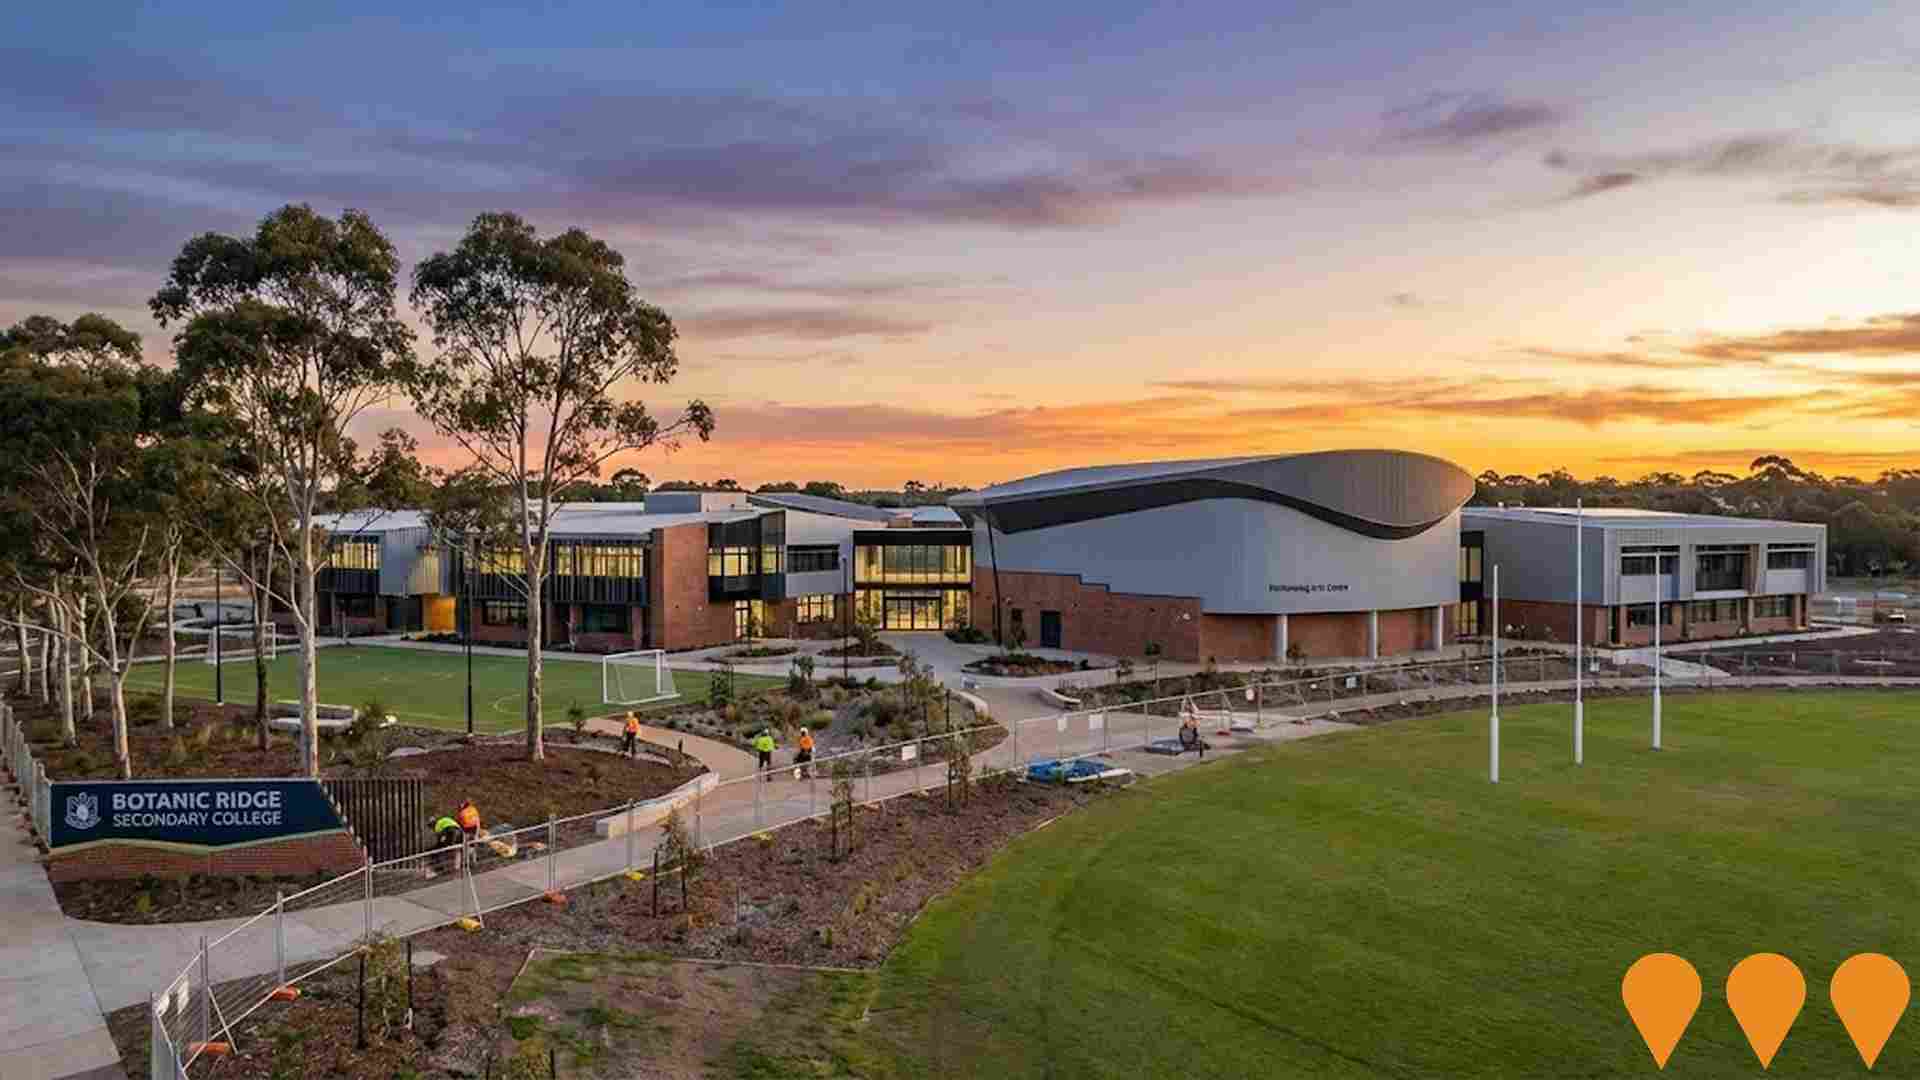
Botanic Ridge Secondary College
New government secondary college for 1100 students (Years 7-12) opening in 2026, including performing arts, STEM facilities and sports fields.
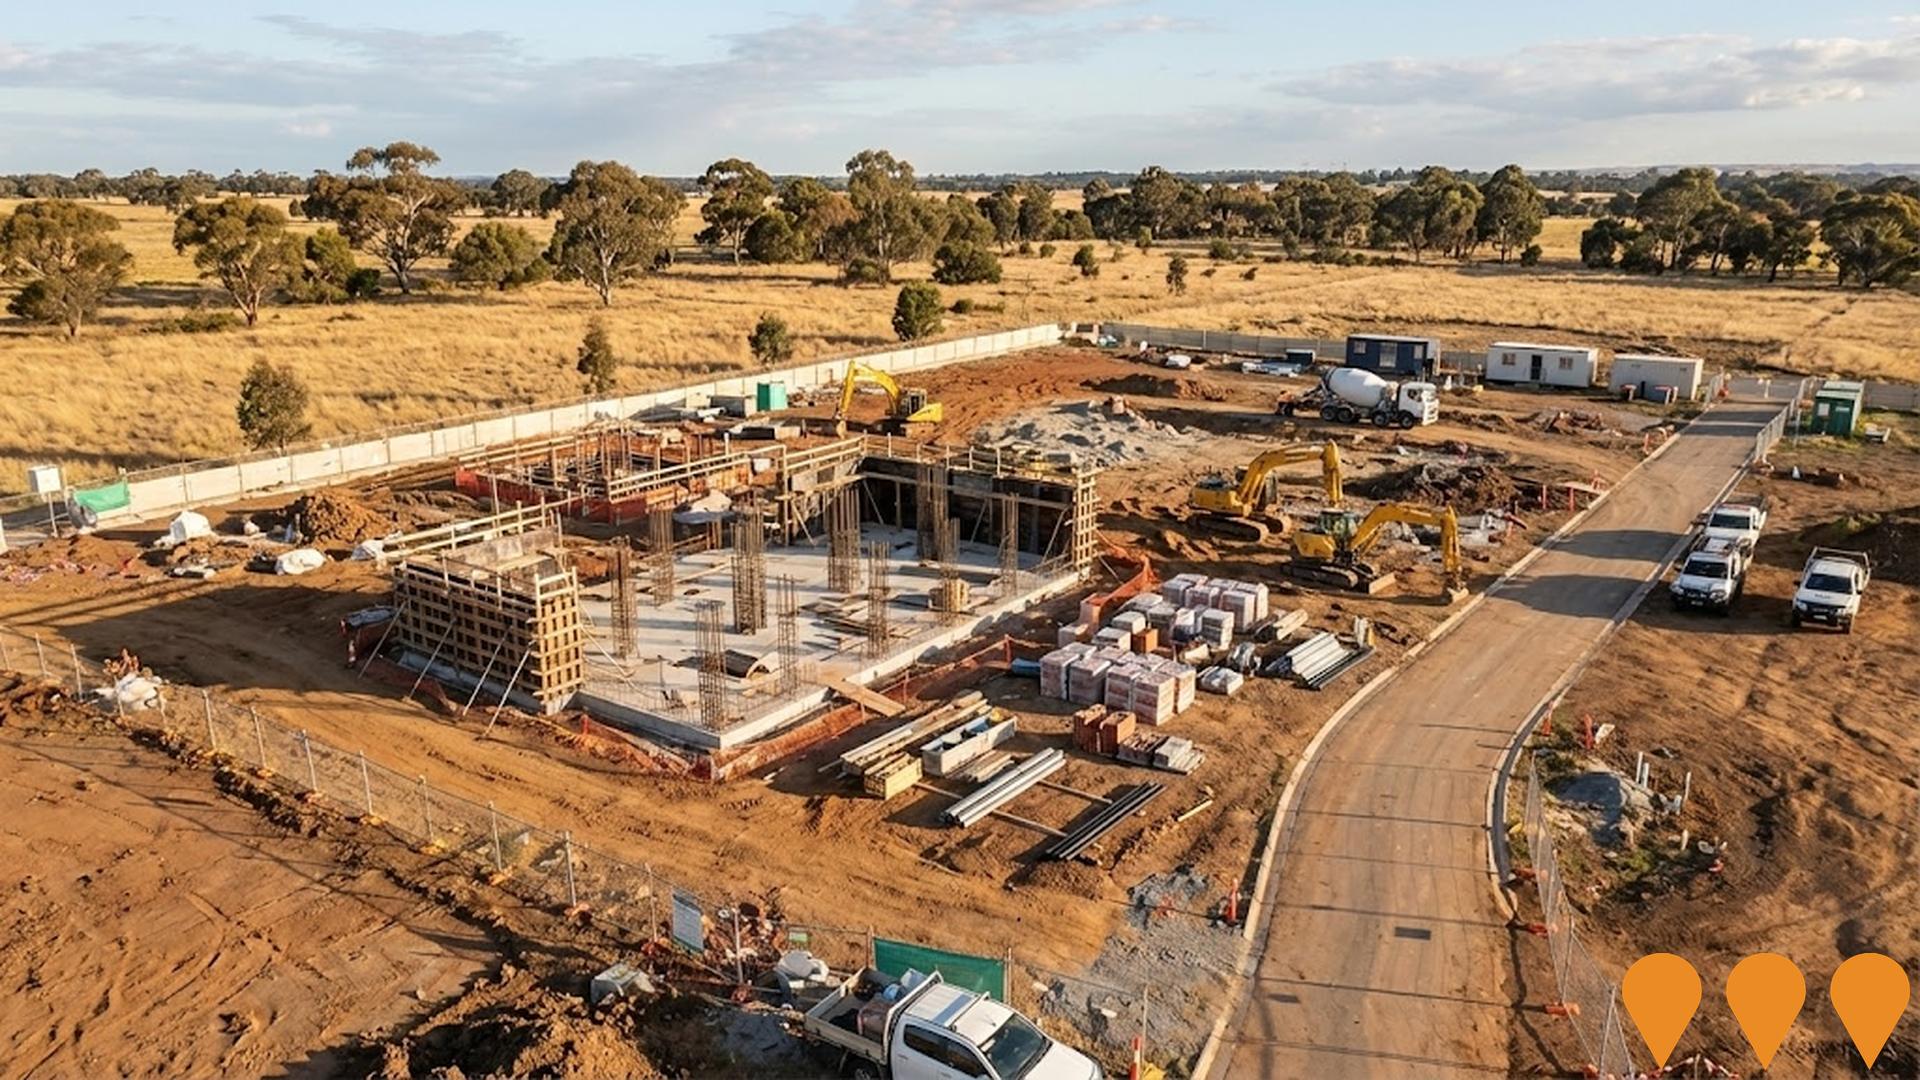
Kulap Primary School (formerly Ballarto Road Primary School, interim name)
New government primary school in Clyde delivering places for up to 525 students (Prep to Year 6) with administration and library building, two learning neighbourhoods, hard courts, sports field and a community hub. Project was known during planning as Ballarto Road Primary School (interim name) and has since been officially named Kulap Primary School. Opening planned for Term 1, 2026.
Employment
The labour market in Cranbourne South shows considerable strength compared to most other Australian regions
Cranbourne South has a skilled workforce with the construction sector being prominent. Its unemployment rate was 3.2% in the past year, with an estimated employment growth of 3.7%.
As of June 2025, 12,887 residents were employed, with an unemployment rate of 3.1%, which is 1.5% lower than Greater Melbourne's rate of 4.6%. Workforce participation in Cranbourne South was 72.3%, compared to Greater Melbourne's 64.1%. Key industries for employment among residents are construction, health care & social assistance, and retail trade. Construction has a notable concentration with employment levels at 1.7 times the regional average.
Professional & technical services have limited presence, with 5.0% employment compared to 10.1% regionally. The area appears to offer limited local employment opportunities based on Census data analysis. Between June 2024 and June 2025, employment levels increased by 3.7%, while the labour force grew by 4.4%, causing the unemployment rate to rise by 0.7 percentage points. In contrast, Greater Melbourne saw employment rise by 3.5%, labour force growth of 4.0%, and an increase in unemployment of 0.5 percentage points. Jobs and Skills Australia's national employment forecasts from May 2025 project national employment growth of 6.6% over five years and 13.7% over ten years, with varying rates between industry sectors. Applying these projections to Cranbourne South's employment mix suggests local growth of approximately 6.3% over five years and 13.2% over ten years.
Frequently Asked Questions - Employment
Income
Income analysis reveals strong economic positioning, with the area outperforming 60% of locations assessed nationally by AreaSearch
Cranbourne South's median income among taxpayers was $53,298 in financial year 2022, according to latest ATO data aggregated by AreaSearch. The average income stood at $59,854 during the same period. In comparison, Greater Melbourne's median and average incomes were $54,892 and $73,761 respectively. Based on Wage Price Index growth of 12.16% since financial year 2022, estimated current incomes as of September 2025 would be approximately $59,779 (median) and $67,132 (average). Census 2021 income data shows household, family and personal incomes in Cranbourne South rank highly nationally, between the 74th and 80th percentiles. Income analysis reveals that 44.7% of locals (12,334 people) fall into the $1,500 - 2,999 income category. This is consistent with broader trends across regional levels, where 32.8% of individuals are in the same category. High housing costs consume 17.2% of income in Cranbourne South, but strong earnings place disposable income at the 77th percentile nationally. The area's SEIFA income ranking places it in the 6th decile.
Frequently Asked Questions - Income
Housing
Cranbourne South is characterized by a predominantly suburban housing profile, with above-average rates of outright home ownership
Cranbourne South's dwelling structures, as per the latest Census, consisted of 95.4% houses and 4.6% other dwellings (semi-detached, apartments, 'other' dwellings). In contrast, Melbourne metro had 91.5% houses and 8.5% other dwellings. Home ownership in Cranbourne South was higher at 20.5%, with mortgaged dwellings at 63.4% and rented ones at 16.1%. The median monthly mortgage repayment in the area was $2,167, above Melbourne metro's average of $1,950. Median weekly rent in Cranbourne South was $408, compared to Melbourne metro's $386. Nationally, mortgage repayments were higher than the Australian average of $1,863, and rents exceeded the national figure of $375.
Frequently Asked Questions - Housing
Household Composition
Cranbourne South features high concentrations of family households, with a lower-than-average median household size
Family households account for 84.9% of all households, consisting of 47.7% couples with children, 27.2% couples without children, and 9.2% single parent families. Non-family households constitute the remaining 15.1%, with lone person households at 12.8% and group households comprising 2.2% of the total. The median household size is 3.0 people, which is smaller than the Greater Melbourne average of 3.2.
Frequently Asked Questions - Households
Local Schools & Education
The educational profile of Cranbourne South exceeds national averages, with above-average qualification levels and academic performance metrics
Cranbourne South faces educational challenges with university qualification rates at 22.5%, significantly lower than Greater Melbourne's average of 37.0%. This presents both a challenge and an opportunity for targeted educational initiatives. Bachelor degrees are the most common at 15.5%, followed by postgraduate qualifications (4.8%) and graduate diplomas (2.2%). Trade and technical skills are prominent, with 41.3% of residents aged 15+ holding vocational credentials – advanced diplomas (14.0%) and certificates (27.3%).
Educational participation is high at 29.7%, including primary education (11.6%), secondary education (6.2%), and tertiary education (3.7%). Nine schools operate in Cranbourne South, educating approximately 3,876 students with typical Australian school conditions (ICSEA: 1024). The educational mix includes seven primary, one secondary, and one K-12 school. Note: where schools show 'n/a' for enrolments, please refer to the parent campus.
Frequently Asked Questions - Education
Schools Detail
Nearby Services & Amenities
Transport
Transport servicing is low compared to other areas nationally based on assessment of service frequency, route connectivity and accessibility
Cranbourne South has 58 active public transport stops, all of which are bus stops. These stops are served by five different routes that together facilitate 1,619 weekly passenger trips. The accessibility of these services is rated as moderate; residents typically live within 500 meters of the nearest stop.
On average, there are 231 trips per day across all routes, which equates to about 27 weekly trips per individual stop.
Frequently Asked Questions - Transport
Transport Stops Detail
Health
Cranbourne South's residents are extremely healthy with younger cohorts in particular seeing very low prevalence of common health conditions
Analysis of health metrics indicates strong performance in Cranbourne South, with younger cohorts experiencing particularly low prevalence rates for common health conditions. Approximately 50% (~13,659 people) of the total population has private health cover, compared to the national average of 55.3%.
Asthma and mental health issues are the most prevalent medical conditions in the area, affecting 8.1% and 7.0% of residents respectively. Around 74.6% of residents declare themselves completely clear of medical ailments, compared to 76.4% across Greater Melbourne. The area has 8.9% (2,455 people) of residents aged 65 and over, with health outcomes among seniors presenting some challenges that require additional attention relative to the broader population.
Frequently Asked Questions - Health
Cultural Diversity
Cranbourne South was found to be more culturally diverse than the vast majority of local markets in Australia, upon assessment of a range of language and cultural background related metrics
Cranbourne South's population was found to have 27.9% born overseas and 24.2% speaking a language other than English at home, indicating higher cultural diversity compared to most local markets. Christianity was the predominant religion in Cranbourne South with 40.4%, while Other religions comprised 4.5%, slightly higher than Greater Melbourne's 6.5%. In terms of ancestry, Australian was the top group at 26.1%, significantly higher than the regional average of 17.7%.
English ancestry followed at 24.7%, also higher than the regional average of 17.5%. Other ancestry made up 12.4%, notably lower than the regional average of 25.5%. Notable differences were seen in Sri Lankan (1.1% vs 2.2%), Dutch (1.9% vs 1.3%), and Indian (5.5% vs 9.2%) ancestry representation compared to regional averages.
Frequently Asked Questions - Diversity
Age
Cranbourne South hosts a very young demographic, ranking in the bottom 10% of areas nationwide
Cranbourne South has a median age of 32 years, which is younger than Greater Melbourne's average of 37 years and significantly lower than the national average of 38 years. Compared to Greater Melbourne, Cranbourne South has a higher proportion of residents aged 5-14 (16.1%) but fewer residents aged 65-74 (5.2%). According to post-2021 Census data, the age group of 35 to 44 increased from 16.0% to 19.4%, while the 5 to 14 cohort rose from 14.4% to 16.1%. Conversely, the 25 to 34 cohort decreased from 20.1% to 17.7%. Demographic projections indicate significant changes in Cranbourne South's age profile by 2041. The 35 to 44 cohort is projected to grow by 102%, adding 5,492 residents to reach a total of 10,857.
