Chart Color Schemes
This analysis uses ABS Statistical Areas Level 2 (SA2) boundaries, which can materially differ from Suburbs and Localities (SAL) even when sharing similar names.
SA2 boundaries are defined by the Australian Bureau of Statistics and are designed to represent communities for statistical reporting (e.g., census and ERP).
Suburbs and Localities (SAL) represent commonly-used suburb/locality names (postal-style areas) and may use different geographic boundaries. For comprehensive analysis, consider reviewing both boundary types if available.
est. as @ -- *
ABS ERP | -- people | --
2021 Census | -- people
Sales Activity
Curious about local property values? Filter the chart to assess the volume and appreciation (including resales) trends and regional comparisons, or scroll to the map below view this information at an individual property level.
Find a Recent Sale
Sales Detail
Population
An assessment of population growth drivers in Cranbourne North - West reveals an overall ranking slightly below national averages considering recent, and medium term trends
As of November 2025, Cranbourne North - West's population is approximately 12,335. This represents a growth of 425 people since the 2021 Census, which reported a population of 11,910. The increase is inferred from ABS' estimated resident population of 12,329 in June 2024 and an additional 26 validated new addresses post-Census. This results in a population density ratio of 2,580 persons per square kilometer, placing Cranbourne North - West in the upper quartile nationally according to AreaSearch's assessments. Overseas migration contributed approximately 56.0% of overall population gains recently.
AreaSearch uses ABS/Geoscience Australia projections for each SA2 area, released in 2024 with a base year of 2022. For areas not covered by this data, AreaSearch employs VIC State Government's Regional/LGA projections from 2023, adjusted using weighted aggregation methods to SA2 levels. Future population projections indicate significant growth for Cranbourne North - West, with an expected increase of 3,317 persons by 2041. This reflects a total increase of 26.8% over the 17-year period, based on the latest annual ERP population numbers.
Frequently Asked Questions - Population
Development
The level of residential development activity in Cranbourne North - West is very low in comparison to the average area assessed nationally by AreaSearch
Cranbourne North - West has seen approximately 15 dwelling approvals annually. Over the past five financial years, from FY21 to FY25, 77 homes were approved, with an additional three approved in FY26 so far. Despite population decline, this development activity is adequate relative to other areas.
New properties are constructed at an average cost of $322,000. This year has seen $283,000 in commercial approvals, indicating minimal commercial development activity. Compared to Greater Melbourne, Cranbourne North - West has significantly lower building activity (92.0% below the regional average per person). This limited new construction often supports demand and pricing for existing dwellings. The area's development is predominantly townhouses or apartments (64.0%) compared to detached houses (36.0%), marking a shift from the current housing pattern of 96.0% houses. With around 3059 people per approval, Cranbourne North - West shows signs of maturity and established status. By 2041, it is forecasted to gain 3,311 residents.
If development rates continue at their current pace, housing supply may not keep up with population growth, potentially increasing competition among buyers and supporting stronger price growth.
Frequently Asked Questions - Development
Infrastructure
Cranbourne North - West has moderate levels of nearby infrastructure activity, ranking in the 43rdth percentile nationally
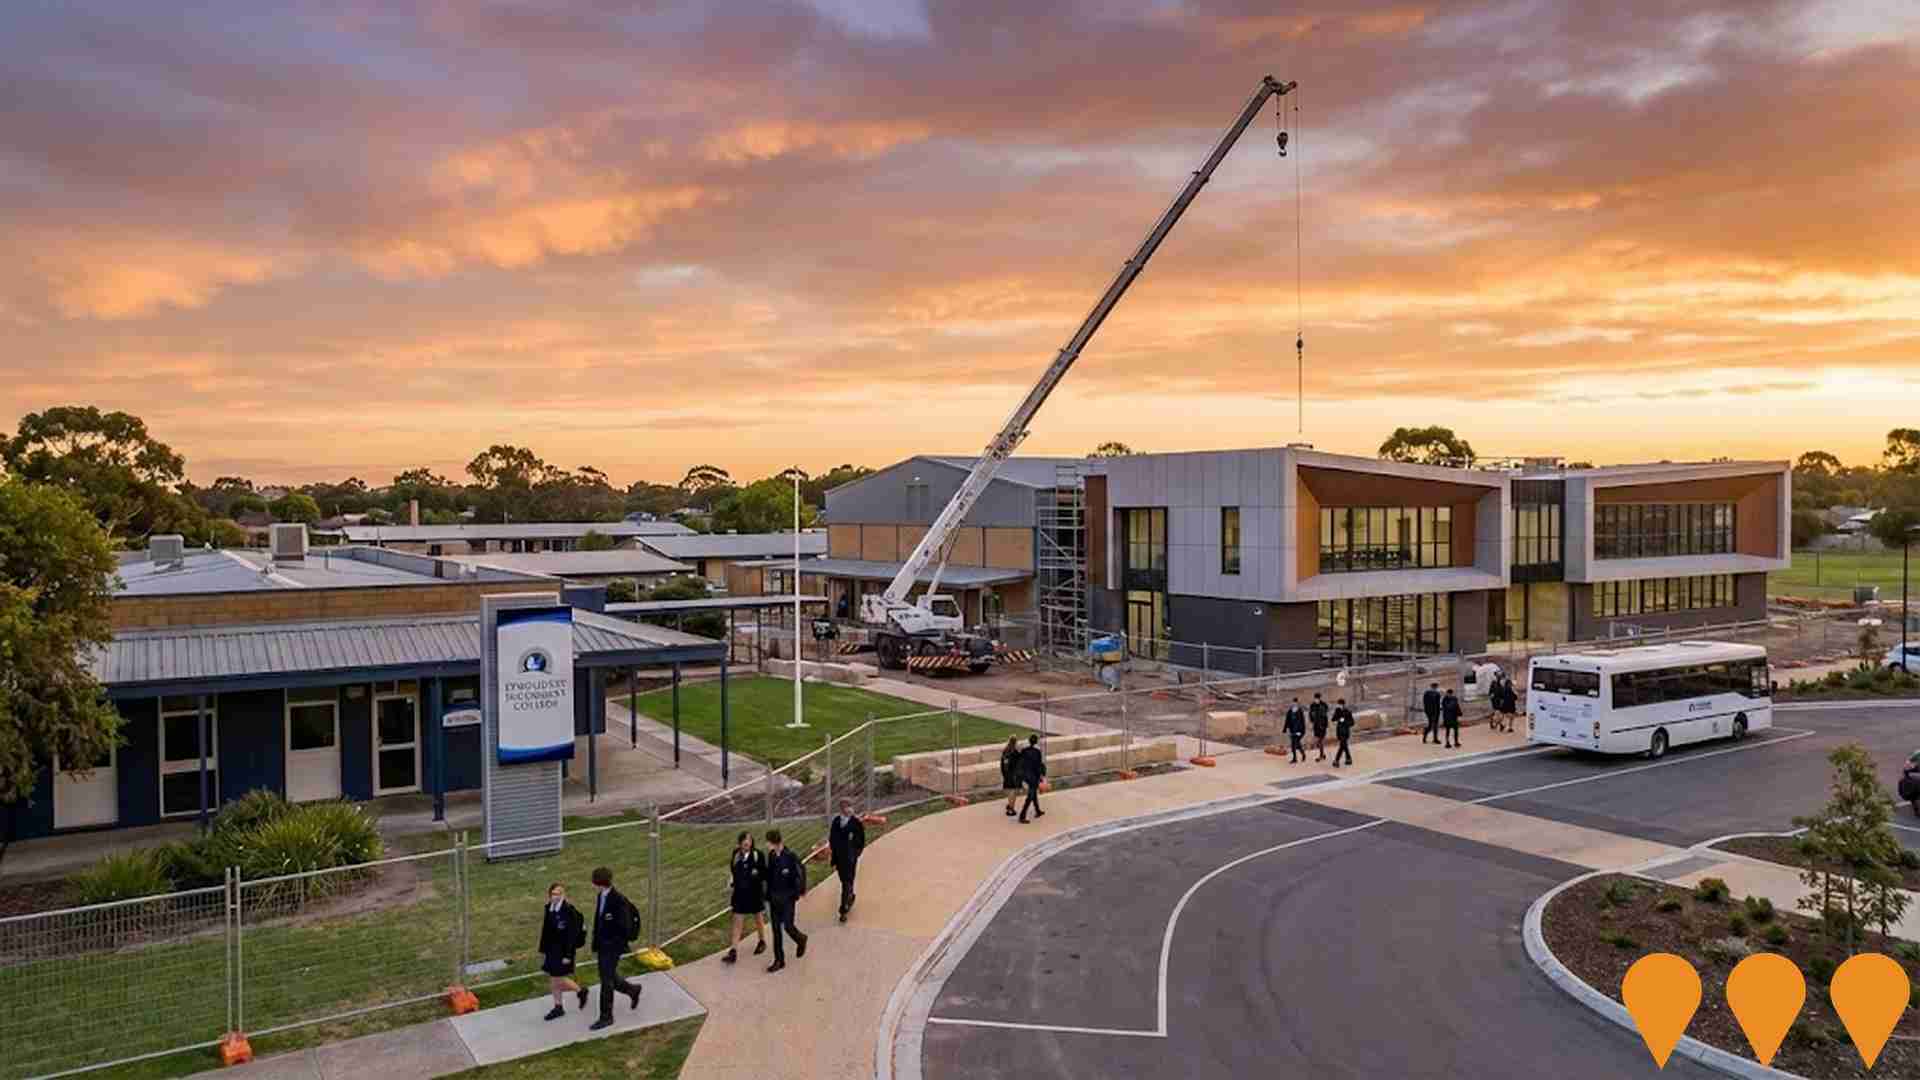
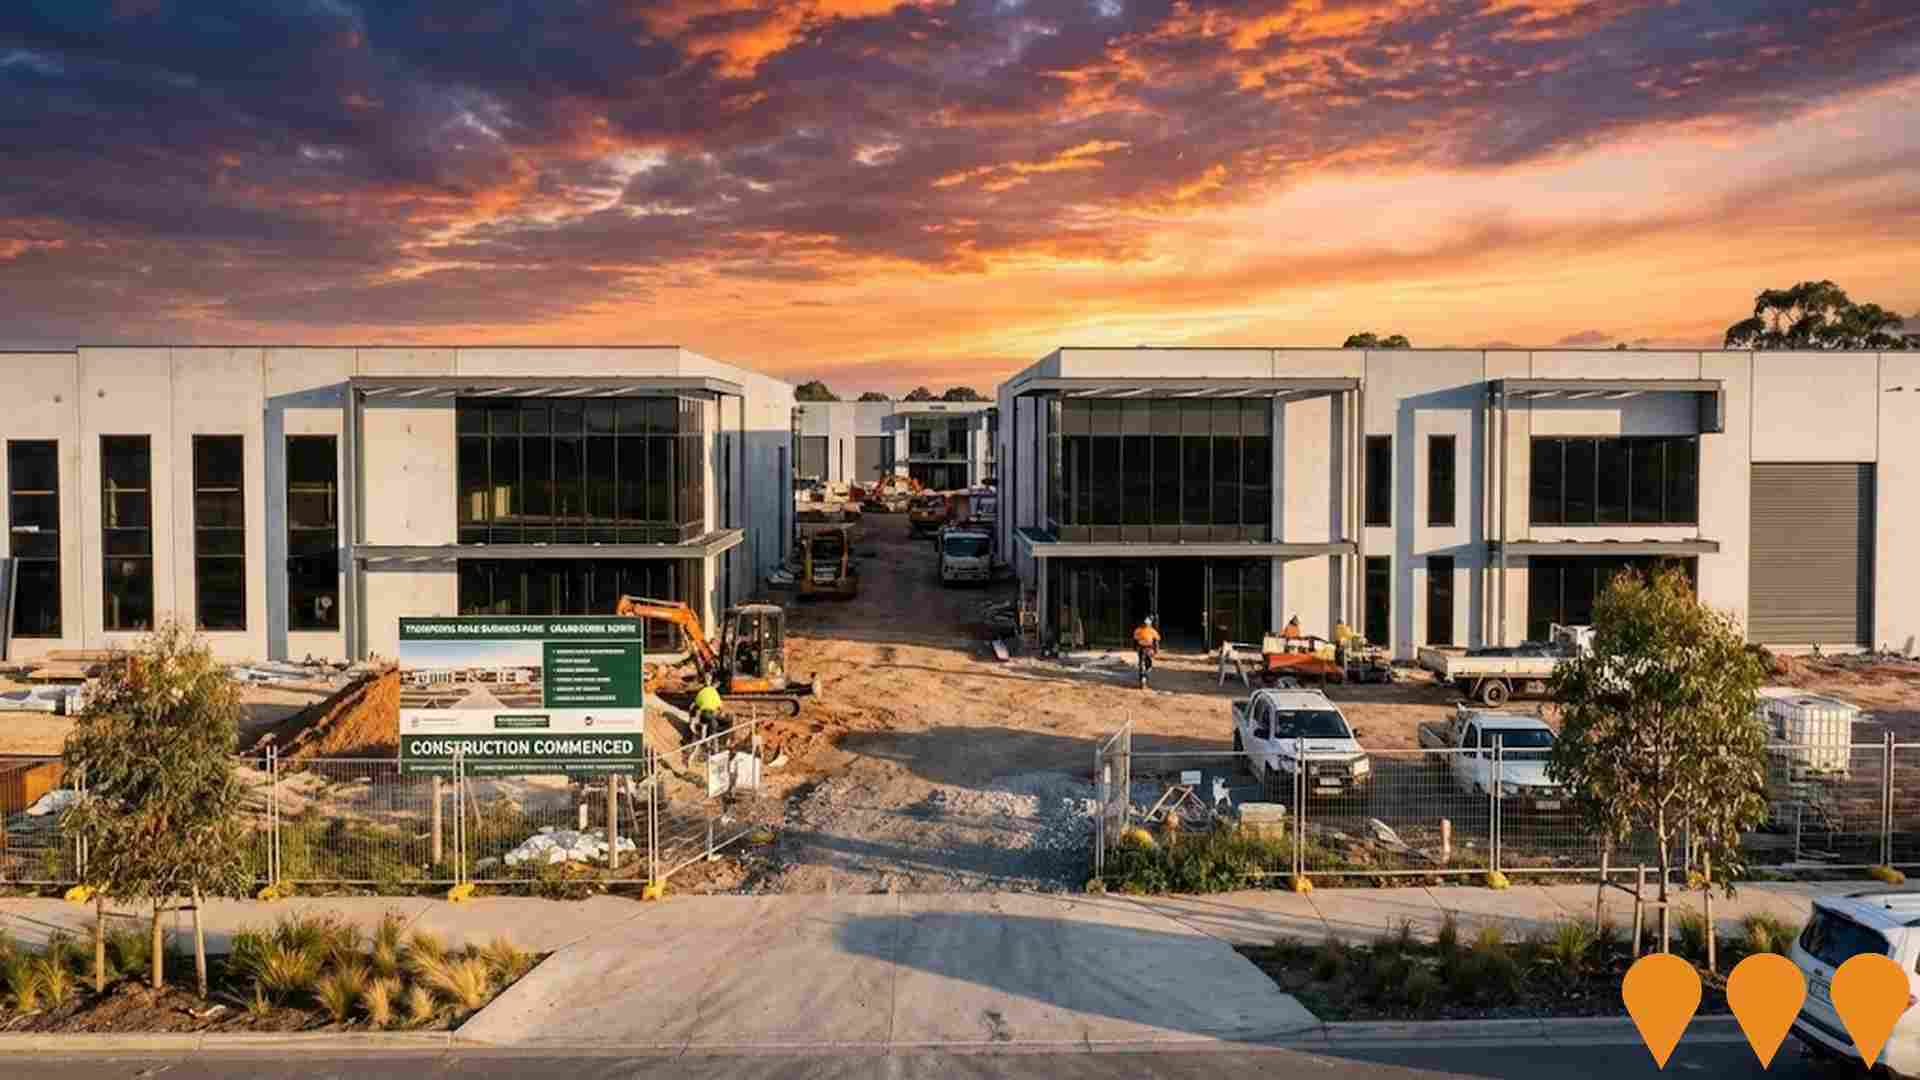
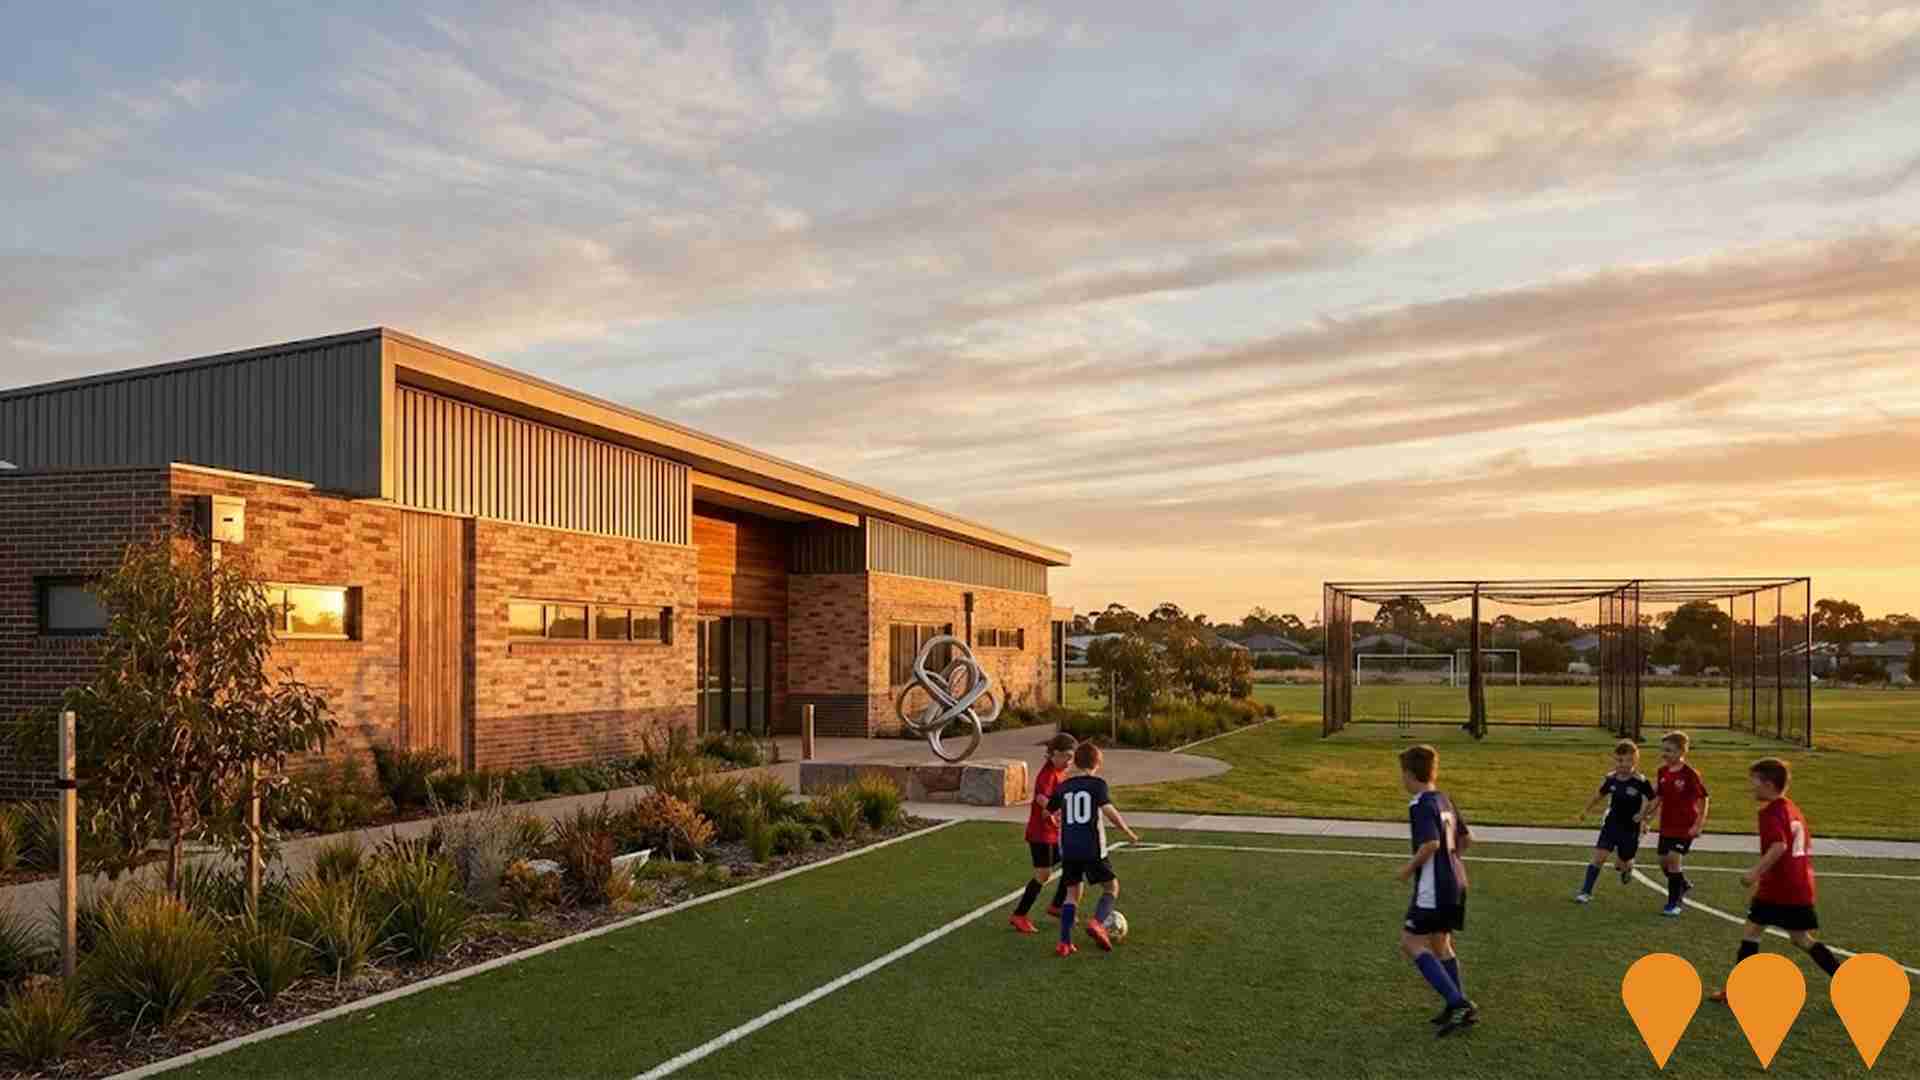
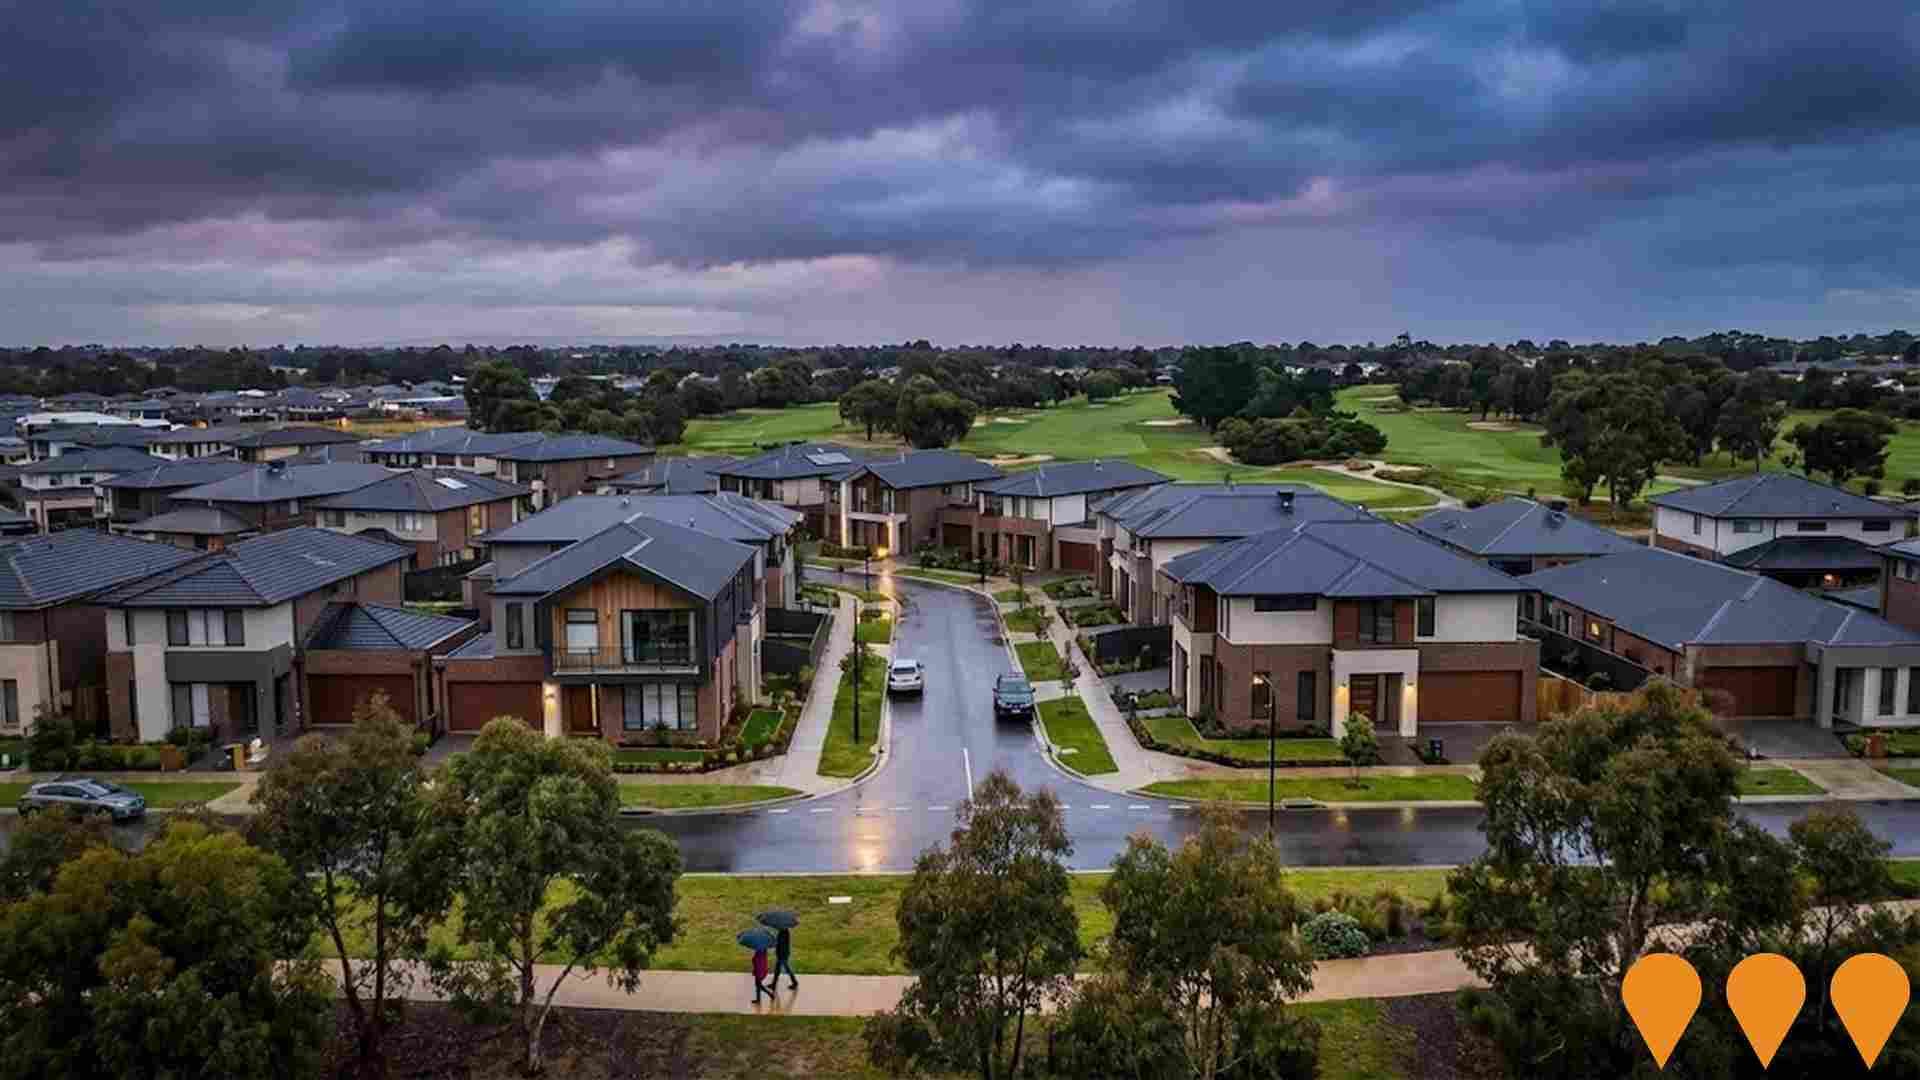
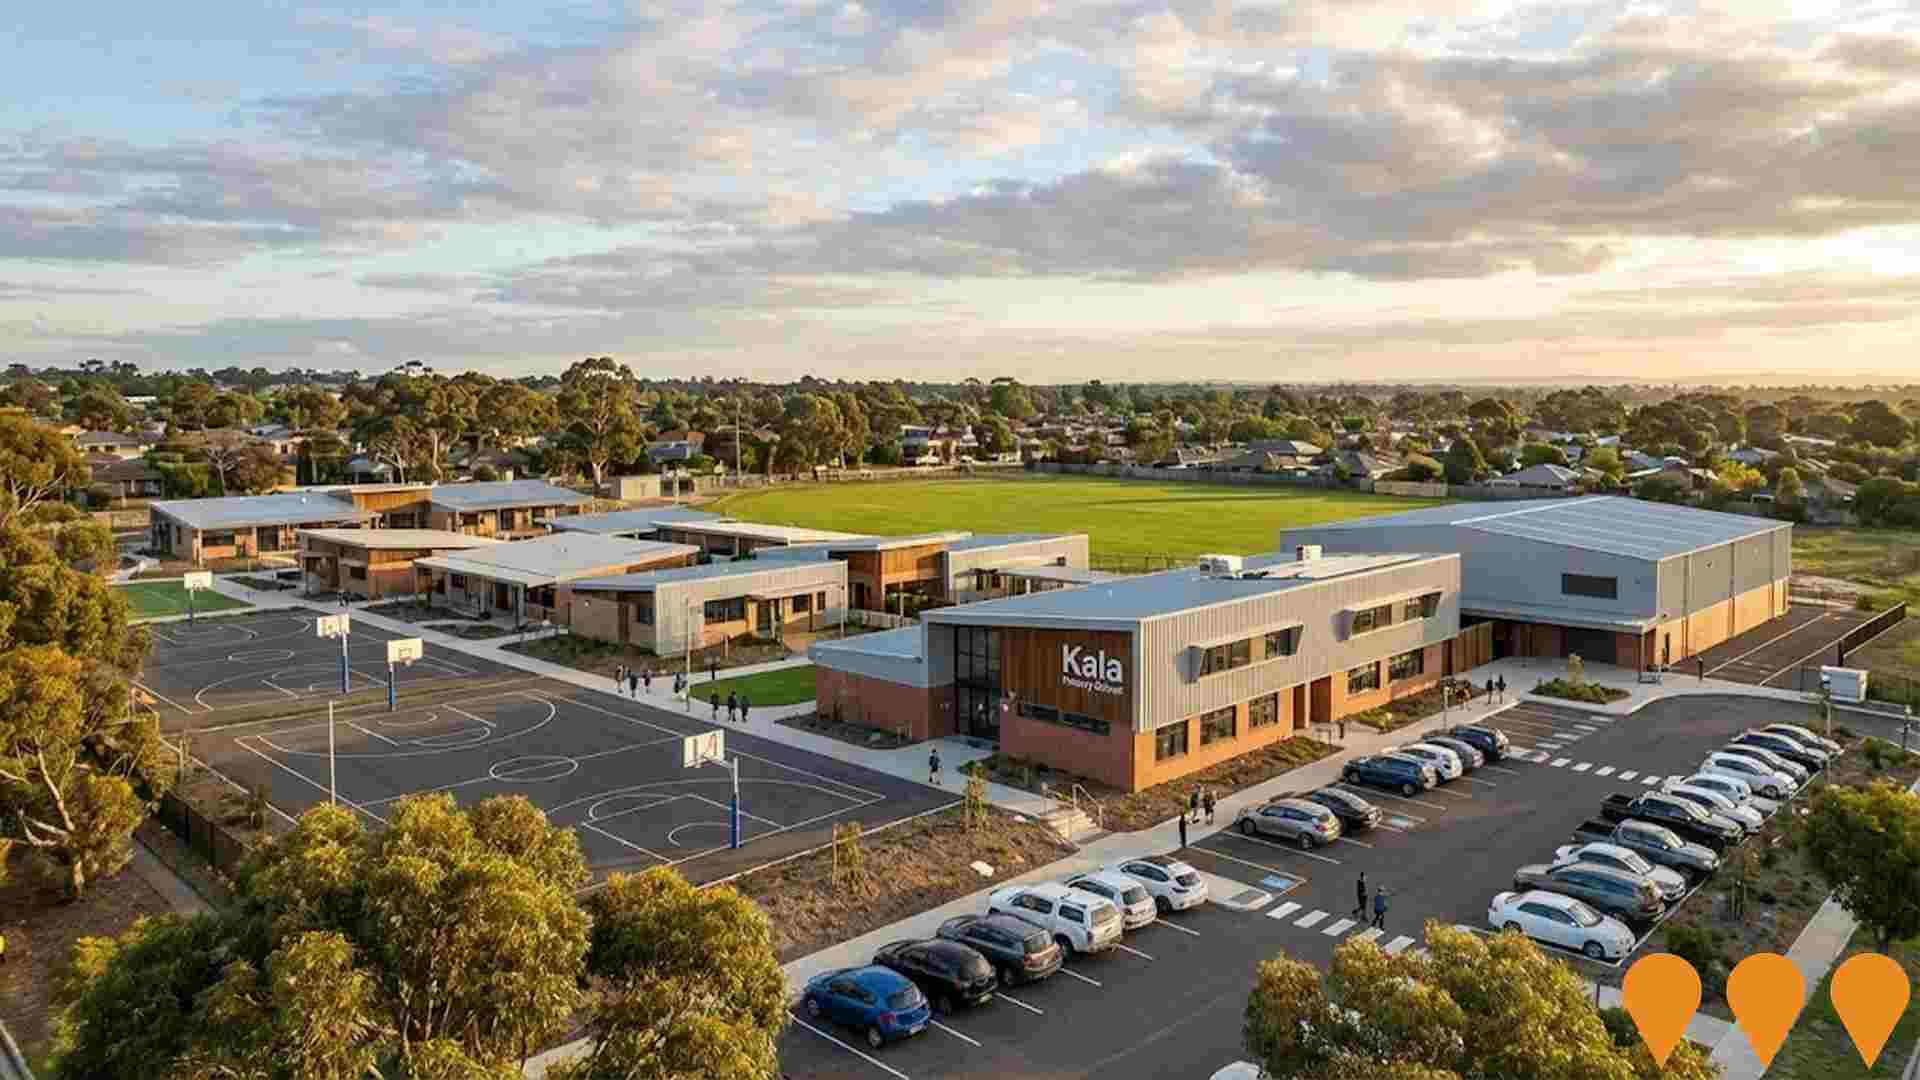
Changes to local infrastructure significantly impact an area's performance. AreaSearch has identified 12 projects likely to affect the area. Notable ones include Summerset Cranbourne North, Kala Primary School, Lyndhurst Secondary College Upgrade, and Lyndhurst Inland Port and Industrial Hub. The following list details those most relevant.
Professional plan users can use the search below to filter and access additional projects.
INFRASTRUCTURE SEARCH
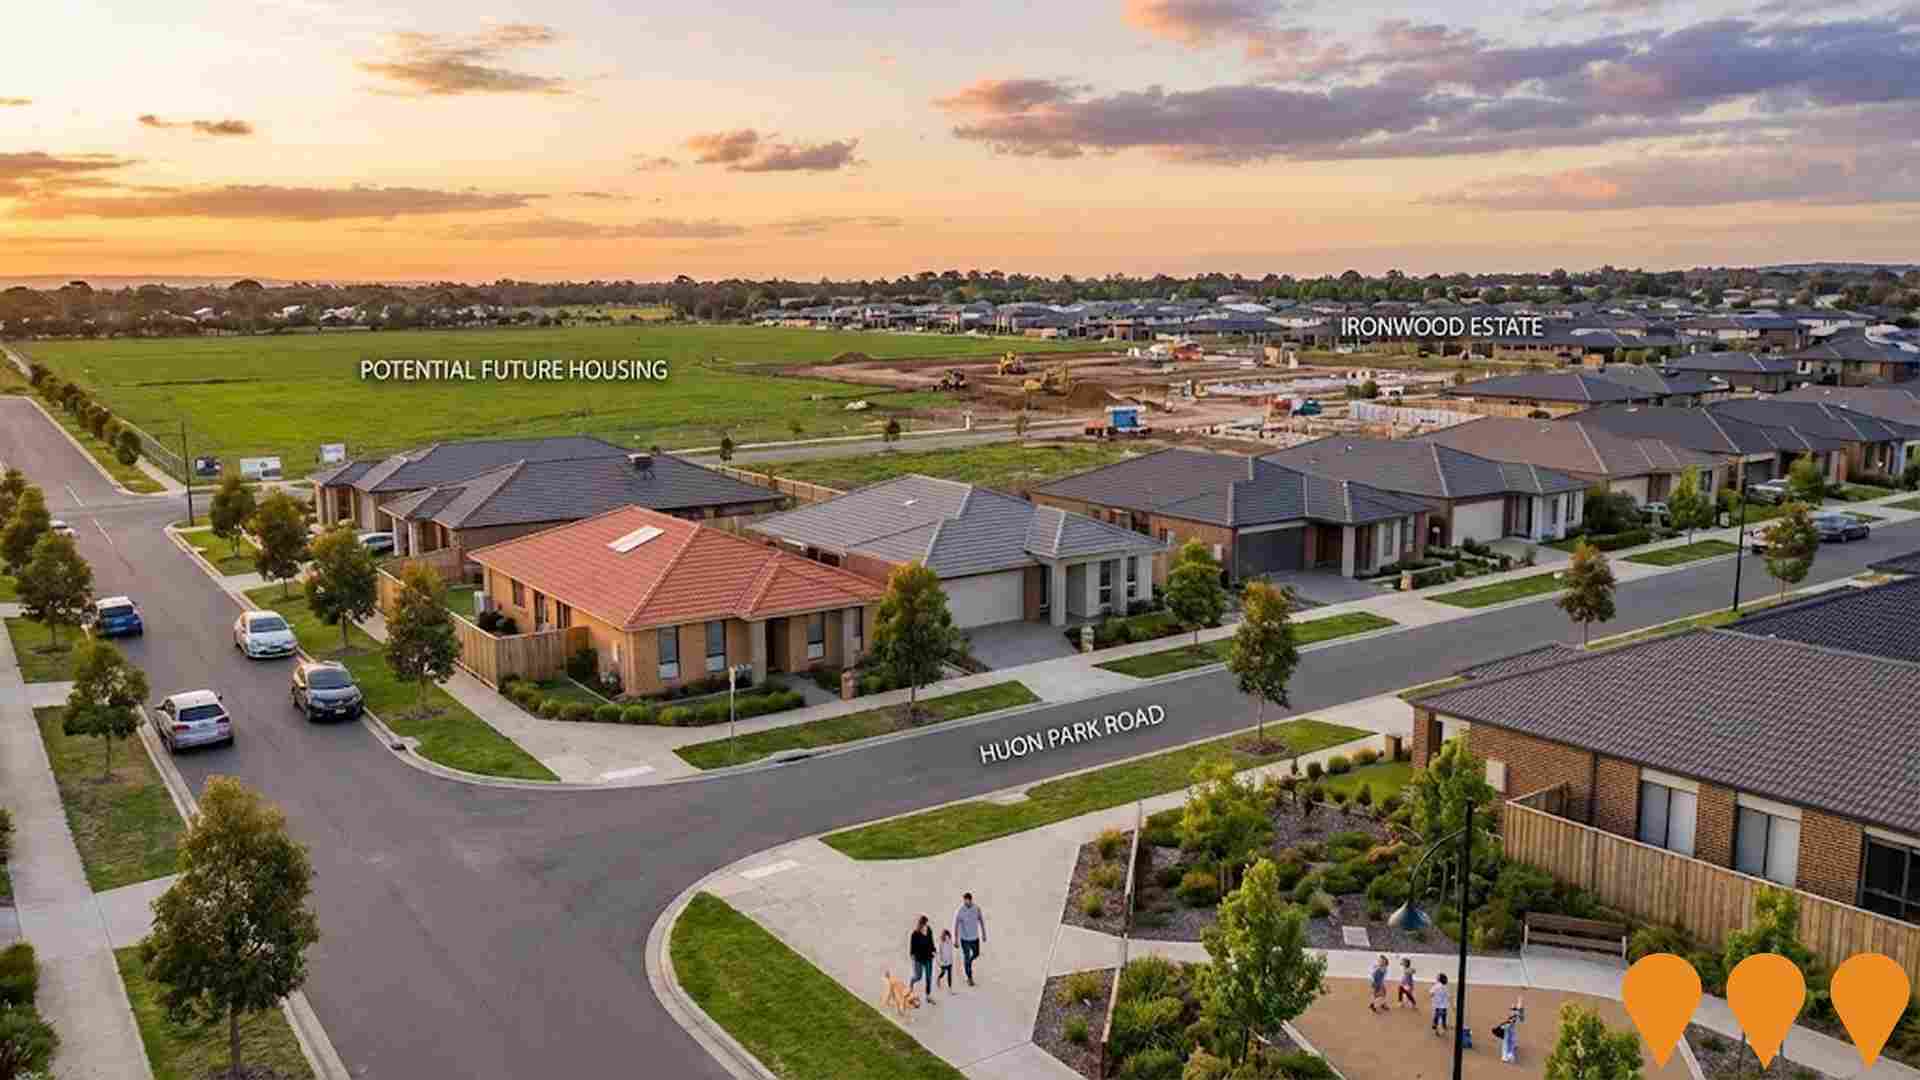
 Denotes AI-based impression for illustrative purposes only, not to be taken as definitive under any circumstances. Please follow links and conduct other investigations from the project's source for actual imagery. Developers and project owners wishing us to use original imagery please Contact Us and we will do so.
Frequently Asked Questions - Infrastructure
Casey Central Town Centre Development
A comprehensive 60-hectare town centre development approved to create a vibrant mixed-use precinct. Anchored by the existing Casey Central Shopping Centre, the project is set to deliver approximately 1,850 new homes, 4,100 jobs, and significant community infrastructure including a new town square, integrated community facilities, and upgraded transport links.

Summerset Cranbourne North
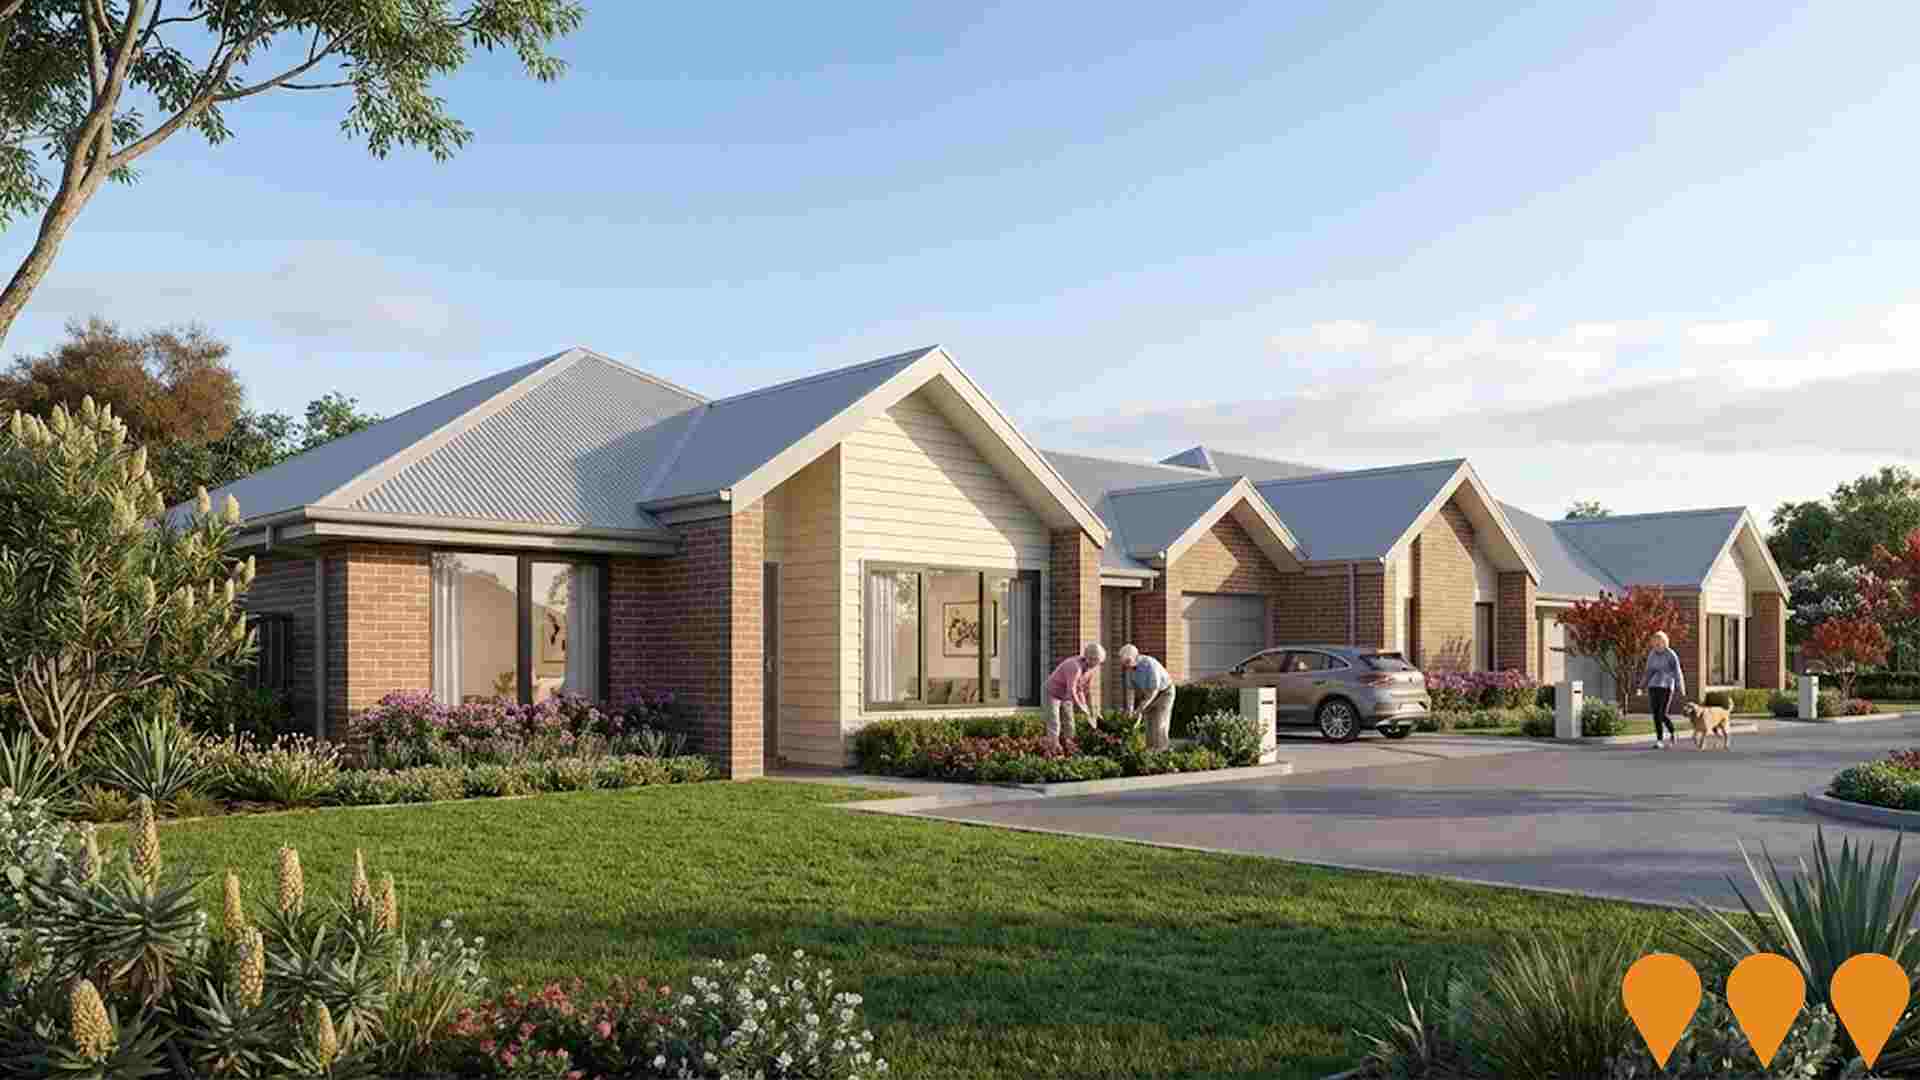
Summerset's first retirement village in Australia, delivering a full continuum of care including independent living villas, serviced apartments and an on-site care centre. Resort-style facilities include an indoor pool, spa, cafe, cinema, bowling green, gym, hair salon and community centre. As of November 2025, over 100 homes are occupied, stage releases continue and the community centre remains on track for completion in early 2026.
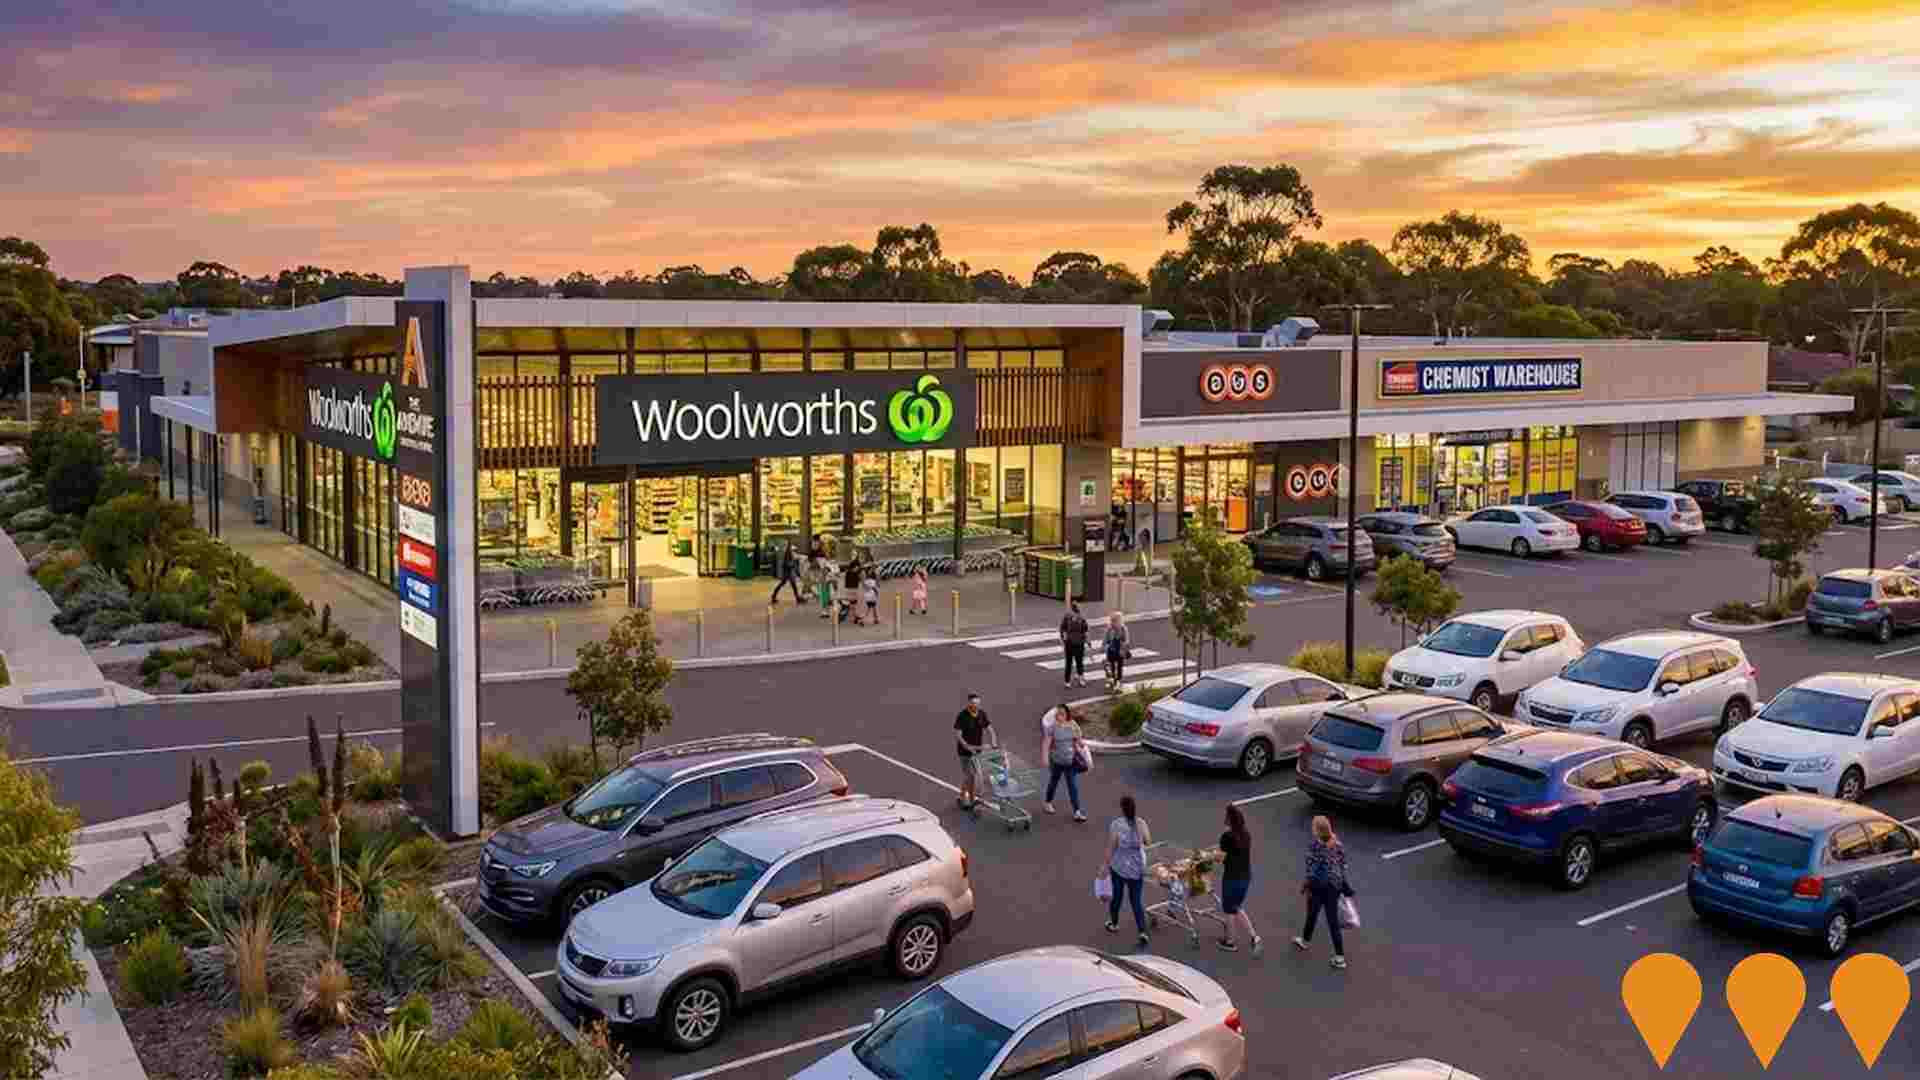
The Avenue Village Shopping Centre
A neighbourhood shopping centre featuring Woolworths supermarket, BWS, Chemist Warehouse, and specialty retail stores. The 4,454 sqm centre serves The Avenue at Casey residential estate and surrounding areas, providing essential retail and commercial services to the growing Cranbourne North community.
Lyndhurst Inland Port and Industrial Hub
Major industrial development including freight terminal, warehouse and distribution facilities. Strategic inland port location with development plans approved by Greater Dandenong Council, connecting to major transport networks for efficient freight movement to regional areas and ports. The project, also known as Dandenong South Intermodal Terminal, features a fully automated 24-hour operation with rail connections to the Port of Melbourne, aimed at reducing truck congestion and emissions.

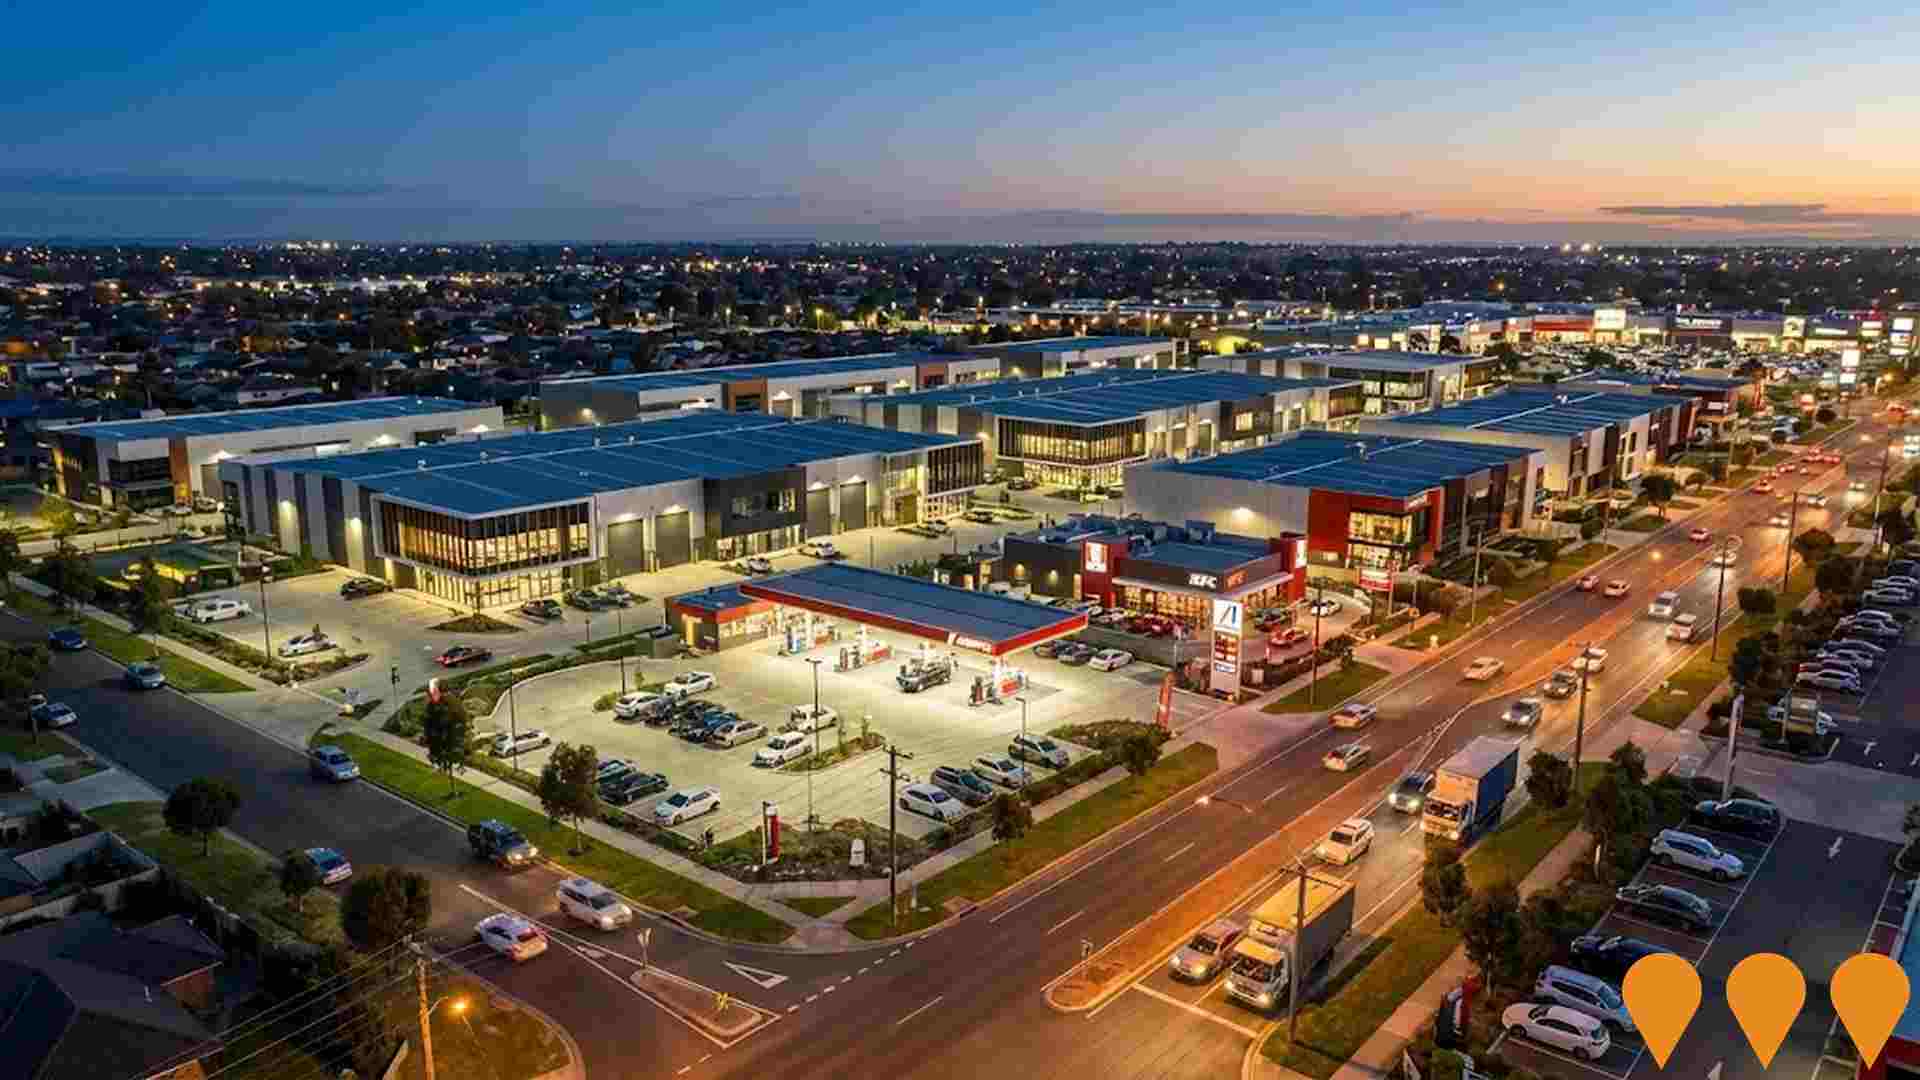
WT Business Park
Premium commercial land development featuring 13 individually titled freehold lots ranging from 1042 to 2088 square metres across 2 hectares. Located in Melbourne's fastest growing southeast corridor, the project is the second stage of Oreana's retail and business park development. The site includes established retail amenities with national brands including Aspire Early Learning, Ampol Service Station, and upcoming KFC, Nandos, and Zambrero outlets.
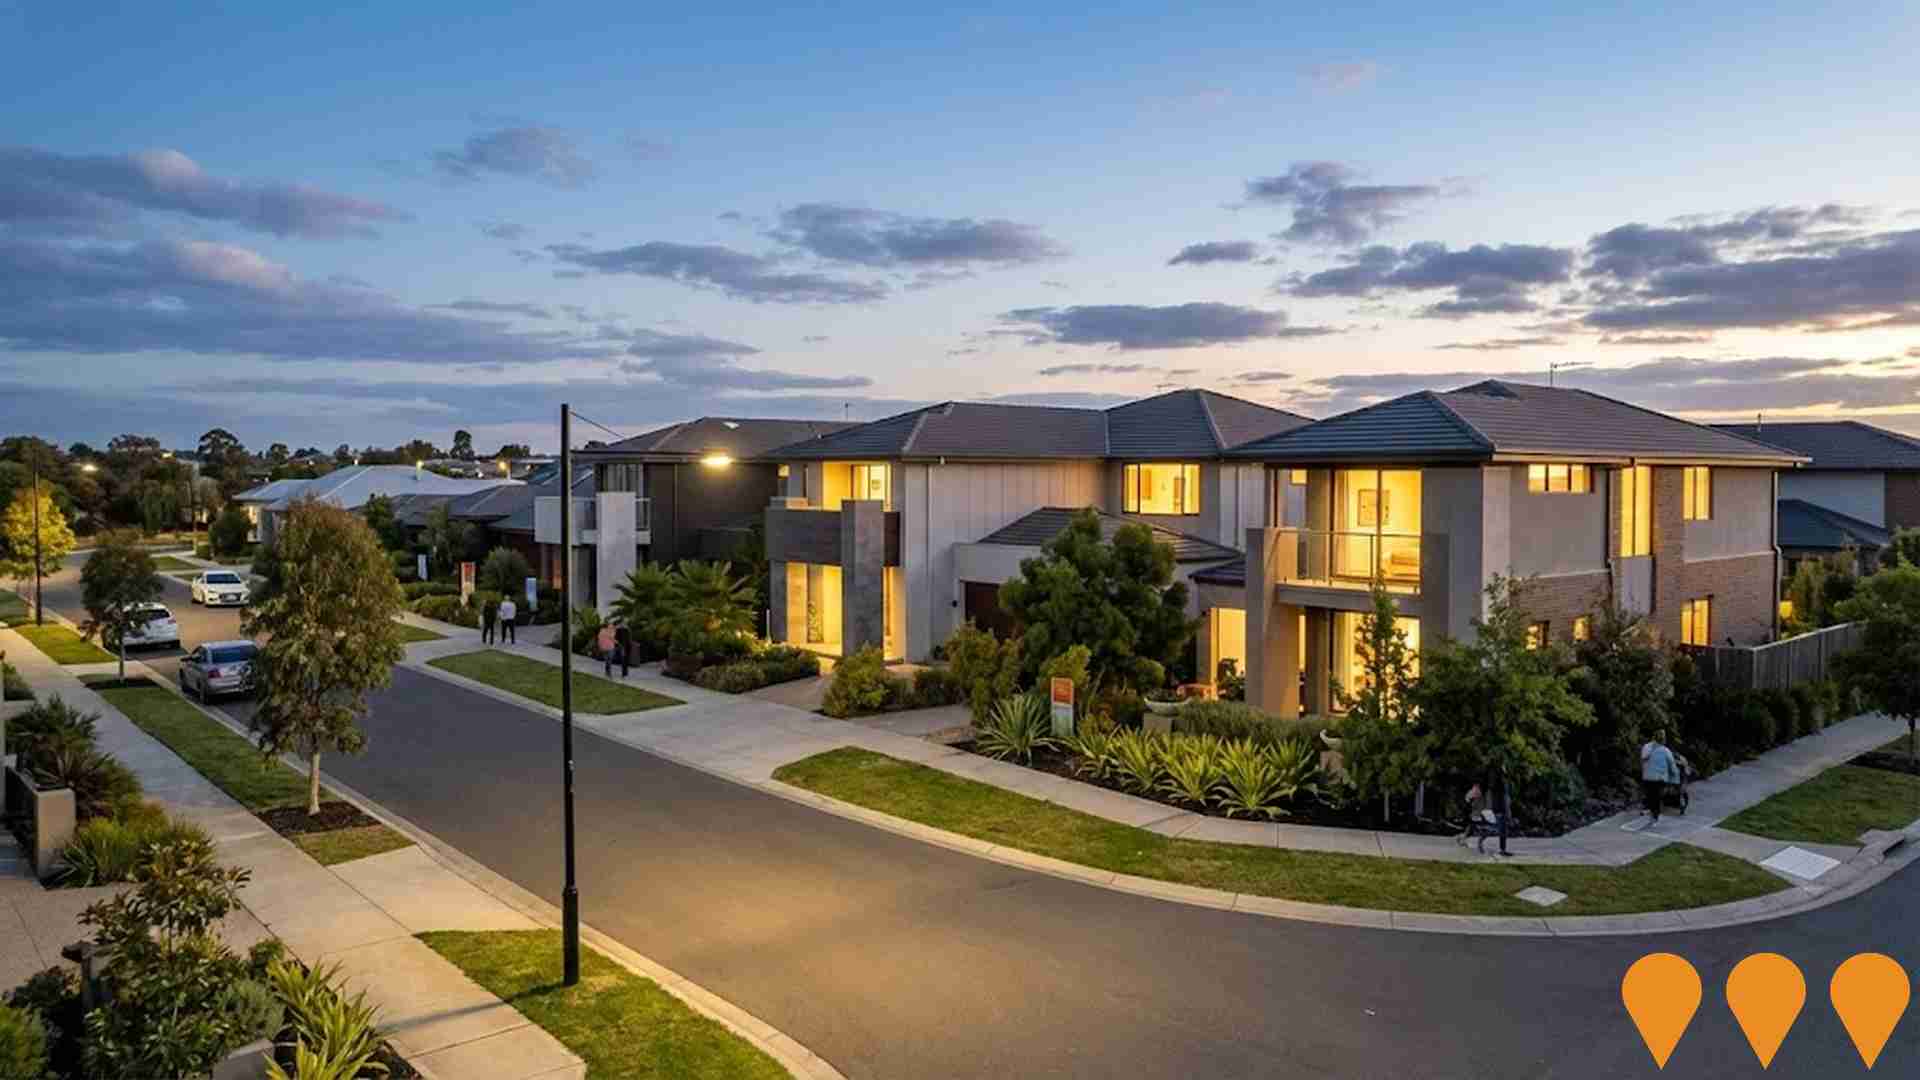
The Avenue at Casey
A fully master planned community featuring residential lots, parklands, reserves, and over 12 hectares of wetlands, now home to over 800 households. Includes The Avenue Village Shopping Centre anchored by Woolworths, completed in 2013, providing comprehensive retail services to residents.
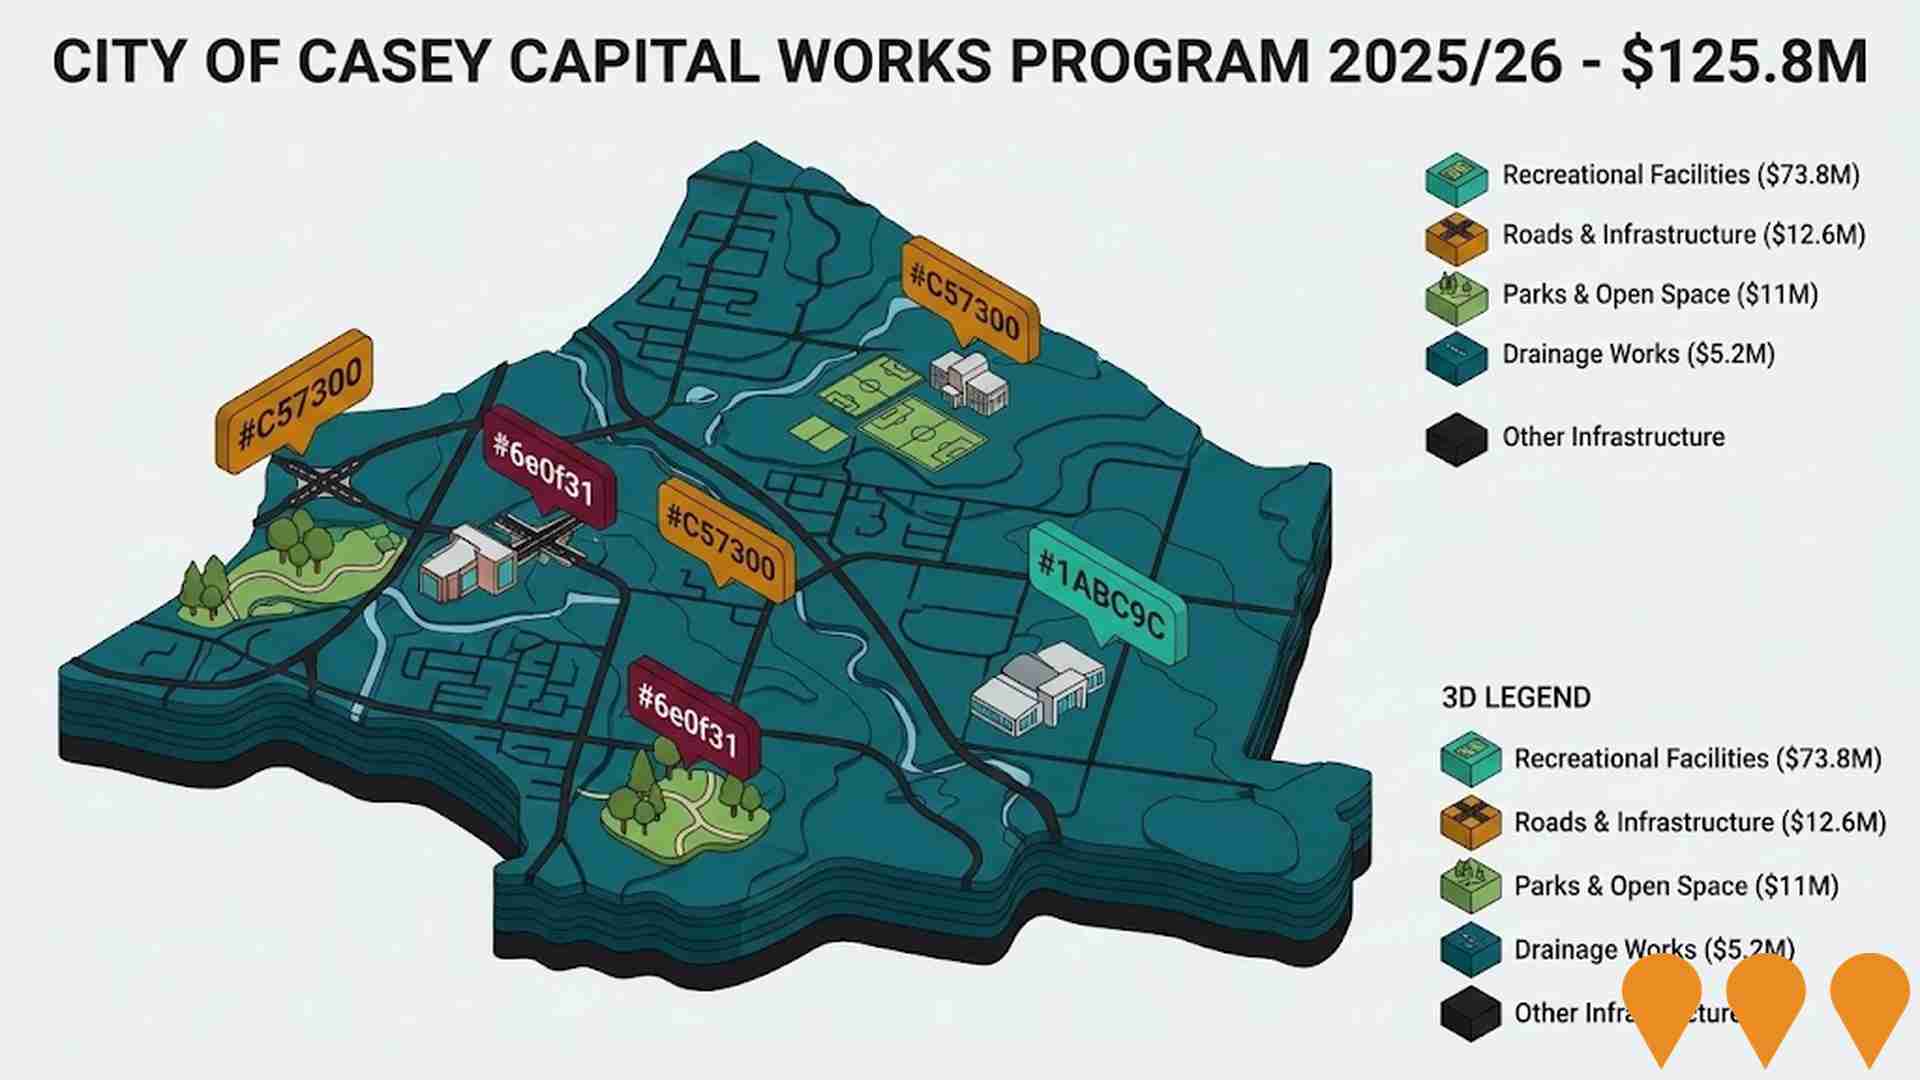
City of Casey Capital Works Program 2025/26
$125.8 million capital works program including $73.8 million for recreational, leisure, and community facilities, $12.6 million for roads, $11 million for parks, open space, and streetscapes, $5.2 million for drainage works, and various other infrastructure improvements across the City of Casey.
Kala Primary School
New primary school accommodating up to 525 students from Prep to Year 6, including 2 learning neighbourhoods, administration and library building, outdoor hard courts, community hub with indoor multi-use court, canteen and arts/music spaces, sports field, and car park. School name derives from Bunurong Boonwurrung language word meaning dog. Principal Tracy Knight has been appointed.
Employment
Cranbourne North - West shows employment indicators that trail behind approximately 70% of regions assessed across Australia
Cranbourne North - West has a skilled workforce with notable representation in the construction sector. The unemployment rate was 7.6% as of September 2025, with an estimated employment growth of 3.2% over the past year.
As of that date, 6,354 residents were employed, while the unemployment rate was 3.0% above Greater Melbourne's rate of 4.7%. Workforce participation in Cranbourne North - West was on par with Greater Melbourne's 64.1%. Leading employment industries among residents included health care & social assistance, manufacturing, and construction. The area showed strong specialization in manufacturing, with an employment share of 1.9 times the regional level.
However, professional & technical services employed only 5.0% of local workers, below Greater Melbourne's 10.1%. Over the 12 months to September 2025, employment increased by 3.2%, while labour force increased by 4.6%, resulting in an unemployment rise of 1.3 percentage points. In contrast, Greater Melbourne experienced employment growth of 3.0% and labour force growth of 3.3%, with a 0.3 percentage point rise. State-level data to 25-Nov showed that Victoria's employment grew by 1.13% year-on-year (adding 41,950 jobs), with the state unemployment rate at 4.7%, compared to the national rate of 4.3%. National employment forecasts from May-25 estimated growth of 6.6% over five years and 13.7% over ten years. Applying these projections to Cranbourne North - West's employment mix suggested local employment should increase by 5.9% over five years and 12.6% over ten years, though these are simple extrapolations for illustrative purposes only.
Frequently Asked Questions - Employment
Income
Income levels sit below national averages according to AreaSearch assessment
As per AreaSearch's latest postcode level ATO data released for financial year 2022, Cranbourne North - West SA2's median income among taxpayers is $47,003. The average income in the area is $53,286. This is below the national average. In comparison, Greater Melbourne has a median income of $54,892 and an average income of $73,761. Based on Wage Price Index growth of 12.16% since financial year 2022, current estimates for Cranbourne North - West's median income would be approximately $52,719 as of September 2025. The average income estimate for the same period is $59,766. Census data shows that household, family and personal incomes in Cranbourne North - West rank modestly, between the 33rd and 46th percentiles. Income distribution reveals that 40.2% of locals (4,958 people) fall into the $1,500 - 2,999 income category. This pattern is similar to the region where 32.8% of residents occupy this income range. Housing affordability pressures are severe in Cranbourne North - West, with only 82.4% of income remaining after housing costs, ranking at the 45th percentile.
Frequently Asked Questions - Income
Housing
Cranbourne North - West is characterized by a predominantly suburban housing profile, with above-average rates of outright home ownership
The dwelling structure in Cranbourne North - West, as per the latest Census, consisted of 95.5% houses and 4.6% other dwellings (semi-detached, apartments, 'other' dwellings), compared to Melbourne metro's 91.5% houses and 8.5% other dwellings. Home ownership in Cranbourne North - West stood at 22.3%, with mortgaged dwellings at 53.1% and rented ones at 24.6%. The median monthly mortgage repayment was $1,709, lower than Melbourne metro's average of $1,950 and the national average of $1,863. The median weekly rent figure in Cranbourne North - West was $355, compared to Melbourne metro's $386 and the national figure of $375.
Frequently Asked Questions - Housing
Household Composition
Cranbourne North - West features high concentrations of family households, with a lower-than-average median household size
Family households constitute 79.6% of all households, including 42.6% couples with children, 20.7% couples without children, and 14.8% single parent families. Non-family households account for the remaining 20.4%, with lone person households at 17.8% and group households comprising 2.7%. The median household size is 3.0 people, smaller than the Greater Melbourne average of 3.2.
Frequently Asked Questions - Households
Local Schools & Education
Cranbourne North - West shows below-average educational performance compared to national benchmarks, though pockets of achievement exist
The area's university qualification rate is 17.8%, significantly lower than Greater Melbourne's average of 37.0%. Bachelor degrees are the most common at 12.2%, followed by postgraduate qualifications (4.1%) and graduate diplomas (1.5%). Vocational credentials are prevalent, with 36.7% of residents aged 15+ holding them, including advanced diplomas (11.7%) and certificates (25.0%). Educational participation is high, with 32.9% currently enrolled in formal education: 11.7% in primary, 8.8% in secondary, and 4.2% in tertiary education.
Educational participation is notably high, with 32.9% of residents currently enrolled in formal education. This includes 11.7% in primary education, 8.8% in secondary education, and 4.2% pursuing tertiary education.
Frequently Asked Questions - Education
Schools Detail
Nearby Services & Amenities
Transport
Transport servicing is moderate compared to other areas nationally based on assessment of service frequency, route connectivity and accessibility
Cranbourne North-West has 50 active public transport stops, serving a mix of train and bus routes. These stops are covered by 7 individual routes, facilitating 2,485 weekly passenger trips in total. Transport accessibility is rated as good, with residents on average located 210 meters from the nearest stop.
The service frequency averages 355 trips per day across all routes, translating to approximately 49 weekly trips per stop.
Frequently Asked Questions - Transport
Transport Stops Detail
Health
Cranbourne North - West's residents are healthier than average in comparison to broader Australia with prevalence of common health conditions quite low among the general population though higher than the nation's average across older, at risk cohorts
Cranbourne North-West's health data shows a relatively positive picture with low prevalence rates for common conditions among its general population, although these are higher than national averages for older, at-risk groups. Private health cover stands at approximately 47% of the total population (around 5,760 people), which is lower than Greater Melbourne's 49.1% and the national average of 55.3%. Mental health issues and asthma are the most prevalent conditions, affecting 8.5% and 8.3% of residents respectively, while 71.2% report no medical ailments compared to 76.4% in Greater Melbourne.
The area has a higher proportion of seniors aged 65 and over at 11.1% (1,371 people), compared to Greater Melbourne's 9.6%. Health outcomes among seniors require more attention than the broader population.
Frequently Asked Questions - Health
Cultural Diversity
Cranbourne North - West is among the most culturally diverse areas in the country based on AreaSearch assessment of a range of language and cultural background related metrics
Cranbourne North-West has notable cultural diversity, with 38.3% of its population born overseas and 37.1% speaking a language other than English at home. Christianity is the predominant religion in Cranbourne North-West, comprising 38.3% of the population. Islam is overrepresented compared to Greater Melbourne, with 11.9% of Cranbourne North-West's population identifying as Muslim, compared to 11.1% regionally.
The top three ancestry groups are Other (22.2%), Australian (20.7%), and English (20.5%). Some ethnic groups show notable divergences: Sri Lankan is overrepresented at 1.3%, Samoan at 1.1%, and Indian at 5.5%.
Frequently Asked Questions - Diversity
Age
Cranbourne North - West hosts a young demographic, positioning it in the bottom quartile nationwide
At age 34 years, Cranbourne North-West has a median age lower than Greater Melbourne's average of 37 years and Australia's national median of 38 years. Compared to Greater Melbourne, Cranbourne North-West has a higher proportion of residents aged 5-14 years (14.3%) but fewer residents aged 25-34 years (14.2%). Between the 2021 Census and the present, the population aged 15-24 years has increased from 13.4% to 14.7%, while the 65-74 age group has risen from 6.0% to 7.0%. Conversely, the 5-14 age group has decreased from 15.5% to 14.3%, and the 25-34 age group has fallen from 15.4% to 14.2%. By 2041, population forecasts suggest significant demographic changes in Cranbourne North-West. The 65-74 age cohort is projected to grow by 72%, adding 625 residents to reach a total of 1,491. In contrast, the 0-4 age cohort shows minimal growth of just 4% (30 people).
