Chart Color Schemes
This analysis uses ABS Statistical Areas Level 2 (SA2) boundaries, which can materially differ from Suburbs and Localities (SAL) even when sharing similar names.
SA2 boundaries are defined by the Australian Bureau of Statistics and are designed to represent communities for statistical reporting (e.g., census and ERP).
Suburbs and Localities (SAL) represent commonly-used suburb/locality names (postal-style areas) and may use different geographic boundaries. For comprehensive analysis, consider reviewing both boundary types if available.
est. as @ -- *
ABS ERP | -- people | --
2021 Census | -- people
Sales Activity
Curious about local property values? Filter the chart to assess the volume and appreciation (including resales) trends and regional comparisons, or scroll to the map below view this information at an individual property level.
Find a Recent Sale
Sales Detail
Population
Berwick - South West lies within the top 10% of areas nationally in terms of population growth performance according to AreaSearch analysis of short and medium-term trends
Based on AreaSearch's analysis, Berwick - South West's population is around 13,001 as of Nov 2025. This reflects an increase of 1,747 people since the 2021 Census, which reported a population of 11,254 people. The change is inferred from the estimated resident population of 12,791 from the ABS as of June 2024 and an additional 446 validated new addresses since the Census date. This level of population equates to a density ratio of 2,615 persons per square kilometer. Berwick - South West's 15.5% growth since the 2021 census exceeded the SA3 area (6.1%), along with the national average, marking it as a growth leader in the region. Population growth for the area was primarily driven by overseas migration that contributed approximately 38.5% of overall population gains during recent periods.
AreaSearch is adopting ABS/Geoscience Australia projections for each SA2 area, released in 2024 with 2022 as the base year. For areas not covered by this data, AreaSearch utilises VIC State Government's Regional/LGA projections released in 2023 with adjustments made employing a method of weighted aggregation of population growth from LGA to SA2 levels. Growth rates by age group are applied across all areas for years 2032 to 2041. Looking at population projections moving forward, a significant population increase is forecast, with the area expected to grow by 5,224 persons to 2041 based on the latest annual ERP population numbers, reflecting an increase of 38.6% in total over the 17 years.
Frequently Asked Questions - Population
Development
The level of residential development activity in Berwick - South West was found to be higher than 90% of real estate markets across the country
Berwick - South West has seen approximately 202 new homes approved annually over the past five financial years, totalling 1,013 homes. As of FY-26, 56 approvals have been recorded. On average, 1.9 new residents arrive per year for each new home built between FY-21 and FY-25, indicating a balanced supply and demand market with stable conditions. New properties are constructed at an average expected cost of $309,000, aligning with regional trends.
In the current financial year, $1.2 million in commercial development approvals have been recorded, suggesting minimal commercial development activity. Compared to Greater Melbourne, Berwick - South West records 194.0% more construction activity per person, offering greater choice for buyers despite a recent slowdown in building activity. This high level of developer interest is significantly above the national average. New development consists of 77.0% standalone homes and 23.0% townhouses or apartments, maintaining the area's suburban character while introducing more diverse housing options to meet changing lifestyles. The location currently has approximately 82 people per dwelling approval, indicating an expanding market. Future projections estimate Berwick - South West will add 5,014 residents by 2041 based on AreaSearch's latest quarterly estimate.
Given current development patterns, new housing supply is expected to meet demand, providing good conditions for buyers and potentially facilitating further population growth beyond current projections.
Frequently Asked Questions - Development
Infrastructure
Berwick - South West has emerging levels of nearby infrastructure activity, ranking in the 28thth percentile nationally
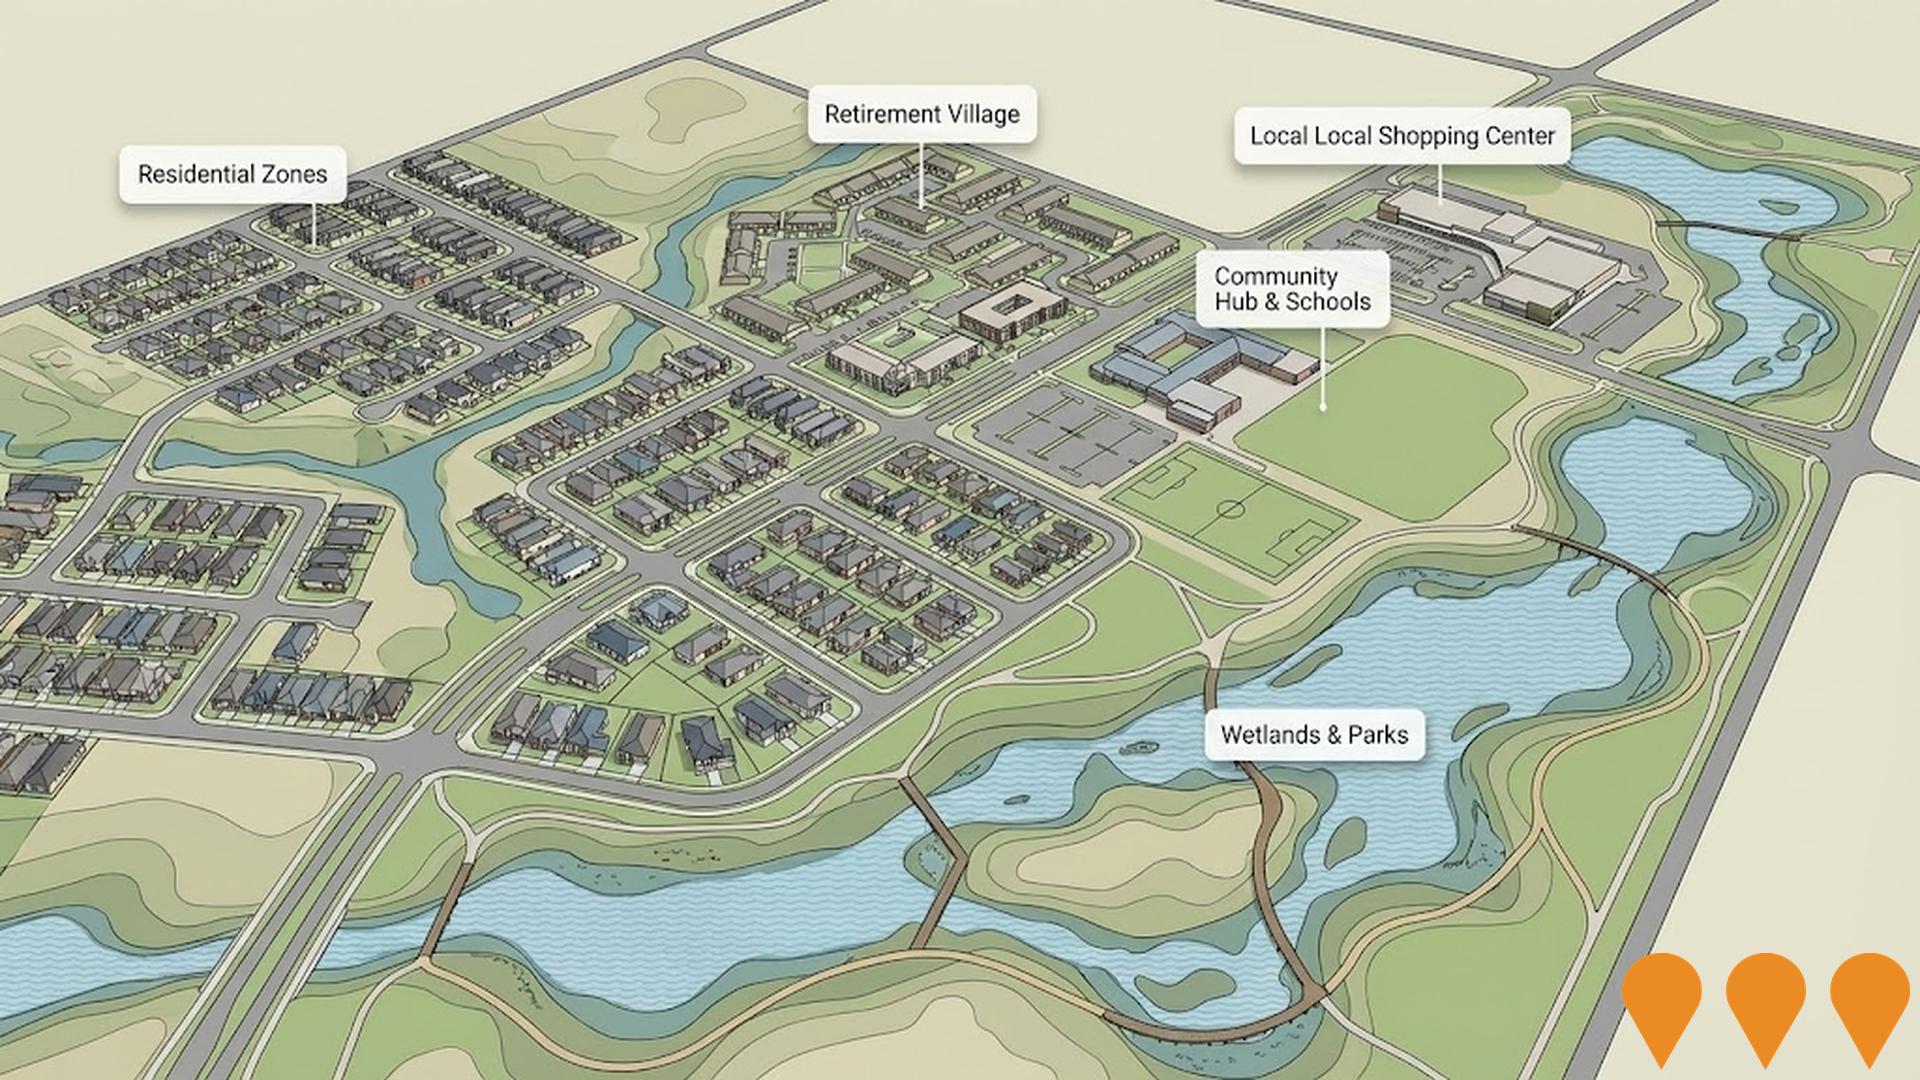
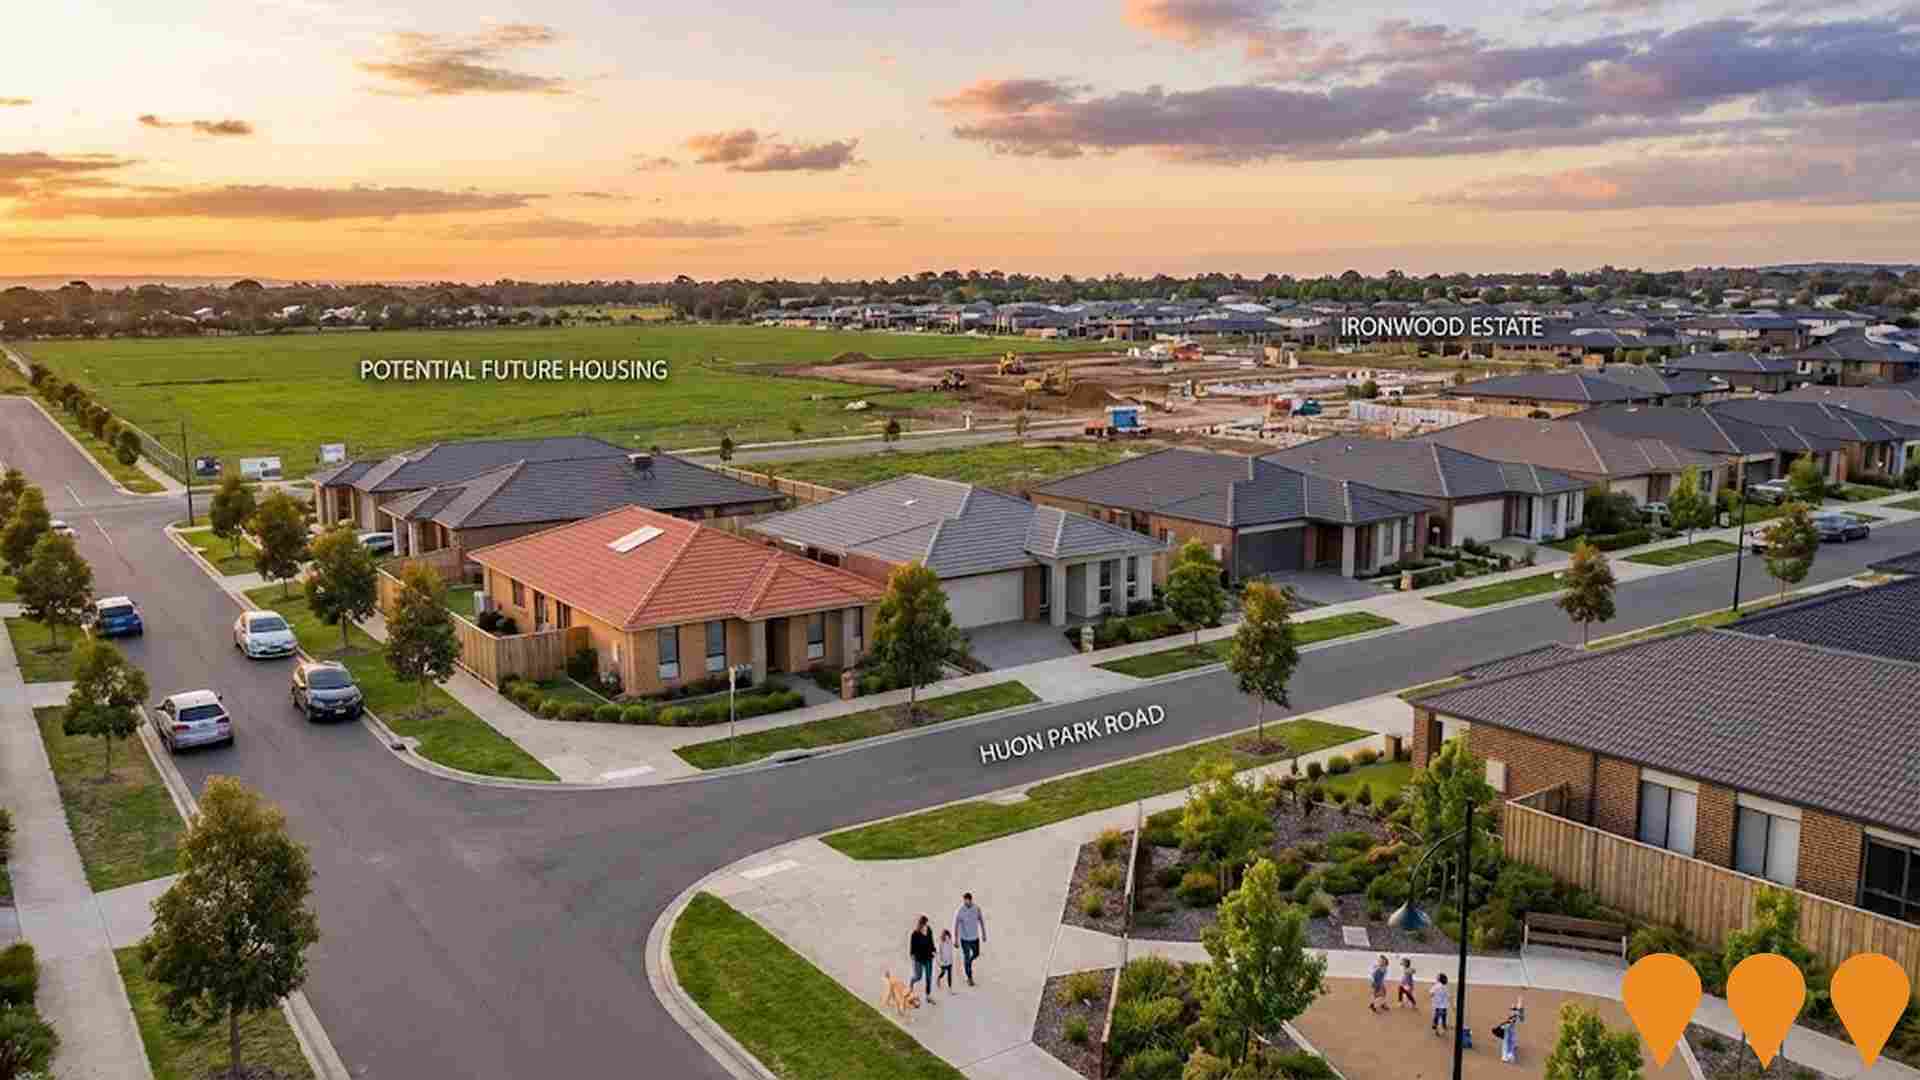
Changes to local infrastructure significantly influence an area's performance. AreaSearch has identified three major projects expected to impact this region. Key projects include Berwick South Development Plan, Hunt Club Village Shopping Centre Expansion, Stockland Minta Residential Estate, and Hunt Club Estate. The following list details those likely to be most relevant.
Professional plan users can use the search below to filter and access additional projects.
INFRASTRUCTURE SEARCH
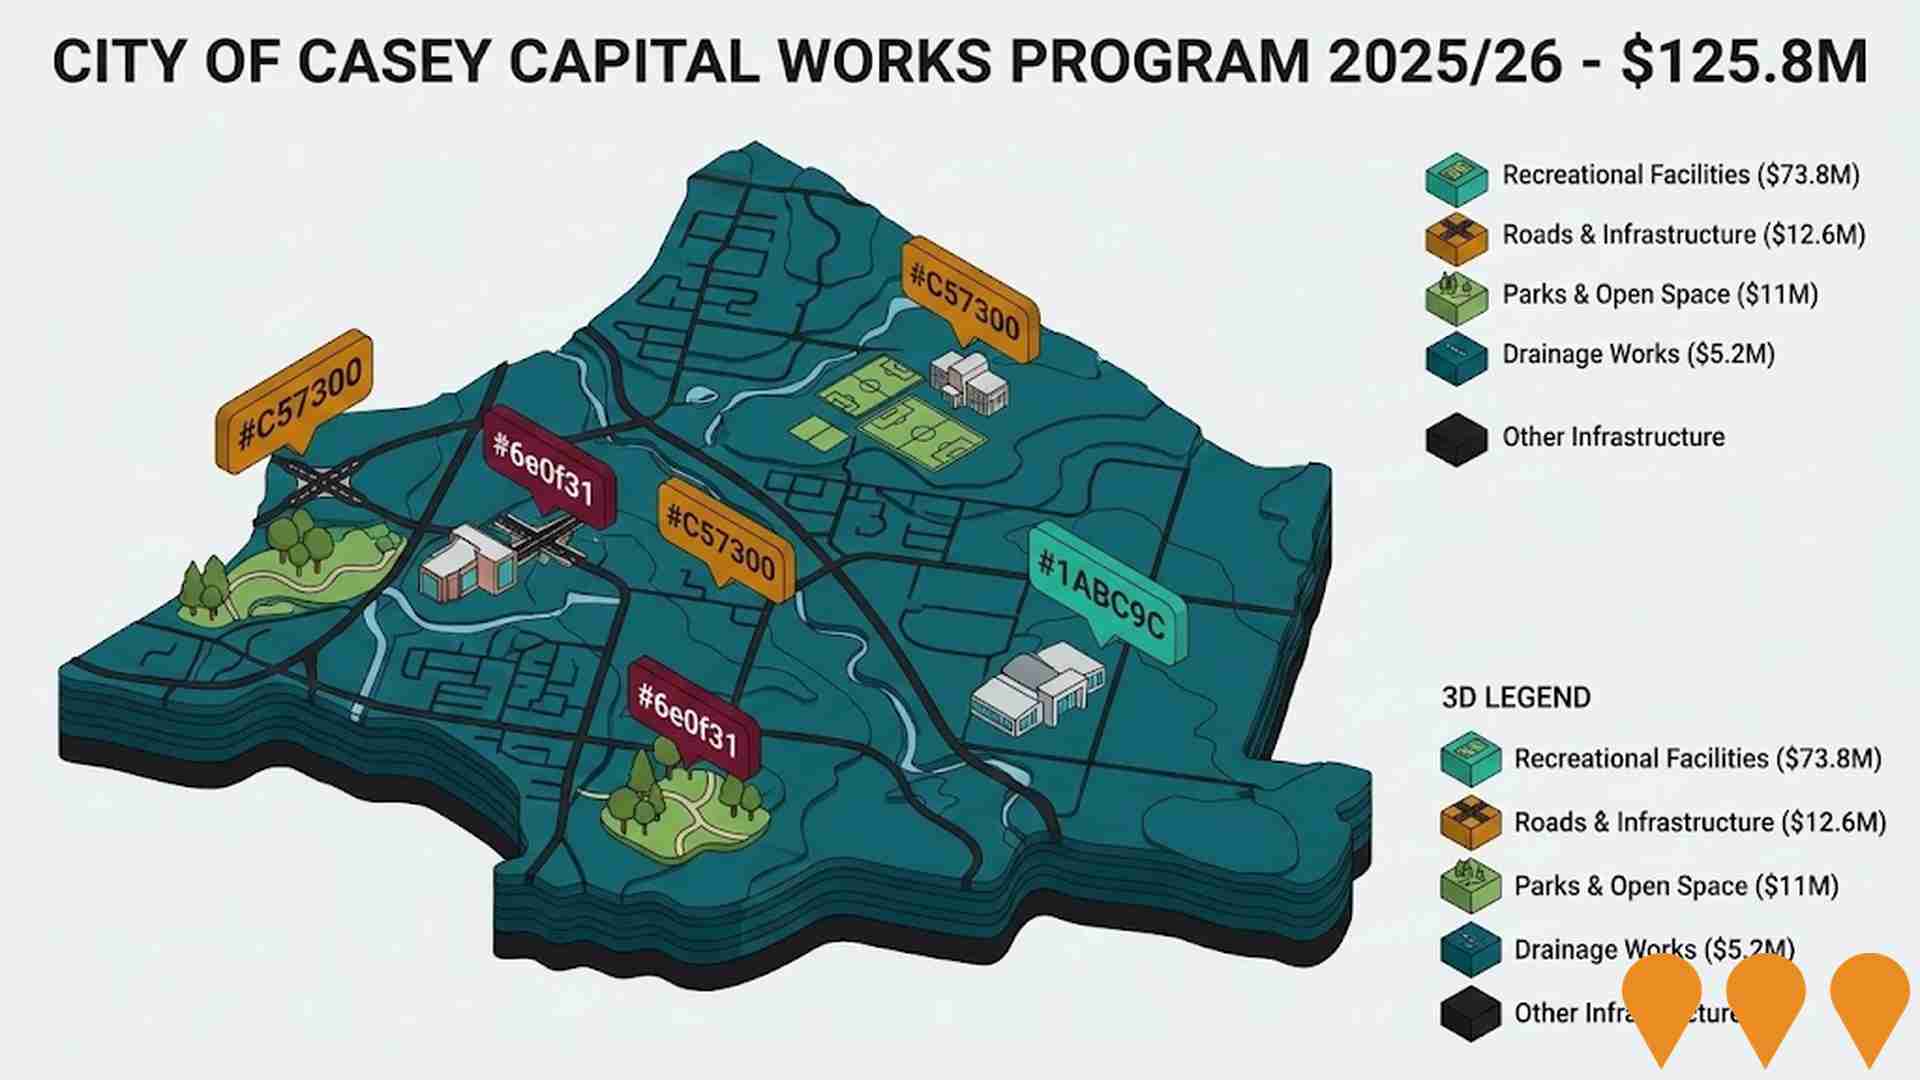
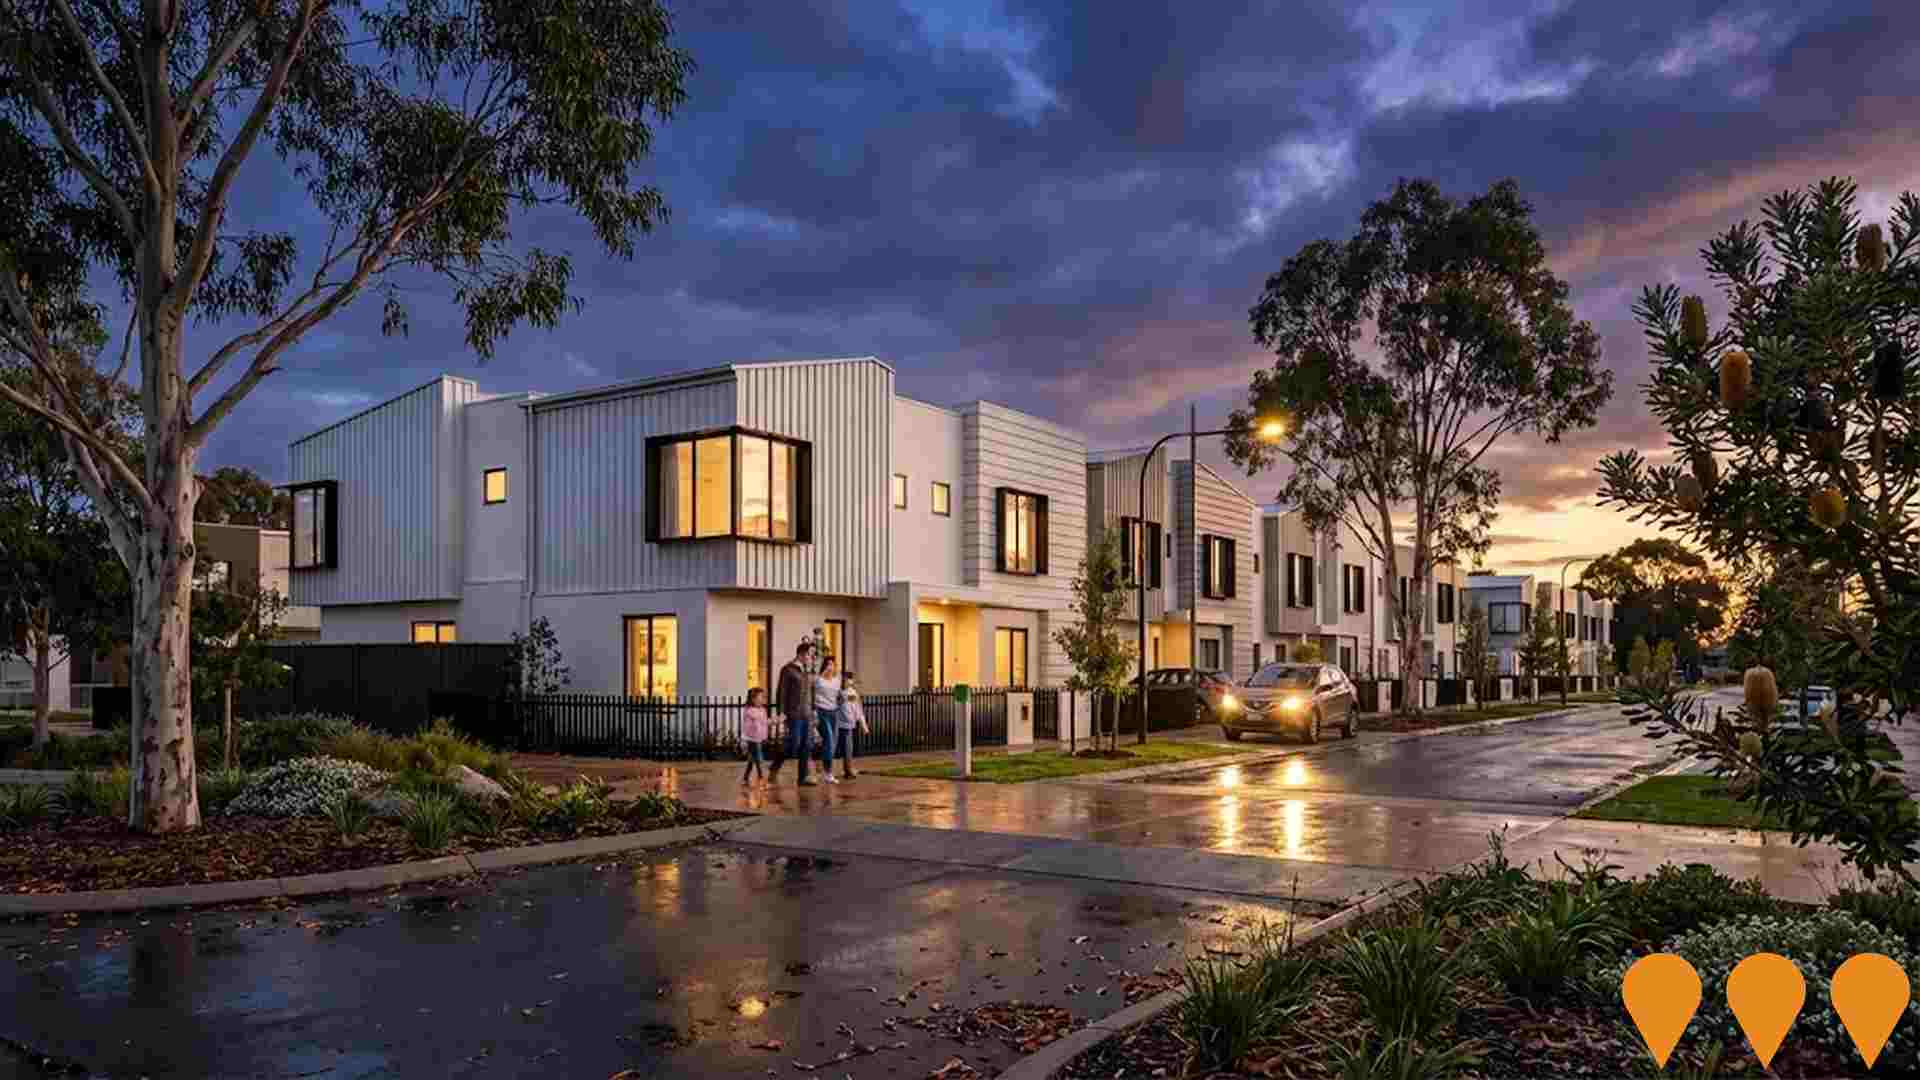
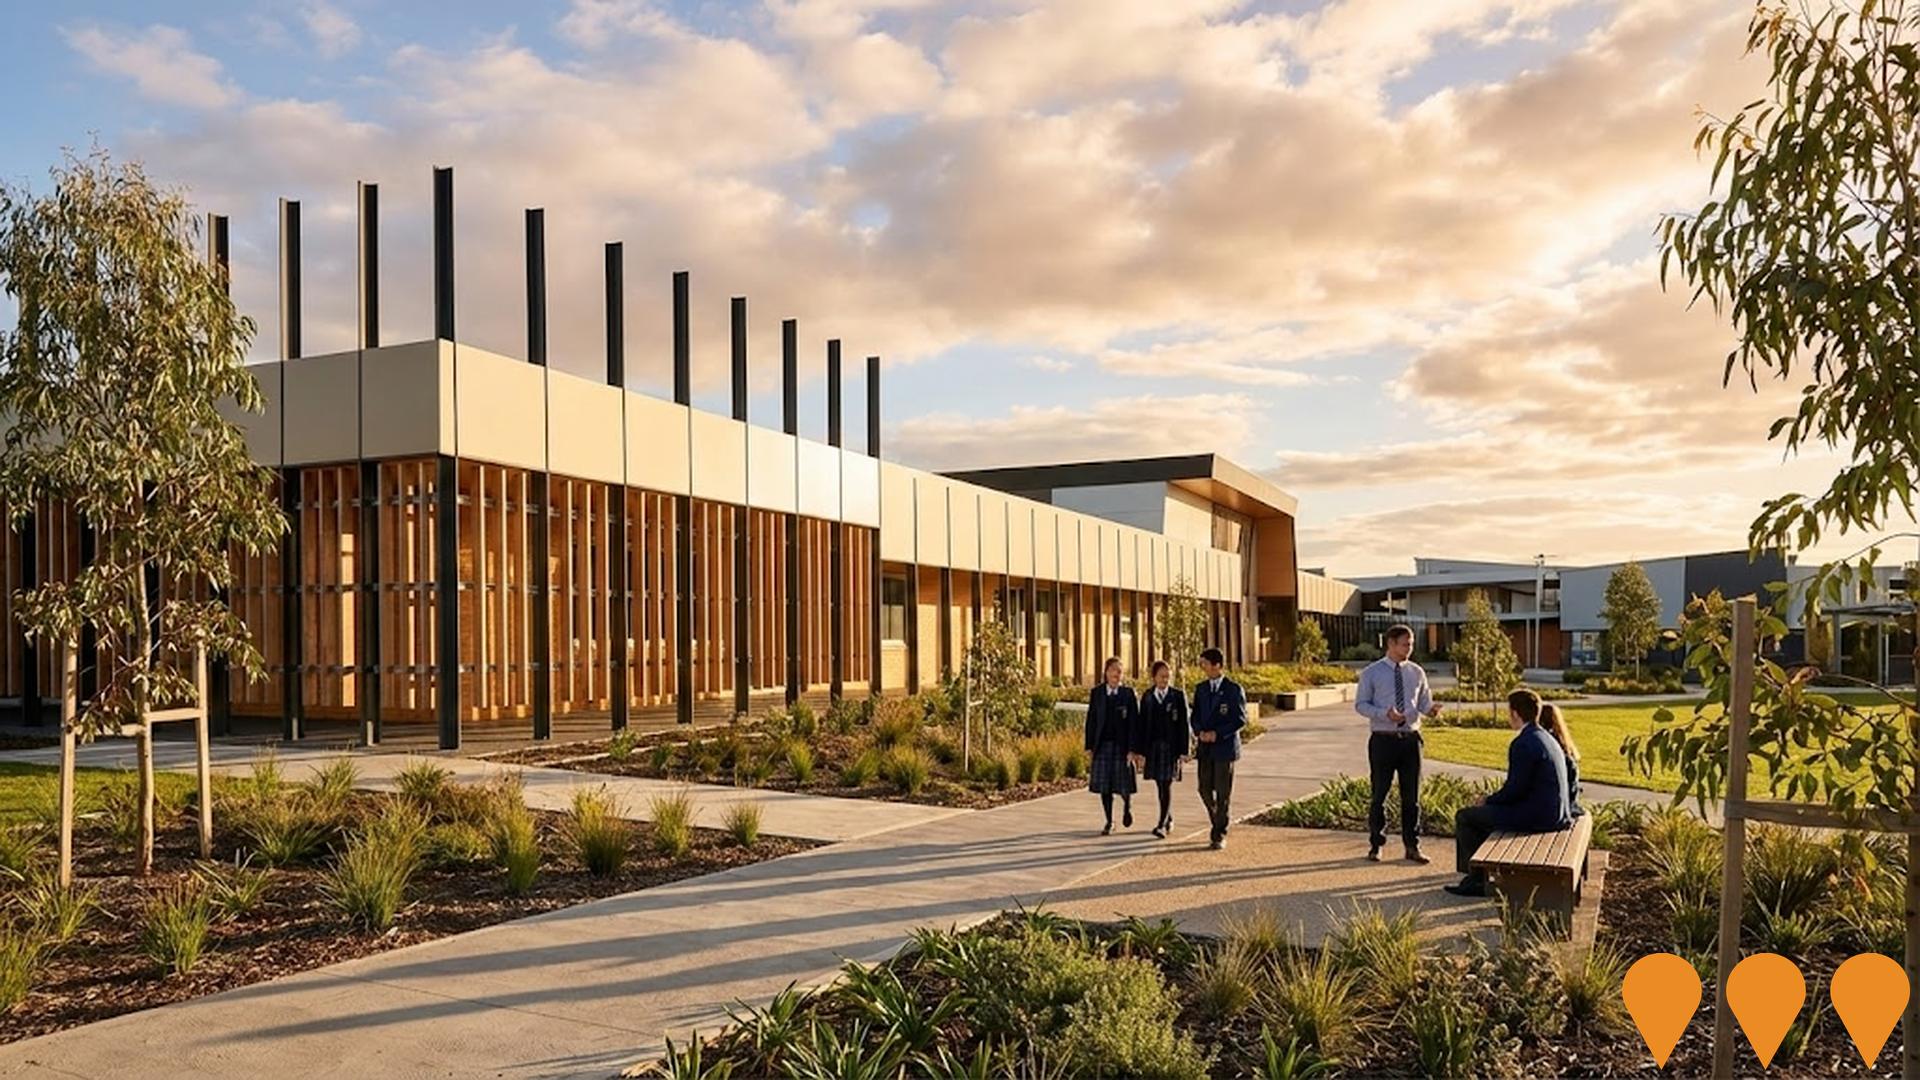
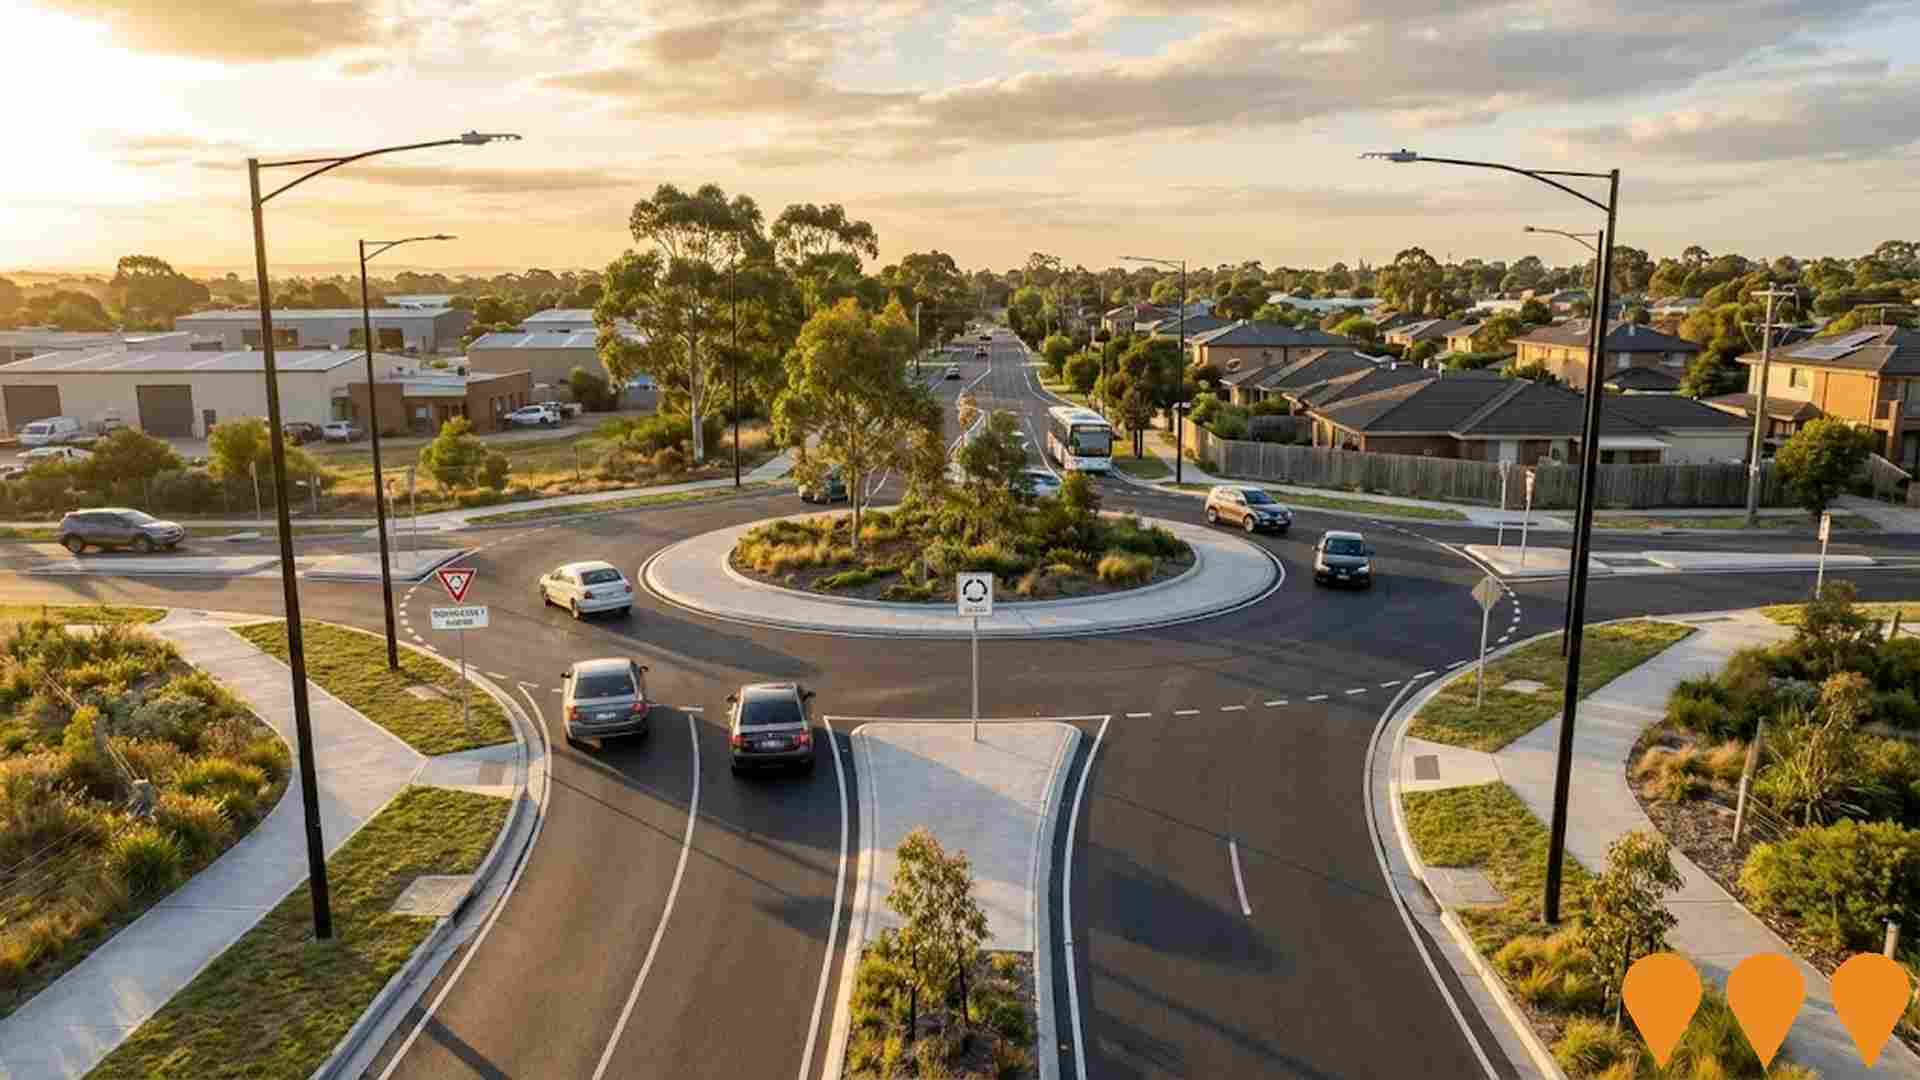
 Denotes AI-based impression for illustrative purposes only, not to be taken as definitive under any circumstances. Please follow links and conduct other investigations from the project's source for actual imagery. Developers and project owners wishing us to use original imagery please Contact Us and we will do so.
Frequently Asked Questions - Infrastructure
Berwick Health and Education Precinct
122-hectare master-planned precinct in Berwick delivering a major expansion of Monash Health's Casey Hospital (up to 700 beds), growth of Chisholm Institute and Federation University campuses, new private health and tertiary education facilities, plus approximately 1,030 new dwellings and commercial development centred around Berwick Station.

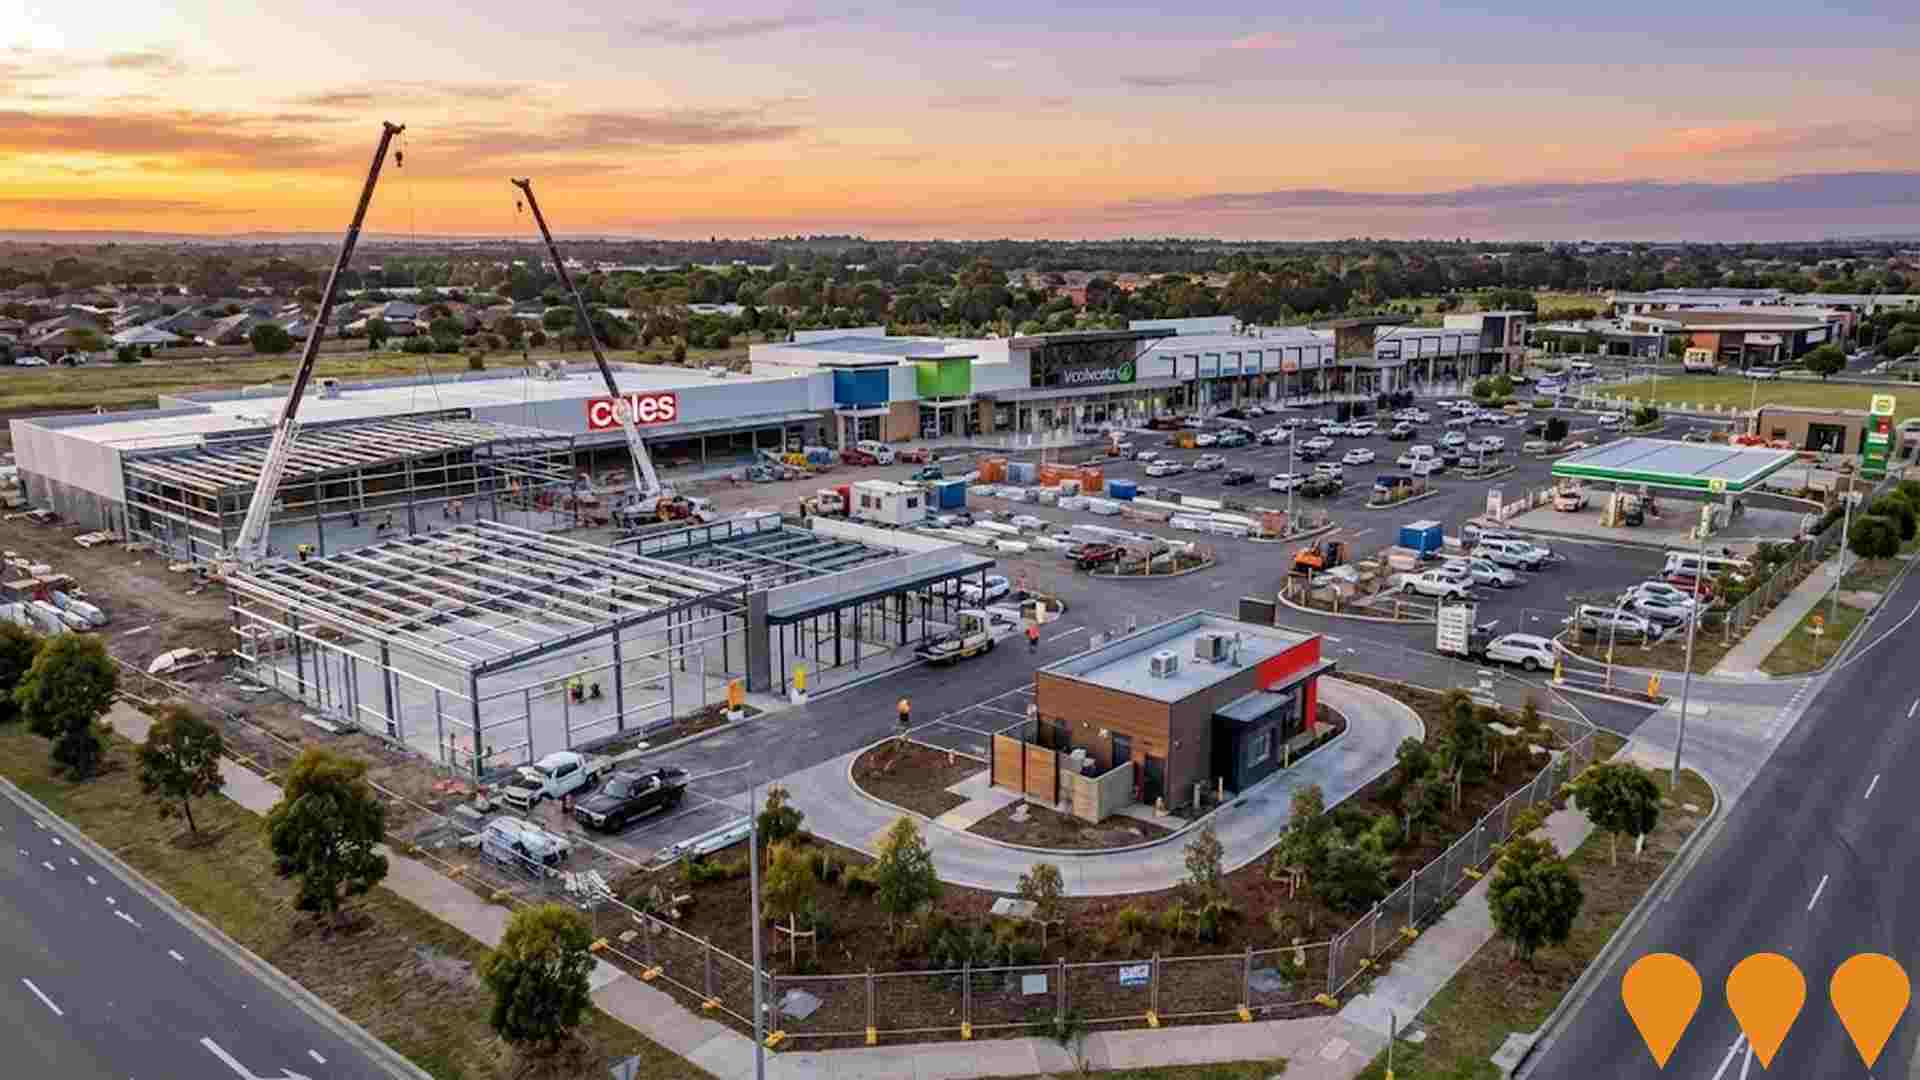
Hunt Club Village Shopping Centre Expansion
Expansion of Hunt Club Village neighbourhood activity centre with a new full-line Coles supermarket (3,500 m2), specialty retail, a drive-through convenience restaurant, service station and associated car parking on a 6,500 m2 vacant site. VCAT-approved in 2023, construction commenced mid-2025.
Hunt Club Estate
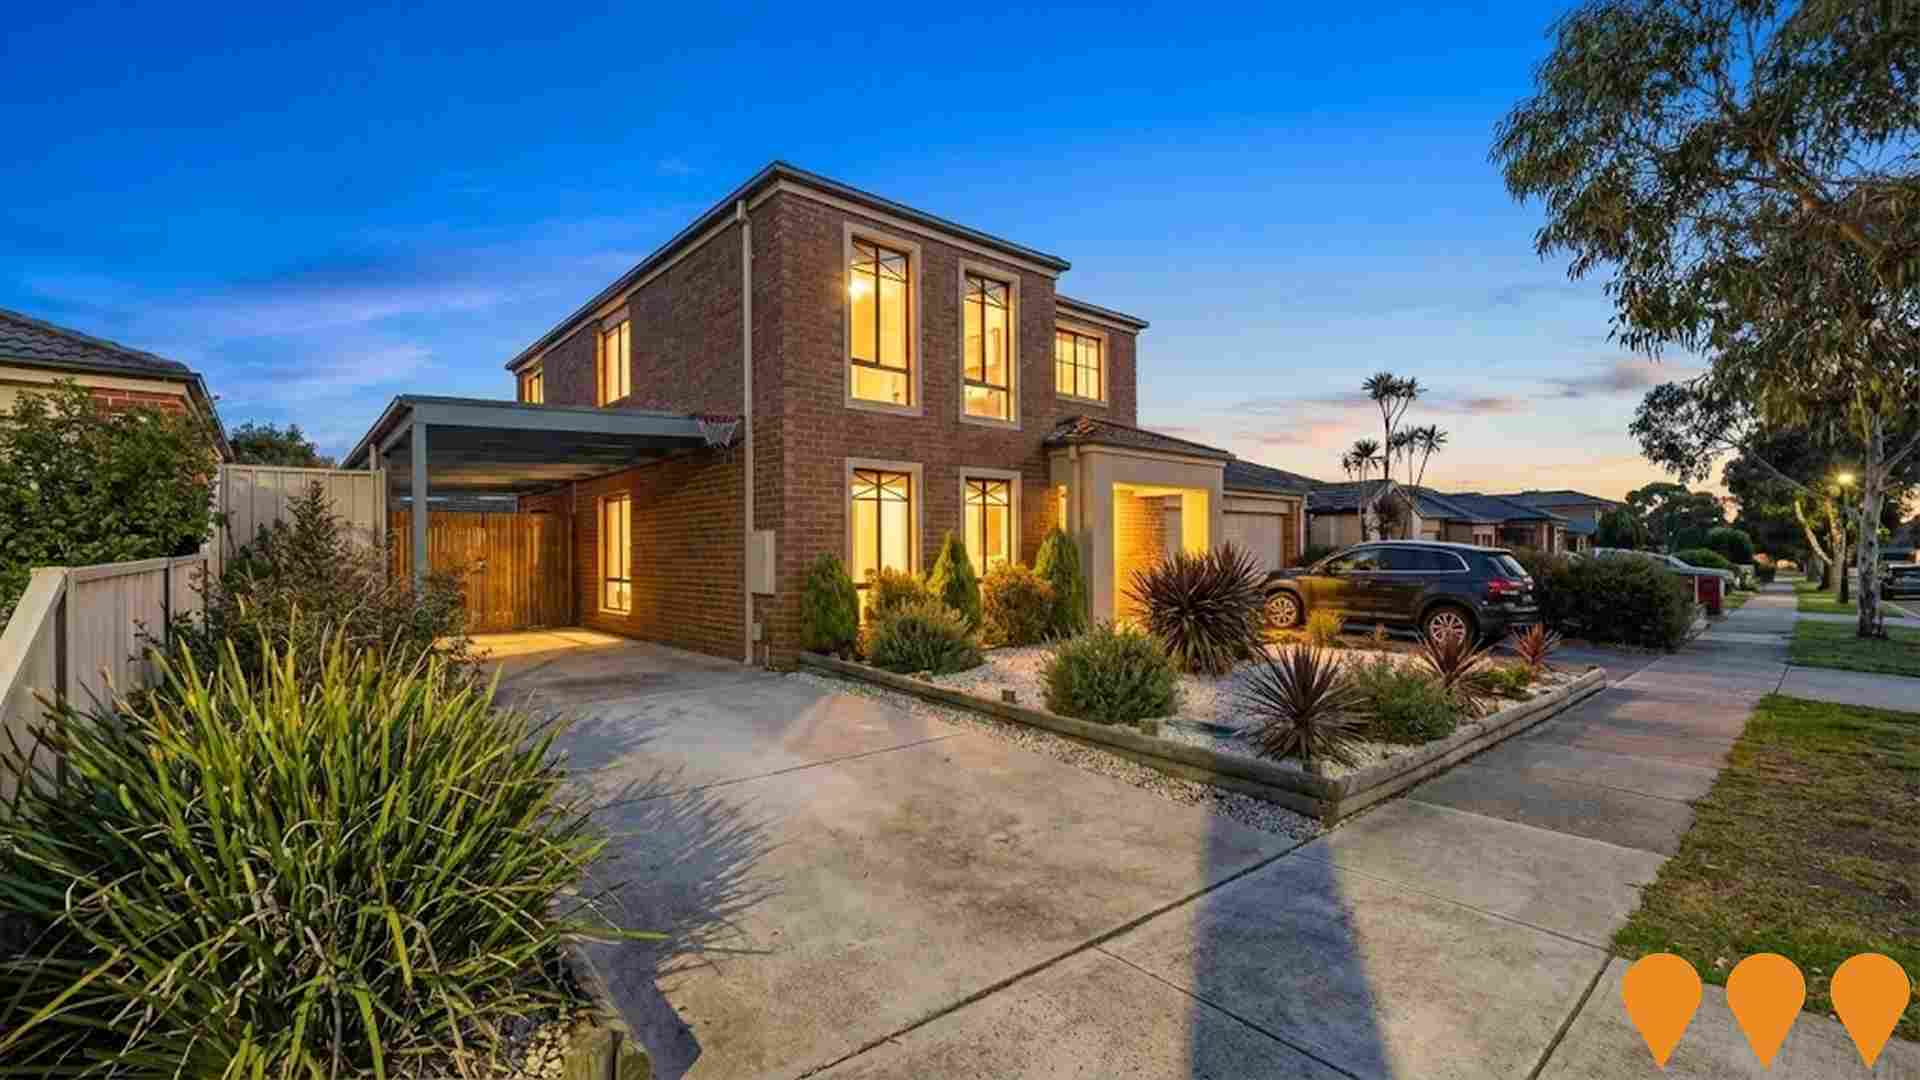
Master-planned community developed by Dennis Family Corporation, completed in 2015. Spans 211 hectares with 2,500 residential lots housing approximately 10,000 people. Includes Hunt Club Village Shopping Centre, primary and secondary schools, community facilities, wetlands, and a retirement village.
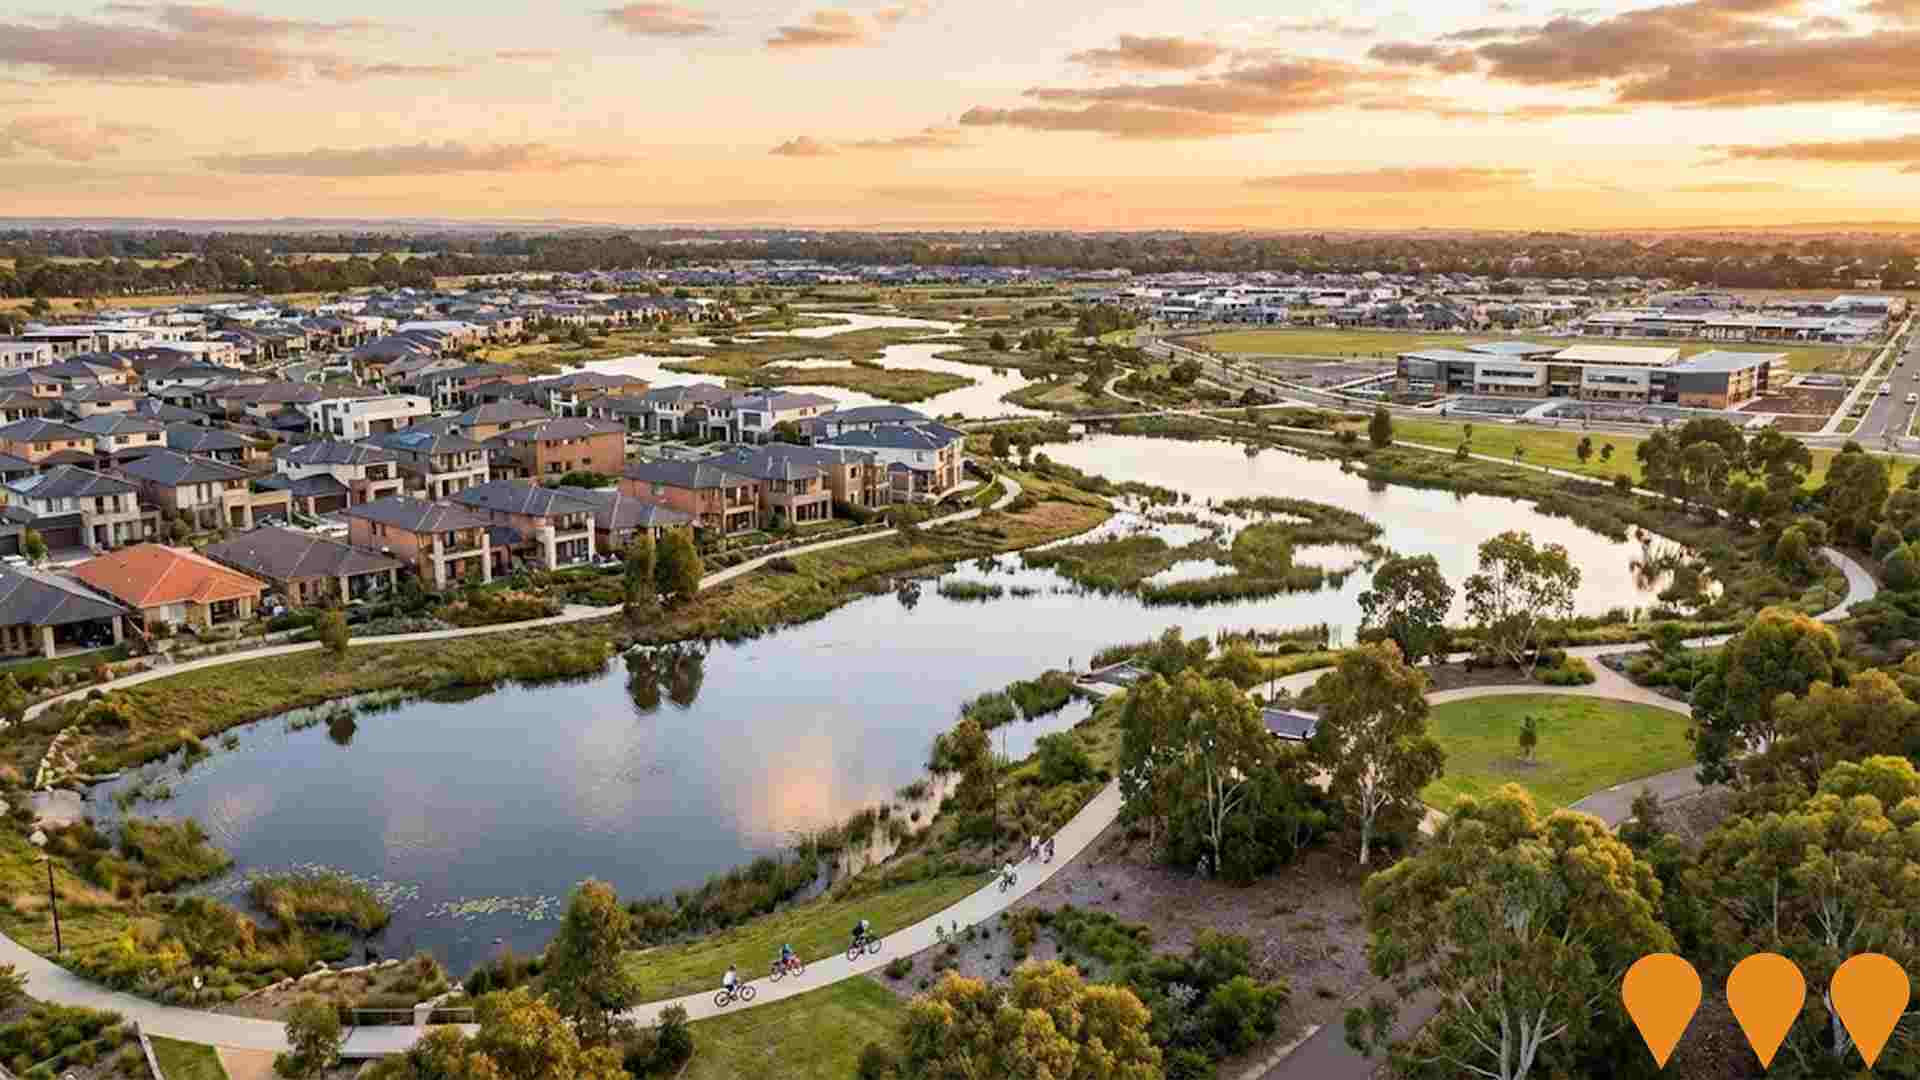
Berwick Waters
Berwick Waters is a forward-thinking master-planned community designed to nurture active and growing families. Surrounded by stunning natural landscapes and vast established wetlands, the development features waterfront homes, parks, playgrounds, schools, and a future town centre. With close to 4,000 residents already calling it home, the community offers resort-style streetscapes, extensive recreational facilities including 9km of walking and cycling paths, and is home to two new state schools opening in Term 1, 2025.
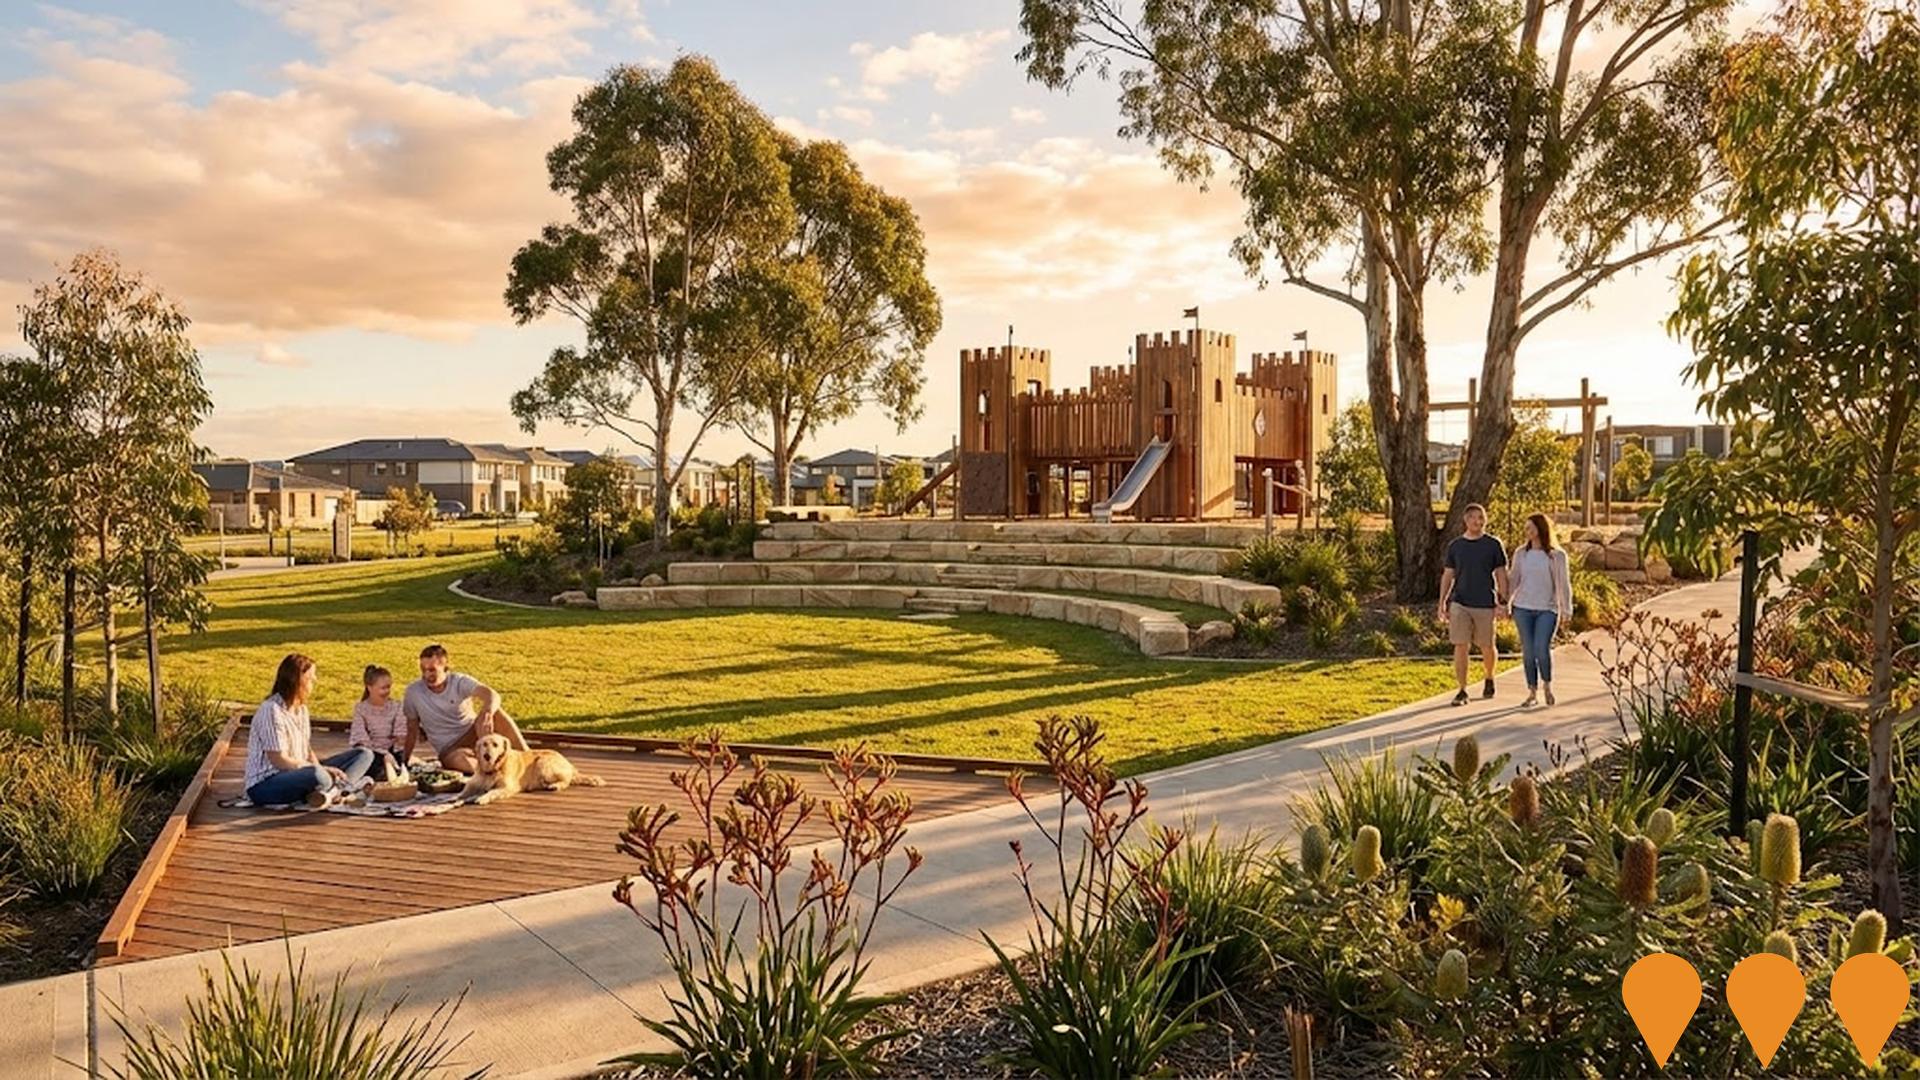
Minta
Large-scale masterplanned community by Stockland on the former Minta Farm site, covering approximately 114 hectares and planned to deliver 1,700 homes, a future town centre, schools, parks, and an employment hub that is envisioned to support around 11,000 local jobs. The estate features 22+ hectares of green open spaces and a lake-filled nature reserve, and is located in Berwick, 48km south-east of the Melbourne CBD.
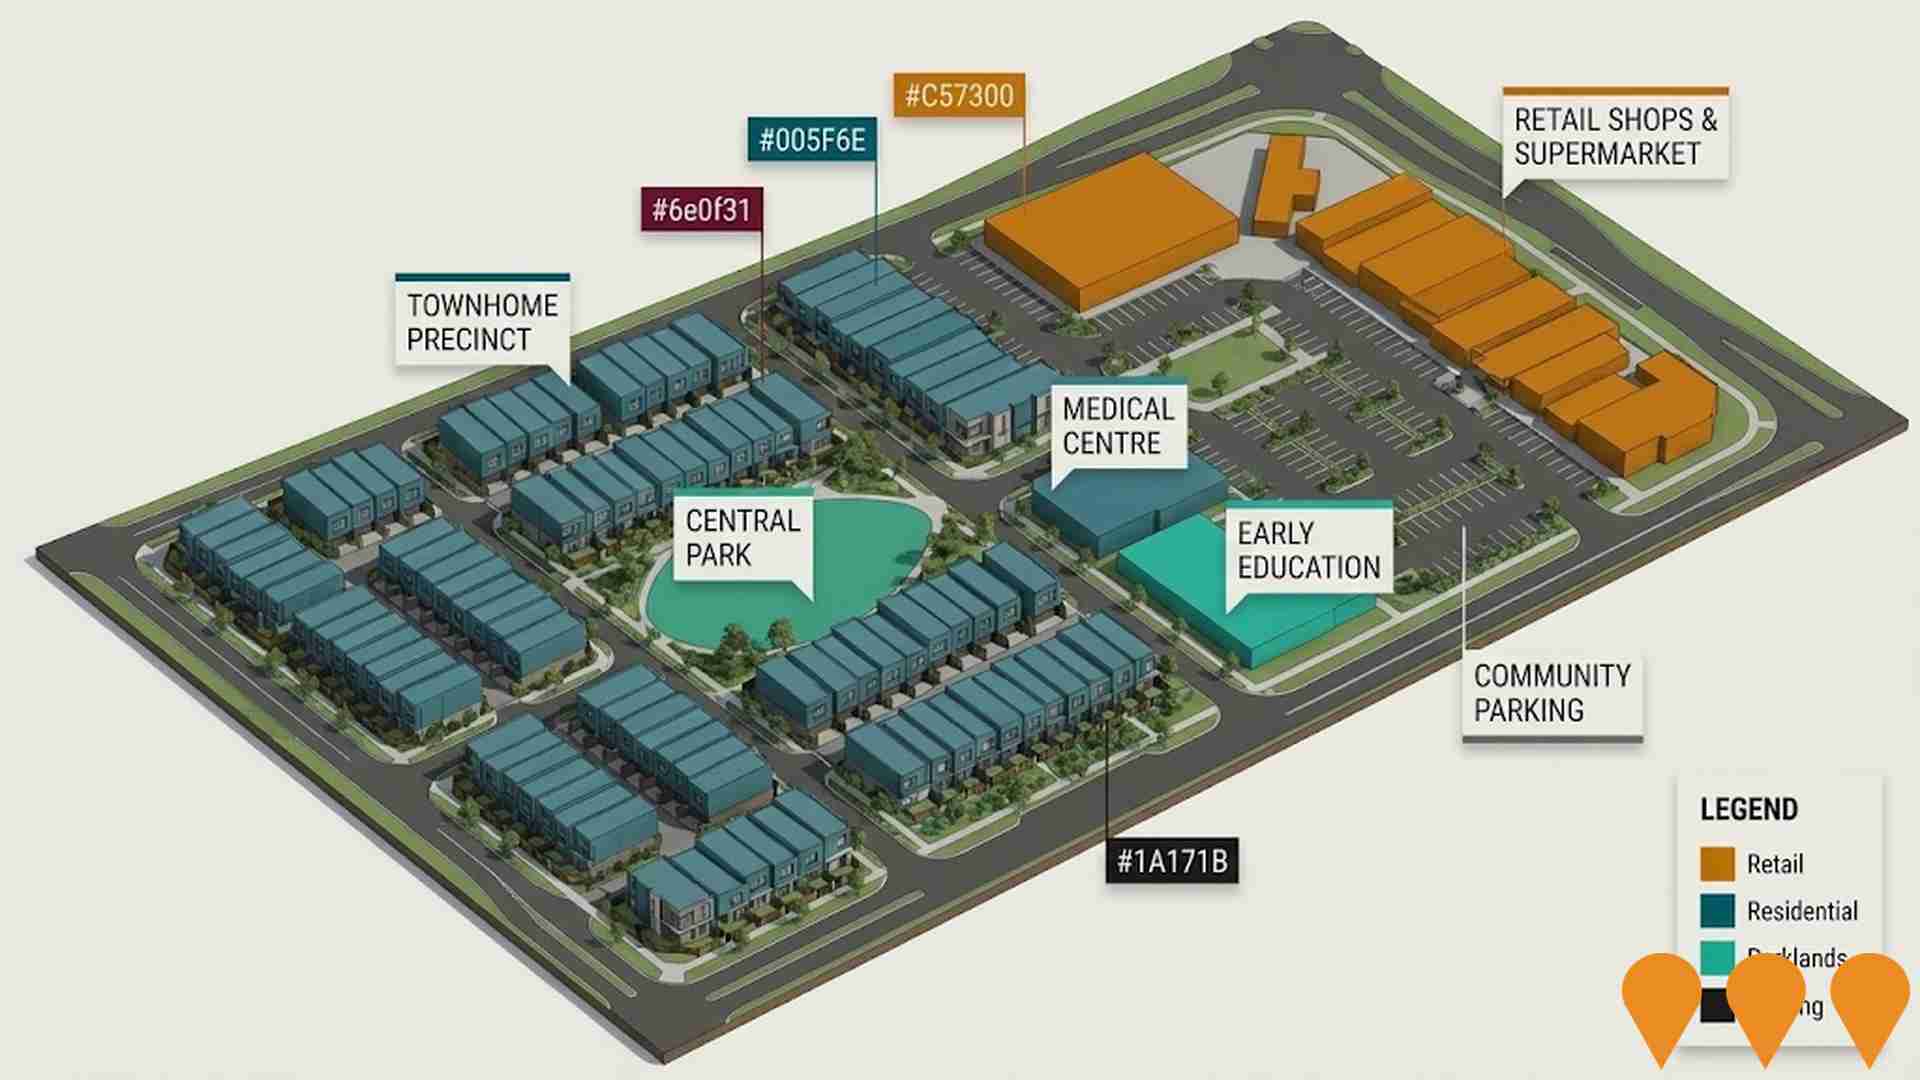
Alira Village
Alira Village is a completed neighbourhood shopping centre and townhome development in the heart of Berwick. The village comprises 17 retail shops spanning 4,825 square metres including a supermarket, medical centre, gym, early education centre, and townhomes. The project is part of the larger 70-hectare Alira masterplanned community featuring wetlands, parklands and walking trails.
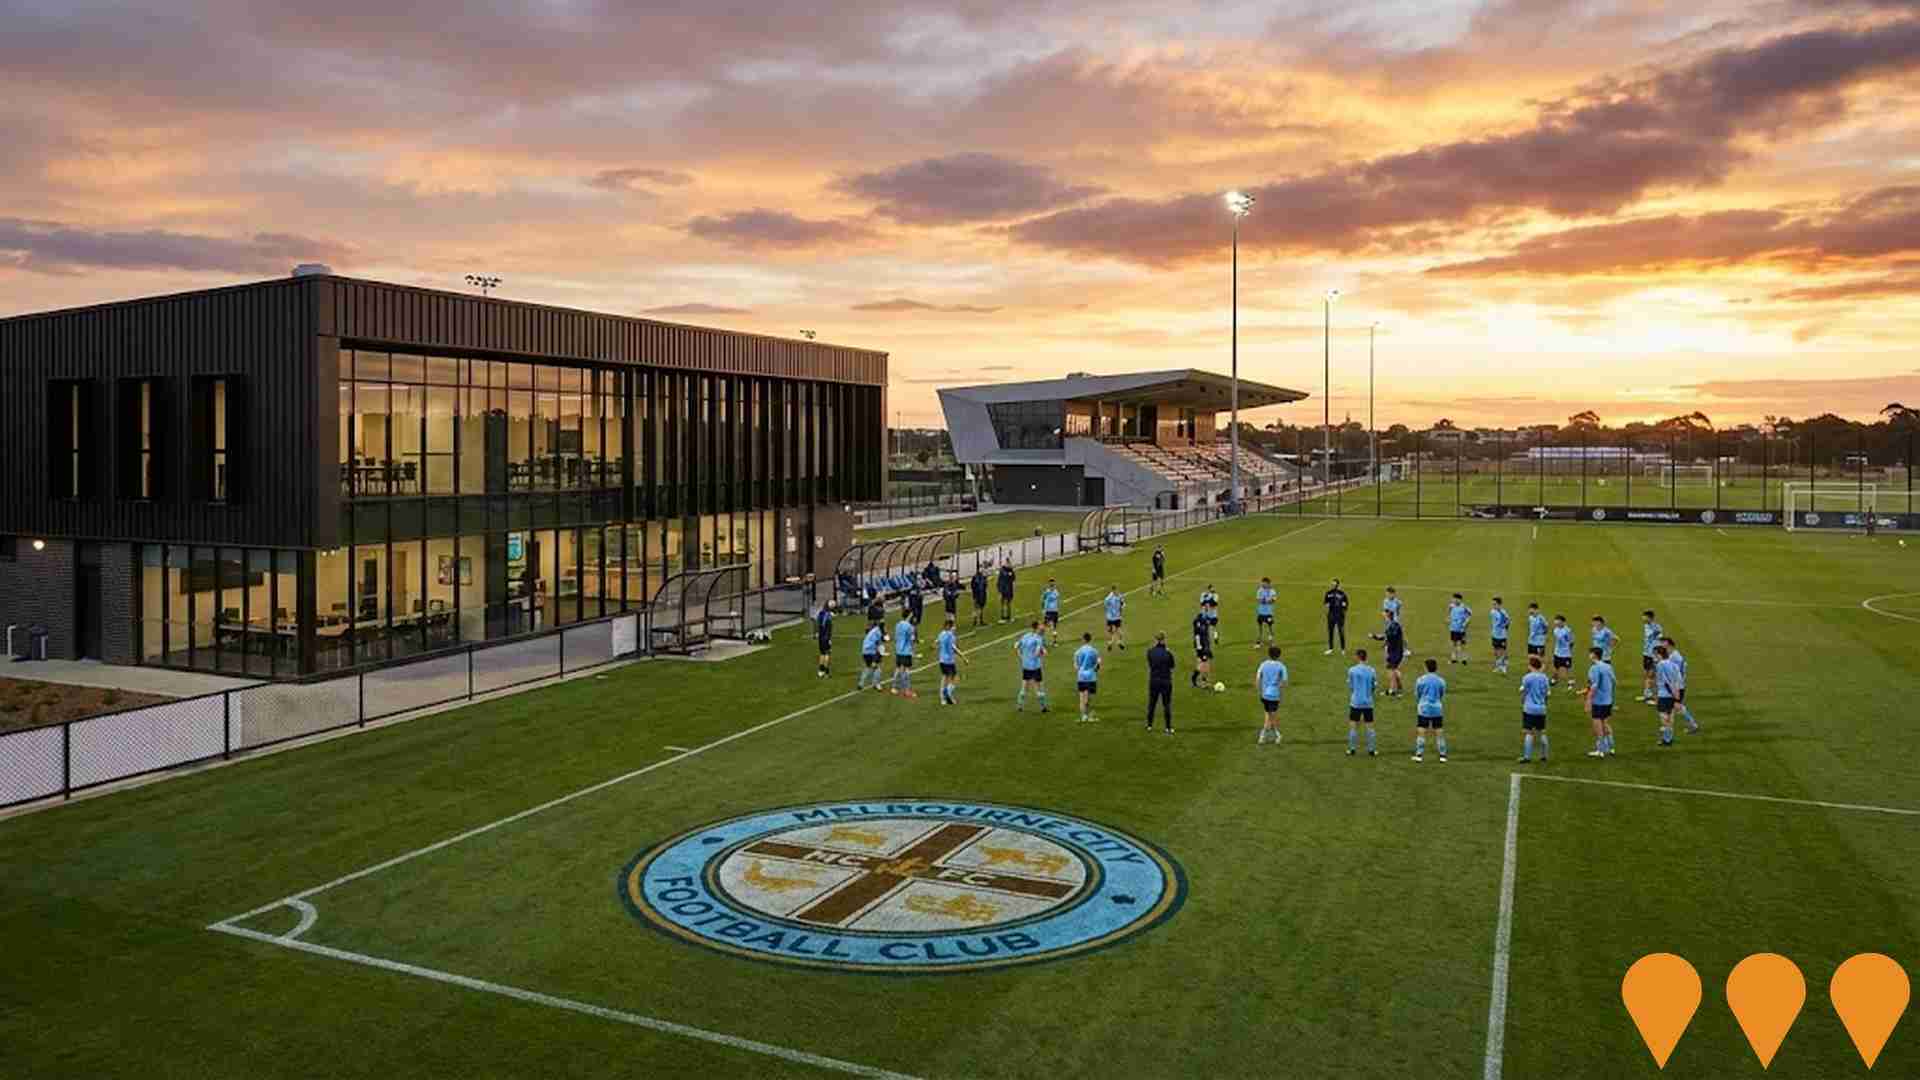
Casey Fields Sports and Recreation Complex with City Football Academy
Major regional sports complex spanning 76 hectares featuring 5 football/cricket ovals including VFL oval with 350-seat grandstand, regional athletics centre with 1,000-seat grandstand, 3 netball courts, cycling track, tennis courts, and BMX track. The complex is home to the state-of-the-art Etihad City Football Academy (opened April 2024) featuring 5 full-sized floodlit soccer pitches including hybrid turf pitch, two-story administration building, and facilities for Melbourne City FC's elite training. Future development includes a proposed 4,000-capacity Casey Mini Stadium with $10.68 million funding commitment subject to Federal Election outcome. Total complex value exceeds $30 million with recent academy addition valued at $18.7 million.
Narre Warren-Cranbourne Road Upgrade
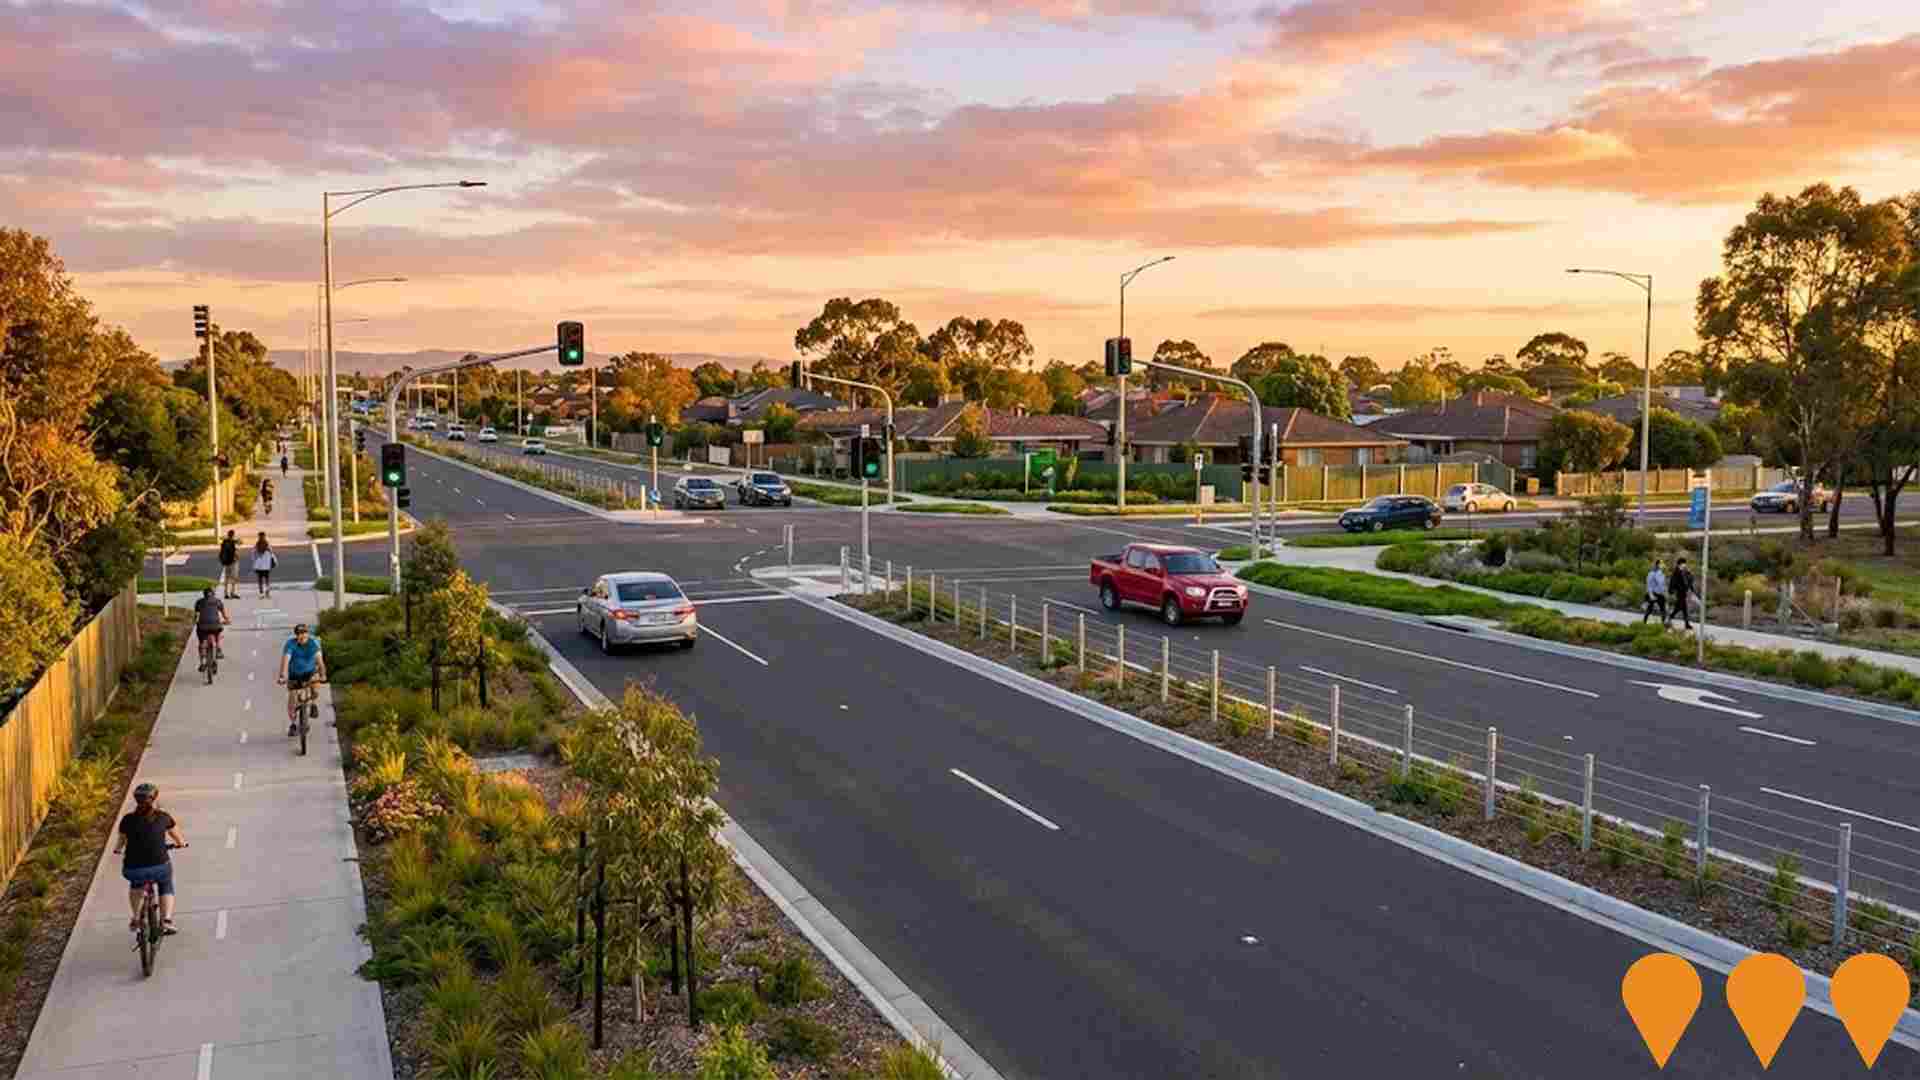
Completed major road upgrade duplicating a 4km section of Narre Warren-Cranbourne Road from two to four (and in parts six) lanes between Thompsons Road and South Gippsland Highway in Cranbourne. Includes 10 upgraded intersections with new traffic signals, removal of roundabouts, installation of road safety barriers, new signalised pedestrian crossings, and over 9km of new shared walking and cycling paths. Major works finished ahead of schedule in 2024 (August/October). Part of the broader $2.27 billion Suburban Roads Upgrade package for Melbourne's south-east.
Employment
Employment performance in Berwick - South West has been broadly consistent with national averages
Berwick - South West has a highly educated workforce with strong manufacturing and industrial sectors. Its unemployment rate was 4.9% in September 2025, compared to Greater Melbourne's 4.7%.
Employment growth over the past year was estimated at 4.7%. There were 7,276 residents employed as of September 2025, with a workforce participation rate of 71.9%, higher than Greater Melbourne's 64.1%. Key employment industries include health care & social assistance, retail trade, and construction. Manufacturing is notably concentrated, with employment levels at 1.3 times the regional average.
However, professional & technical services are under-represented, at 7.9% compared to Greater Melbourne's 10.1%. Employment opportunities locally may be limited as indicated by Census data. Between September 2024 and September 2025, employment increased by 4.7%, while labour force grew by 5.5%, causing unemployment to rise by 0.8 percentage points. In contrast, Greater Melbourne saw employment grow by 3.0% and labour force expand by 3.3%, with unemployment rising by 0.3 percentage points. State-wide in Victoria, employment grew by 1.13% year-on-year as of 25-November 2025, adding 41,950 jobs, with an unemployment rate of 4.7%. National employment forecasts from May-25 project a 6.6% increase over five years and 13.7% over ten years. Applying these projections to Berwick - South West's employment mix suggests local employment should increase by 6.5% over five years and 13.6% over ten years, though this is a simplified extrapolation for illustrative purposes.
Frequently Asked Questions - Employment
Income
The area exhibits notably strong income performance, ranking higher than 70% of areas assessed nationally through AreaSearch analysis
The median taxpayer income in Berwick - South West SA2 was $55,204 and the average was $80,552 according to postcode level ATO data aggregated by AreaSearch for the financial year 2022. This is high compared to Greater Melbourne's median income of $54,892 and average income of $73,761. Based on a 12.16% growth in wages since the financial year 2022, current estimates suggest a median income of approximately $61,917 and an average income of $90,347 as of September 2025. Census data indicates that incomes in Berwick - South West cluster around the 70th percentile nationally. The earnings profile shows that 42.8% of residents (5,564 people) fall within the $1,500 - 2,999 income bracket, reflecting regional patterns where 32.8% also occupy this range. Housing costs consume 16.8% of income in the area. Despite this, strong earnings place disposable income at the 75th percentile nationally. The area's SEIFA income ranking places it in the 7th decile.
Frequently Asked Questions - Income
Housing
Berwick - South West is characterized by a predominantly suburban housing profile, with a higher proportion of rental properties than the broader region
The dwelling structure in Berwick - South West, as per the latest Census, consisted of 94.8% houses and 5.2% other dwellings such as semi-detached homes, apartments, and 'other' dwellings. This is compared to Melbourne metro's composition of 88.1% houses and 11.8% other dwellings. Home ownership in Berwick - South West stood at 16.2%, with the remaining dwellings either mortgaged (51.7%) or rented (32.0%). The median monthly mortgage repayment in the area was $2,000, surpassing Melbourne metro's average of $1,900. Meanwhile, the median weekly rent figure was recorded at $400, compared to Melbourne metro's $370. Nationally, Berwick - South West's median monthly mortgage repayments exceeded the Australian average of $1,863, while rents were higher than the national figure of $375.
Frequently Asked Questions - Housing
Household Composition
Berwick - South West features high concentrations of family households, with a higher-than-average median household size
Family households comprise 85.1% of all households, including 53.5% couples with children, 18.8% couples without children, and 11.9% single parent families. Non-family households account for 14.9%, with lone person households at 12.4% and group households making up 2.4%. The median household size is 3.1 people, larger than the Greater Melbourne average of 2.9.
Frequently Asked Questions - Households
Local Schools & Education
Berwick - South West shows strong educational performance, ranking in the upper quartile nationally when assessed across multiple qualification and achievement indicators
The area's educational profile is notable regionally, with university qualification rates of 32.4% among residents aged 15+, surpassing the SA3 area average of 25.7%. This reflects the community's emphasis on higher education. Bachelor degrees are most prevalent at 20.1%, followed by postgraduate qualifications (9.6%) and graduate diplomas (2.7%).
Trade and technical skills are prominent, with 33.1% of residents aged 15+ holding vocational credentials – advanced diplomas (12.5%) and certificates (20.6%). Educational participation is high, with 35.2% of residents currently enrolled in formal education. This includes 12.9% in primary education, 9.1% in secondary education, and 5.4% pursuing tertiary education.
Frequently Asked Questions - Education
Schools Detail
Nearby Services & Amenities
Transport
Transport servicing is moderate compared to other areas nationally based on assessment of service frequency, route connectivity and accessibility
The analysis of public transportation in Berwick - South West shows that there are currently 27 operational transport stops. These stops offer a variety of bus routes, with a total of 8 different routes serving the area. The combined weekly passenger trips across all these routes amount to 1,965.
The accessibility of transport in this region is considered good, with residents generally residing around 329 meters away from their nearest transport stop. On average, there are approximately 280 trips per day across all routes, which translates to about 72 weekly trips per individual stop.
Frequently Asked Questions - Transport
Transport Stops Detail
Health
Berwick - South West's residents boast exceedingly positive health performance metrics with younger cohorts in particular seeing very low prevalence of common health conditions
Health outcomes data shows excellent results across Berwick-South West, with younger cohorts particularly experiencing low prevalence of common health conditions. Approximately 60% (7,774 people) have private health cover, higher than Greater Melbourne's 53.6%.
Common medical conditions include asthma and mental health issues, affecting 8.0 and 7.0% respectively. 75.8% declare no medical ailments, compared to 72.0% in Greater Melbourne. The area has 8.4% (1,098 people) aged 65 and over, lower than Greater Melbourne's 15.7%. Health outcomes among seniors require more attention than the broader population.
Frequently Asked Questions - Health
Cultural Diversity
Berwick - South West is among the most culturally diverse areas in the country based on AreaSearch assessment of a range of language and cultural background related metrics
Berwick-South West's cultural diversity is notable, with 42.3% of its residents born overseas and 42.4% speaking a language other than English at home. Christianity is the predominant religion in Berwick-South West, accounting for 39.5% of people. However, Buddhism stands out with 7.0%, compared to Greater Melbourne's 5.0%.
The top three ancestry groups are Other (20.5%), Australian (18.5%), and English (18.3%). Some ethnic groups have significant representation differences: Sri Lankan at 3.3% vs regional 2.3%, Indian at 8.7% vs 5.0%, and Hungarian at 0.5% vs 0.7%.
Frequently Asked Questions - Diversity
Age
Berwick - South West hosts a young demographic, positioning it in the bottom quartile nationwide
Berwick-South West's median age is 34 years, which is lower than Greater Melbourne's average of 37 and Australia's average of 38 years. Compared to Greater Melbourne, Berwick-South West has a higher proportion of residents aged 5-14 (16.6%) but fewer residents aged 25-34 (13.0%). Between the 2021 Census and the present day, the proportion of residents aged 55-64 has increased from 8.4% to 9.2%, while the proportion of residents aged 35-44 has decreased from 18.9% to 18.1%. By 2041, population forecasts indicate significant demographic changes in Berwick-South West, with the strongest projected growth occurring in the 45-54 age cohort, which is expected to grow by 57%, adding 1,055 residents to reach a total of 2,903.
